Whitmore Village, HI Map & Demographics
Whitmore Village Map
Whitmore Village Overview
$35,181
PER CAPITA INCOME
$102,708
AVG FAMILY INCOME
$96,136
AVG HOUSEHOLD INCOME
3.9%
WAGE / INCOME GAP [ % ]
96.1¢/ $1
WAGE / INCOME GAP [ $ ]
0.46
INEQUALITY / GINI INDEX
3,909
TOTAL POPULATION
2,161
MALE POPULATION
1,748
FEMALE POPULATION
123.63
MALES / 100 FEMALES
80.89
FEMALES / 100 MALES
42.1
MEDIAN AGE
4.5
AVG FAMILY SIZE
4.1
AVG HOUSEHOLD SIZE
1,771
LABOR FORCE [ PEOPLE ]
57.0%
PERCENT IN LABOR FORCE
3.5%
UNEMPLOYMENT RATE
Income in Whitmore Village
Income Overview in Whitmore Village
Per Capita Income in Whitmore Village is $35,181, while median incomes of families and households are $102,708 and $96,136 respectively.
| Characteristic | Number | Measure |
| Per Capita Income | 3,909 | $35,181 |
| Median Family Income | 742 | $102,708 |
| Mean Family Income | 742 | $134,241 |
| Median Household Income | 952 | $96,136 |
| Mean Household Income | 952 | $129,402 |
| Income Deficit | 742 | $0 |
| Wage / Income Gap (%) | 3,909 | 3.95% |
| Wage / Income Gap ($) | 3,909 | 96.05¢ per $1 |
| Gini / Inequality Index | 3,909 | 0.46 |
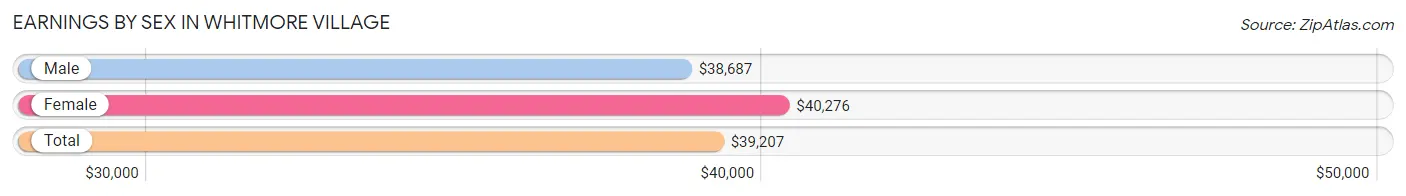
Earnings by Sex in Whitmore Village
Average Earnings in Whitmore Village are $39,207, $38,687 for men and $40,276 for women, a difference of 4.0%.
| Sex | Number | Average Earnings |
| Male | 975 (55.4%) | $38,687 |
| Female | 785 (44.6%) | $40,276 |
| Total | 1,760 (100.0%) | $39,207 |
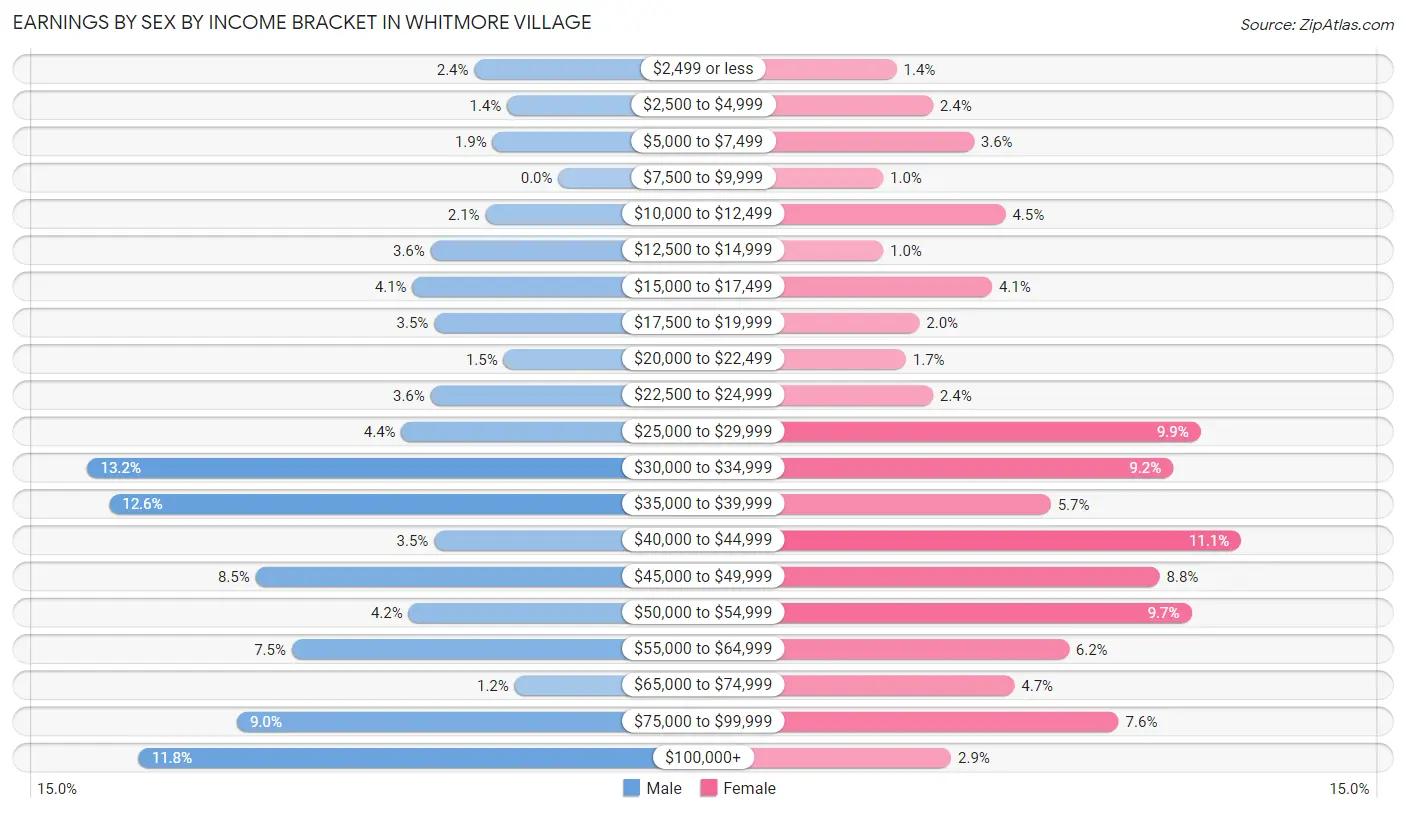
Earnings by Sex by Income Bracket in Whitmore Village
The most common earnings brackets in Whitmore Village are $30,000 to $34,999 for men (129 | 13.2%) and $40,000 to $44,999 for women (87 | 11.1%).
| Income | Male | Female |
| $2,499 or less | 23 (2.4%) | 11 (1.4%) |
| $2,500 to $4,999 | 14 (1.4%) | 19 (2.4%) |
| $5,000 to $7,499 | 18 (1.8%) | 28 (3.6%) |
| $7,500 to $9,999 | 0 (0.0%) | 8 (1.0%) |
| $10,000 to $12,499 | 20 (2.1%) | 35 (4.5%) |
| $12,500 to $14,999 | 35 (3.6%) | 8 (1.0%) |
| $15,000 to $17,499 | 40 (4.1%) | 32 (4.1%) |
| $17,500 to $19,999 | 34 (3.5%) | 16 (2.0%) |
| $20,000 to $22,499 | 15 (1.5%) | 13 (1.7%) |
| $22,500 to $24,999 | 35 (3.6%) | 19 (2.4%) |
| $25,000 to $29,999 | 43 (4.4%) | 78 (9.9%) |
| $30,000 to $34,999 | 129 (13.2%) | 72 (9.2%) |
| $35,000 to $39,999 | 123 (12.6%) | 45 (5.7%) |
| $40,000 to $44,999 | 34 (3.5%) | 87 (11.1%) |
| $45,000 to $49,999 | 83 (8.5%) | 69 (8.8%) |
| $50,000 to $54,999 | 41 (4.2%) | 76 (9.7%) |
| $55,000 to $64,999 | 73 (7.5%) | 49 (6.2%) |
| $65,000 to $74,999 | 12 (1.2%) | 37 (4.7%) |
| $75,000 to $99,999 | 88 (9.0%) | 60 (7.6%) |
| $100,000+ | 115 (11.8%) | 23 (2.9%) |
| Total | 975 (100.0%) | 785 (100.0%) |
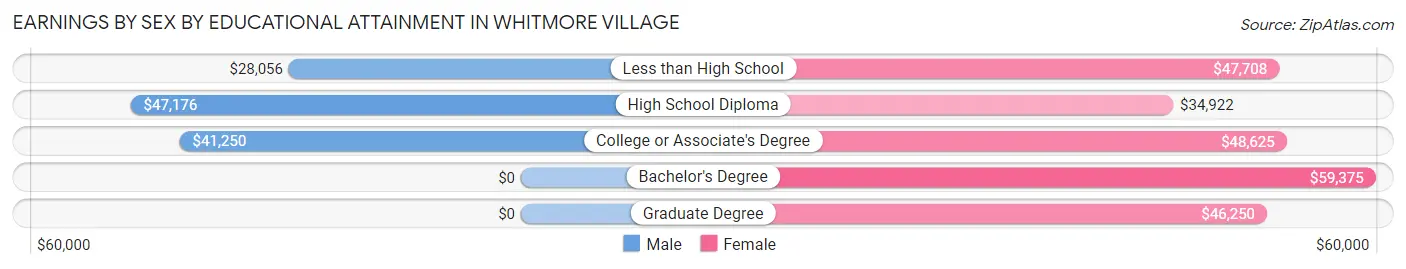
Earnings by Sex by Educational Attainment in Whitmore Village
Average earnings in Whitmore Village are $40,977 for men and $41,607 for women, a difference of 1.5%. Men with an educational attainment of high school diploma enjoy the highest average annual earnings of $47,176, while those with less than high school education earn the least with $28,056. Women with an educational attainment of bachelor's degree earn the most with the average annual earnings of $59,375, while those with high school diploma education have the smallest earnings of $34,922.
| Educational Attainment | Male Income | Female Income |
| Less than High School | $28,056 | $47,708 |
| High School Diploma | $47,176 | $34,922 |
| College or Associate's Degree | $41,250 | $48,625 |
| Bachelor's Degree | - | - |
| Graduate Degree | - | - |
| Total | $40,977 | $41,607 |
Family Income in Whitmore Village
Family Income Brackets in Whitmore Village
According to the Whitmore Village family income data, there are 158 families falling into the $100,000 to $149,999 income range, which is the most common income bracket and makes up 21.3% of all families.
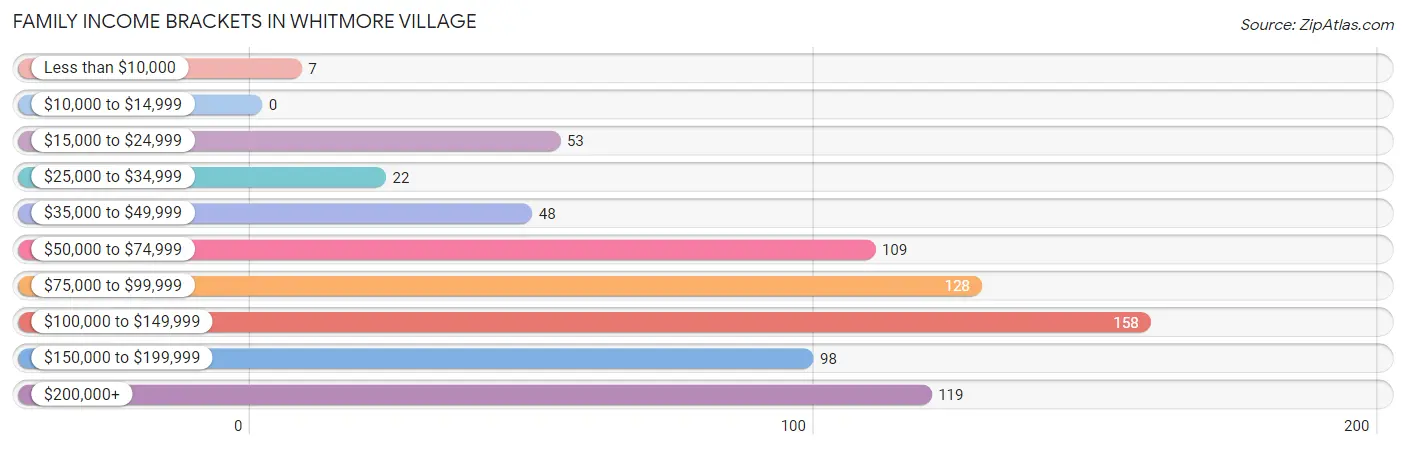
| Income Bracket | # Families | % Families |
| Less than $10,000 | 7 | 0.9% |
| $10,000 to $14,999 | 0 | 0.0% |
| $15,000 to $24,999 | 53 | 7.1% |
| $25,000 to $34,999 | 22 | 3.0% |
| $35,000 to $49,999 | 48 | 6.5% |
| $50,000 to $74,999 | 109 | 14.7% |
| $75,000 to $99,999 | 128 | 17.3% |
| $100,000 to $149,999 | 158 | 21.3% |
| $150,000 to $199,999 | 98 | 13.2% |
| $200,000+ | 119 | 16.0% |
Family Income by Famaliy Size in Whitmore Village
6-person families (55 | 7.4%) account for the highest median family income in Whitmore Village with $170,875 per family, while 2-person families (167 | 22.5%) have the highest median income of $34,922 per family member.
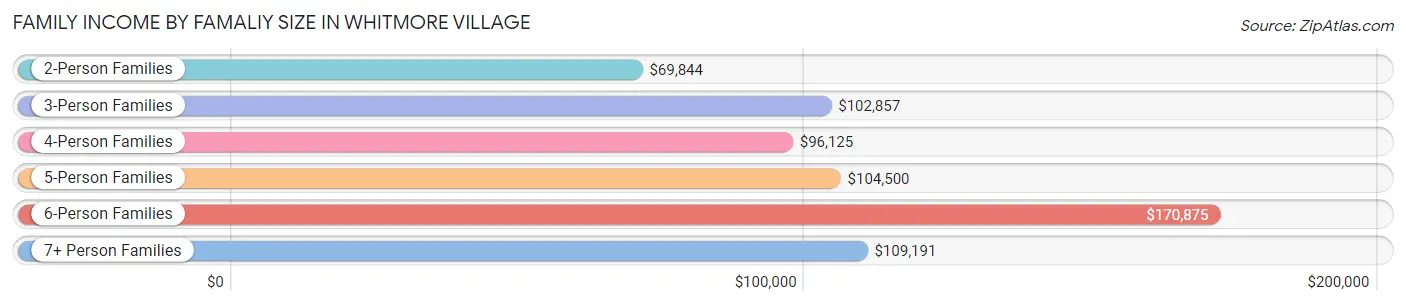
| Income Bracket | # Families | Median Income |
| 2-Person Families | 167 (22.5%) | $69,844 |
| 3-Person Families | 154 (20.7%) | $102,857 |
| 4-Person Families | 173 (23.3%) | $96,125 |
| 5-Person Families | 116 (15.6%) | $104,500 |
| 6-Person Families | 55 (7.4%) | $170,875 |
| 7+ Person Families | 77 (10.4%) | $109,191 |
| Total | 742 (100.0%) | $102,708 |
Family Income by Number of Earners in Whitmore Village
The median family income in Whitmore Village is $102,708, with families comprising 3+ earners (165) having the highest median family income of $171,339, while families with no earners (93) have the lowest median family income of $43,398, accounting for 22.2% and 12.5% of families, respectively.
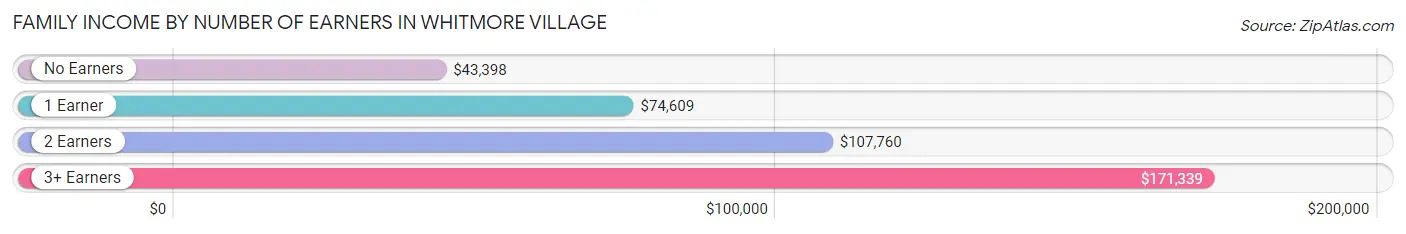
| Number of Earners | # Families | Median Income |
| No Earners | 93 (12.5%) | $43,398 |
| 1 Earner | 237 (31.9%) | $74,609 |
| 2 Earners | 247 (33.3%) | $107,760 |
| 3+ Earners | 165 (22.2%) | $171,339 |
| Total | 742 (100.0%) | $102,708 |
Household Income in Whitmore Village
Household Income Brackets in Whitmore Village
With 169 households falling in the category, the $75,000 to $99,999 income range is the most frequent in Whitmore Village, accounting for 17.7% of all households. In contrast, only 22 households (2.3%) fall into the $10,000 to $14,999 income bracket, making it the least populous group.
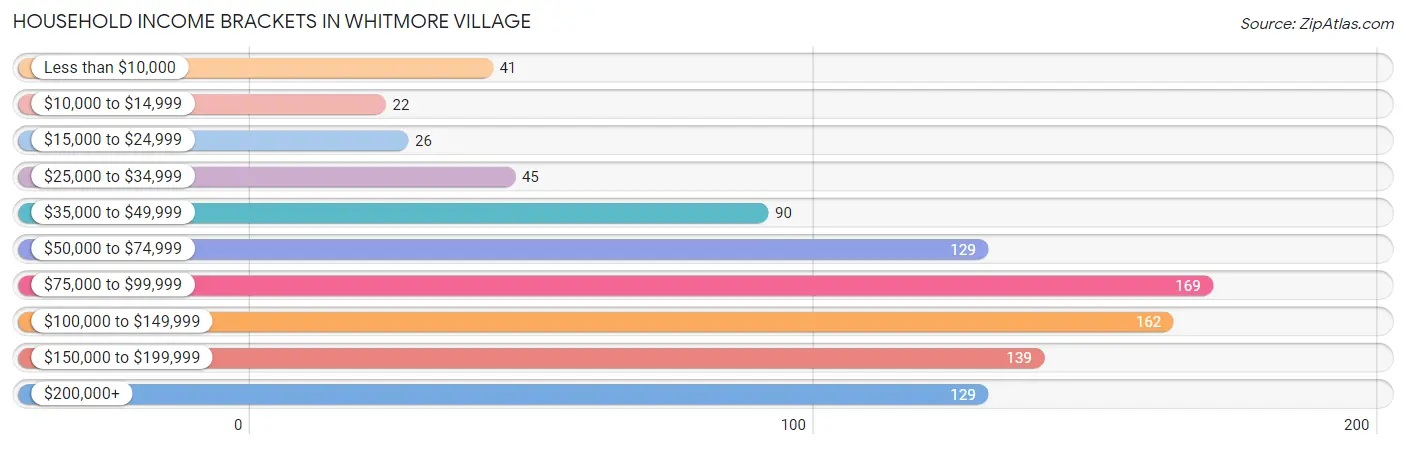
| Income Bracket | # Households | % Households |
| Less than $10,000 | 41 | 4.3% |
| $10,000 to $14,999 | 22 | 2.3% |
| $15,000 to $24,999 | 26 | 2.7% |
| $25,000 to $34,999 | 45 | 4.7% |
| $35,000 to $49,999 | 90 | 9.5% |
| $50,000 to $74,999 | 129 | 13.6% |
| $75,000 to $99,999 | 169 | 17.8% |
| $100,000 to $149,999 | 162 | 17.0% |
| $150,000 to $199,999 | 139 | 14.6% |
| $200,000+ | 129 | 13.6% |
Household Income by Householder Age in Whitmore Village
The median household income in Whitmore Village is $96,136, with the highest median household income of $105,250 found in the 65+ years age bracket for the primary householder. A total of 419 households (44.0%) fall into this category. Meanwhile, the 15 to 24 years age bracket for the primary householder has the lowest median household income of $0, with 8 households (0.8%) in this group.
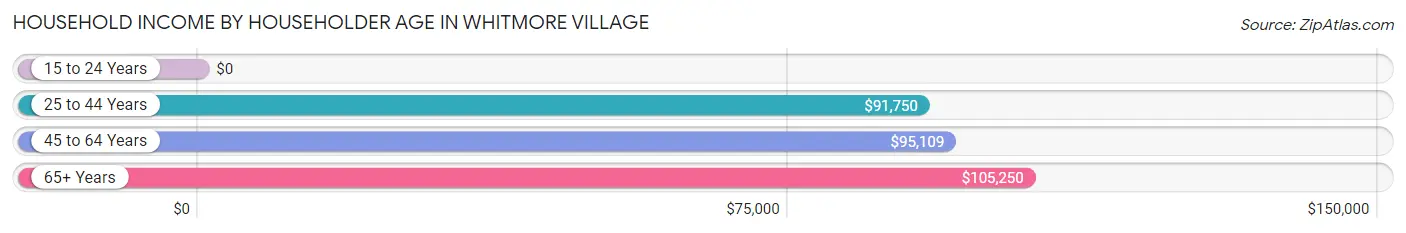
| Income Bracket | # Households | Median Income |
| 15 to 24 Years | 8 (0.8%) | $0 |
| 25 to 44 Years | 185 (19.4%) | $91,750 |
| 45 to 64 Years | 340 (35.7%) | $95,109 |
| 65+ Years | 419 (44.0%) | $105,250 |
| Total | 952 (100.0%) | $96,136 |
Poverty in Whitmore Village
Income Below Poverty by Sex and Age in Whitmore Village
With 9.4% poverty level for males and 9.3% for females among the residents of Whitmore Village, 16 and 17 year old males and under 5 year old females are the most vulnerable to poverty, with 22 males (51.2%) and 38 females (26.2%) in their respective age groups living below the poverty level.
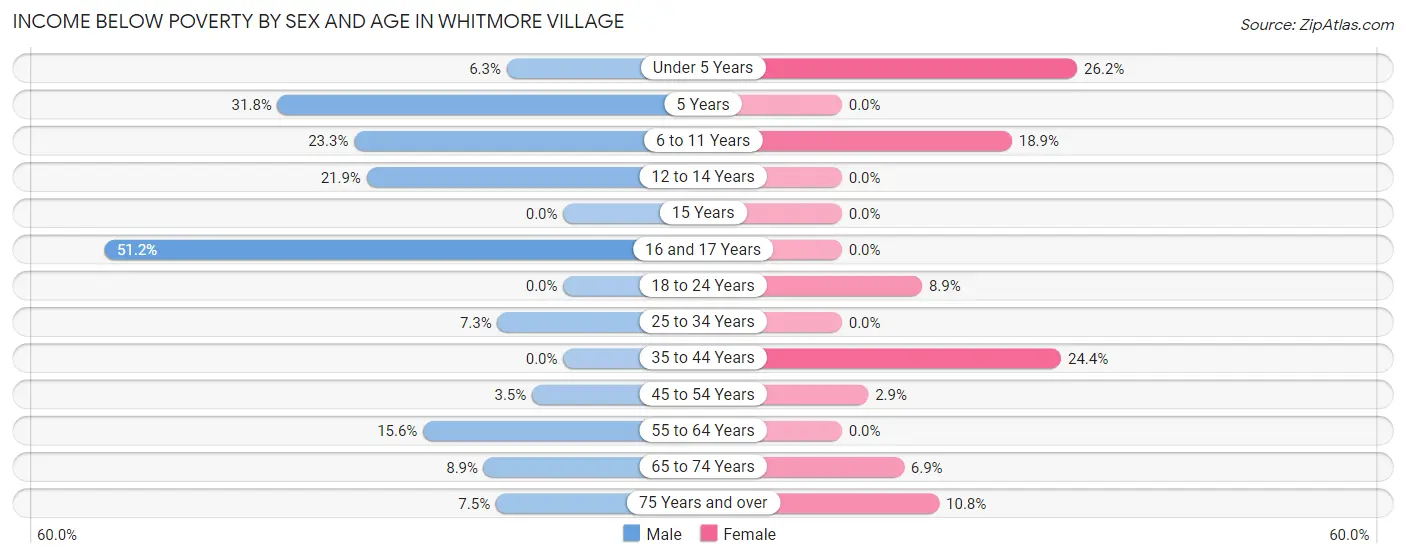
| Age Bracket | Male | Female |
| Under 5 Years | 8 (6.3%) | 38 (26.2%) |
| 5 Years | 7 (31.8%) | 0 (0.0%) |
| 6 to 11 Years | 34 (23.3%) | 32 (18.9%) |
| 12 to 14 Years | 23 (21.9%) | 0 (0.0%) |
| 15 Years | 0 (0.0%) | 0 (0.0%) |
| 16 and 17 Years | 22 (51.2%) | 0 (0.0%) |
| 18 to 24 Years | 0 (0.0%) | 10 (8.9%) |
| 25 to 34 Years | 22 (7.3%) | 0 (0.0%) |
| 35 to 44 Years | 0 (0.0%) | 42 (24.4%) |
| 45 to 54 Years | 11 (3.5%) | 6 (2.9%) |
| 55 to 64 Years | 32 (15.6%) | 0 (0.0%) |
| 65 to 74 Years | 27 (8.8%) | 13 (6.9%) |
| 75 Years and over | 18 (7.5%) | 22 (10.8%) |
| Total | 204 (9.4%) | 163 (9.3%) |
Income Above Poverty by Sex and Age in Whitmore Village
According to the poverty statistics in Whitmore Village, males aged 15 years and females aged 5 years are the age groups that are most secure financially, with 100.0% of males and 100.0% of females in these age groups living above the poverty line.
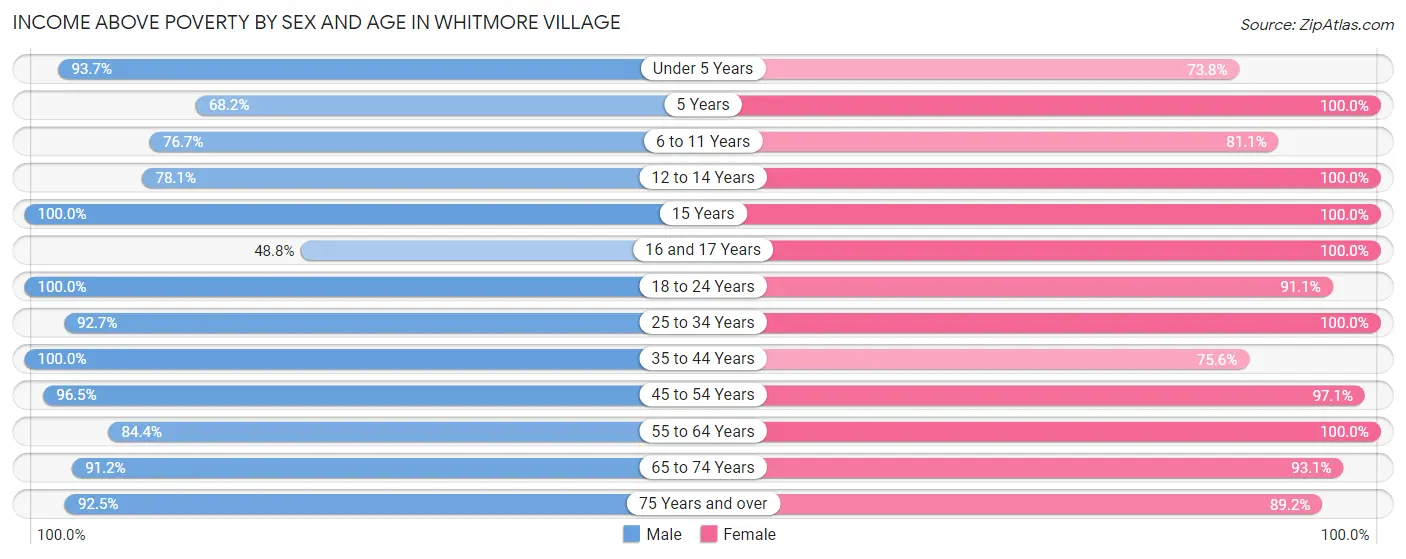
| Age Bracket | Male | Female |
| Under 5 Years | 119 (93.7%) | 107 (73.8%) |
| 5 Years | 15 (68.2%) | 7 (100.0%) |
| 6 to 11 Years | 112 (76.7%) | 137 (81.1%) |
| 12 to 14 Years | 82 (78.1%) | 47 (100.0%) |
| 15 Years | 30 (100.0%) | 4 (100.0%) |
| 16 and 17 Years | 21 (48.8%) | 24 (100.0%) |
| 18 to 24 Years | 152 (100.0%) | 102 (91.1%) |
| 25 to 34 Years | 278 (92.7%) | 247 (100.0%) |
| 35 to 44 Years | 170 (100.0%) | 130 (75.6%) |
| 45 to 54 Years | 305 (96.5%) | 198 (97.1%) |
| 55 to 64 Years | 173 (84.4%) | 226 (100.0%) |
| 65 to 74 Years | 278 (91.1%) | 175 (93.1%) |
| 75 Years and over | 222 (92.5%) | 181 (89.2%) |
| Total | 1,957 (90.6%) | 1,585 (90.7%) |
Income Below Poverty Among Married-Couple Families in Whitmore Village
The poverty statistics for married-couple families in Whitmore Village show that 3.8% or 18 of the total 471 families live below the poverty line. Families with 3 or 4 children have the highest poverty rate of 10.3%, comprising of 7 families. On the other hand, families with 1 or 2 children have the lowest poverty rate of 0.0%, which includes 0 families.
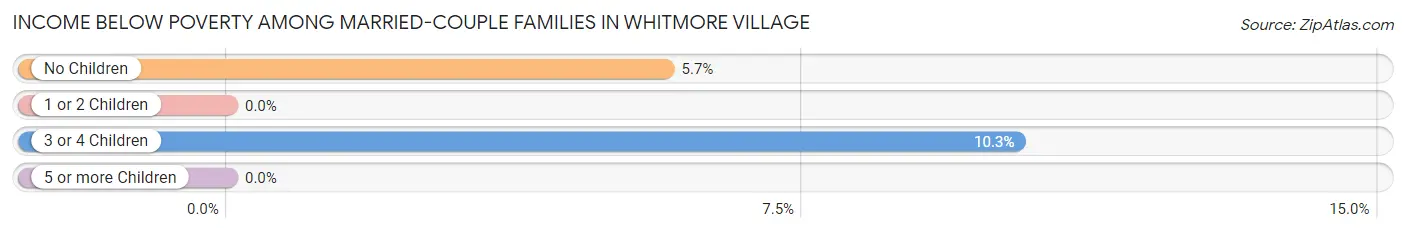
| Children | Above Poverty | Below Poverty |
| No Children | 182 (94.3%) | 11 (5.7%) |
| 1 or 2 Children | 210 (100.0%) | 0 (0.0%) |
| 3 or 4 Children | 61 (89.7%) | 7 (10.3%) |
| 5 or more Children | 0 (0.0%) | 0 (0.0%) |
| Total | 453 (96.2%) | 18 (3.8%) |
Income Below Poverty Among Single-Parent Households in Whitmore Village
According to the poverty data in Whitmore Village, 31.4% or 22 single-father households and 15.4% or 31 single-mother households are living below the poverty line. Among single-father households, those with 1 or 2 children have the highest poverty rate, with 22 households (45.8%) experiencing poverty. Likewise, among single-mother households, those with 3 or 4 children have the highest poverty rate, with 24 households (72.7%) falling below the poverty line.
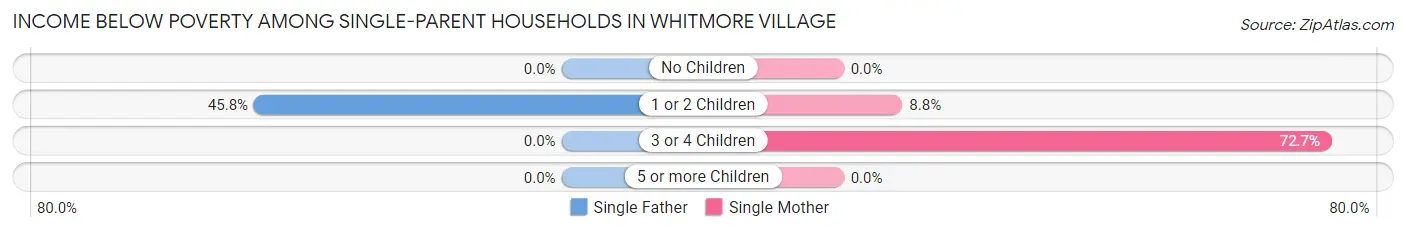
| Children | Single Father | Single Mother |
| No Children | 0 (0.0%) | 0 (0.0%) |
| 1 or 2 Children | 22 (45.8%) | 7 (8.7%) |
| 3 or 4 Children | 0 (0.0%) | 24 (72.7%) |
| 5 or more Children | 0 (0.0%) | 0 (0.0%) |
| Total | 22 (31.4%) | 31 (15.4%) |
Income Below Poverty Among Married-Couple vs Single-Parent Households in Whitmore Village
The poverty data for Whitmore Village shows that 18 of the married-couple family households (3.8%) and 53 of the single-parent households (19.6%) are living below the poverty level. Within the married-couple family households, those with 3 or 4 children have the highest poverty rate, with 7 households (10.3%) falling below the poverty line. Among the single-parent households, those with 3 or 4 children have the highest poverty rate, with 24 household (72.7%) living below poverty.
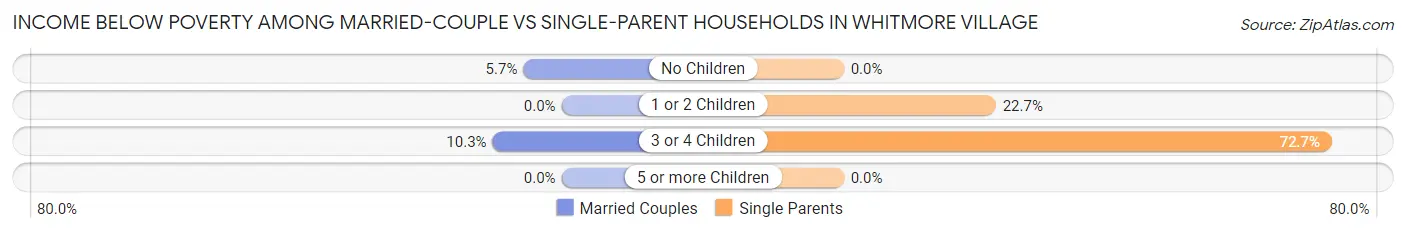
| Children | Married-Couple Families | Single-Parent Households |
| No Children | 11 (5.7%) | 0 (0.0%) |
| 1 or 2 Children | 0 (0.0%) | 29 (22.7%) |
| 3 or 4 Children | 7 (10.3%) | 24 (72.7%) |
| 5 or more Children | 0 (0.0%) | 0 (0.0%) |
| Total | 18 (3.8%) | 53 (19.6%) |
Race in Whitmore Village
The most populous races in Whitmore Village are Asian (2,152 | 55.0%), Two or more Races (1,087 | 27.8%), and Hispanic or Latino (551 | 14.1%).
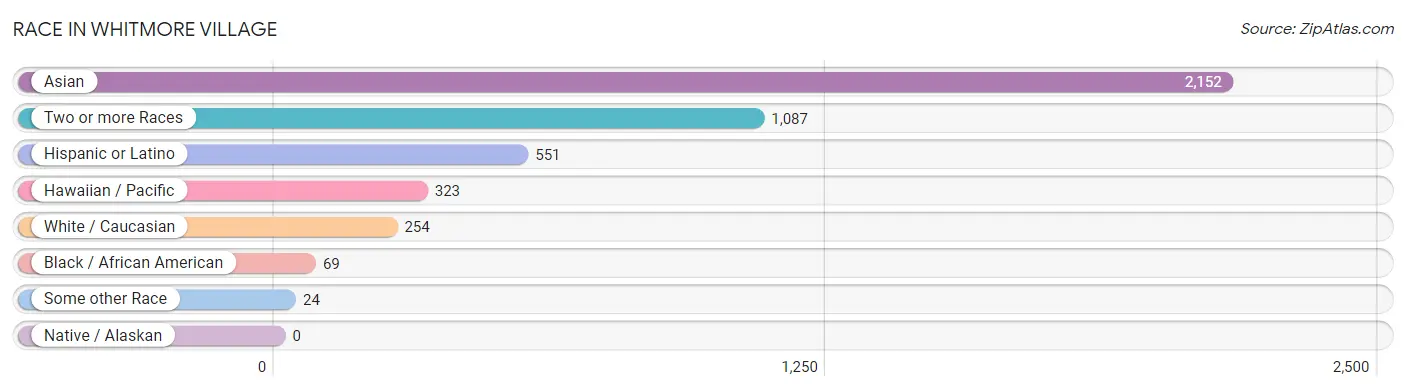
| Race | # Population | % Population |
| Asian | 2,152 | 55.0% |
| Black / African American | 69 | 1.8% |
| Hawaiian / Pacific | 323 | 8.3% |
| Hispanic or Latino | 551 | 14.1% |
| Native / Alaskan | 0 | 0.0% |
| White / Caucasian | 254 | 6.5% |
| Two or more Races | 1,087 | 27.8% |
| Some other Race | 24 | 0.6% |
| Total | 3,909 | 100.0% |
Ancestry in Whitmore Village
The most populous ancestries reported in Whitmore Village are Korean (2,433 | 62.2%), Native Hawaiian (892 | 22.8%), Indian (Asian) (590 | 15.1%), Bhutanese (569 | 14.6%), and Puerto Rican (403 | 10.3%), together accounting for 125.0% of all Whitmore Village residents.
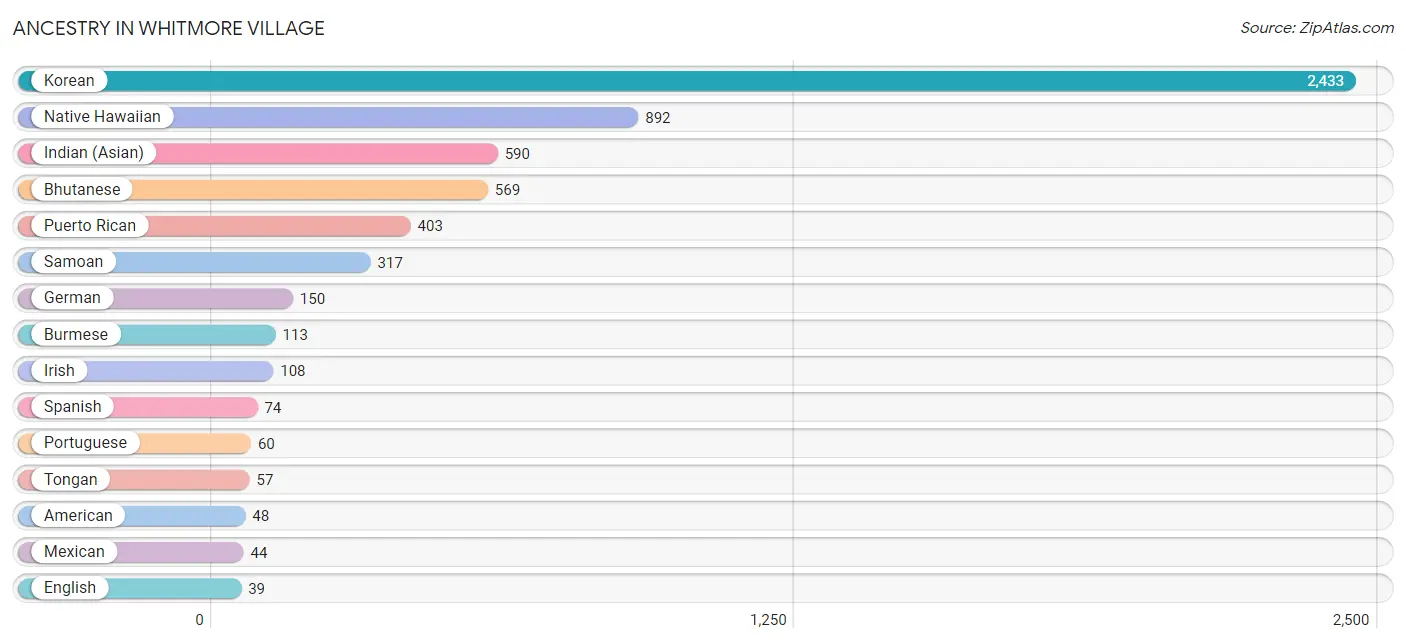
| Ancestry | # Population | % Population |
| American | 48 | 1.2% |
| Belgian | 6 | 0.2% |
| Bhutanese | 569 | 14.6% |
| Burmese | 113 | 2.9% |
| Cherokee | 4 | 0.1% |
| Chinese | 20 | 0.5% |
| Cuban | 2 | 0.1% |
| Dutch | 20 | 0.5% |
| English | 39 | 1.0% |
| European | 10 | 0.3% |
| Fijian | 19 | 0.5% |
| French | 6 | 0.2% |
| French Canadian | 15 | 0.4% |
| German | 150 | 3.8% |
| Guamanian / Chamorro | 13 | 0.3% |
| Indian (Asian) | 590 | 15.1% |
| Indonesian | 18 | 0.5% |
| Irish | 108 | 2.8% |
| Italian | 36 | 0.9% |
| Japanese | 29 | 0.7% |
| Korean | 2,433 | 62.2% |
| Latvian | 7 | 0.2% |
| Mexican | 44 | 1.1% |
| Native Hawaiian | 892 | 22.8% |
| Norwegian | 12 | 0.3% |
| Polish | 4 | 0.1% |
| Portuguese | 60 | 1.5% |
| Puerto Rican | 403 | 10.3% |
| Samoan | 317 | 8.1% |
| Spaniard | 23 | 0.6% |
| Spanish | 74 | 1.9% |
| Swedish | 12 | 0.3% |
| Thai | 21 | 0.5% |
| Tongan | 57 | 1.5% | View All 34 Rows |
Immigrants in Whitmore Village
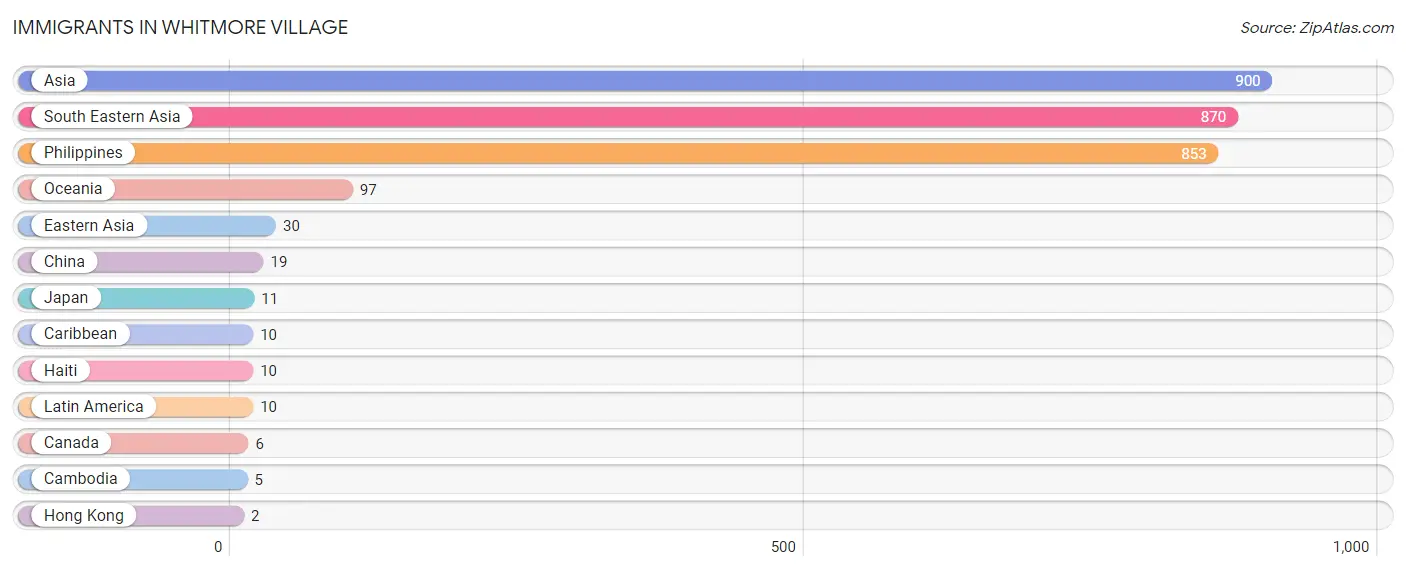
The most numerous immigrant groups reported in Whitmore Village came from Asia (900 | 23.0%), South Eastern Asia (870 | 22.3%), Philippines (853 | 21.8%), Oceania (97 | 2.5%), and Eastern Asia (30 | 0.8%), together accounting for 70.4% of all Whitmore Village residents.
| Immigration Origin | # Population | % Population |
| Asia | 900 | 23.0% |
| Cambodia | 5 | 0.1% |
| Canada | 6 | 0.2% |
| Caribbean | 10 | 0.3% |
| China | 19 | 0.5% |
| Eastern Asia | 30 | 0.8% |
| Haiti | 10 | 0.3% |
| Hong Kong | 2 | 0.1% |
| Japan | 11 | 0.3% |
| Latin America | 10 | 0.3% |
| Oceania | 97 | 2.5% |
| Philippines | 853 | 21.8% |
| South Eastern Asia | 870 | 22.3% | View All 13 Rows |
Sex and Age in Whitmore Village
Sex and Age in Whitmore Village
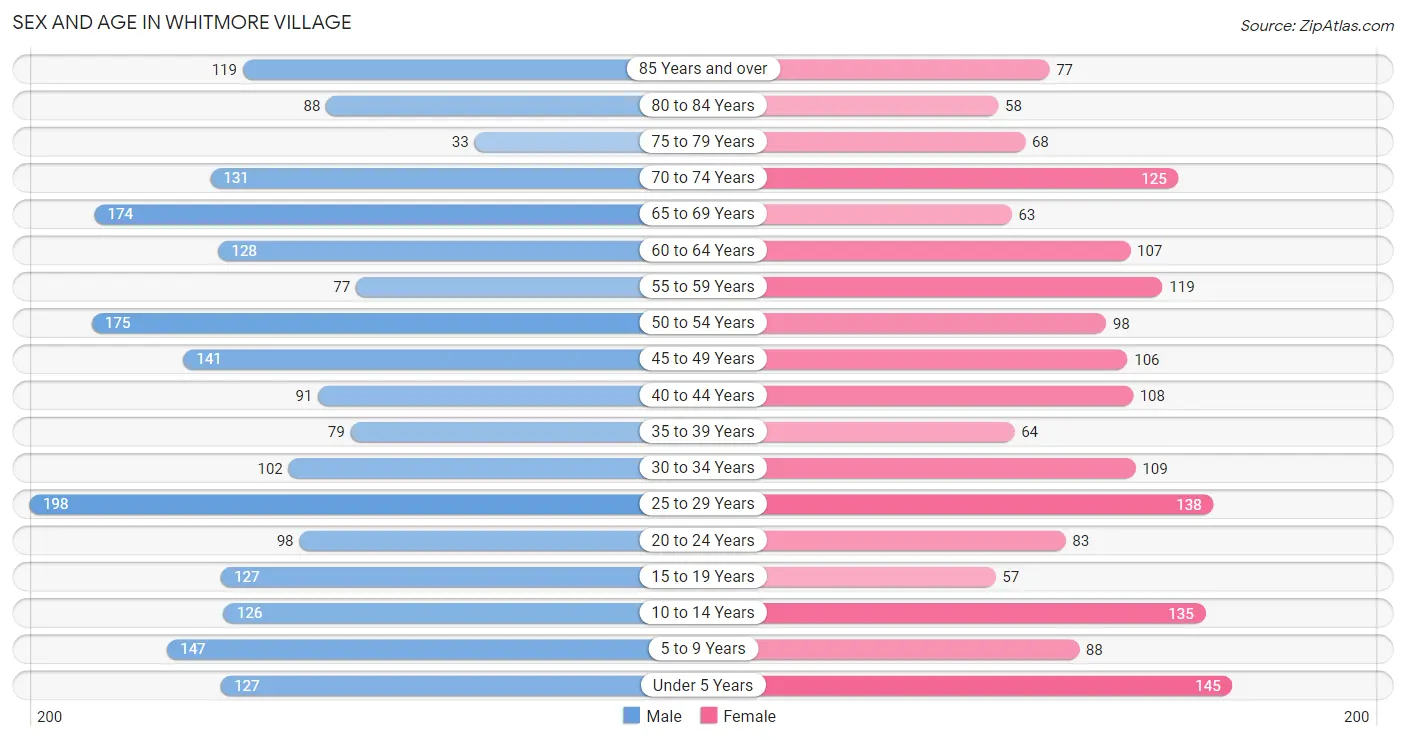
The most populous age groups in Whitmore Village are 25 to 29 Years (198 | 9.2%) for men and Under 5 Years (145 | 8.3%) for women.
| Age Bracket | Male | Female |
| Under 5 Years | 127 (5.9%) | 145 (8.3%) |
| 5 to 9 Years | 147 (6.8%) | 88 (5.0%) |
| 10 to 14 Years | 126 (5.8%) | 135 (7.7%) |
| 15 to 19 Years | 127 (5.9%) | 57 (3.3%) |
| 20 to 24 Years | 98 (4.5%) | 83 (4.8%) |
| 25 to 29 Years | 198 (9.2%) | 138 (7.9%) |
| 30 to 34 Years | 102 (4.7%) | 109 (6.2%) |
| 35 to 39 Years | 79 (3.7%) | 64 (3.7%) |
| 40 to 44 Years | 91 (4.2%) | 108 (6.2%) |
| 45 to 49 Years | 141 (6.5%) | 106 (6.1%) |
| 50 to 54 Years | 175 (8.1%) | 98 (5.6%) |
| 55 to 59 Years | 77 (3.6%) | 119 (6.8%) |
| 60 to 64 Years | 128 (5.9%) | 107 (6.1%) |
| 65 to 69 Years | 174 (8.1%) | 63 (3.6%) |
| 70 to 74 Years | 131 (6.1%) | 125 (7.1%) |
| 75 to 79 Years | 33 (1.5%) | 68 (3.9%) |
| 80 to 84 Years | 88 (4.1%) | 58 (3.3%) |
| 85 Years and over | 119 (5.5%) | 77 (4.4%) |
| Total | 2,161 (100.0%) | 1,748 (100.0%) |
Families and Households in Whitmore Village
Median Family Size in Whitmore Village
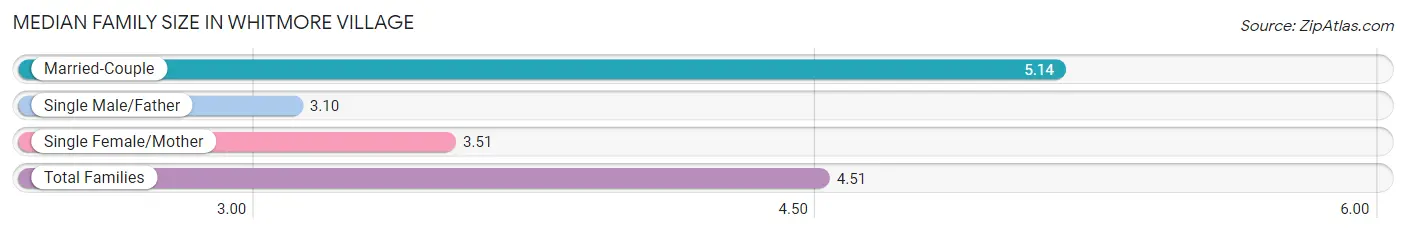
The median family size in Whitmore Village is 4.51 persons per family, with married-couple families (471 | 63.5%) accounting for the largest median family size of 5.14 persons per family. On the other hand, single male/father families (70 | 9.4%) represent the smallest median family size with 3.10 persons per family.
| Family Type | # Families | Family Size |
| Married-Couple | 471 (63.5%) | 5.14 |
| Single Male/Father | 70 (9.4%) | 3.10 |
| Single Female/Mother | 201 (27.1%) | 3.51 |
| Total Families | 742 (100.0%) | 4.51 |
Median Household Size in Whitmore Village
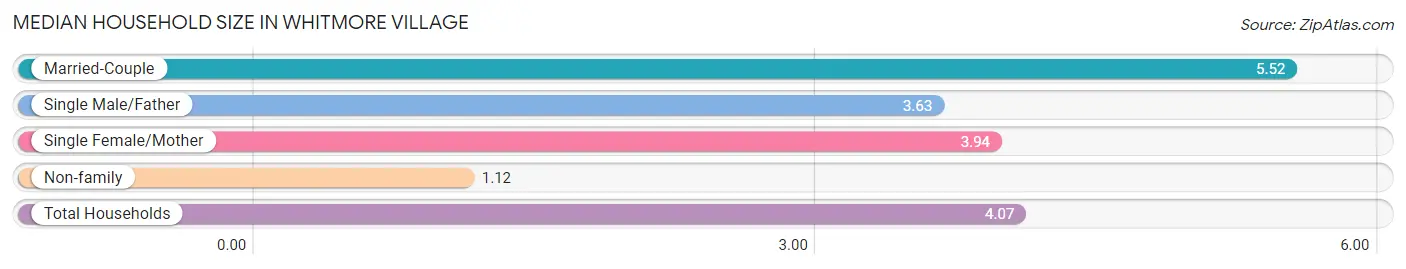
The median household size in Whitmore Village is 4.07 persons per household, with married-couple households (471 | 49.5%) accounting for the largest median household size of 5.52 persons per household. non-family households (210 | 22.1%) represent the smallest median household size with 1.12 persons per household.
| Household Type | # Households | Household Size |
| Married-Couple | 471 (49.5%) | 5.52 |
| Single Male/Father | 70 (7.3%) | 3.63 |
| Single Female/Mother | 201 (21.1%) | 3.94 |
| Non-family | 210 (22.1%) | 1.12 |
| Total Households | 952 (100.0%) | 4.07 |
Household Size by Marriage Status in Whitmore Village
Out of a total of 952 households in Whitmore Village, 742 (77.9%) are family households, while 210 (22.1%) are nonfamily households. The most numerous type of family households are 4-person households, comprising 155, and the most common type of nonfamily households are 1-person households, comprising 187.
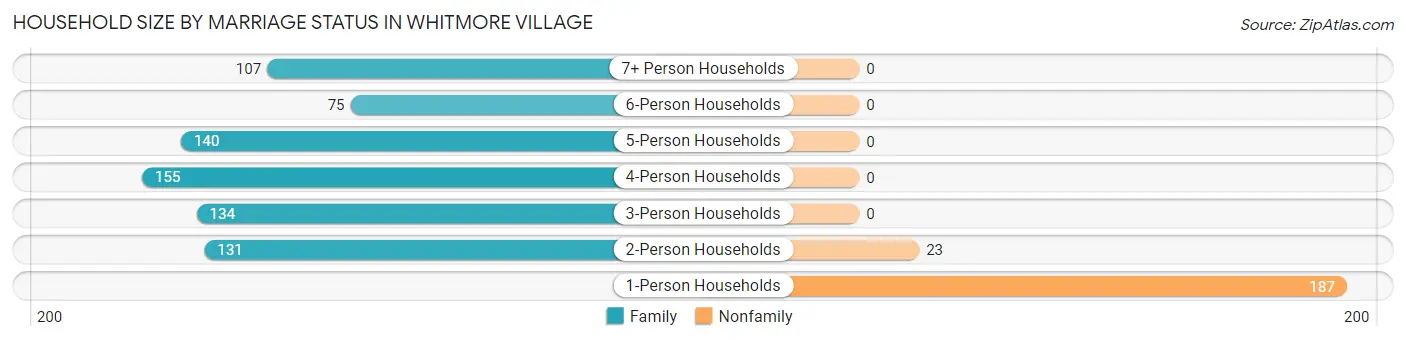
| Household Size | Family Households | Nonfamily Households |
| 1-Person Households | - | 187 (19.6%) |
| 2-Person Households | 131 (13.8%) | 23 (2.4%) |
| 3-Person Households | 134 (14.1%) | 0 (0.0%) |
| 4-Person Households | 155 (16.3%) | 0 (0.0%) |
| 5-Person Households | 140 (14.7%) | 0 (0.0%) |
| 6-Person Households | 75 (7.9%) | 0 (0.0%) |
| 7+ Person Households | 107 (11.2%) | 0 (0.0%) |
| Total | 742 (77.9%) | 210 (22.1%) |
Female Fertility in Whitmore Village
Fertility by Age in Whitmore Village
Average fertility rate in Whitmore Village is 82.0 births per 1,000 women. Women in the age bracket of 20 to 34 years have the highest fertility rate with 121.0 births per 1,000 women. Women in the age bracket of 20 to 34 years acount for 72.7% of all women with births.
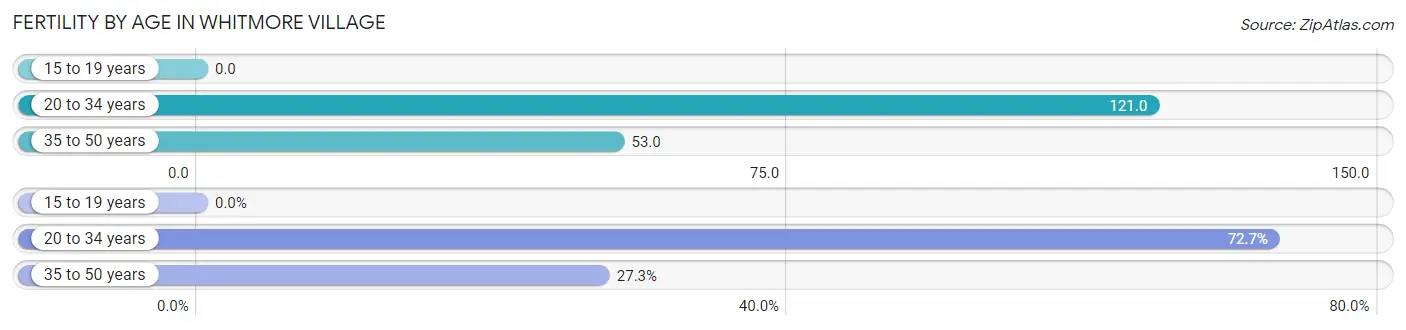
| Age Bracket | Women with Births | Births / 1,000 Women |
| 15 to 19 years | 0 (0.0%) | 0.0 |
| 20 to 34 years | 40 (72.7%) | 121.0 |
| 35 to 50 years | 15 (27.3%) | 53.0 |
| Total | 55 (100.0%) | 82.0 |
Fertility by Age by Marriage Status in Whitmore Village
81.8% of women with births (55) in Whitmore Village are married. The highest percentage of unmarried women with births falls into 20 to 34 years age bracket with 25.0% of them unmarried at the time of birth, while the lowest percentage of unmarried women with births belong to 35 to 50 years age bracket with 0.0% of them unmarried.
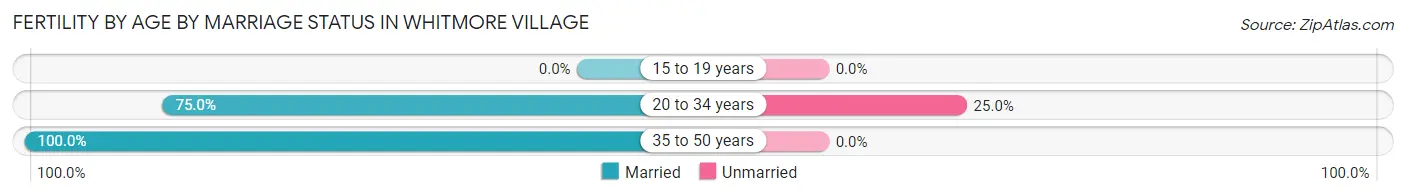
| Age Bracket | Married | Unmarried |
| 15 to 19 years | 0 (0.0%) | 0 (0.0%) |
| 20 to 34 years | 30 (75.0%) | 10 (25.0%) |
| 35 to 50 years | 15 (100.0%) | 0 (0.0%) |
| Total | 45 (81.8%) | 10 (18.2%) |
Fertility by Education in Whitmore Village
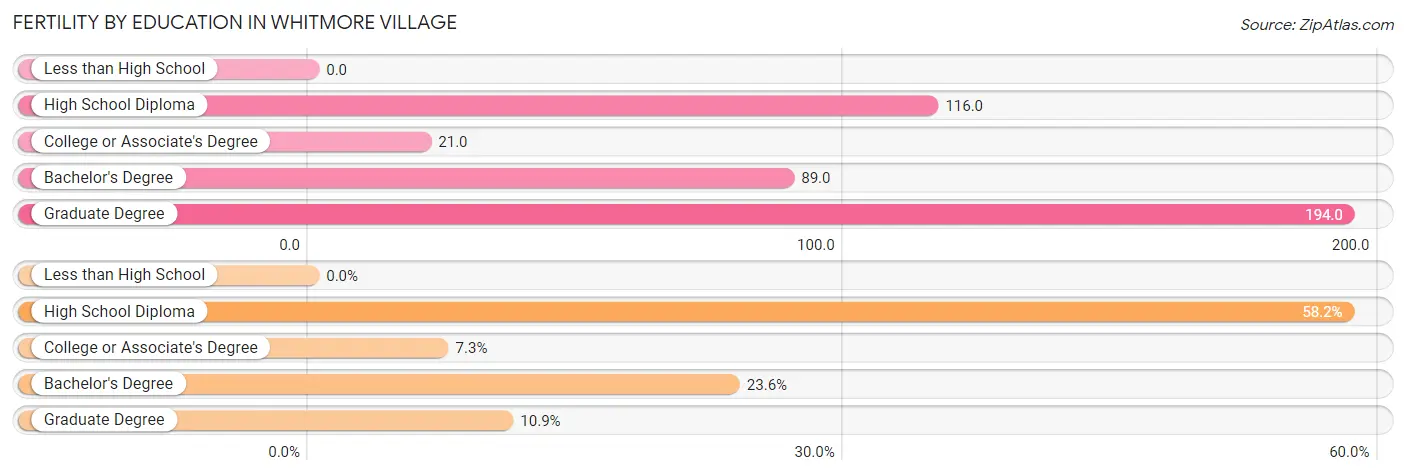
| Educational Attainment | Women with Births | Births / 1,000 Women |
| Less than High School | 0 (0.0%) | 0.0 |
| High School Diploma | 32 (58.2%) | 116.0 |
| College or Associate's Degree | 4 (7.3%) | 21.0 |
| Bachelor's Degree | 13 (23.6%) | 89.0 |
| Graduate Degree | 6 (10.9%) | 194.0 |
| Total | 55 (100.0%) | 82.0 |
Fertility by Education by Marriage Status in Whitmore Village
18.2% of women with births in Whitmore Village are unmarried. Women with the educational attainment of bachelor's degree are most likely to be married with 100.0% of them married at childbirth, while women with the educational attainment of college or associate's degree are least likely to be married with 100.0% of them unmarried at childbirth.
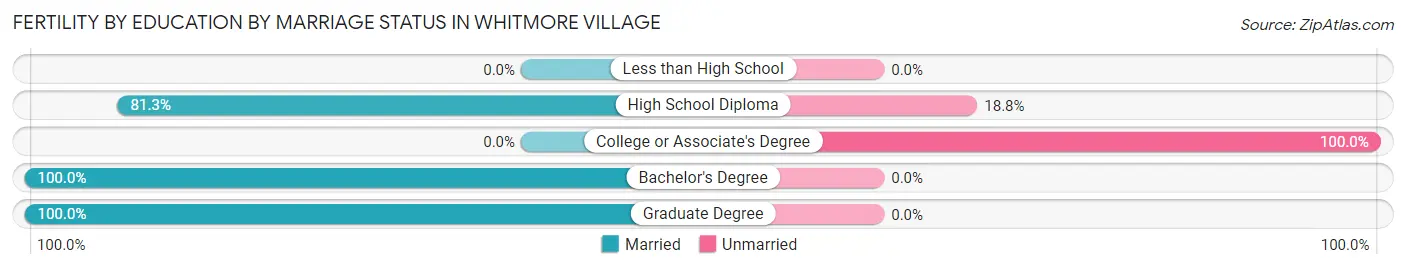
| Educational Attainment | Married | Unmarried |
| Less than High School | 0 (0.0%) | 0 (0.0%) |
| High School Diploma | 26 (81.2%) | 6 (18.8%) |
| College or Associate's Degree | 0 (0.0%) | 4 (100.0%) |
| Bachelor's Degree | 13 (100.0%) | 0 (0.0%) |
| Graduate Degree | 6 (100.0%) | 0 (0.0%) |
| Total | 45 (81.8%) | 10 (18.2%) |
Employment Characteristics in Whitmore Village
Employment by Class of Employer in Whitmore Village
Among the 1,613 employed individuals in Whitmore Village, private company employees (986 | 61.1%), federal government employees (218 | 13.5%), and state government employees (125 | 7.7%) make up the most common classes of employment.
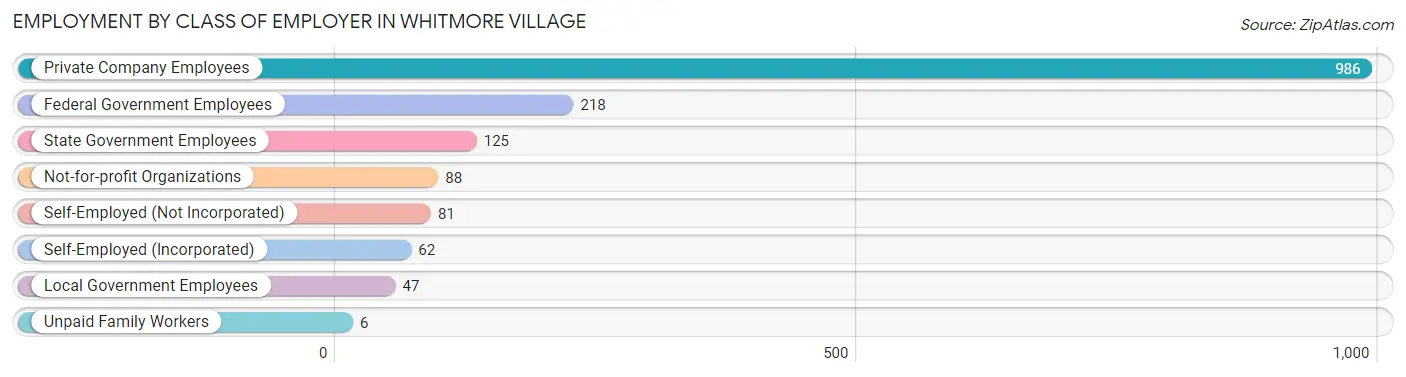
| Employer Class | # Employees | % Employees |
| Private Company Employees | 986 | 61.1% |
| Self-Employed (Incorporated) | 62 | 3.8% |
| Self-Employed (Not Incorporated) | 81 | 5.0% |
| Not-for-profit Organizations | 88 | 5.5% |
| Local Government Employees | 47 | 2.9% |
| State Government Employees | 125 | 7.7% |
| Federal Government Employees | 218 | 13.5% |
| Unpaid Family Workers | 6 | 0.4% |
| Total | 1,613 | 100.0% |
Employment Status by Age in Whitmore Village
According to the labor force statistics for Whitmore Village, out of the total population over 16 years of age (3,107), 57.0% or 1,771 individuals are in the labor force, with 3.5% or 62 of them unemployed. The age group with the highest labor force participation rate is 30 to 34 years, with 100.0% or 211 individuals in the labor force. Within the labor force, the 30 to 34 years age range has the highest percentage of unemployed individuals, with 16.6% or 35 of them being unemployed.
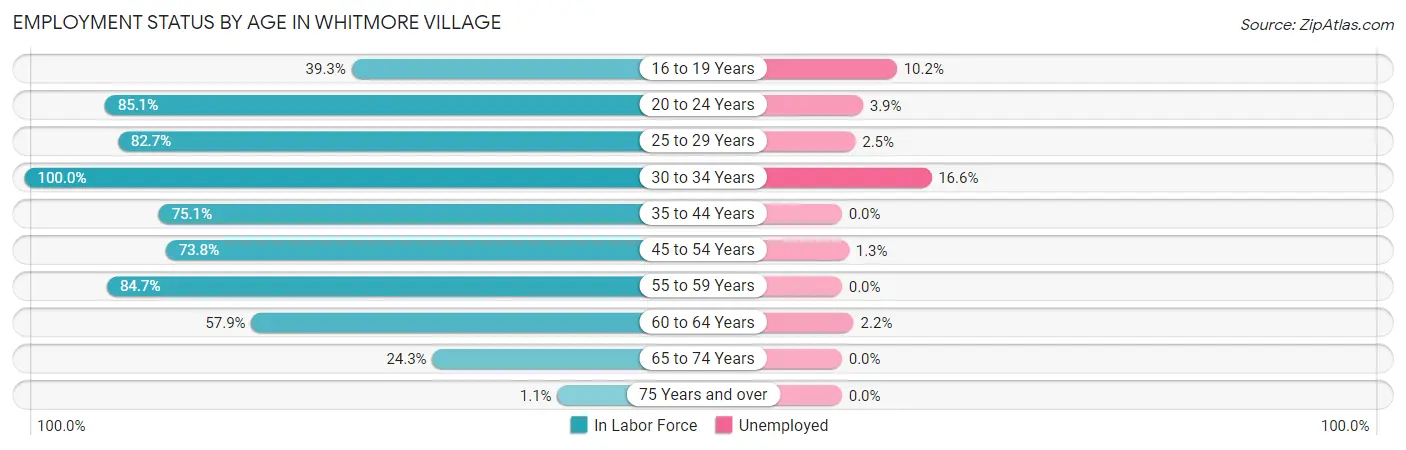
| Age Bracket | In Labor Force | Unemployed |
| 16 to 19 Years | 59 (39.3%) | 6 (10.2%) |
| 20 to 24 Years | 154 (85.1%) | 6 (3.9%) |
| 25 to 29 Years | 278 (82.7%) | 7 (2.5%) |
| 30 to 34 Years | 211 (100.0%) | 35 (16.6%) |
| 35 to 44 Years | 257 (75.1%) | 0 (0.0%) |
| 45 to 54 Years | 384 (73.8%) | 5 (1.3%) |
| 55 to 59 Years | 166 (84.7%) | 0 (0.0%) |
| 60 to 64 Years | 136 (57.9%) | 3 (2.2%) |
| 65 to 74 Years | 120 (24.3%) | 0 (0.0%) |
| 75 Years and over | 5 (1.1%) | 0 (0.0%) |
| Total | 1,771 (57.0%) | 62 (3.5%) |
Employment Status by Educational Attainment in Whitmore Village
According to labor force statistics for Whitmore Village, 77.8% of individuals (1,432) out of the total population between 25 and 64 years of age (1,840) are in the labor force, with 3.5% or 50 of them being unemployed. The group with the highest labor force participation rate are those with the educational attainment of bachelor's degree or higher, with 85.5% or 283 individuals in the labor force. Within the labor force, individuals with college / associate degree education have the highest percentage of unemployment, with 5.3% or 21 of them being unemployed.
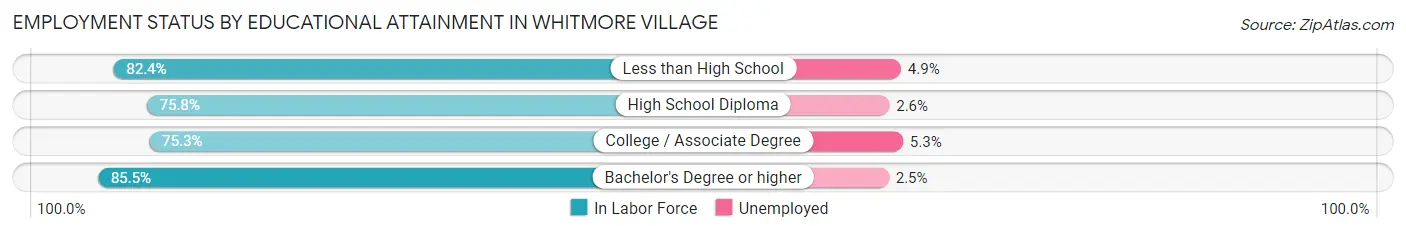
| Educational Attainment | In Labor Force | Unemployed |
| Less than High School | 103 (82.4%) | 6 (4.9%) |
| High School Diploma | 644 (75.8%) | 22 (2.6%) |
| College / Associate Degree | 402 (75.3%) | 28 (5.3%) |
| Bachelor's Degree or higher | 283 (85.5%) | 8 (2.5%) |
| Total | 1,432 (77.8%) | 64 (3.5%) |
Employment Occupations by Sex in Whitmore Village
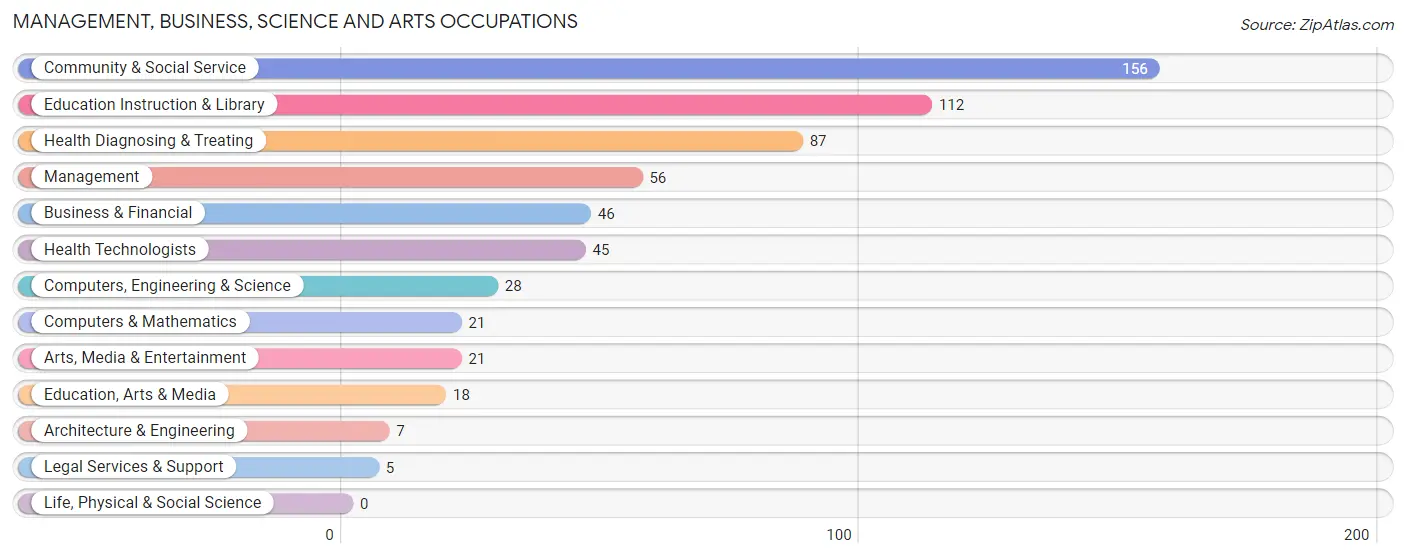
Management, Business, Science and Arts Occupations
The most common Management, Business, Science and Arts occupations in Whitmore Village are Community & Social Service (156 | 9.2%), Education Instruction & Library (112 | 6.6%), Health Diagnosing & Treating (87 | 5.1%), Management (56 | 3.3%), and Business & Financial (46 | 2.7%).
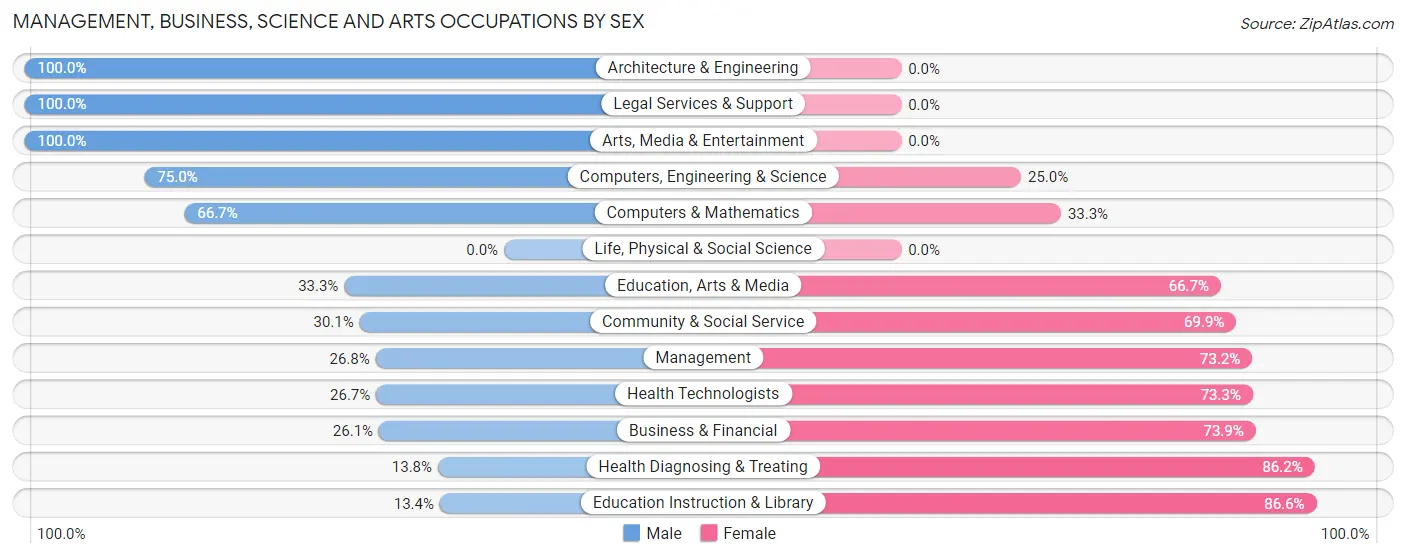
Management, Business, Science and Arts Occupations by Sex
Within the Management, Business, Science and Arts occupations in Whitmore Village, the most male-oriented occupations are Architecture & Engineering (100.0%), Legal Services & Support (100.0%), and Arts, Media & Entertainment (100.0%), while the most female-oriented occupations are Education Instruction & Library (86.6%), Health Diagnosing & Treating (86.2%), and Business & Financial (73.9%).
| Occupation | Male | Female |
| Management | 15 (26.8%) | 41 (73.2%) |
| Business & Financial | 12 (26.1%) | 34 (73.9%) |
| Computers, Engineering & Science | 21 (75.0%) | 7 (25.0%) |
| Computers & Mathematics | 14 (66.7%) | 7 (33.3%) |
| Architecture & Engineering | 7 (100.0%) | 0 (0.0%) |
| Life, Physical & Social Science | 0 (0.0%) | 0 (0.0%) |
| Community & Social Service | 47 (30.1%) | 109 (69.9%) |
| Education, Arts & Media | 6 (33.3%) | 12 (66.7%) |
| Legal Services & Support | 5 (100.0%) | 0 (0.0%) |
| Education Instruction & Library | 15 (13.4%) | 97 (86.6%) |
| Arts, Media & Entertainment | 21 (100.0%) | 0 (0.0%) |
| Health Diagnosing & Treating | 12 (13.8%) | 75 (86.2%) |
| Health Technologists | 12 (26.7%) | 33 (73.3%) |
| Total (Category) | 107 (28.7%) | 266 (71.3%) |
| Total (Overall) | 930 (54.6%) | 773 (45.4%) |
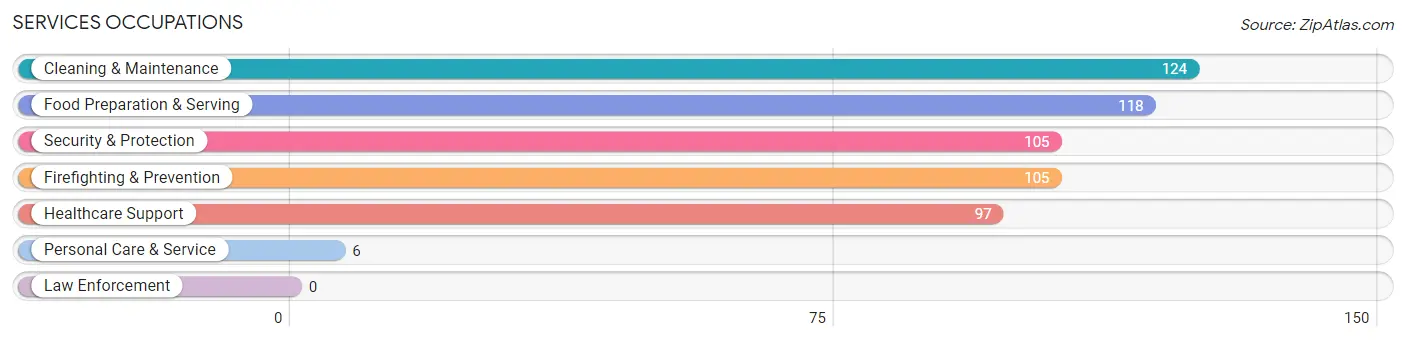
Services Occupations
The most common Services occupations in Whitmore Village are Cleaning & Maintenance (124 | 7.3%), Food Preparation & Serving (118 | 6.9%), Security & Protection (105 | 6.2%), Firefighting & Prevention (105 | 6.2%), and Healthcare Support (97 | 5.7%).
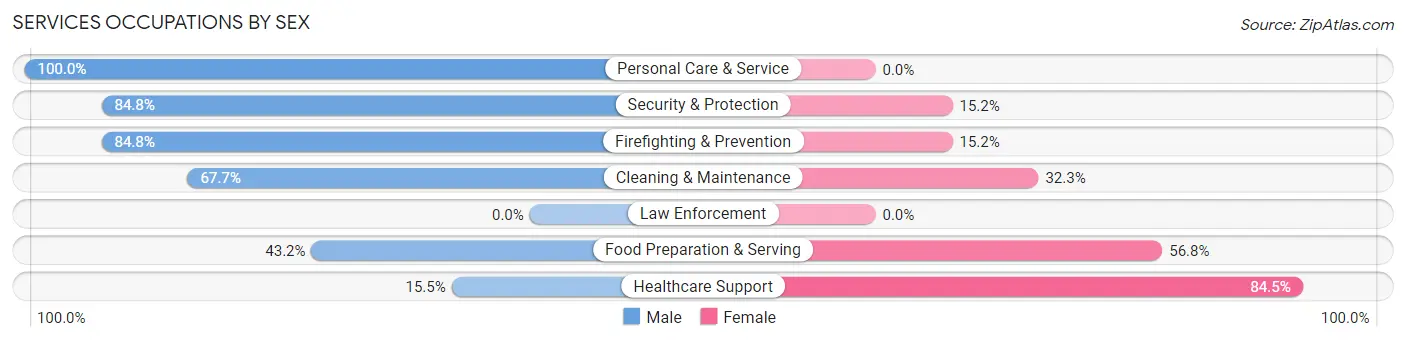
Services Occupations by Sex
Within the Services occupations in Whitmore Village, the most male-oriented occupations are Personal Care & Service (100.0%), Security & Protection (84.8%), and Firefighting & Prevention (84.8%), while the most female-oriented occupations are Healthcare Support (84.5%), Food Preparation & Serving (56.8%), and Cleaning & Maintenance (32.3%).
| Occupation | Male | Female |
| Healthcare Support | 15 (15.5%) | 82 (84.5%) |
| Security & Protection | 89 (84.8%) | 16 (15.2%) |
| Firefighting & Prevention | 89 (84.8%) | 16 (15.2%) |
| Law Enforcement | 0 (0.0%) | 0 (0.0%) |
| Food Preparation & Serving | 51 (43.2%) | 67 (56.8%) |
| Cleaning & Maintenance | 84 (67.7%) | 40 (32.3%) |
| Personal Care & Service | 6 (100.0%) | 0 (0.0%) |
| Total (Category) | 245 (54.4%) | 205 (45.6%) |
| Total (Overall) | 930 (54.6%) | 773 (45.4%) |
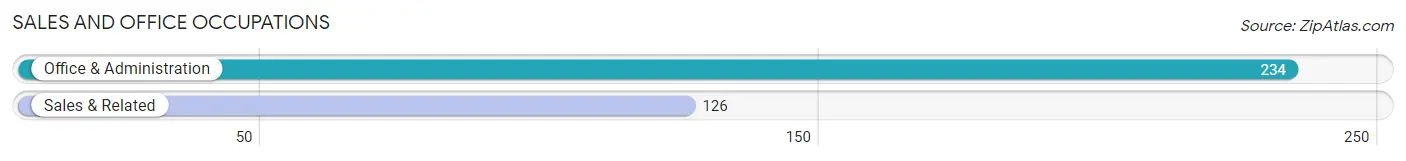
Sales and Office Occupations
The most common Sales and Office occupations in Whitmore Village are Office & Administration (234 | 13.7%), and Sales & Related (126 | 7.4%).
Sales and Office Occupations by Sex
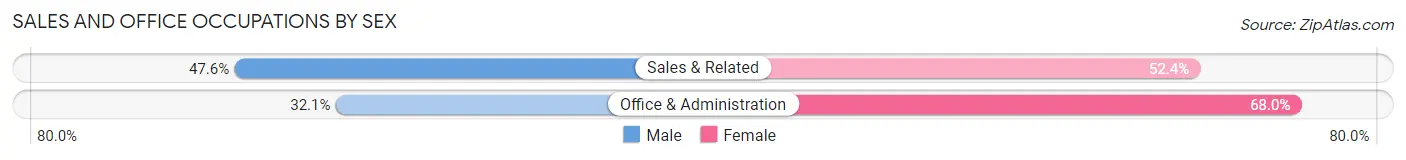
| Occupation | Male | Female |
| Sales & Related | 60 (47.6%) | 66 (52.4%) |
| Office & Administration | 75 (32.1%) | 159 (67.9%) |
| Total (Category) | 135 (37.5%) | 225 (62.5%) |
| Total (Overall) | 930 (54.6%) | 773 (45.4%) |
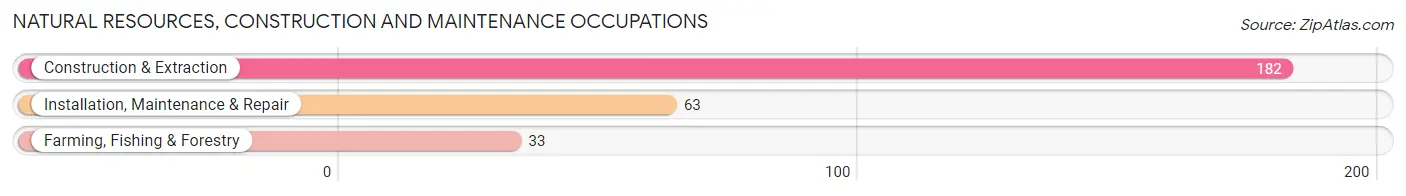
Natural Resources, Construction and Maintenance Occupations
The most common Natural Resources, Construction and Maintenance occupations in Whitmore Village are Construction & Extraction (182 | 10.7%), Installation, Maintenance & Repair (63 | 3.7%), and Farming, Fishing & Forestry (33 | 1.9%).
Natural Resources, Construction and Maintenance Occupations by Sex
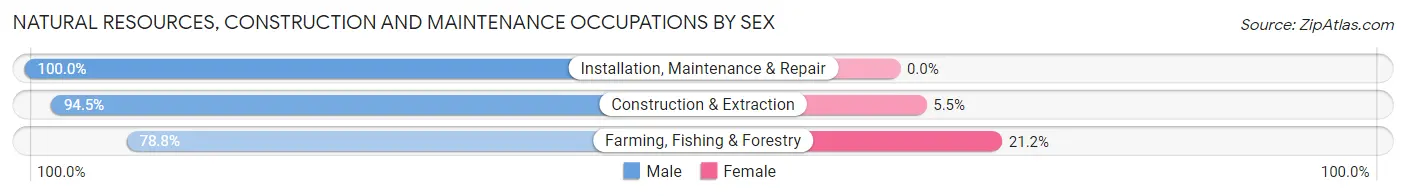
| Occupation | Male | Female |
| Farming, Fishing & Forestry | 26 (78.8%) | 7 (21.2%) |
| Construction & Extraction | 172 (94.5%) | 10 (5.5%) |
| Installation, Maintenance & Repair | 63 (100.0%) | 0 (0.0%) |
| Total (Category) | 261 (93.9%) | 17 (6.1%) |
| Total (Overall) | 930 (54.6%) | 773 (45.4%) |
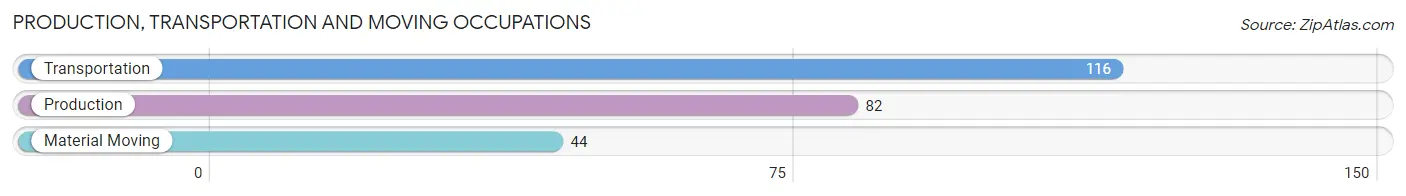
Production, Transportation and Moving Occupations
The most common Production, Transportation and Moving occupations in Whitmore Village are Transportation (116 | 6.8%), Production (82 | 4.8%), and Material Moving (44 | 2.6%).
Production, Transportation and Moving Occupations by Sex
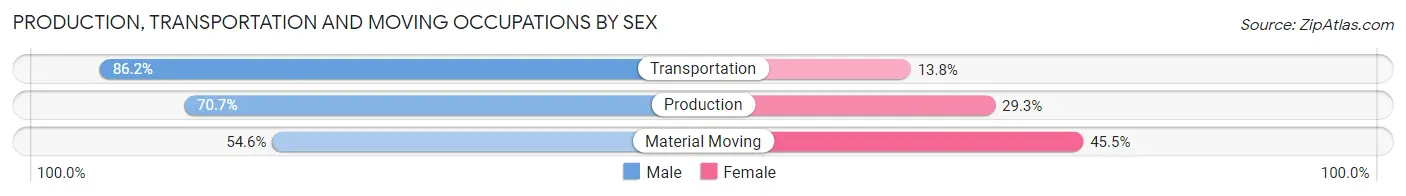
| Occupation | Male | Female |
| Production | 58 (70.7%) | 24 (29.3%) |
| Transportation | 100 (86.2%) | 16 (13.8%) |
| Material Moving | 24 (54.5%) | 20 (45.5%) |
| Total (Category) | 182 (75.2%) | 60 (24.8%) |
| Total (Overall) | 930 (54.6%) | 773 (45.4%) |
Employment Industries by Sex in Whitmore Village
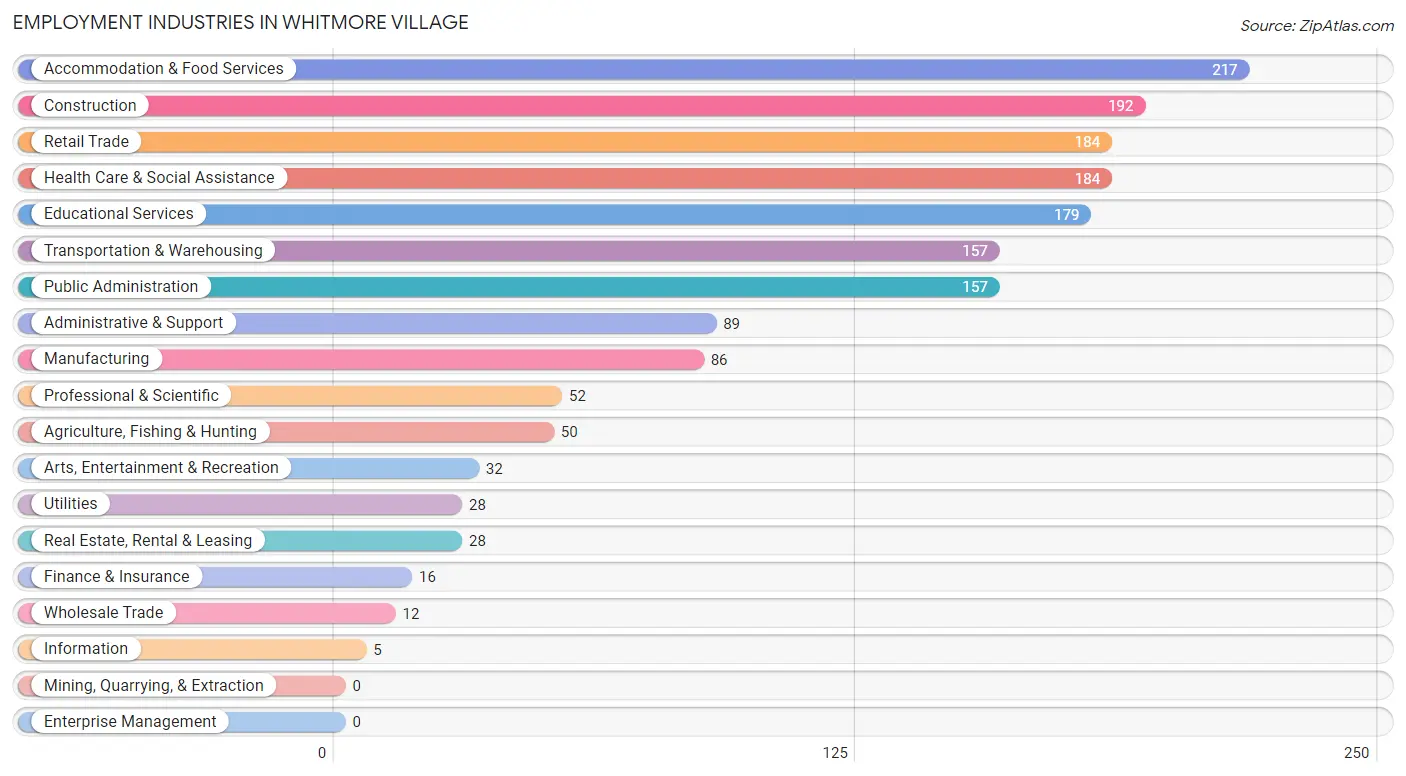
Employment Industries in Whitmore Village
The major employment industries in Whitmore Village include Accommodation & Food Services (217 | 12.7%), Construction (192 | 11.3%), Retail Trade (184 | 10.8%), Health Care & Social Assistance (184 | 10.8%), and Educational Services (179 | 10.5%).
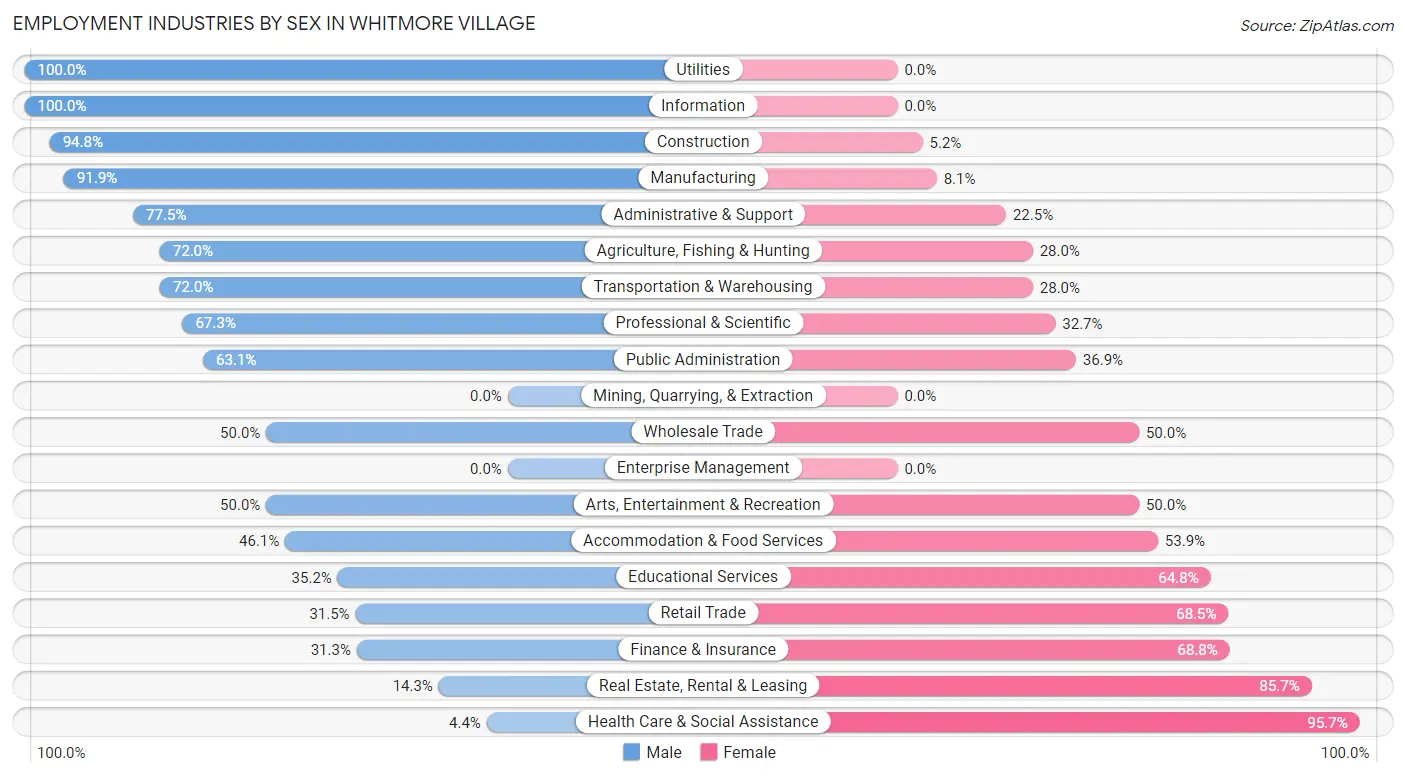
Employment Industries by Sex in Whitmore Village
The Whitmore Village industries that see more men than women are Utilities (100.0%), Information (100.0%), and Construction (94.8%), whereas the industries that tend to have a higher number of women are Health Care & Social Assistance (95.7%), Real Estate, Rental & Leasing (85.7%), and Finance & Insurance (68.8%).
| Industry | Male | Female |
| Agriculture, Fishing & Hunting | 36 (72.0%) | 14 (28.0%) |
| Mining, Quarrying, & Extraction | 0 (0.0%) | 0 (0.0%) |
| Construction | 182 (94.8%) | 10 (5.2%) |
| Manufacturing | 79 (91.9%) | 7 (8.1%) |
| Wholesale Trade | 6 (50.0%) | 6 (50.0%) |
| Retail Trade | 58 (31.5%) | 126 (68.5%) |
| Transportation & Warehousing | 113 (72.0%) | 44 (28.0%) |
| Utilities | 28 (100.0%) | 0 (0.0%) |
| Information | 5 (100.0%) | 0 (0.0%) |
| Finance & Insurance | 5 (31.2%) | 11 (68.8%) |
| Real Estate, Rental & Leasing | 4 (14.3%) | 24 (85.7%) |
| Professional & Scientific | 35 (67.3%) | 17 (32.7%) |
| Enterprise Management | 0 (0.0%) | 0 (0.0%) |
| Administrative & Support | 69 (77.5%) | 20 (22.5%) |
| Educational Services | 63 (35.2%) | 116 (64.8%) |
| Health Care & Social Assistance | 8 (4.3%) | 176 (95.7%) |
| Arts, Entertainment & Recreation | 16 (50.0%) | 16 (50.0%) |
| Accommodation & Food Services | 100 (46.1%) | 117 (53.9%) |
| Public Administration | 99 (63.1%) | 58 (36.9%) |
| Total | 930 (54.6%) | 773 (45.4%) |
Education in Whitmore Village
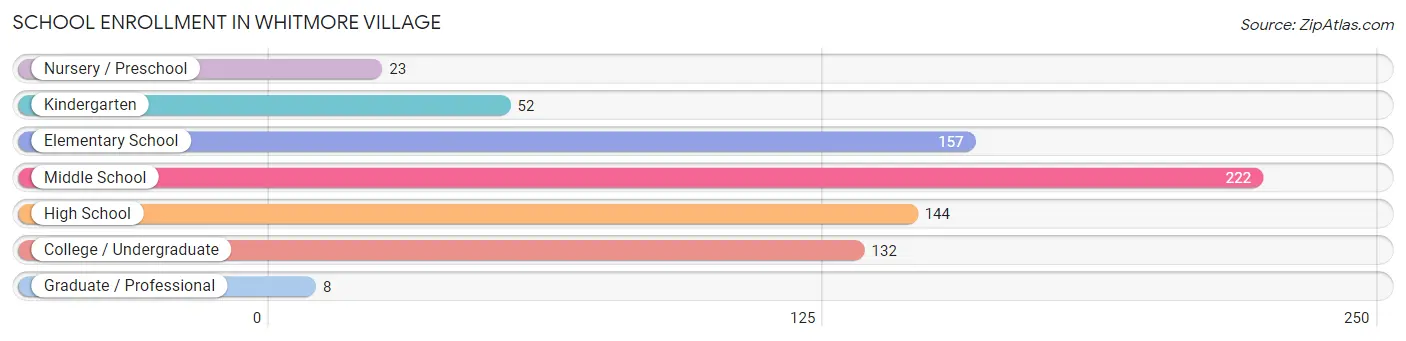
School Enrollment in Whitmore Village
The most common levels of schooling among the 738 students in Whitmore Village are middle school (222 | 30.1%), elementary school (157 | 21.3%), and high school (144 | 19.5%).
| School Level | # Students | % Students |
| Nursery / Preschool | 23 | 3.1% |
| Kindergarten | 52 | 7.0% |
| Elementary School | 157 | 21.3% |
| Middle School | 222 | 30.1% |
| High School | 144 | 19.5% |
| College / Undergraduate | 132 | 17.9% |
| Graduate / Professional | 8 | 1.1% |
| Total | 738 | 100.0% |
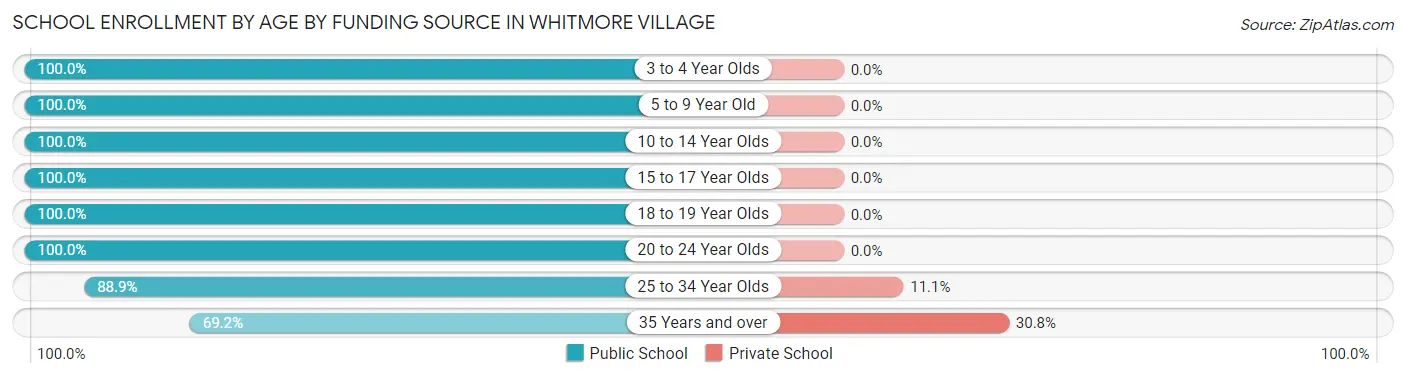
School Enrollment by Age by Funding Source in Whitmore Village
Out of a total of 738 students who are enrolled in schools in Whitmore Village, 14 (1.9%) attend a private institution, while the remaining 724 (98.1%) are enrolled in public schools. The age group of 35 years and over has the highest likelihood of being enrolled in private schools, with 8 (30.8% in the age bracket) enrolled. Conversely, the age group of 3 to 4 year olds has the lowest likelihood of being enrolled in a private school, with 14 (100.0% in the age bracket) attending a public institution.
| Age Bracket | Public School | Private School |
| 3 to 4 Year Olds | 14 (100.0%) | 0 (0.0%) |
| 5 to 9 Year Old | 212 (100.0%) | 0 (0.0%) |
| 10 to 14 Year Olds | 252 (100.0%) | 0 (0.0%) |
| 15 to 17 Year Olds | 91 (100.0%) | 0 (0.0%) |
| 18 to 19 Year Olds | 39 (100.0%) | 0 (0.0%) |
| 20 to 24 Year Olds | 50 (100.0%) | 0 (0.0%) |
| 25 to 34 Year Olds | 48 (88.9%) | 6 (11.1%) |
| 35 Years and over | 18 (69.2%) | 8 (30.8%) |
| Total | 724 (98.1%) | 14 (1.9%) |
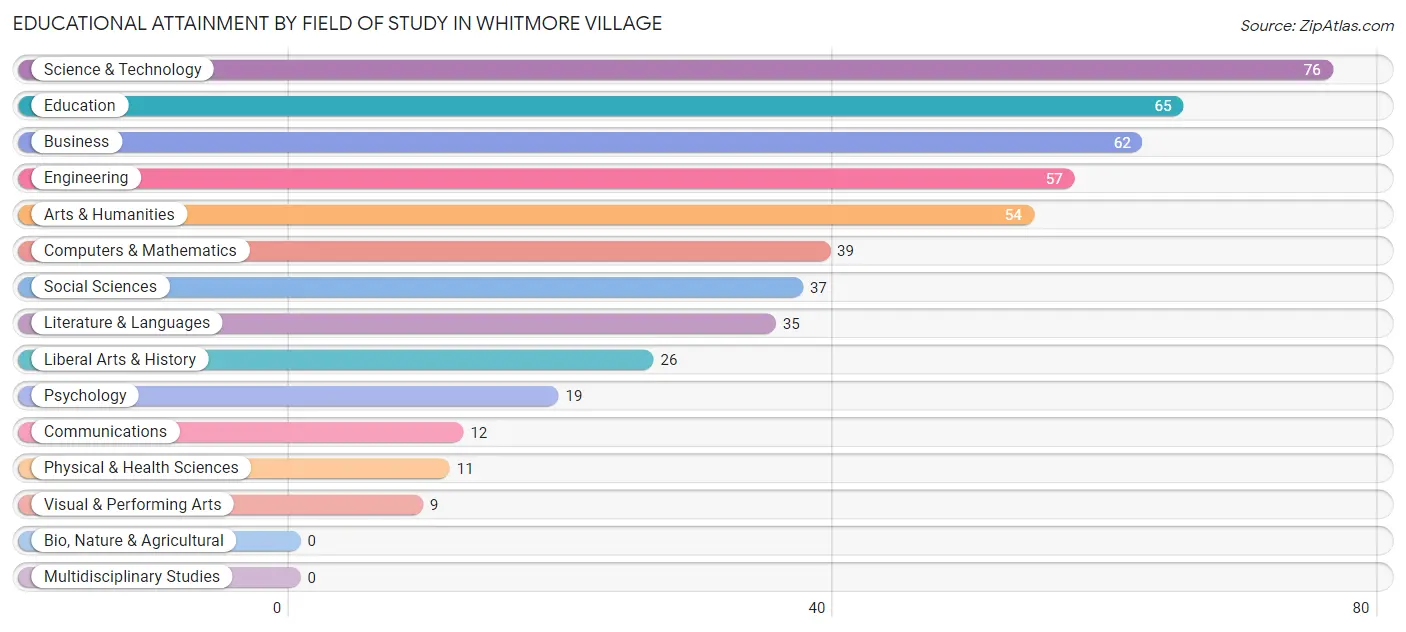
Educational Attainment by Field of Study in Whitmore Village
Science & technology (76 | 15.1%), education (65 | 13.0%), business (62 | 12.3%), engineering (57 | 11.4%), and arts & humanities (54 | 10.8%) are the most common fields of study among 502 individuals in Whitmore Village who have obtained a bachelor's degree or higher.
| Field of Study | # Graduates | % Graduates |
| Computers & Mathematics | 39 | 7.8% |
| Bio, Nature & Agricultural | 0 | 0.0% |
| Physical & Health Sciences | 11 | 2.2% |
| Psychology | 19 | 3.8% |
| Social Sciences | 37 | 7.4% |
| Engineering | 57 | 11.4% |
| Multidisciplinary Studies | 0 | 0.0% |
| Science & Technology | 76 | 15.1% |
| Business | 62 | 12.3% |
| Education | 65 | 13.0% |
| Literature & Languages | 35 | 7.0% |
| Liberal Arts & History | 26 | 5.2% |
| Visual & Performing Arts | 9 | 1.8% |
| Communications | 12 | 2.4% |
| Arts & Humanities | 54 | 10.8% |
| Total | 502 | 100.0% |
Transportation & Commute in Whitmore Village
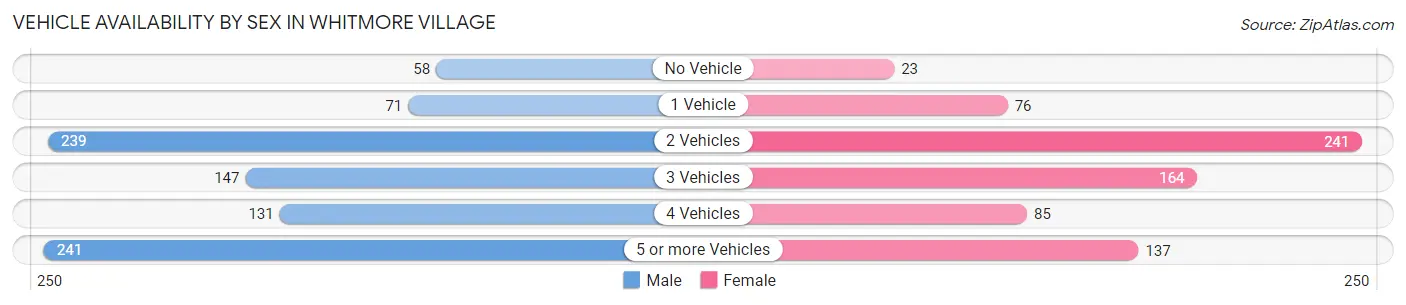
Vehicle Availability by Sex in Whitmore Village
The most prevalent vehicle ownership categories in Whitmore Village are males with 5 or more vehicles (241, accounting for 27.2%) and females with 5 or more vehicles (137, making up 33.2%).
| Vehicles Available | Male | Female |
| No Vehicle | 58 (6.5%) | 23 (3.2%) |
| 1 Vehicle | 71 (8.0%) | 76 (10.5%) |
| 2 Vehicles | 239 (26.9%) | 241 (33.2%) |
| 3 Vehicles | 147 (16.6%) | 164 (22.6%) |
| 4 Vehicles | 131 (14.8%) | 85 (11.7%) |
| 5 or more Vehicles | 241 (27.2%) | 137 (18.9%) |
| Total | 887 (100.0%) | 726 (100.0%) |
Commute Time in Whitmore Village
The most frequently occuring commute durations in Whitmore Village are 30 to 34 minutes (313 commuters, 19.9%), 20 to 24 minutes (239 commuters, 15.2%), and 45 to 59 minutes (219 commuters, 13.9%).
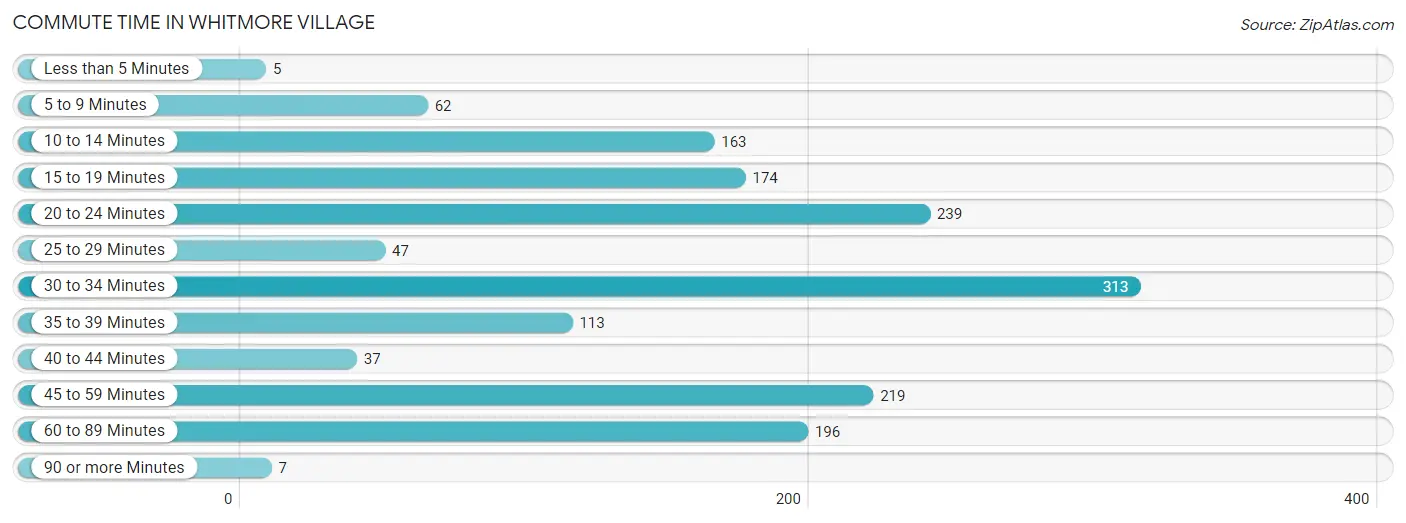
| Commute Time | # Commuters | % Commuters |
| Less than 5 Minutes | 5 | 0.3% |
| 5 to 9 Minutes | 62 | 3.9% |
| 10 to 14 Minutes | 163 | 10.3% |
| 15 to 19 Minutes | 174 | 11.1% |
| 20 to 24 Minutes | 239 | 15.2% |
| 25 to 29 Minutes | 47 | 3.0% |
| 30 to 34 Minutes | 313 | 19.9% |
| 35 to 39 Minutes | 113 | 7.2% |
| 40 to 44 Minutes | 37 | 2.4% |
| 45 to 59 Minutes | 219 | 13.9% |
| 60 to 89 Minutes | 196 | 12.4% |
| 90 or more Minutes | 7 | 0.4% |
Commute Time by Sex in Whitmore Village
The most common commute times in Whitmore Village are 30 to 34 minutes (232 commuters, 26.3%) for males and 20 to 24 minutes (161 commuters, 23.2%) for females.

| Commute Time | Male | Female |
| Less than 5 Minutes | 5 (0.6%) | 0 (0.0%) |
| 5 to 9 Minutes | 9 (1.0%) | 53 (7.6%) |
| 10 to 14 Minutes | 66 (7.5%) | 97 (14.0%) |
| 15 to 19 Minutes | 89 (10.1%) | 85 (12.2%) |
| 20 to 24 Minutes | 78 (8.8%) | 161 (23.2%) |
| 25 to 29 Minutes | 25 (2.8%) | 22 (3.2%) |
| 30 to 34 Minutes | 232 (26.3%) | 81 (11.7%) |
| 35 to 39 Minutes | 42 (4.8%) | 71 (10.2%) |
| 40 to 44 Minutes | 23 (2.6%) | 14 (2.0%) |
| 45 to 59 Minutes | 190 (21.6%) | 29 (4.2%) |
| 60 to 89 Minutes | 122 (13.9%) | 74 (10.7%) |
| 90 or more Minutes | 0 (0.0%) | 7 (1.0%) |
Time of Departure to Work by Sex in Whitmore Village
The most frequent times of departure to work in Whitmore Village are 5:30 AM to 5:59 AM (141, 16.0%) for males and 7:00 AM to 7:29 AM (139, 20.0%) for females.
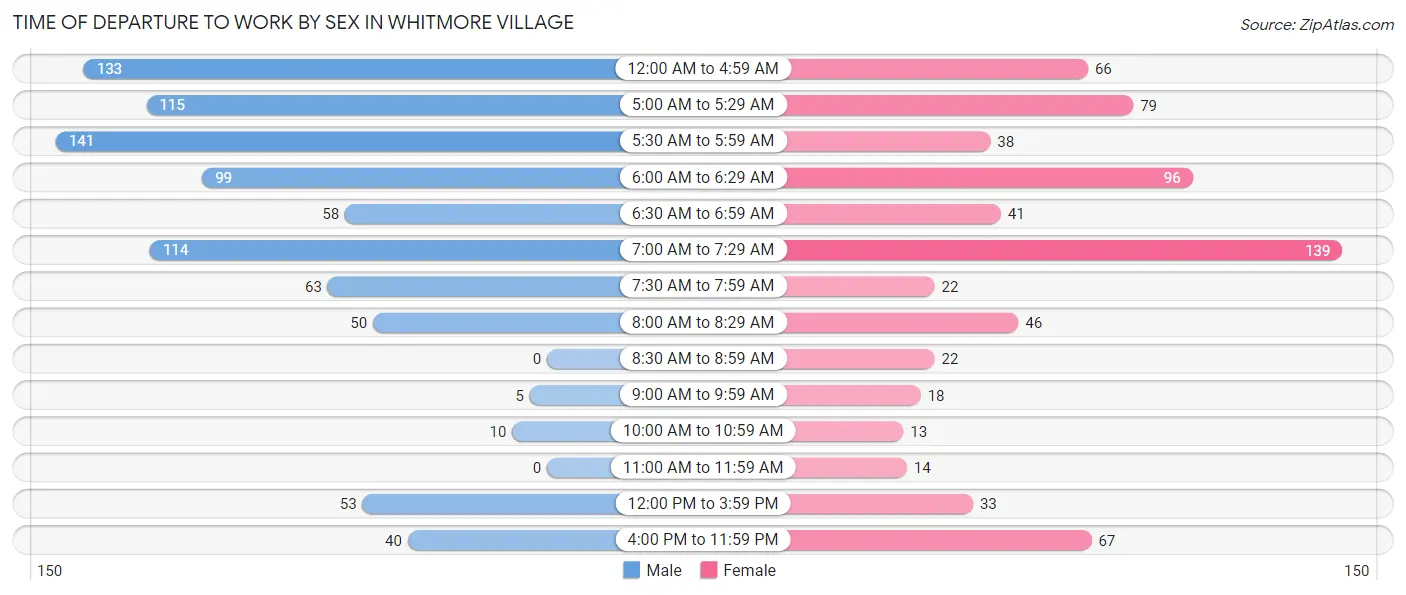
| Time of Departure | Male | Female |
| 12:00 AM to 4:59 AM | 133 (15.1%) | 66 (9.5%) |
| 5:00 AM to 5:29 AM | 115 (13.1%) | 79 (11.4%) |
| 5:30 AM to 5:59 AM | 141 (16.0%) | 38 (5.5%) |
| 6:00 AM to 6:29 AM | 99 (11.2%) | 96 (13.8%) |
| 6:30 AM to 6:59 AM | 58 (6.6%) | 41 (5.9%) |
| 7:00 AM to 7:29 AM | 114 (12.9%) | 139 (20.0%) |
| 7:30 AM to 7:59 AM | 63 (7.1%) | 22 (3.2%) |
| 8:00 AM to 8:29 AM | 50 (5.7%) | 46 (6.6%) |
| 8:30 AM to 8:59 AM | 0 (0.0%) | 22 (3.2%) |
| 9:00 AM to 9:59 AM | 5 (0.6%) | 18 (2.6%) |
| 10:00 AM to 10:59 AM | 10 (1.1%) | 13 (1.9%) |
| 11:00 AM to 11:59 AM | 0 (0.0%) | 14 (2.0%) |
| 12:00 PM to 3:59 PM | 53 (6.0%) | 33 (4.8%) |
| 4:00 PM to 11:59 PM | 40 (4.5%) | 67 (9.7%) |
| Total | 881 (100.0%) | 694 (100.0%) |
Housing Occupancy in Whitmore Village
Occupancy by Ownership in Whitmore Village
Of the total 952 dwellings in Whitmore Village, owner-occupied units account for 664 (69.8%), while renter-occupied units make up 288 (30.2%).
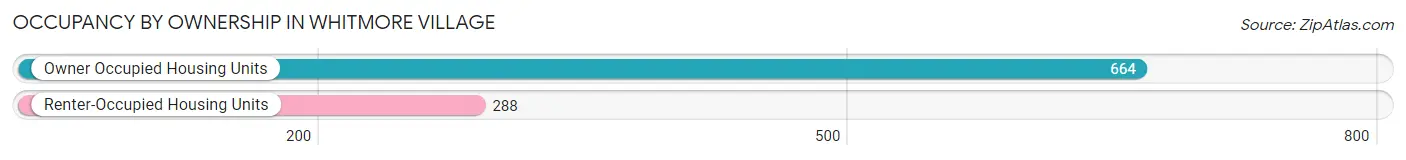
| Occupancy | # Housing Units | % Housing Units |
| Owner Occupied Housing Units | 664 | 69.8% |
| Renter-Occupied Housing Units | 288 | 30.2% |
| Total Occupied Housing Units | 952 | 100.0% |
Occupancy by Household Size in Whitmore Village
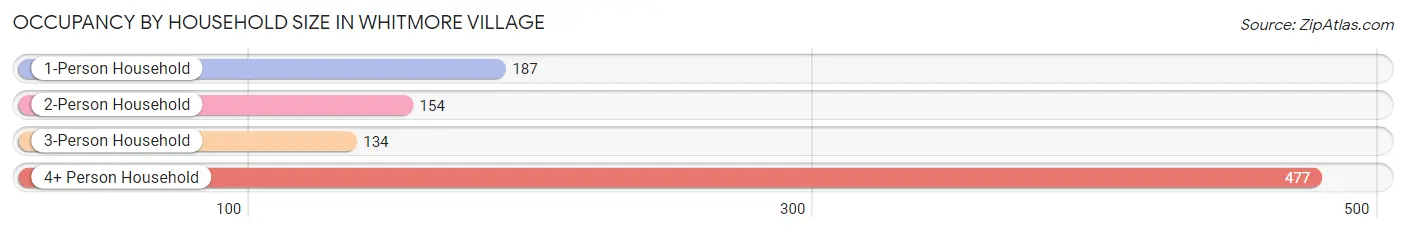
| Household Size | # Housing Units | % Housing Units |
| 1-Person Household | 187 | 19.6% |
| 2-Person Household | 154 | 16.2% |
| 3-Person Household | 134 | 14.1% |
| 4+ Person Household | 477 | 50.1% |
| Total Housing Units | 952 | 100.0% |
Occupancy by Ownership by Household Size in Whitmore Village
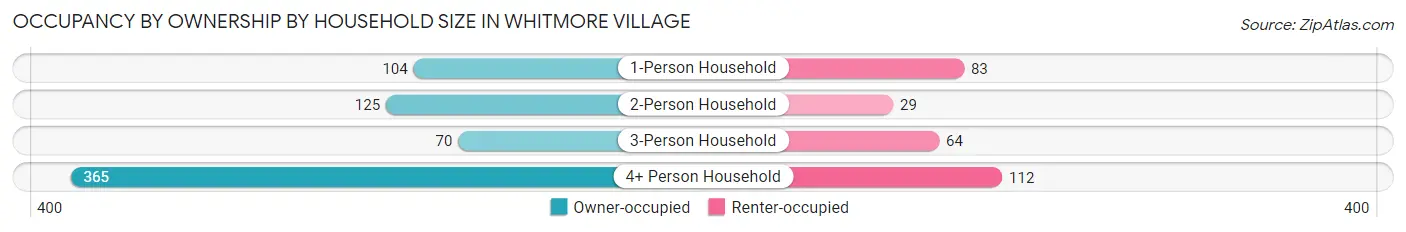
| Household Size | Owner-occupied | Renter-occupied |
| 1-Person Household | 104 (55.6%) | 83 (44.4%) |
| 2-Person Household | 125 (81.2%) | 29 (18.8%) |
| 3-Person Household | 70 (52.2%) | 64 (47.8%) |
| 4+ Person Household | 365 (76.5%) | 112 (23.5%) |
| Total Housing Units | 664 (69.8%) | 288 (30.2%) |
Occupancy by Educational Attainment in Whitmore Village
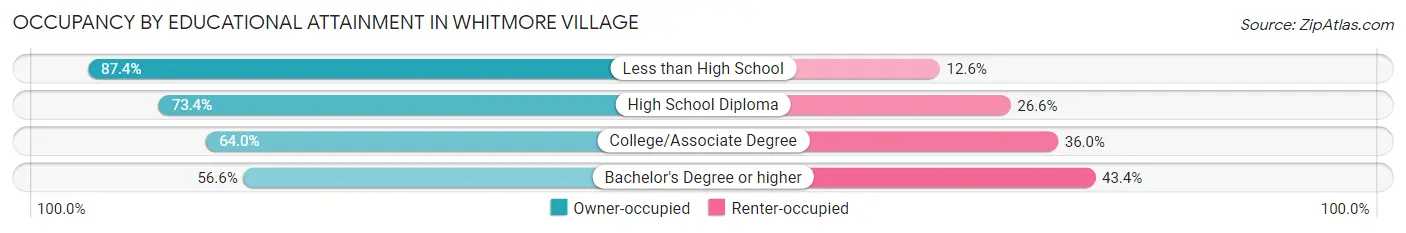
| Household Size | Owner-occupied | Renter-occupied |
| Less than High School | 118 (87.4%) | 17 (12.6%) |
| High School Diploma | 273 (73.4%) | 99 (26.6%) |
| College/Associate Degree | 183 (64.0%) | 103 (36.0%) |
| Bachelor's Degree or higher | 90 (56.6%) | 69 (43.4%) |
Occupancy by Age of Householder in Whitmore Village
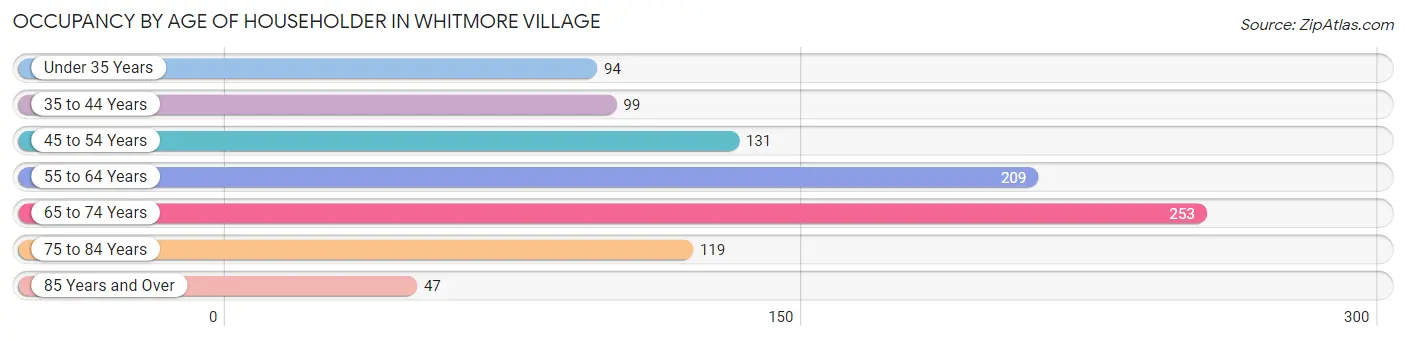
| Age Bracket | # Households | % Households |
| Under 35 Years | 94 | 9.9% |
| 35 to 44 Years | 99 | 10.4% |
| 45 to 54 Years | 131 | 13.8% |
| 55 to 64 Years | 209 | 22.0% |
| 65 to 74 Years | 253 | 26.6% |
| 75 to 84 Years | 119 | 12.5% |
| 85 Years and Over | 47 | 4.9% |
| Total | 952 | 100.0% |
Housing Finances in Whitmore Village
Median Income by Occupancy in Whitmore Village
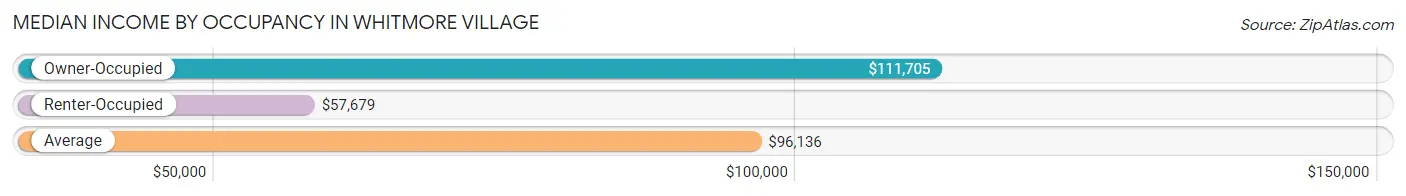
| Occupancy Type | # Households | Median Income |
| Owner-Occupied | 664 (69.8%) | $111,705 |
| Renter-Occupied | 288 (30.2%) | $57,679 |
| Average | 952 (100.0%) | $96,136 |
Occupancy by Householder Income Bracket in Whitmore Village
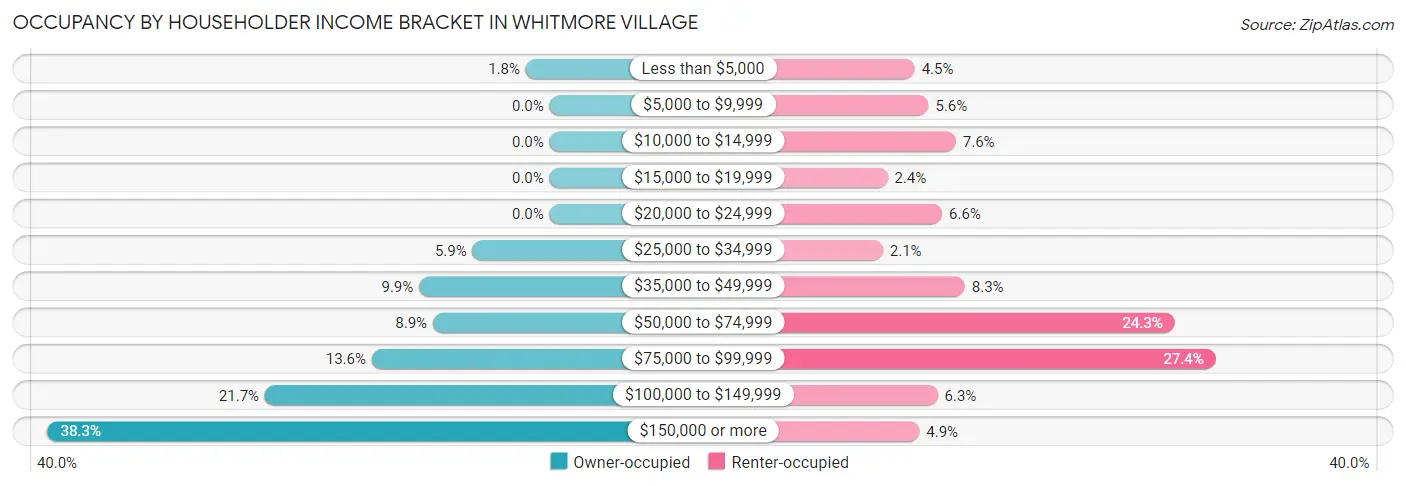
| Income Bracket | Owner-occupied | Renter-occupied |
| Less than $5,000 | 12 (1.8%) | 13 (4.5%) |
| $5,000 to $9,999 | 0 (0.0%) | 16 (5.6%) |
| $10,000 to $14,999 | 0 (0.0%) | 22 (7.6%) |
| $15,000 to $19,999 | 0 (0.0%) | 7 (2.4%) |
| $20,000 to $24,999 | 0 (0.0%) | 19 (6.6%) |
| $25,000 to $34,999 | 39 (5.9%) | 6 (2.1%) |
| $35,000 to $49,999 | 66 (9.9%) | 24 (8.3%) |
| $50,000 to $74,999 | 59 (8.9%) | 70 (24.3%) |
| $75,000 to $99,999 | 90 (13.6%) | 79 (27.4%) |
| $100,000 to $149,999 | 144 (21.7%) | 18 (6.2%) |
| $150,000 or more | 254 (38.3%) | 14 (4.9%) |
| Total | 664 (100.0%) | 288 (100.0%) |
Monthly Housing Cost Tiers in Whitmore Village
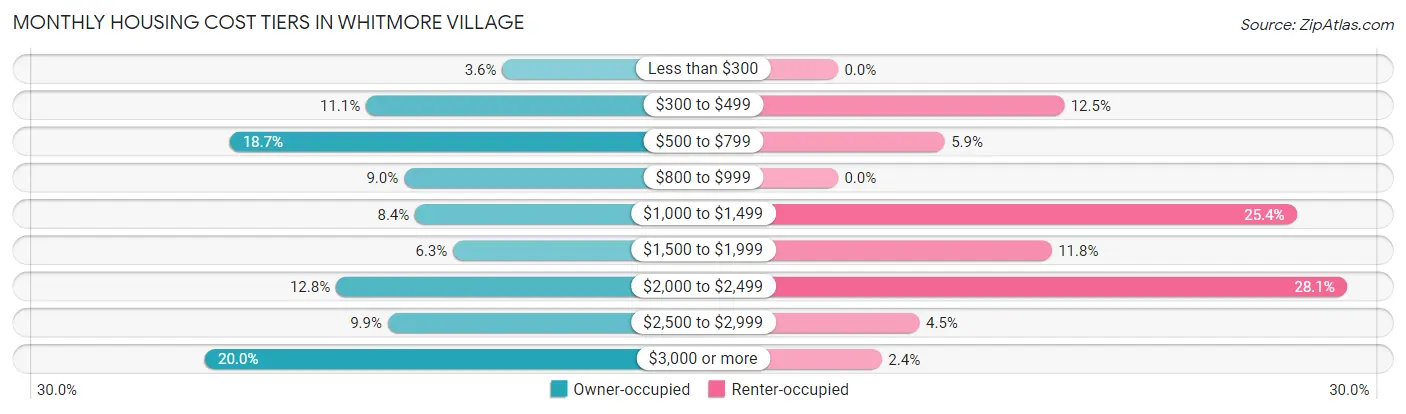
| Monthly Cost | Owner-occupied | Renter-occupied |
| Less than $300 | 24 (3.6%) | 0 (0.0%) |
| $300 to $499 | 74 (11.1%) | 36 (12.5%) |
| $500 to $799 | 124 (18.7%) | 17 (5.9%) |
| $800 to $999 | 60 (9.0%) | 0 (0.0%) |
| $1,000 to $1,499 | 56 (8.4%) | 73 (25.4%) |
| $1,500 to $1,999 | 42 (6.3%) | 34 (11.8%) |
| $2,000 to $2,499 | 85 (12.8%) | 81 (28.1%) |
| $2,500 to $2,999 | 66 (9.9%) | 13 (4.5%) |
| $3,000 or more | 133 (20.0%) | 7 (2.4%) |
| Total | 664 (100.0%) | 288 (100.0%) |
Physical Housing Characteristics in Whitmore Village
Housing Structures in Whitmore Village
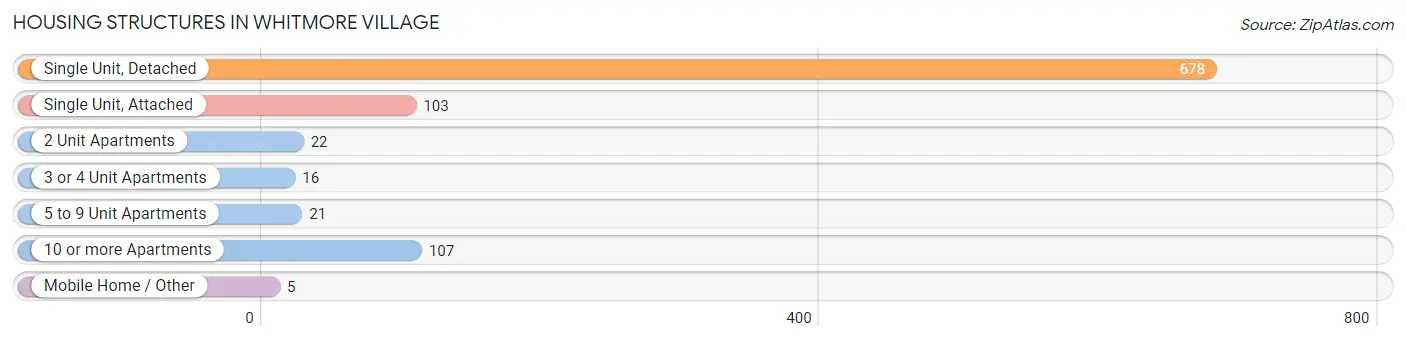
| Structure Type | # Housing Units | % Housing Units |
| Single Unit, Detached | 678 | 71.2% |
| Single Unit, Attached | 103 | 10.8% |
| 2 Unit Apartments | 22 | 2.3% |
| 3 or 4 Unit Apartments | 16 | 1.7% |
| 5 to 9 Unit Apartments | 21 | 2.2% |
| 10 or more Apartments | 107 | 11.2% |
| Mobile Home / Other | 5 | 0.5% |
| Total | 952 | 100.0% |
Housing Structures by Occupancy in Whitmore Village
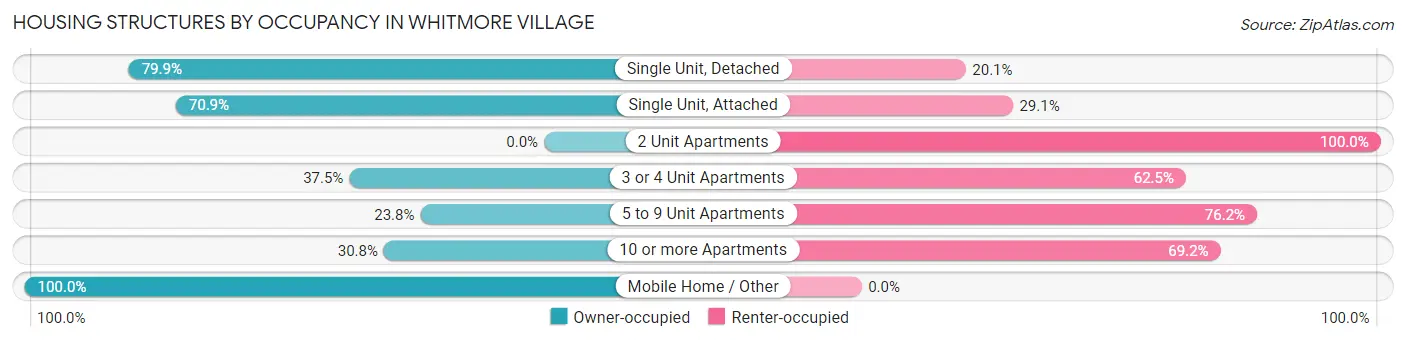
| Structure Type | Owner-occupied | Renter-occupied |
| Single Unit, Detached | 542 (79.9%) | 136 (20.1%) |
| Single Unit, Attached | 73 (70.9%) | 30 (29.1%) |
| 2 Unit Apartments | 0 (0.0%) | 22 (100.0%) |
| 3 or 4 Unit Apartments | 6 (37.5%) | 10 (62.5%) |
| 5 to 9 Unit Apartments | 5 (23.8%) | 16 (76.2%) |
| 10 or more Apartments | 33 (30.8%) | 74 (69.2%) |
| Mobile Home / Other | 5 (100.0%) | 0 (0.0%) |
| Total | 664 (69.8%) | 288 (30.2%) |
Housing Structures by Number of Rooms in Whitmore Village
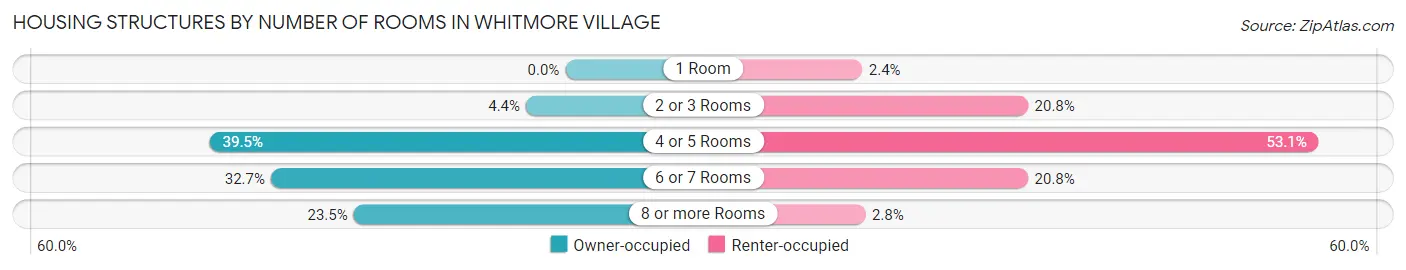
| Number of Rooms | Owner-occupied | Renter-occupied |
| 1 Room | 0 (0.0%) | 7 (2.4%) |
| 2 or 3 Rooms | 29 (4.4%) | 60 (20.8%) |
| 4 or 5 Rooms | 262 (39.5%) | 153 (53.1%) |
| 6 or 7 Rooms | 217 (32.7%) | 60 (20.8%) |
| 8 or more Rooms | 156 (23.5%) | 8 (2.8%) |
| Total | 664 (100.0%) | 288 (100.0%) |
Housing Structure by Heating Type in Whitmore Village
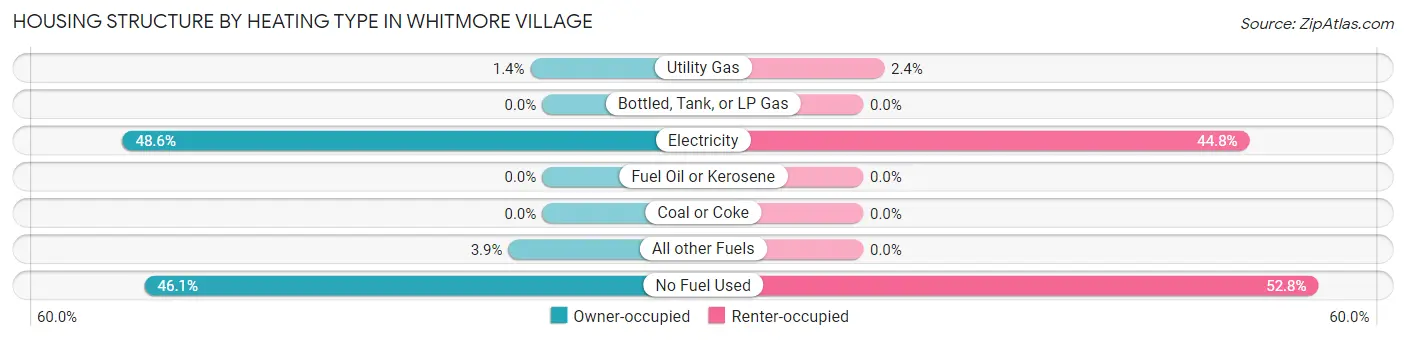
| Heating Type | Owner-occupied | Renter-occupied |
| Utility Gas | 9 (1.4%) | 7 (2.4%) |
| Bottled, Tank, or LP Gas | 0 (0.0%) | 0 (0.0%) |
| Electricity | 323 (48.6%) | 129 (44.8%) |
| Fuel Oil or Kerosene | 0 (0.0%) | 0 (0.0%) |
| Coal or Coke | 0 (0.0%) | 0 (0.0%) |
| All other Fuels | 26 (3.9%) | 0 (0.0%) |
| No Fuel Used | 306 (46.1%) | 152 (52.8%) |
| Total | 664 (100.0%) | 288 (100.0%) |
Household Vehicle Usage in Whitmore Village
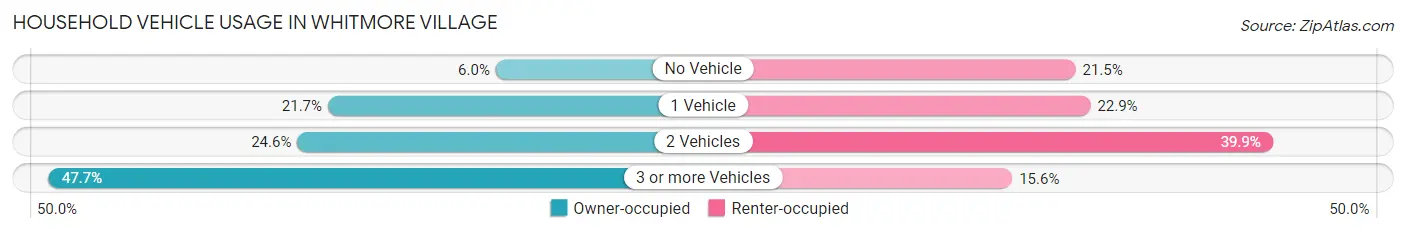
| Vehicles per Household | Owner-occupied | Renter-occupied |
| No Vehicle | 40 (6.0%) | 62 (21.5%) |
| 1 Vehicle | 144 (21.7%) | 66 (22.9%) |
| 2 Vehicles | 163 (24.5%) | 115 (39.9%) |
| 3 or more Vehicles | 317 (47.7%) | 45 (15.6%) |
| Total | 664 (100.0%) | 288 (100.0%) |
Real Estate & Mortgages in Whitmore Village
Real Estate and Mortgage Overview in Whitmore Village
| Characteristic | Without Mortgage | With Mortgage |
| Housing Units | 264 | 400 |
| Median Property Value | $778,100 | $676,600 |
| Median Household Income | $110,469 | $162 |
| Monthly Housing Costs | $597 | $133 |
| Real Estate Taxes | $1,868 | $27 |
Property Value by Mortgage Status in Whitmore Village
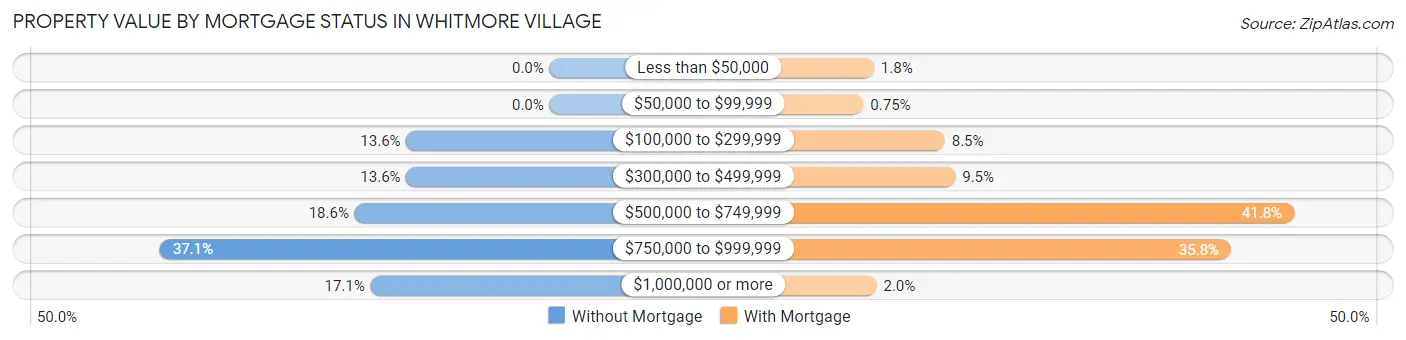
| Property Value | Without Mortgage | With Mortgage |
| Less than $50,000 | 0 (0.0%) | 7 (1.8%) |
| $50,000 to $99,999 | 0 (0.0%) | 3 (0.7%) |
| $100,000 to $299,999 | 36 (13.6%) | 34 (8.5%) |
| $300,000 to $499,999 | 36 (13.6%) | 38 (9.5%) |
| $500,000 to $749,999 | 49 (18.6%) | 167 (41.7%) |
| $750,000 to $999,999 | 98 (37.1%) | 143 (35.7%) |
| $1,000,000 or more | 45 (17.1%) | 8 (2.0%) |
| Total | 264 (100.0%) | 400 (100.0%) |
Household Income by Mortgage Status in Whitmore Village
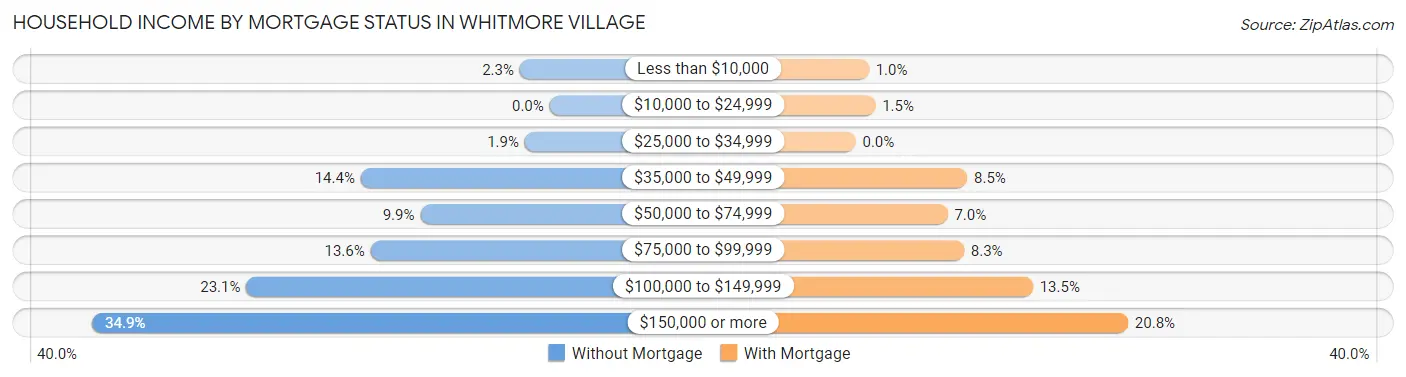
| Household Income | Without Mortgage | With Mortgage |
| Less than $10,000 | 6 (2.3%) | 4 (1.0%) |
| $10,000 to $24,999 | 0 (0.0%) | 6 (1.5%) |
| $25,000 to $34,999 | 5 (1.9%) | 0 (0.0%) |
| $35,000 to $49,999 | 38 (14.4%) | 34 (8.5%) |
| $50,000 to $74,999 | 26 (9.9%) | 28 (7.0%) |
| $75,000 to $99,999 | 36 (13.6%) | 33 (8.3%) |
| $100,000 to $149,999 | 61 (23.1%) | 54 (13.5%) |
| $150,000 or more | 92 (34.8%) | 83 (20.7%) |
| Total | 264 (100.0%) | 400 (100.0%) |
Property Value to Household Income Ratio in Whitmore Village
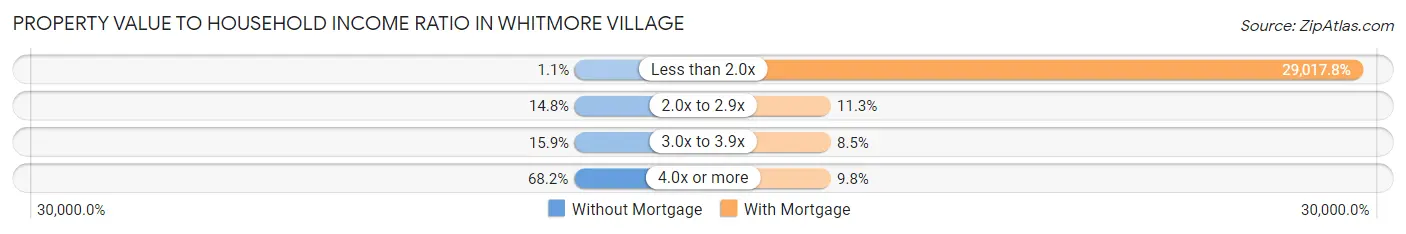
| Value-to-Income Ratio | Without Mortgage | With Mortgage |
| Less than 2.0x | 3 (1.1%) | 116,071 (29,017.8%) |
| 2.0x to 2.9x | 39 (14.8%) | 45 (11.3%) |
| 3.0x to 3.9x | 42 (15.9%) | 34 (8.5%) |
| 4.0x or more | 180 (68.2%) | 39 (9.8%) |
| Total | 264 (100.0%) | 400 (100.0%) |
Real Estate Taxes by Mortgage Status in Whitmore Village
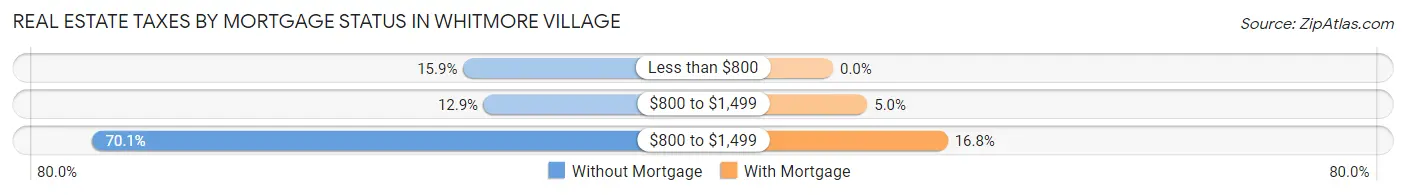
| Property Taxes | Without Mortgage | With Mortgage |
| Less than $800 | 42 (15.9%) | 0 (0.0%) |
| $800 to $1,499 | 34 (12.9%) | 20 (5.0%) |
| $800 to $1,499 | 185 (70.1%) | 67 (16.8%) |
| Total | 264 (100.0%) | 400 (100.0%) |
Health & Disability in Whitmore Village
Health Insurance Coverage by Age in Whitmore Village
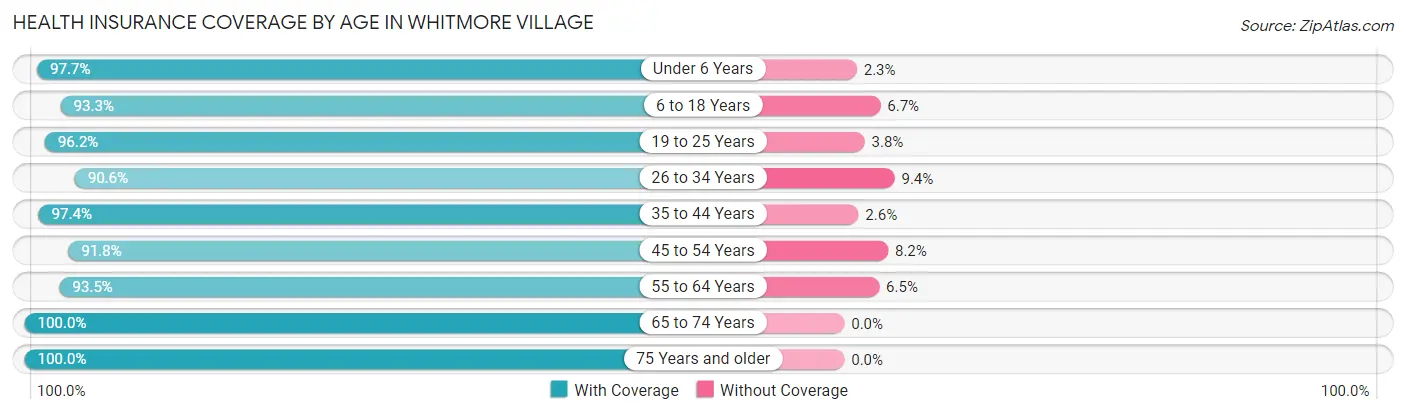
| Age Bracket | With Coverage | Without Coverage |
| Under 6 Years | 294 (97.7%) | 7 (2.3%) |
| 6 to 18 Years | 582 (93.3%) | 42 (6.7%) |
| 19 to 25 Years | 254 (96.2%) | 10 (3.8%) |
| 26 to 34 Years | 445 (90.6%) | 46 (9.4%) |
| 35 to 44 Years | 333 (97.4%) | 9 (2.6%) |
| 45 to 54 Years | 473 (91.8%) | 42 (8.2%) |
| 55 to 64 Years | 403 (93.5%) | 28 (6.5%) |
| 65 to 74 Years | 493 (100.0%) | 0 (0.0%) |
| 75 Years and older | 443 (100.0%) | 0 (0.0%) |
| Total | 3,720 (95.3%) | 184 (4.7%) |
Health Insurance Coverage by Citizenship Status in Whitmore Village
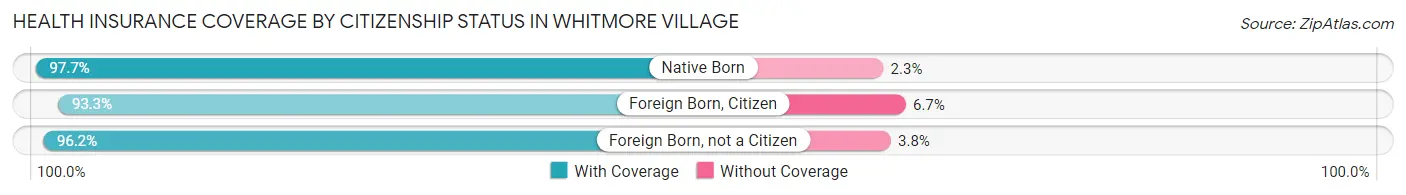
| Citizenship Status | With Coverage | Without Coverage |
| Native Born | 294 (97.7%) | 7 (2.3%) |
| Foreign Born, Citizen | 582 (93.3%) | 42 (6.7%) |
| Foreign Born, not a Citizen | 254 (96.2%) | 10 (3.8%) |
Health Insurance Coverage by Household Income in Whitmore Village
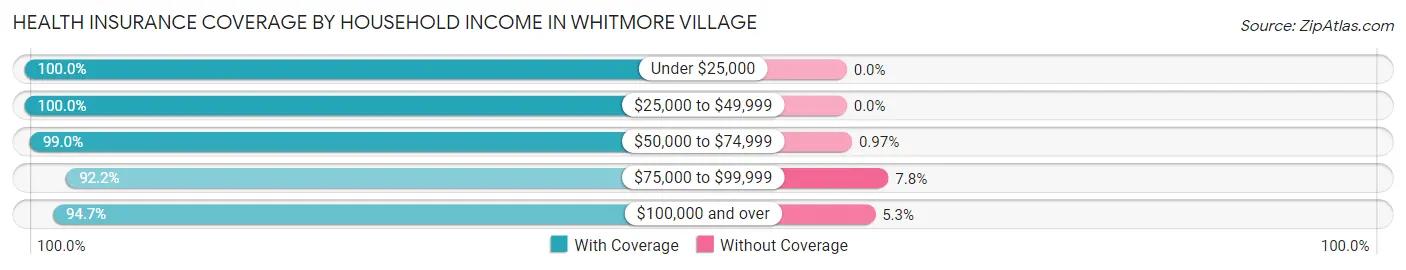
| Household Income | With Coverage | Without Coverage |
| Under $25,000 | 133 (100.0%) | 0 (0.0%) |
| $25,000 to $49,999 | 255 (100.0%) | 0 (0.0%) |
| $50,000 to $74,999 | 407 (99.0%) | 4 (1.0%) |
| $75,000 to $99,999 | 615 (92.2%) | 52 (7.8%) |
| $100,000 and over | 2,280 (94.7%) | 128 (5.3%) |
Public vs Private Health Insurance Coverage by Age in Whitmore Village
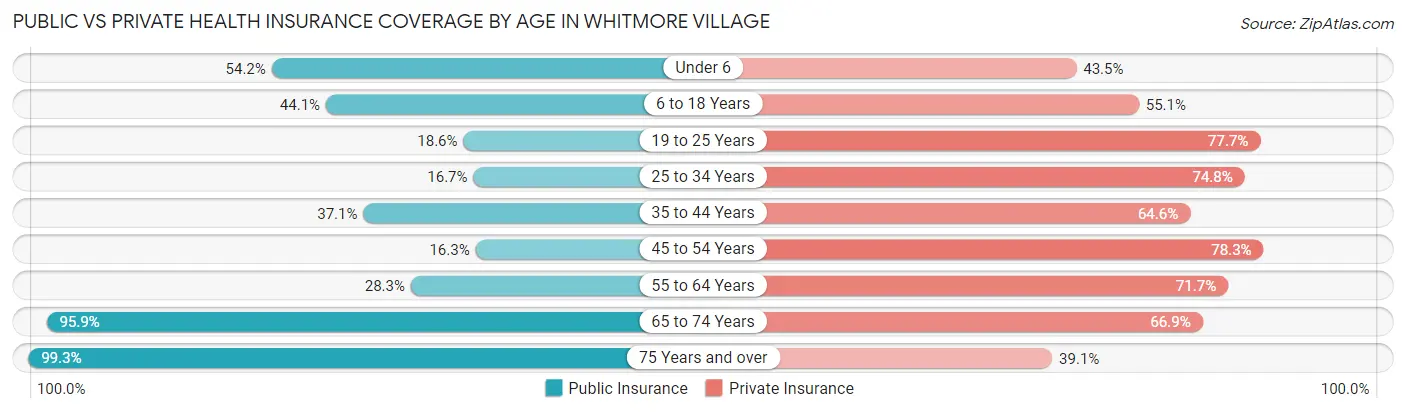
| Age Bracket | Public Insurance | Private Insurance |
| Under 6 | 163 (54.1%) | 131 (43.5%) |
| 6 to 18 Years | 275 (44.1%) | 344 (55.1%) |
| 19 to 25 Years | 49 (18.6%) | 205 (77.6%) |
| 25 to 34 Years | 82 (16.7%) | 367 (74.8%) |
| 35 to 44 Years | 127 (37.1%) | 221 (64.6%) |
| 45 to 54 Years | 84 (16.3%) | 403 (78.2%) |
| 55 to 64 Years | 122 (28.3%) | 309 (71.7%) |
| 65 to 74 Years | 473 (95.9%) | 330 (66.9%) |
| 75 Years and over | 440 (99.3%) | 173 (39.1%) |
| Total | 1,815 (46.5%) | 2,483 (63.6%) |
Disability Status by Sex by Age in Whitmore Village
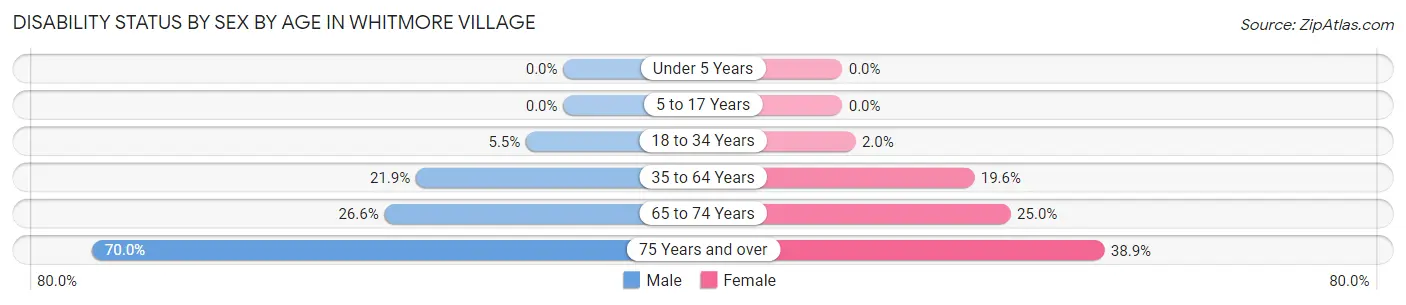
| Age Bracket | Male | Female |
| Under 5 Years | 0 (0.0%) | 0 (0.0%) |
| 5 to 17 Years | 0 (0.0%) | 0 (0.0%) |
| 18 to 34 Years | 25 (5.5%) | 7 (1.9%) |
| 35 to 64 Years | 150 (21.9%) | 118 (19.6%) |
| 65 to 74 Years | 81 (26.6%) | 47 (25.0%) |
| 75 Years and over | 168 (70.0%) | 79 (38.9%) |
Disability Class by Sex by Age in Whitmore Village
Disability Class: Hearing Difficulty
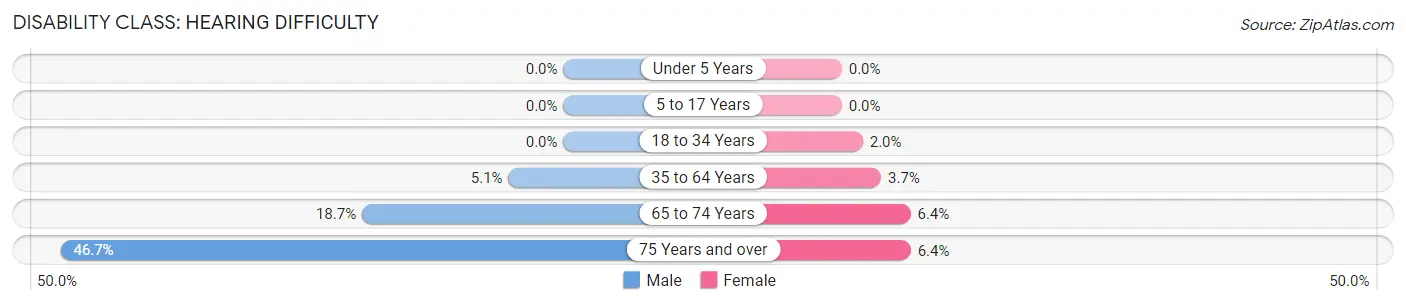
| Age Bracket | Male | Female |
| Under 5 Years | 0 (0.0%) | 0 (0.0%) |
| 5 to 17 Years | 0 (0.0%) | 0 (0.0%) |
| 18 to 34 Years | 0 (0.0%) | 7 (1.9%) |
| 35 to 64 Years | 35 (5.1%) | 22 (3.6%) |
| 65 to 74 Years | 57 (18.7%) | 12 (6.4%) |
| 75 Years and over | 112 (46.7%) | 13 (6.4%) |
Disability Class: Vision Difficulty
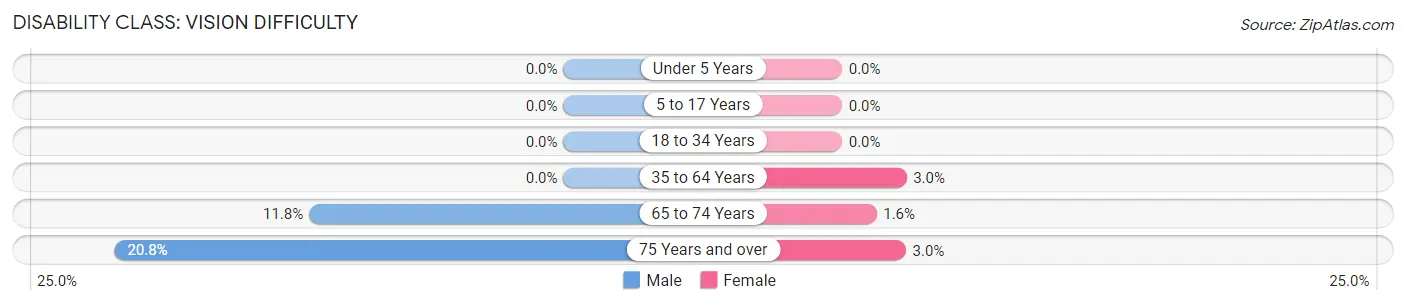
| Age Bracket | Male | Female |
| Under 5 Years | 0 (0.0%) | 0 (0.0%) |
| 5 to 17 Years | 0 (0.0%) | 0 (0.0%) |
| 18 to 34 Years | 0 (0.0%) | 0 (0.0%) |
| 35 to 64 Years | 0 (0.0%) | 18 (3.0%) |
| 65 to 74 Years | 36 (11.8%) | 3 (1.6%) |
| 75 Years and over | 50 (20.8%) | 6 (3.0%) |
Disability Class: Cognitive Difficulty
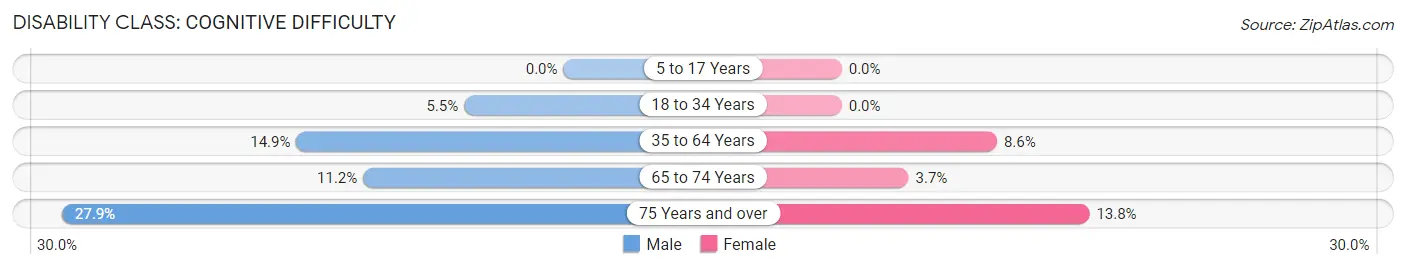
| Age Bracket | Male | Female |
| 5 to 17 Years | 0 (0.0%) | 0 (0.0%) |
| 18 to 34 Years | 25 (5.5%) | 0 (0.0%) |
| 35 to 64 Years | 102 (14.9%) | 52 (8.6%) |
| 65 to 74 Years | 34 (11.2%) | 7 (3.7%) |
| 75 Years and over | 67 (27.9%) | 28 (13.8%) |
Disability Class: Ambulatory Difficulty
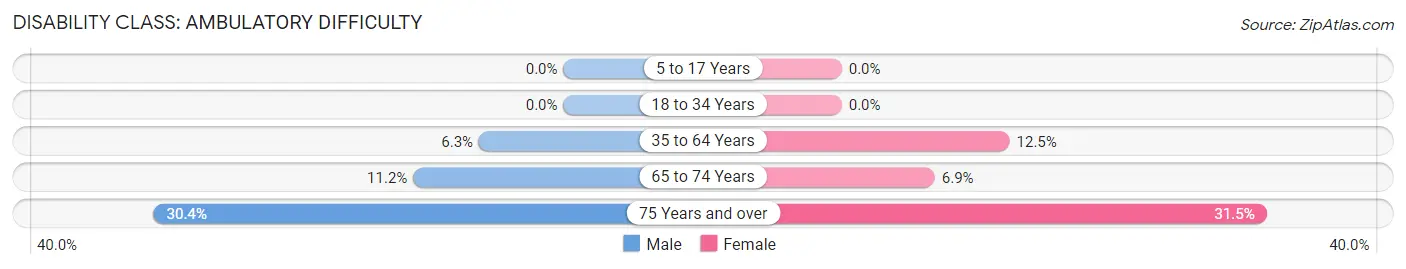
| Age Bracket | Male | Female |
| 5 to 17 Years | 0 (0.0%) | 0 (0.0%) |
| 18 to 34 Years | 0 (0.0%) | 0 (0.0%) |
| 35 to 64 Years | 43 (6.3%) | 75 (12.5%) |
| 65 to 74 Years | 34 (11.2%) | 13 (6.9%) |
| 75 Years and over | 73 (30.4%) | 64 (31.5%) |
Disability Class: Self-Care Difficulty
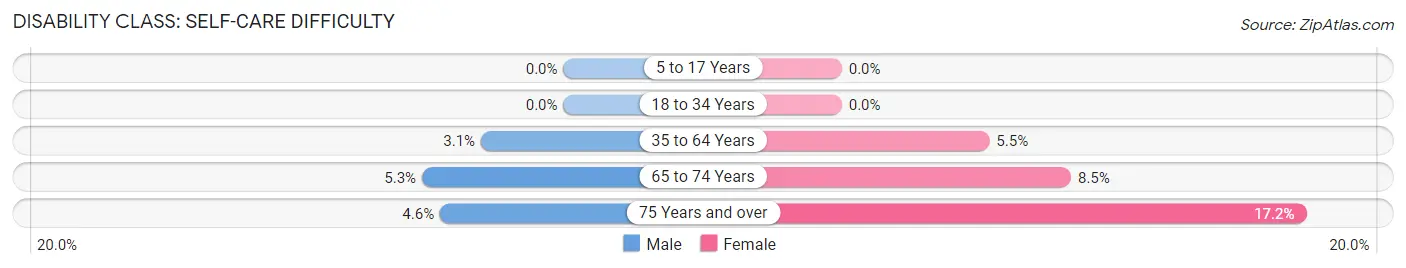
| Age Bracket | Male | Female |
| 5 to 17 Years | 0 (0.0%) | 0 (0.0%) |
| 18 to 34 Years | 0 (0.0%) | 0 (0.0%) |
| 35 to 64 Years | 21 (3.1%) | 33 (5.5%) |
| 65 to 74 Years | 16 (5.2%) | 16 (8.5%) |
| 75 Years and over | 11 (4.6%) | 35 (17.2%) |
Technology Access in Whitmore Village
Computing Device Access in Whitmore Village
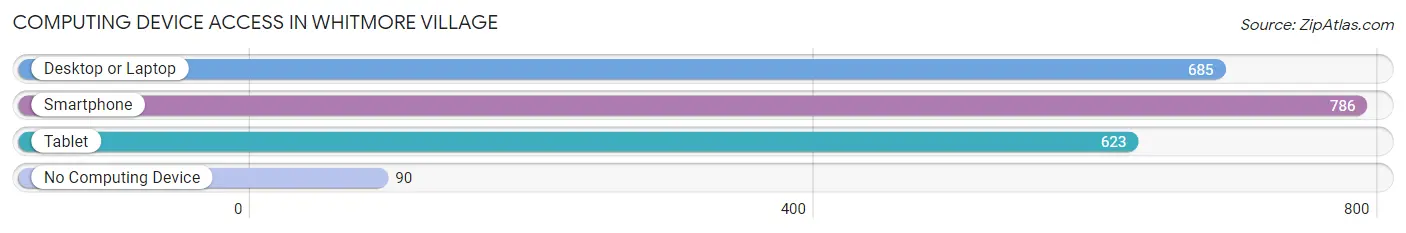
| Device Type | # Households | % Households |
| Desktop or Laptop | 685 | 72.0% |
| Smartphone | 786 | 82.6% |
| Tablet | 623 | 65.4% |
| No Computing Device | 90 | 9.5% |
| Total | 952 | 100.0% |
Internet Access in Whitmore Village
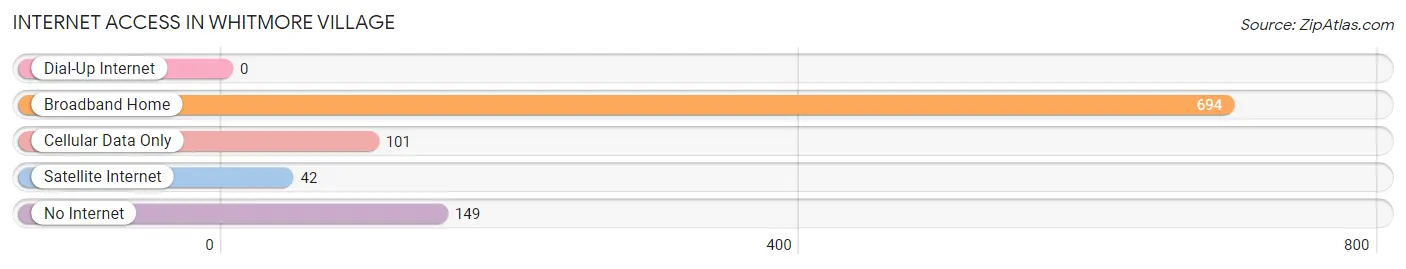
| Internet Type | # Households | % Households |
| Dial-Up Internet | 0 | 0.0% |
| Broadband Home | 694 | 72.9% |
| Cellular Data Only | 101 | 10.6% |
| Satellite Internet | 42 | 4.4% |
| No Internet | 149 | 15.7% |
| Total | 952 | 100.0% |
Whitmore Village Summary
Whitmore Village is a small unincorporated community located in the Hawaiian island of Oahu. It is located in the Waianae District of Honolulu County and is part of the Ewa Beach-Kapolei-Makakilo census-designated place. The population of Whitmore Village was 1,845 at the 2010 census.
History
Whitmore Village was originally established in the late 1800s as a sugar plantation. The plantation was owned by the Whitmore family, who were originally from Massachusetts. The plantation was successful and the family built a large home on the property. The plantation was eventually sold to the Hawaiian Sugar Planters' Association in the early 1900s. The plantation was then converted into a residential community and the Whitmore family home was converted into a community center.
Geography
Whitmore Village is located on the western side of Oahu, approximately 20 miles from Honolulu. It is situated in the Waianae District of Honolulu County and is part of the Ewa Beach-Kapolei-Makakilo census-designated place. The community is bordered by the Waianae Mountains to the east and the Pacific Ocean to the west. The terrain is mostly flat and the climate is tropical.
Economy
The economy of Whitmore Village is largely based on tourism and agriculture. The community is home to several small businesses, including restaurants, shops, and a few small hotels. Agriculture is also an important part of the local economy, with the main crops being sugar cane, pineapple, and macadamia nuts.
Demographics
As of the 2010 census, the population of Whitmore Village was 1,845. The racial makeup of the community was 57.3% White, 22.2% Native Hawaiian or Pacific Islander, 11.2% Asian, 6.2% from other races, and 3.1% from two or more races. The median household income was $50,945, and the median age was 37.7 years.
Conclusion
Whitmore Village is a small unincorporated community located in the Hawaiian island of Oahu. It is situated in the Waianae District of Honolulu County and is part of the Ewa Beach-Kapolei-Makakilo census-designated place. The population of Whitmore Village was 1,845 at the 2010 census. The economy of Whitmore Village is largely based on tourism and agriculture, and the racial makeup of the community is mostly White, Native Hawaiian or Pacific Islander, and Asian. The median household income was $50,945, and the median age was 37.7 years.
Common Questions
What is Per Capita Income in Whitmore Village?
Per Capita income in Whitmore Village is $35,181.
What is the Median Family Income in Whitmore Village?
Median Family Income in Whitmore Village is $102,708.
What is the Median Household income in Whitmore Village?
Median Household Income in Whitmore Village is $96,136.
What is Income or Wage Gap in Whitmore Village?
Income or Wage Gap in Whitmore Village is 3.9%.
Women in Whitmore Village earn 96.1 cents for every dollar earned by a man.
What is Inequality or Gini Index in Whitmore Village?
Inequality or Gini Index in Whitmore Village is 0.46.
What is the Total Population of Whitmore Village?
Total Population of Whitmore Village is 3,909.
What is the Total Male Population of Whitmore Village?
Total Male Population of Whitmore Village is 2,161.
What is the Total Female Population of Whitmore Village?
Total Female Population of Whitmore Village is 1,748.
What is the Ratio of Males per 100 Females in Whitmore Village?
There are 123.63 Males per 100 Females in Whitmore Village.
What is the Ratio of Females per 100 Males in Whitmore Village?
There are 80.89 Females per 100 Males in Whitmore Village.
What is the Median Population Age in Whitmore Village?
Median Population Age in Whitmore Village is 42.1 Years.
What is the Average Family Size in Whitmore Village
Average Family Size in Whitmore Village is 4.5 People.
What is the Average Household Size in Whitmore Village
Average Household Size in Whitmore Village is 4.1 People.
How Large is the Labor Force in Whitmore Village?
There are 1,771 People in the Labor Forcein in Whitmore Village.
What is the Percentage of People in the Labor Force in Whitmore Village?
57.0% of People are in the Labor Force in Whitmore Village.
What is the Unemployment Rate in Whitmore Village?
Unemployment Rate in Whitmore Village is 3.5%.