Maalaea, HI Map & Demographics
Maalaea Map
Maalaea Overview
$88,395
PER CAPITA INCOME
$153,000
AVG FAMILY INCOME
$101,250
AVG HOUSEHOLD INCOME
6.5%
WAGE / INCOME GAP [ % ]
93.5¢/ $1
WAGE / INCOME GAP [ $ ]
0.47
INEQUALITY / GINI INDEX
214
TOTAL POPULATION
114
MALE POPULATION
100
FEMALE POPULATION
114.00
MALES / 100 FEMALES
87.72
FEMALES / 100 MALES
67.3
MEDIAN AGE
1.9
AVG FAMILY SIZE
1.5
AVG HOUSEHOLD SIZE
96
LABOR FORCE [ PEOPLE ]
45.5%
PERCENT IN LABOR FORCE
16.3%
UNEMPLOYMENT RATE
Income in Maalaea
Income Overview in Maalaea
Per Capita Income in Maalaea is $88,395, while median incomes of families and households are $153,000 and $101,250 respectively.
| Characteristic | Number | Measure |
| Per Capita Income | 214 | $88,395 |
| Median Family Income | 62 | $153,000 |
| Mean Family Income | 62 | $163,203 |
| Median Household Income | 142 | $101,250 |
| Mean Household Income | 142 | $136,173 |
| Income Deficit | 62 | $0 |
| Wage / Income Gap (%) | 214 | 6.53% |
| Wage / Income Gap ($) | 214 | 93.47¢ per $1 |
| Gini / Inequality Index | 214 | 0.47 |
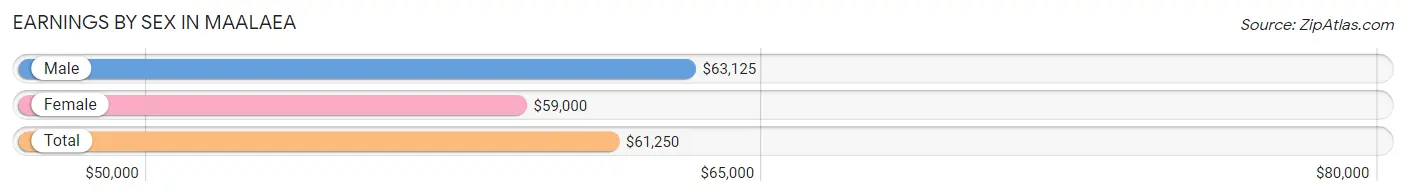
Earnings by Sex in Maalaea
Average Earnings in Maalaea are $61,250, $63,125 for men and $59,000 for women, a difference of 6.5%.
| Sex | Number | Average Earnings |
| Male | 54 (54.0%) | $63,125 |
| Female | 46 (46.0%) | $59,000 |
| Total | 100 (100.0%) | $61,250 |
Earnings by Sex by Income Bracket in Maalaea
The most common earnings brackets in Maalaea are $100,000+ for men (13 | 24.1%) and $65,000 to $74,999 for women (12 | 26.1%).

| Income | Male | Female |
| $2,499 or less | 6 (11.1%) | 6 (13.0%) |
| $2,500 to $4,999 | 0 (0.0%) | 0 (0.0%) |
| $5,000 to $7,499 | 0 (0.0%) | 2 (4.3%) |
| $7,500 to $9,999 | 2 (3.7%) | 1 (2.2%) |
| $10,000 to $12,499 | 0 (0.0%) | 1 (2.2%) |
| $12,500 to $14,999 | 0 (0.0%) | 0 (0.0%) |
| $15,000 to $17,499 | 1 (1.8%) | 0 (0.0%) |
| $17,500 to $19,999 | 0 (0.0%) | 0 (0.0%) |
| $20,000 to $22,499 | 0 (0.0%) | 0 (0.0%) |
| $22,500 to $24,999 | 0 (0.0%) | 1 (2.2%) |
| $25,000 to $29,999 | 3 (5.6%) | 0 (0.0%) |
| $30,000 to $34,999 | 0 (0.0%) | 0 (0.0%) |
| $35,000 to $39,999 | 0 (0.0%) | 0 (0.0%) |
| $40,000 to $44,999 | 2 (3.7%) | 4 (8.7%) |
| $45,000 to $49,999 | 6 (11.1%) | 2 (4.3%) |
| $50,000 to $54,999 | 2 (3.7%) | 3 (6.5%) |
| $55,000 to $64,999 | 8 (14.8%) | 5 (10.9%) |
| $65,000 to $74,999 | 2 (3.7%) | 12 (26.1%) |
| $75,000 to $99,999 | 9 (16.7%) | 6 (13.0%) |
| $100,000+ | 13 (24.1%) | 3 (6.5%) |
| Total | 54 (100.0%) | 46 (100.0%) |
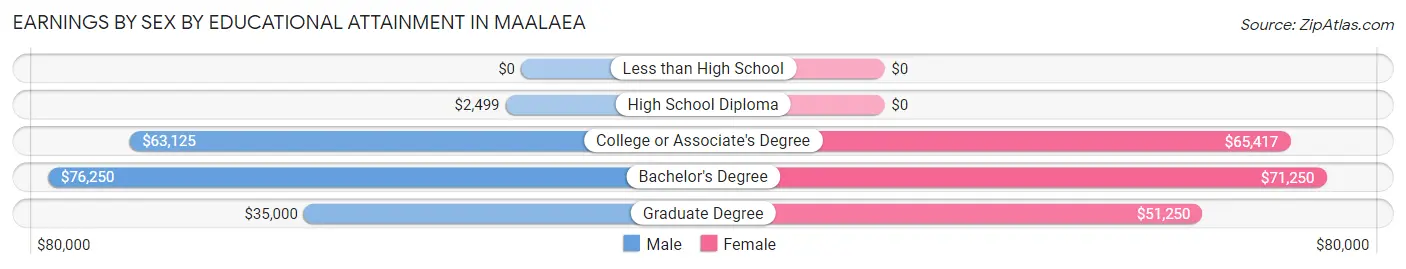
Earnings by Sex by Educational Attainment in Maalaea
Average earnings in Maalaea are $63,125 for men and $59,000 for women, a difference of 6.5%. Men with an educational attainment of bachelor's degree enjoy the highest average annual earnings of $76,250, while those with high school diploma education earn the least with $2,499. Women with an educational attainment of bachelor's degree earn the most with the average annual earnings of $71,250, while those with graduate degree education have the smallest earnings of $51,250.
| Educational Attainment | Male Income | Female Income |
| Less than High School | - | - |
| High School Diploma | $2,499 | $0 |
| College or Associate's Degree | $63,125 | $65,417 |
| Bachelor's Degree | $76,250 | $71,250 |
| Graduate Degree | $35,000 | $51,250 |
| Total | $63,125 | $59,000 |
Family Income in Maalaea
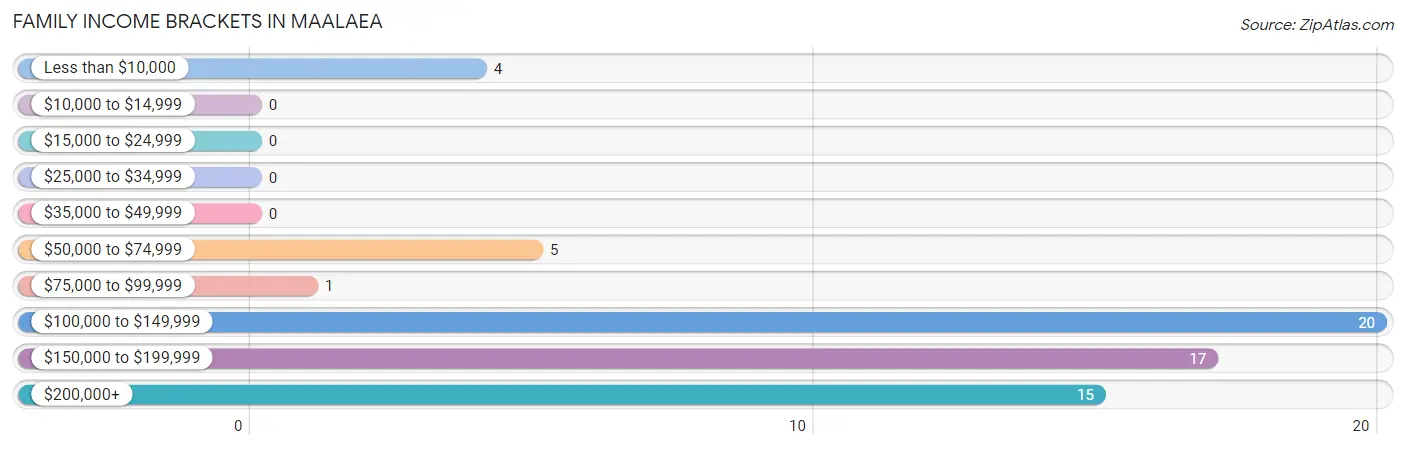
Family Income Brackets in Maalaea
According to the Maalaea family income data, there are 20 families falling into the $100,000 to $149,999 income range, which is the most common income bracket and makes up 32.3% of all families.
| Income Bracket | # Families | % Families |
| Less than $10,000 | 4 | 6.5% |
| $10,000 to $14,999 | 0 | 0.0% |
| $15,000 to $24,999 | 0 | 0.0% |
| $25,000 to $34,999 | 0 | 0.0% |
| $35,000 to $49,999 | 0 | 0.0% |
| $50,000 to $74,999 | 5 | 8.1% |
| $75,000 to $99,999 | 1 | 1.6% |
| $100,000 to $149,999 | 20 | 32.3% |
| $150,000 to $199,999 | 17 | 27.4% |
| $200,000+ | 15 | 24.2% |
Family Income by Famaliy Size in Maalaea
2-person families (56 | 90.3%) account for the highest median family income in Maalaea with $132,500 per family, while 2-person families (56 | 90.3%) have the highest median income of $66,250 per family member.
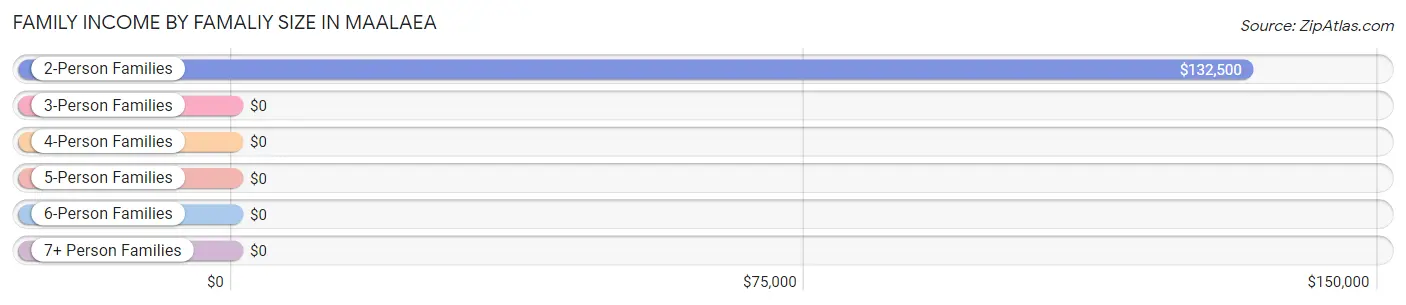
| Income Bracket | # Families | Median Income |
| 2-Person Families | 56 (90.3%) | $132,500 |
| 3-Person Families | 6 (9.7%) | $0 |
| 4-Person Families | 0 (0.0%) | $0 |
| 5-Person Families | 0 (0.0%) | $0 |
| 6-Person Families | 0 (0.0%) | $0 |
| 7+ Person Families | 0 (0.0%) | $0 |
| Total | 62 (100.0%) | $153,000 |
Family Income by Number of Earners in Maalaea
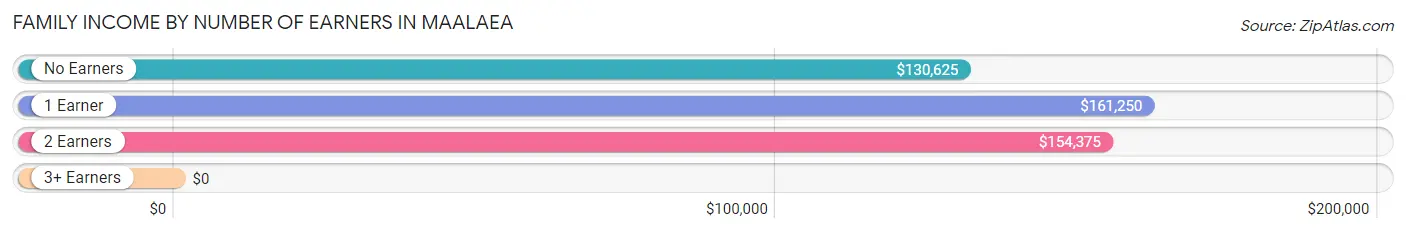
| Number of Earners | # Families | Median Income |
| No Earners | 30 (48.4%) | $130,625 |
| 1 Earner | 10 (16.1%) | $161,250 |
| 2 Earners | 22 (35.5%) | $154,375 |
| 3+ Earners | 0 (0.0%) | $0 |
| Total | 62 (100.0%) | $153,000 |
Household Income in Maalaea
Household Income Brackets in Maalaea
With 32 households falling in the category, the $50,000 to $74,999 income range is the most frequent in Maalaea, accounting for 22.5% of all households. In contrast, only 2 households (1.4%) fall into the $10,000 to $14,999 income bracket, making it the least populous group.
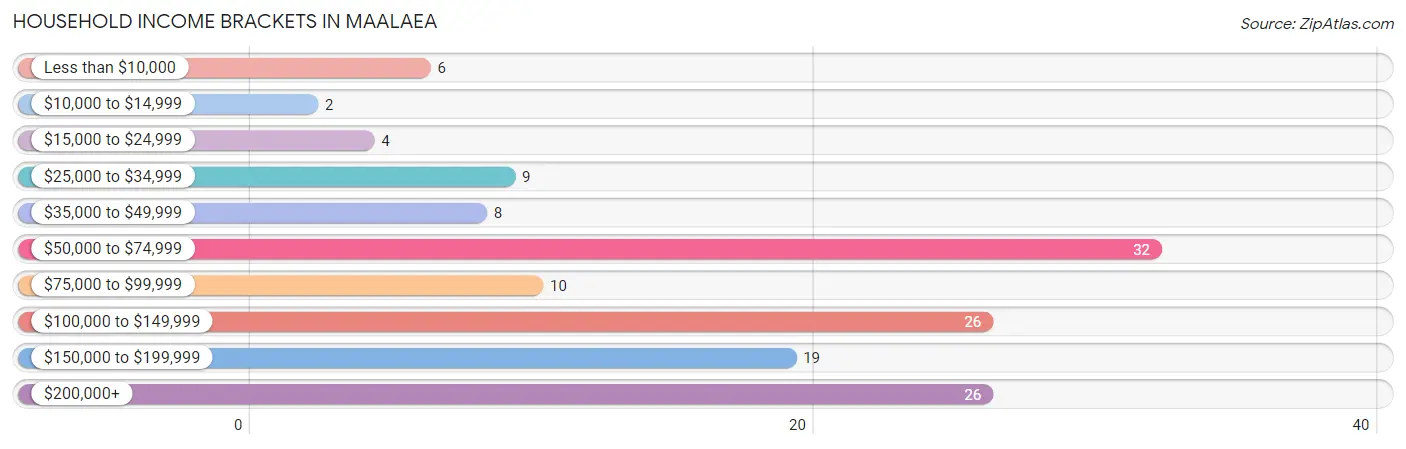
| Income Bracket | # Households | % Households |
| Less than $10,000 | 6 | 4.2% |
| $10,000 to $14,999 | 2 | 1.4% |
| $15,000 to $24,999 | 4 | 2.8% |
| $25,000 to $34,999 | 9 | 6.3% |
| $35,000 to $49,999 | 8 | 5.6% |
| $50,000 to $74,999 | 32 | 22.5% |
| $75,000 to $99,999 | 10 | 7.0% |
| $100,000 to $149,999 | 26 | 18.3% |
| $150,000 to $199,999 | 19 | 13.4% |
| $200,000+ | 26 | 18.3% |
Household Income by Householder Age in Maalaea
The median household income in Maalaea is $101,250, with the highest median household income of $107,083 found in the 25 to 44 years age bracket for the primary householder. A total of 21 households (14.8%) fall into this category.
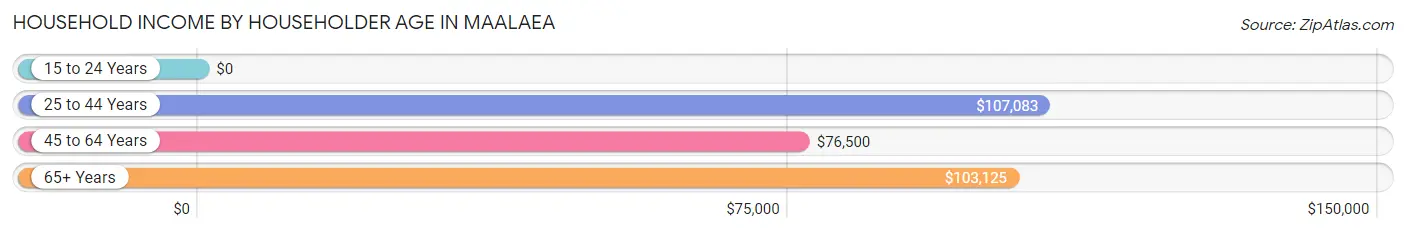
| Income Bracket | # Households | Median Income |
| 15 to 24 Years | 0 (0.0%) | $0 |
| 25 to 44 Years | 21 (14.8%) | $107,083 |
| 45 to 64 Years | 38 (26.8%) | $76,500 |
| 65+ Years | 83 (58.5%) | $103,125 |
| Total | 142 (100.0%) | $101,250 |
Poverty in Maalaea
Income Below Poverty by Sex and Age in Maalaea
With 12.3% poverty level for males and 5.0% for females among the residents of Maalaea, 25 to 34 year old males and 25 to 34 year old females are the most vulnerable to poverty, with 5 males (31.2%) and 4 females (44.4%) in their respective age groups living below the poverty level.
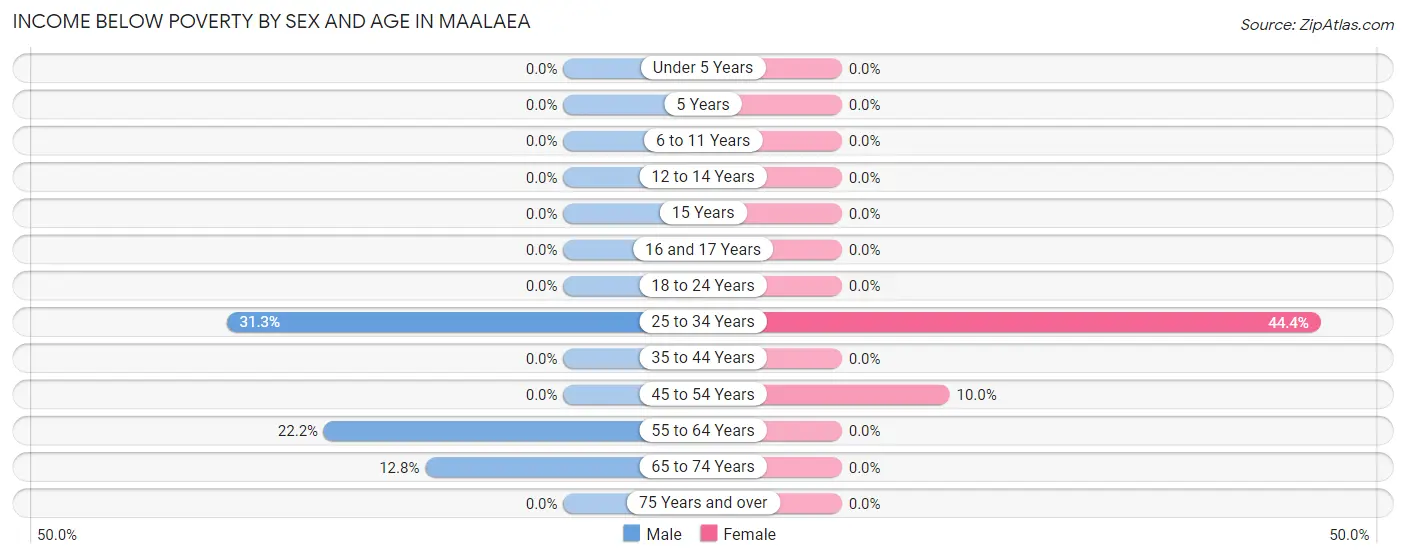
| Age Bracket | Male | Female |
| Under 5 Years | 0 (0.0%) | 0 (0.0%) |
| 5 Years | 0 (0.0%) | 0 (0.0%) |
| 6 to 11 Years | 0 (0.0%) | 0 (0.0%) |
| 12 to 14 Years | 0 (0.0%) | 0 (0.0%) |
| 15 Years | 0 (0.0%) | 0 (0.0%) |
| 16 and 17 Years | 0 (0.0%) | 0 (0.0%) |
| 18 to 24 Years | 0 (0.0%) | 0 (0.0%) |
| 25 to 34 Years | 5 (31.2%) | 4 (44.4%) |
| 35 to 44 Years | 0 (0.0%) | 0 (0.0%) |
| 45 to 54 Years | 0 (0.0%) | 1 (10.0%) |
| 55 to 64 Years | 4 (22.2%) | 0 (0.0%) |
| 65 to 74 Years | 5 (12.8%) | 0 (0.0%) |
| 75 Years and over | 0 (0.0%) | 0 (0.0%) |
| Total | 14 (12.3%) | 5 (5.0%) |
Income Above Poverty by Sex and Age in Maalaea
According to the poverty statistics in Maalaea, males aged 6 to 11 years and females aged 12 to 14 years are the age groups that are most secure financially, with 100.0% of males and 100.0% of females in these age groups living above the poverty line.
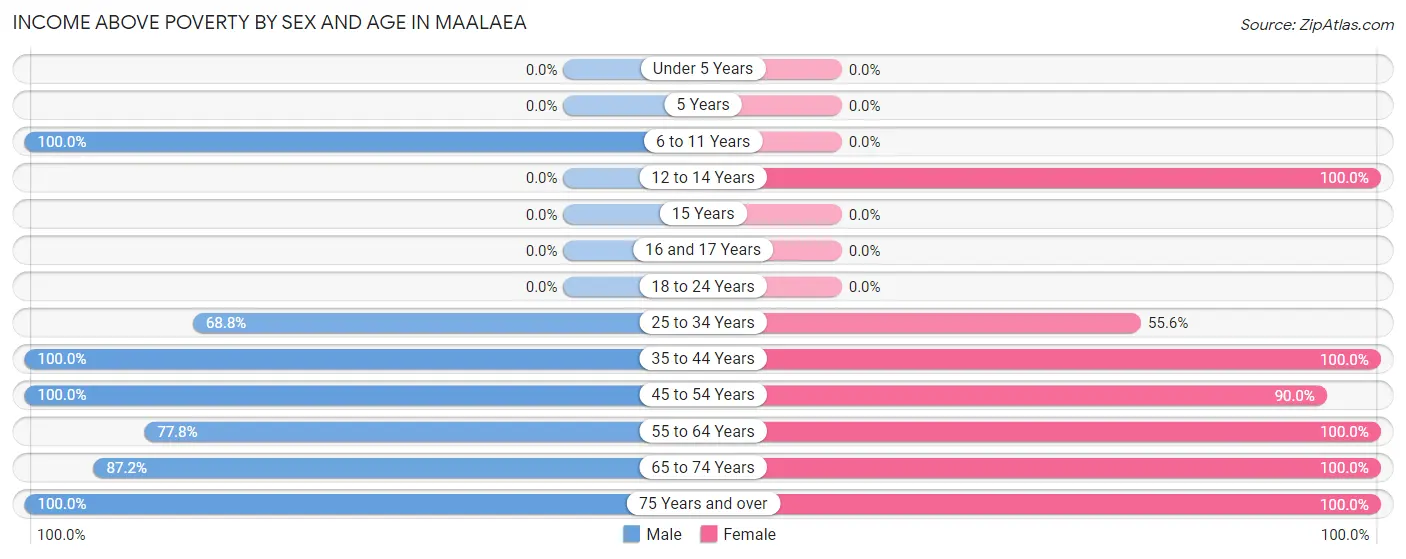
| Age Bracket | Male | Female |
| Under 5 Years | 0 (0.0%) | 0 (0.0%) |
| 5 Years | 0 (0.0%) | 0 (0.0%) |
| 6 to 11 Years | 2 (100.0%) | 0 (0.0%) |
| 12 to 14 Years | 0 (0.0%) | 1 (100.0%) |
| 15 Years | 0 (0.0%) | 0 (0.0%) |
| 16 and 17 Years | 0 (0.0%) | 0 (0.0%) |
| 18 to 24 Years | 0 (0.0%) | 0 (0.0%) |
| 25 to 34 Years | 11 (68.8%) | 5 (55.6%) |
| 35 to 44 Years | 4 (100.0%) | 10 (100.0%) |
| 45 to 54 Years | 12 (100.0%) | 9 (90.0%) |
| 55 to 64 Years | 14 (77.8%) | 16 (100.0%) |
| 65 to 74 Years | 34 (87.2%) | 38 (100.0%) |
| 75 Years and over | 23 (100.0%) | 16 (100.0%) |
| Total | 100 (87.7%) | 95 (95.0%) |
Income Below Poverty Among Married-Couple Families in Maalaea
| Children | Above Poverty | Below Poverty |
| No Children | 55 (100.0%) | 0 (0.0%) |
| 1 or 2 Children | 2 (100.0%) | 0 (0.0%) |
| 3 or 4 Children | 0 (0.0%) | 0 (0.0%) |
| 5 or more Children | 0 (0.0%) | 0 (0.0%) |
| Total | 57 (100.0%) | 0 (0.0%) |
Income Below Poverty Among Single-Parent Households in Maalaea
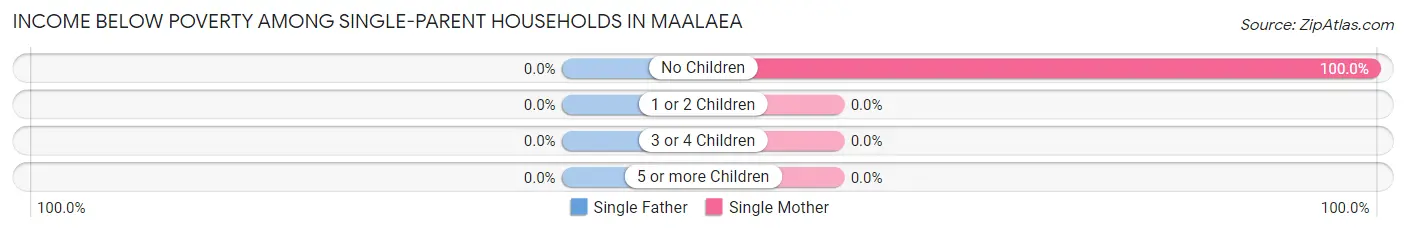
| Children | Single Father | Single Mother |
| No Children | 0 (0.0%) | 4 (100.0%) |
| 1 or 2 Children | 0 (0.0%) | 0 (0.0%) |
| 3 or 4 Children | 0 (0.0%) | 0 (0.0%) |
| 5 or more Children | 0 (0.0%) | 0 (0.0%) |
| Total | 0 (0.0%) | 4 (80.0%) |
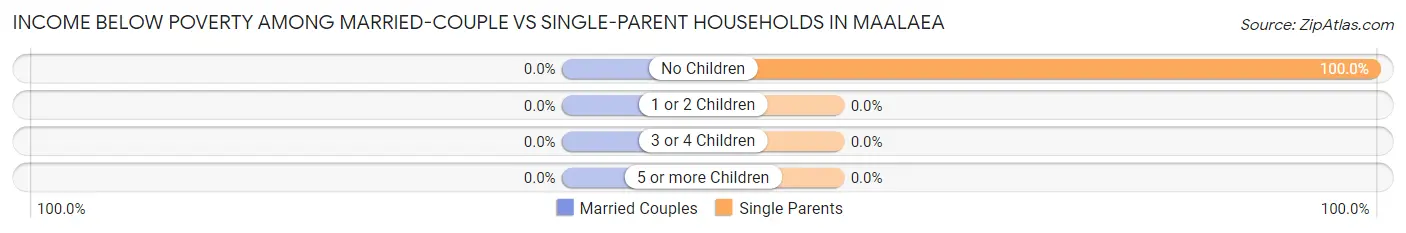
Income Below Poverty Among Married-Couple vs Single-Parent Households in Maalaea
| Children | Married-Couple Families | Single-Parent Households |
| No Children | 0 (0.0%) | 4 (100.0%) |
| 1 or 2 Children | 0 (0.0%) | 0 (0.0%) |
| 3 or 4 Children | 0 (0.0%) | 0 (0.0%) |
| 5 or more Children | 0 (0.0%) | 0 (0.0%) |
| Total | 0 (0.0%) | 4 (80.0%) |
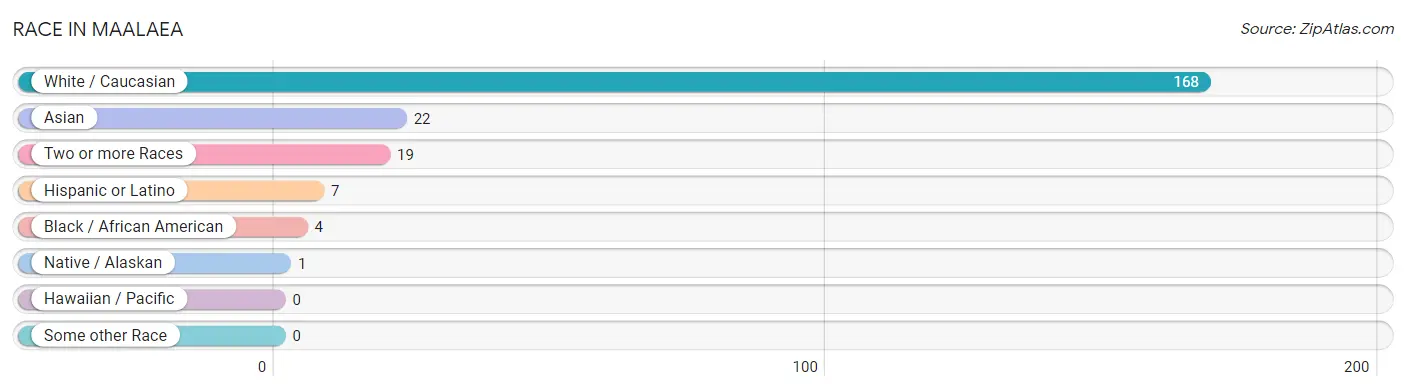
Race in Maalaea
The most populous races in Maalaea are White / Caucasian (168 | 78.5%), Asian (22 | 10.3%), and Two or more Races (19 | 8.9%).
| Race | # Population | % Population |
| Asian | 22 | 10.3% |
| Black / African American | 4 | 1.9% |
| Hawaiian / Pacific | 0 | 0.0% |
| Hispanic or Latino | 7 | 3.3% |
| Native / Alaskan | 1 | 0.5% |
| White / Caucasian | 168 | 78.5% |
| Two or more Races | 19 | 8.9% |
| Some other Race | 0 | 0.0% |
| Total | 214 | 100.0% |
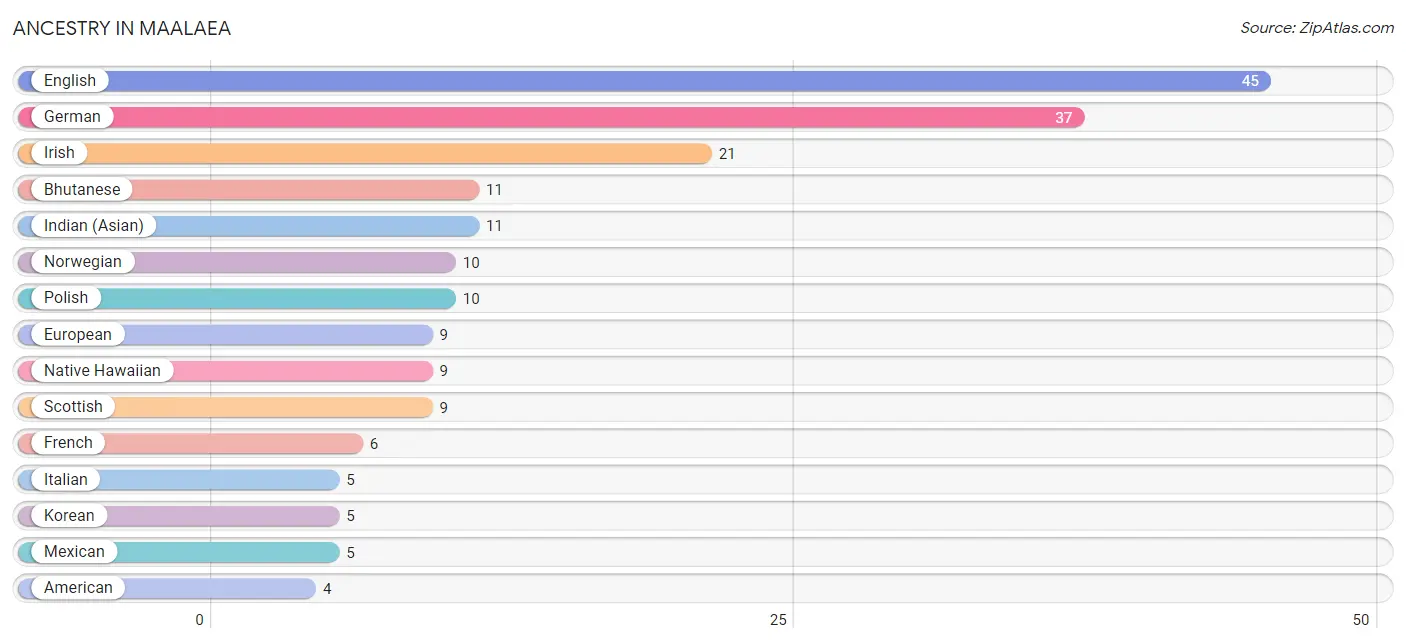
Ancestry in Maalaea
The most populous ancestries reported in Maalaea are English (45 | 21.0%), German (37 | 17.3%), Irish (21 | 9.8%), Bhutanese (11 | 5.1%), and Indian (Asian) (11 | 5.1%), together accounting for 58.4% of all Maalaea residents.
| Ancestry | # Population | % Population |
| American | 4 | 1.9% |
| Arab | 2 | 0.9% |
| Austrian | 2 | 0.9% |
| Bhutanese | 11 | 5.1% |
| British | 2 | 0.9% |
| Canadian | 1 | 0.5% |
| Croatian | 2 | 0.9% |
| Dutch | 3 | 1.4% |
| Eastern European | 4 | 1.9% |
| English | 45 | 21.0% |
| European | 9 | 4.2% |
| French | 6 | 2.8% |
| French Canadian | 1 | 0.5% |
| German | 37 | 17.3% |
| Greek | 4 | 1.9% |
| Icelander | 2 | 0.9% |
| Indian (Asian) | 11 | 5.1% |
| Irish | 21 | 9.8% |
| Italian | 5 | 2.3% |
| Korean | 5 | 2.3% |
| Lithuanian | 2 | 0.9% |
| Mexican | 5 | 2.3% |
| Native Hawaiian | 9 | 4.2% |
| Northern European | 2 | 0.9% |
| Norwegian | 10 | 4.7% |
| Palestinian | 2 | 0.9% |
| Polish | 10 | 4.7% |
| Portuguese | 2 | 0.9% |
| Puerto Rican | 2 | 0.9% |
| Romanian | 2 | 0.9% |
| Russian | 3 | 1.4% |
| Scandinavian | 1 | 0.5% |
| Scotch-Irish | 2 | 0.9% |
| Scottish | 9 | 4.2% |
| Slovak | 1 | 0.5% |
| Swedish | 3 | 1.4% |
| Thai | 3 | 1.4% |
| Ukrainian | 4 | 1.9% | View All 38 Rows |
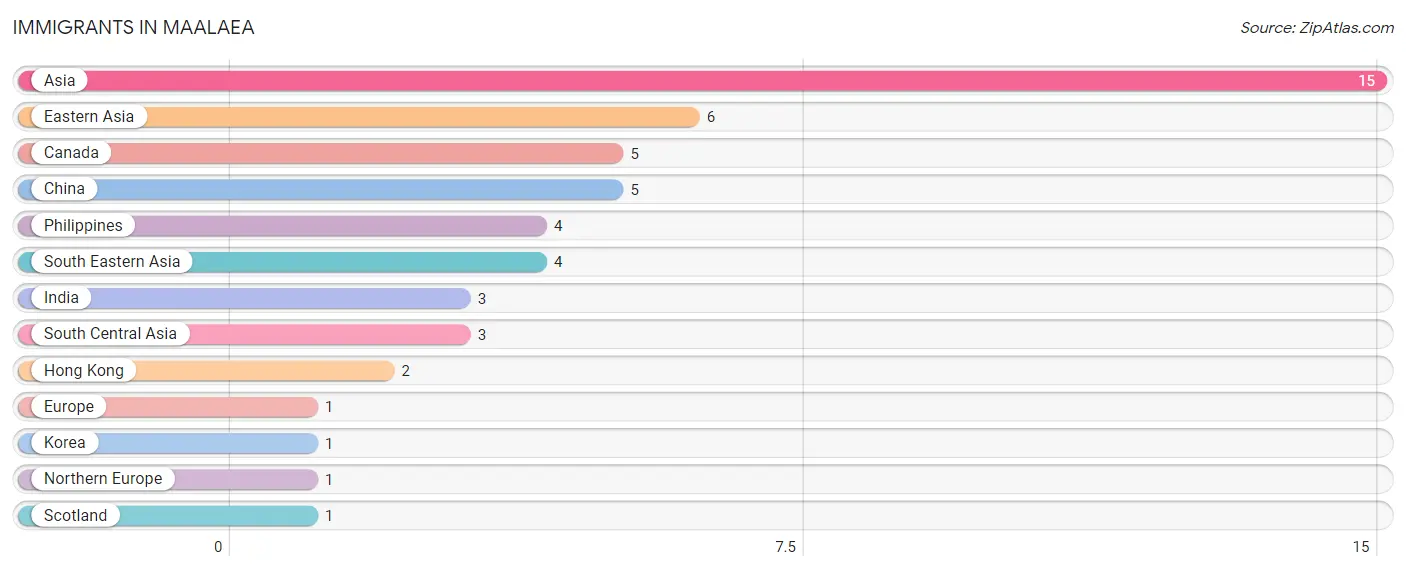
Immigrants in Maalaea
The most numerous immigrant groups reported in Maalaea came from Asia (15 | 7.0%), Eastern Asia (6 | 2.8%), Canada (5 | 2.3%), China (5 | 2.3%), and Philippines (4 | 1.9%), together accounting for 16.4% of all Maalaea residents.
| Immigration Origin | # Population | % Population |
| Asia | 15 | 7.0% |
| Canada | 5 | 2.3% |
| China | 5 | 2.3% |
| Eastern Asia | 6 | 2.8% |
| Europe | 1 | 0.5% |
| Hong Kong | 2 | 0.9% |
| India | 3 | 1.4% |
| Korea | 1 | 0.5% |
| Northern Europe | 1 | 0.5% |
| Philippines | 4 | 1.9% |
| Scotland | 1 | 0.5% |
| South Central Asia | 3 | 1.4% |
| South Eastern Asia | 4 | 1.9% | View All 13 Rows |
Sex and Age in Maalaea
Sex and Age in Maalaea
The most populous age groups in Maalaea are 70 to 74 Years (21 | 18.4%) for men and 70 to 74 Years (22 | 22.0%) for women.
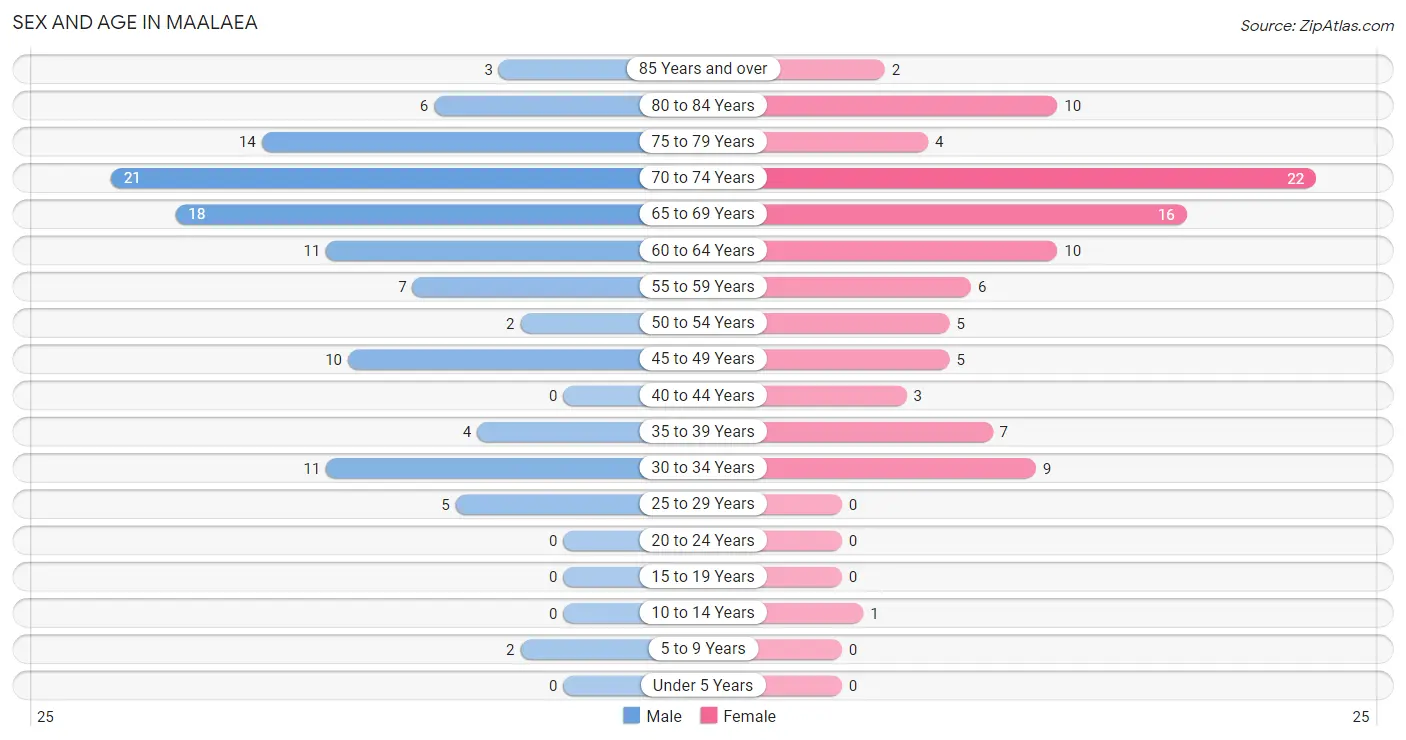
| Age Bracket | Male | Female |
| Under 5 Years | 0 (0.0%) | 0 (0.0%) |
| 5 to 9 Years | 2 (1.8%) | 0 (0.0%) |
| 10 to 14 Years | 0 (0.0%) | 1 (1.0%) |
| 15 to 19 Years | 0 (0.0%) | 0 (0.0%) |
| 20 to 24 Years | 0 (0.0%) | 0 (0.0%) |
| 25 to 29 Years | 5 (4.4%) | 0 (0.0%) |
| 30 to 34 Years | 11 (9.7%) | 9 (9.0%) |
| 35 to 39 Years | 4 (3.5%) | 7 (7.0%) |
| 40 to 44 Years | 0 (0.0%) | 3 (3.0%) |
| 45 to 49 Years | 10 (8.8%) | 5 (5.0%) |
| 50 to 54 Years | 2 (1.8%) | 5 (5.0%) |
| 55 to 59 Years | 7 (6.1%) | 6 (6.0%) |
| 60 to 64 Years | 11 (9.7%) | 10 (10.0%) |
| 65 to 69 Years | 18 (15.8%) | 16 (16.0%) |
| 70 to 74 Years | 21 (18.4%) | 22 (22.0%) |
| 75 to 79 Years | 14 (12.3%) | 4 (4.0%) |
| 80 to 84 Years | 6 (5.3%) | 10 (10.0%) |
| 85 Years and over | 3 (2.6%) | 2 (2.0%) |
| Total | 114 (100.0%) | 100 (100.0%) |
Families and Households in Maalaea
Median Family Size in Maalaea
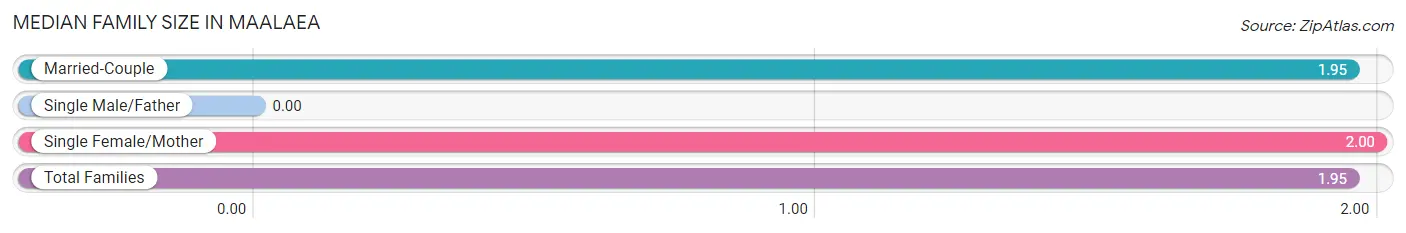
| Family Type | # Families | Family Size |
| Married-Couple | 57 (91.9%) | 1.95 |
| Single Male/Father | 0 (0.0%) | - |
| Single Female/Mother | 5 (8.1%) | 2.00 |
| Total Families | 62 (100.0%) | 1.95 |
Median Household Size in Maalaea
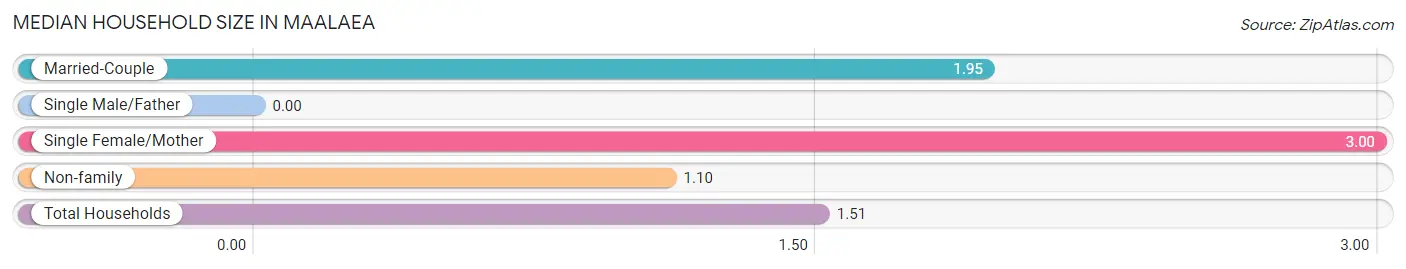
| Household Type | # Households | Household Size |
| Married-Couple | 57 (40.1%) | 1.95 |
| Single Male/Father | 0 (0.0%) | - |
| Single Female/Mother | 5 (3.5%) | 3.00 |
| Non-family | 80 (56.3%) | 1.10 |
| Total Households | 142 (100.0%) | 1.51 |
Household Size by Marriage Status in Maalaea
Out of a total of 142 households in Maalaea, 62 (43.7%) are family households, while 80 (56.3%) are nonfamily households. The most numerous type of family households are 2-person households, comprising 52, and the most common type of nonfamily households are 1-person households, comprising 73.
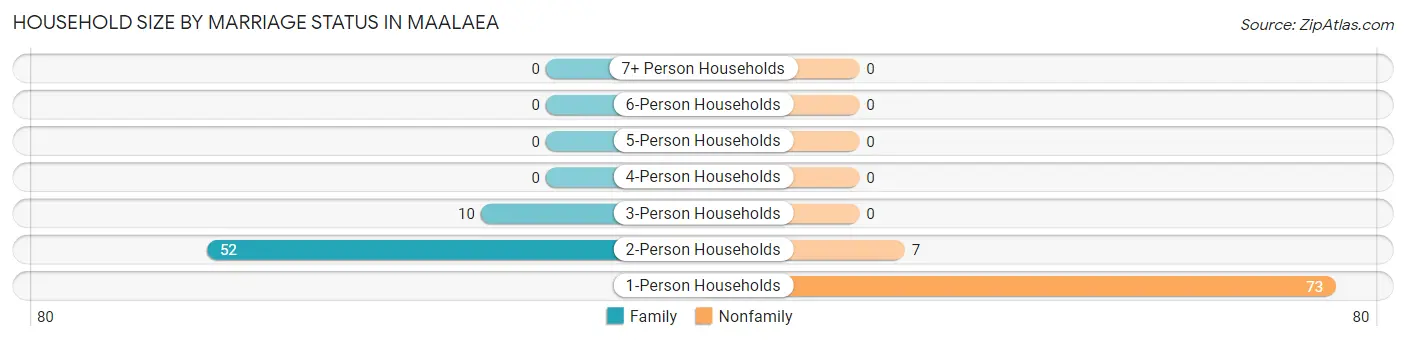
| Household Size | Family Households | Nonfamily Households |
| 1-Person Households | - | 73 (51.4%) |
| 2-Person Households | 52 (36.6%) | 7 (4.9%) |
| 3-Person Households | 10 (7.0%) | 0 (0.0%) |
| 4-Person Households | 0 (0.0%) | 0 (0.0%) |
| 5-Person Households | 0 (0.0%) | 0 (0.0%) |
| 6-Person Households | 0 (0.0%) | 0 (0.0%) |
| 7+ Person Households | 0 (0.0%) | 0 (0.0%) |
| Total | 62 (43.7%) | 80 (56.3%) |
Female Fertility in Maalaea
Fertility by Age in Maalaea
| Age Bracket | Women with Births | Births / 1,000 Women |
| 15 to 19 years | 0 (0.0%) | 0.0 |
| 20 to 34 years | 0 (0.0%) | 0.0 |
| 35 to 50 years | 0 (0.0%) | 0.0 |
| Total | 0 (0.0%) | 0.0 |
Fertility by Age by Marriage Status in Maalaea
| Age Bracket | Married | Unmarried |
| 15 to 19 years | 0 (0.0%) | 0 (0.0%) |
| 20 to 34 years | 0 (0.0%) | 0 (0.0%) |
| 35 to 50 years | 0 (0.0%) | 0 (0.0%) |
| Total | 0 (0.0%) | 0 (0.0%) |
Fertility by Education in Maalaea
| Educational Attainment | Women with Births | Births / 1,000 Women |
| Less than High School | 0 (0.0%) | 0.0 |
| High School Diploma | 0 (0.0%) | 0.0 |
| College or Associate's Degree | 0 (0.0%) | 0.0 |
| Bachelor's Degree | 0 (0.0%) | 0.0 |
| Graduate Degree | 0 (0.0%) | 0.0 |
| Total | 0 (0.0%) | 0.0 |
Fertility by Education by Marriage Status in Maalaea
| Educational Attainment | Married | Unmarried |
| Less than High School | 0 (0.0%) | 0 (0.0%) |
| High School Diploma | 0 (0.0%) | 0 (0.0%) |
| College or Associate's Degree | 0 (0.0%) | 0 (0.0%) |
| Bachelor's Degree | 0 (0.0%) | 0 (0.0%) |
| Graduate Degree | 0 (0.0%) | 0 (0.0%) |
| Total | 0 (0.0%) | 0 (0.0%) |
Employment Characteristics in Maalaea
Employment by Class of Employer in Maalaea
Among the 79 employed individuals in Maalaea, private company employees (28 | 35.4%), self-employed (incorporated) (12 | 15.2%), and self-employed (not incorporated) (9 | 11.4%) make up the most common classes of employment.
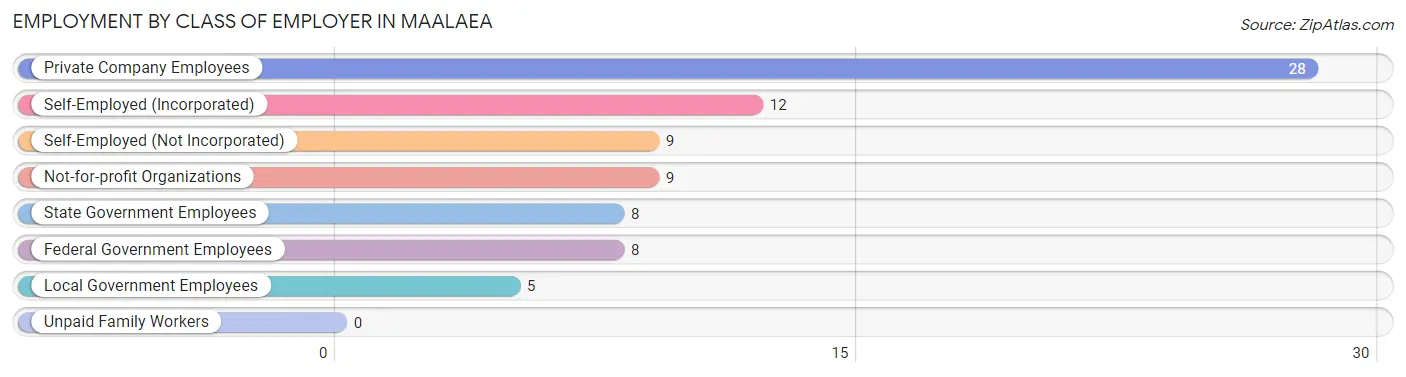
| Employer Class | # Employees | % Employees |
| Private Company Employees | 28 | 35.4% |
| Self-Employed (Incorporated) | 12 | 15.2% |
| Self-Employed (Not Incorporated) | 9 | 11.4% |
| Not-for-profit Organizations | 9 | 11.4% |
| Local Government Employees | 5 | 6.3% |
| State Government Employees | 8 | 10.1% |
| Federal Government Employees | 8 | 10.1% |
| Unpaid Family Workers | 0 | 0.0% |
| Total | 79 | 100.0% |
Employment Status by Age in Maalaea
According to the labor force statistics for Maalaea, out of the total population over 16 years of age (211), 45.5% or 96 individuals are in the labor force, with 16.3% or 16 of them unemployed. The age group with the highest labor force participation rate is 25 to 29 years, with 100.0% or 5 individuals in the labor force. Within the labor force, the 30 to 34 years age range has the highest percentage of unemployed individuals, with 45.0% or 9 of them being unemployed.
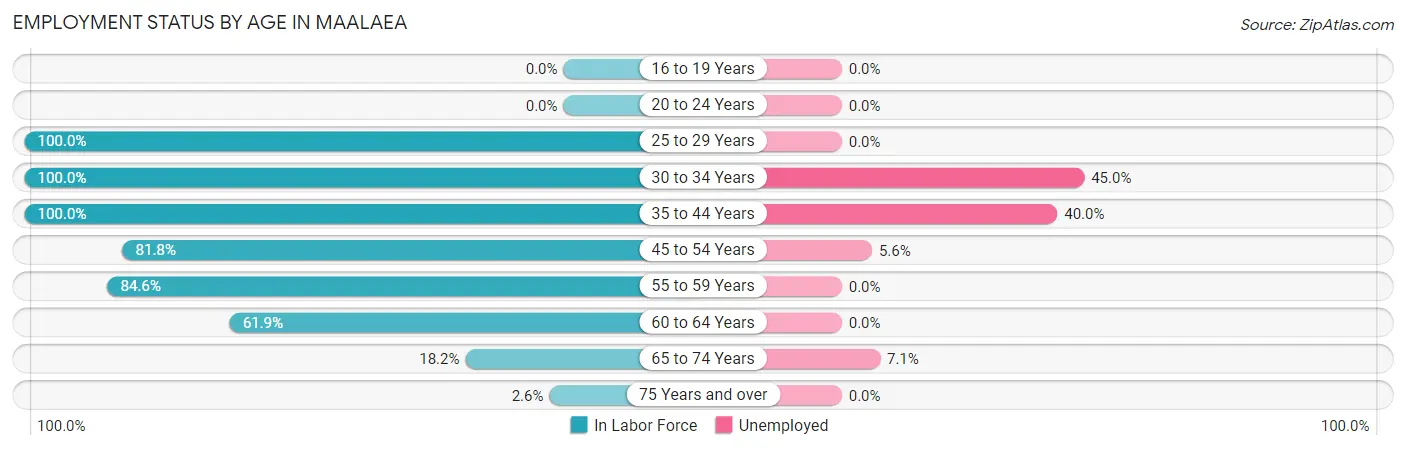
| Age Bracket | In Labor Force | Unemployed |
| 16 to 19 Years | 0 (0.0%) | 0 (0.0%) |
| 20 to 24 Years | 0 (0.0%) | 0 (0.0%) |
| 25 to 29 Years | 5 (100.0%) | 0 (0.0%) |
| 30 to 34 Years | 20 (100.0%) | 9 (45.0%) |
| 35 to 44 Years | 14 (100.0%) | 6 (40.0%) |
| 45 to 54 Years | 18 (81.8%) | 1 (5.6%) |
| 55 to 59 Years | 11 (84.6%) | 0 (0.0%) |
| 60 to 64 Years | 13 (61.9%) | 0 (0.0%) |
| 65 to 74 Years | 14 (18.2%) | 1 (7.1%) |
| 75 Years and over | 1 (2.6%) | 0 (0.0%) |
| Total | 96 (45.5%) | 16 (16.3%) |
Employment Status by Educational Attainment in Maalaea
According to labor force statistics for Maalaea, 85.3% of individuals (81) out of the total population between 25 and 64 years of age (95) are in the labor force, with 18.2% or 15 of them being unemployed. The group with the highest labor force participation rate are those with the educational attainment of less than high school, with 100.0% or 2 individuals in the labor force. Within the labor force, individuals with high school diploma education have the highest percentage of unemployment, with 55.6% or 6 of them being unemployed.
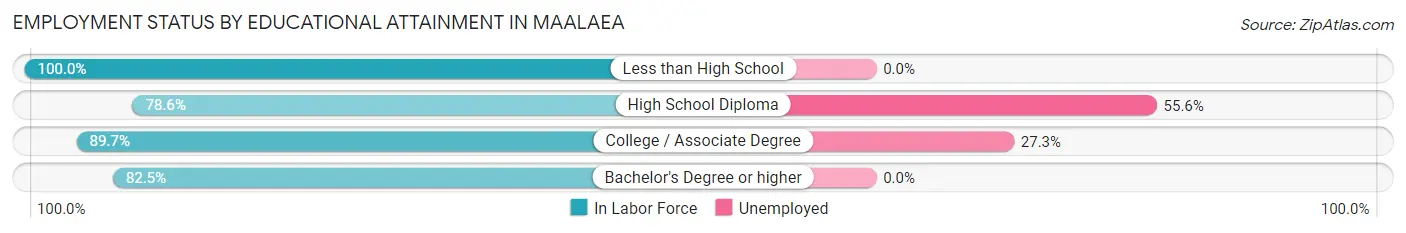
| Educational Attainment | In Labor Force | Unemployed |
| Less than High School | 2 (100.0%) | 0 (0.0%) |
| High School Diploma | 11 (78.6%) | 8 (55.6%) |
| College / Associate Degree | 35 (89.7%) | 11 (27.3%) |
| Bachelor's Degree or higher | 33 (82.5%) | 0 (0.0%) |
| Total | 81 (85.3%) | 17 (18.2%) |
Employment Occupations by Sex in Maalaea
Management, Business, Science and Arts Occupations
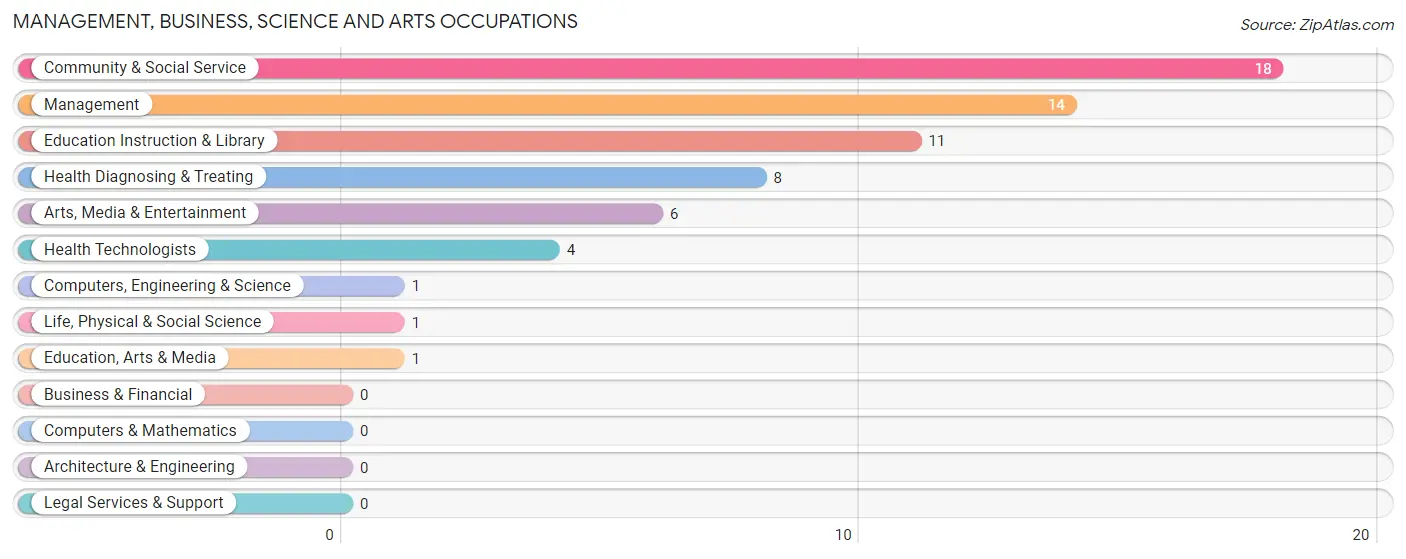
The most common Management, Business, Science and Arts occupations in Maalaea are Community & Social Service (18 | 23.4%), Management (14 | 18.2%), Education Instruction & Library (11 | 14.3%), Health Diagnosing & Treating (8 | 10.4%), and Arts, Media & Entertainment (6 | 7.8%).
Management, Business, Science and Arts Occupations by Sex
Within the Management, Business, Science and Arts occupations in Maalaea, the most male-oriented occupations are Health Technologists (100.0%), Management (78.6%), and Arts, Media & Entertainment (66.7%), while the most female-oriented occupations are Computers, Engineering & Science (100.0%), Life, Physical & Social Science (100.0%), and Education, Arts & Media (100.0%).
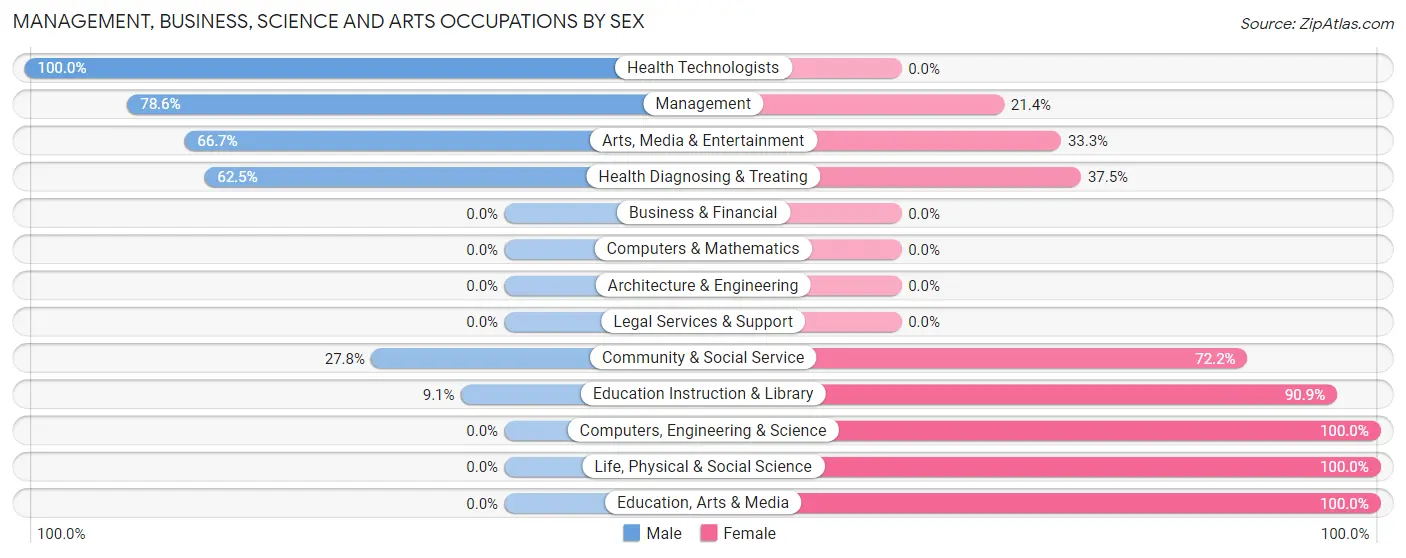
| Occupation | Male | Female |
| Management | 11 (78.6%) | 3 (21.4%) |
| Business & Financial | 0 (0.0%) | 0 (0.0%) |
| Computers, Engineering & Science | 0 (0.0%) | 1 (100.0%) |
| Computers & Mathematics | 0 (0.0%) | 0 (0.0%) |
| Architecture & Engineering | 0 (0.0%) | 0 (0.0%) |
| Life, Physical & Social Science | 0 (0.0%) | 1 (100.0%) |
| Community & Social Service | 5 (27.8%) | 13 (72.2%) |
| Education, Arts & Media | 0 (0.0%) | 1 (100.0%) |
| Legal Services & Support | 0 (0.0%) | 0 (0.0%) |
| Education Instruction & Library | 1 (9.1%) | 10 (90.9%) |
| Arts, Media & Entertainment | 4 (66.7%) | 2 (33.3%) |
| Health Diagnosing & Treating | 5 (62.5%) | 3 (37.5%) |
| Health Technologists | 4 (100.0%) | 0 (0.0%) |
| Total (Category) | 21 (51.2%) | 20 (48.8%) |
| Total (Overall) | 41 (53.2%) | 36 (46.8%) |
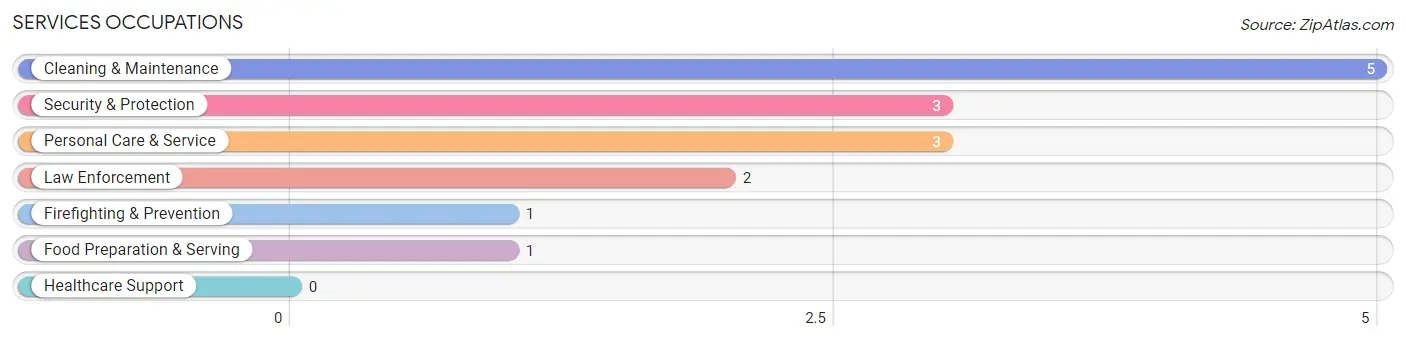
Services Occupations
The most common Services occupations in Maalaea are Cleaning & Maintenance (5 | 6.5%), Security & Protection (3 | 3.9%), Personal Care & Service (3 | 3.9%), Law Enforcement (2 | 2.6%), and Firefighting & Prevention (1 | 1.3%).
Services Occupations by Sex
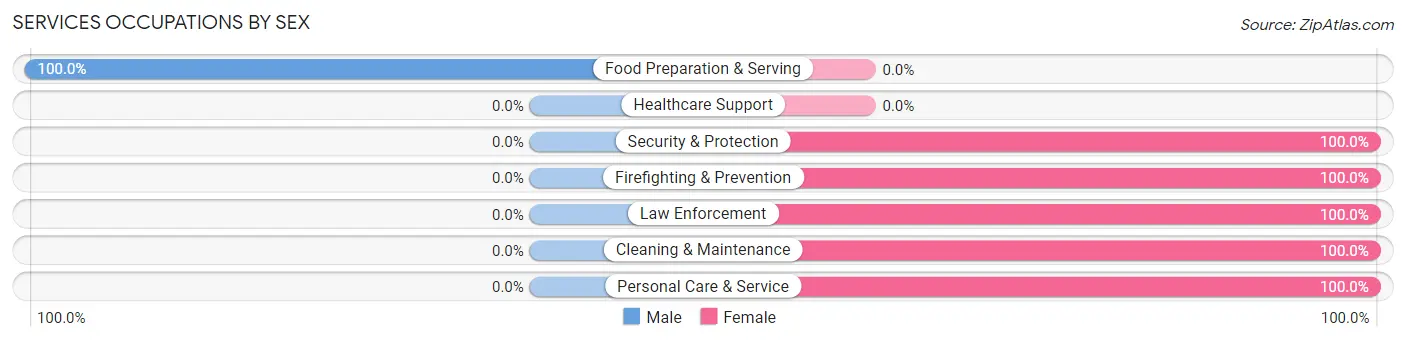
| Occupation | Male | Female |
| Healthcare Support | 0 (0.0%) | 0 (0.0%) |
| Security & Protection | 0 (0.0%) | 3 (100.0%) |
| Firefighting & Prevention | 0 (0.0%) | 1 (100.0%) |
| Law Enforcement | 0 (0.0%) | 2 (100.0%) |
| Food Preparation & Serving | 1 (100.0%) | 0 (0.0%) |
| Cleaning & Maintenance | 0 (0.0%) | 5 (100.0%) |
| Personal Care & Service | 0 (0.0%) | 3 (100.0%) |
| Total (Category) | 1 (8.3%) | 11 (91.7%) |
| Total (Overall) | 41 (53.2%) | 36 (46.8%) |
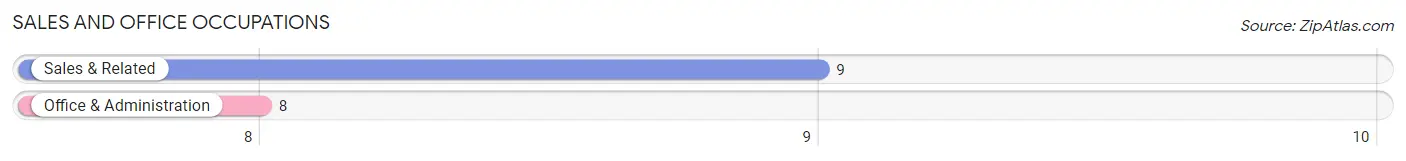
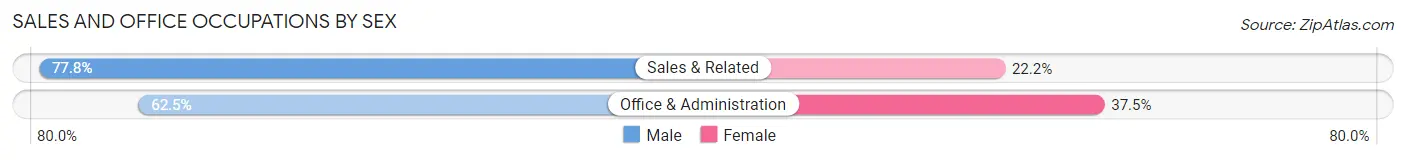
Sales and Office Occupations
The most common Sales and Office occupations in Maalaea are Sales & Related (9 | 11.7%), and Office & Administration (8 | 10.4%).
Sales and Office Occupations by Sex
| Occupation | Male | Female |
| Sales & Related | 7 (77.8%) | 2 (22.2%) |
| Office & Administration | 5 (62.5%) | 3 (37.5%) |
| Total (Category) | 12 (70.6%) | 5 (29.4%) |
| Total (Overall) | 41 (53.2%) | 36 (46.8%) |
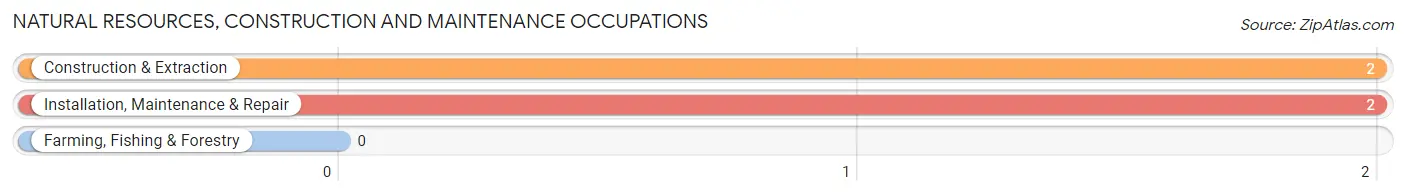
Natural Resources, Construction and Maintenance Occupations
The most common Natural Resources, Construction and Maintenance occupations in Maalaea are Construction & Extraction (2 | 2.6%), and Installation, Maintenance & Repair (2 | 2.6%).
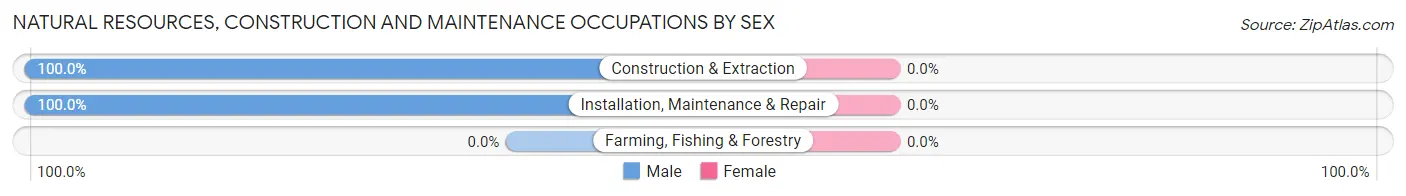
Natural Resources, Construction and Maintenance Occupations by Sex
| Occupation | Male | Female |
| Farming, Fishing & Forestry | 0 (0.0%) | 0 (0.0%) |
| Construction & Extraction | 2 (100.0%) | 0 (0.0%) |
| Installation, Maintenance & Repair | 2 (100.0%) | 0 (0.0%) |
| Total (Category) | 4 (100.0%) | 0 (0.0%) |
| Total (Overall) | 41 (53.2%) | 36 (46.8%) |
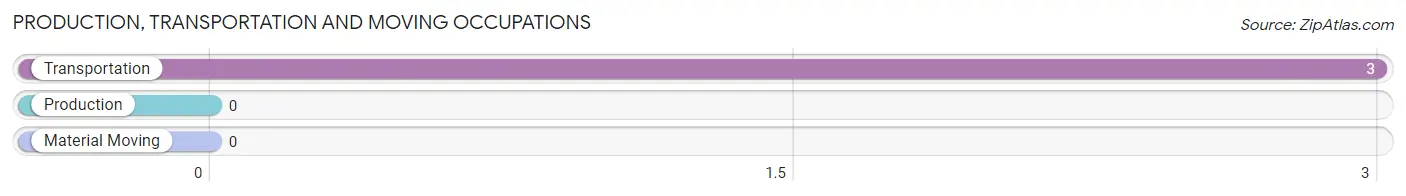
Production, Transportation and Moving Occupations
The most common Production, Transportation and Moving occupations in Maalaea are , and Transportation (3 | 3.9%).
Production, Transportation and Moving Occupations by Sex
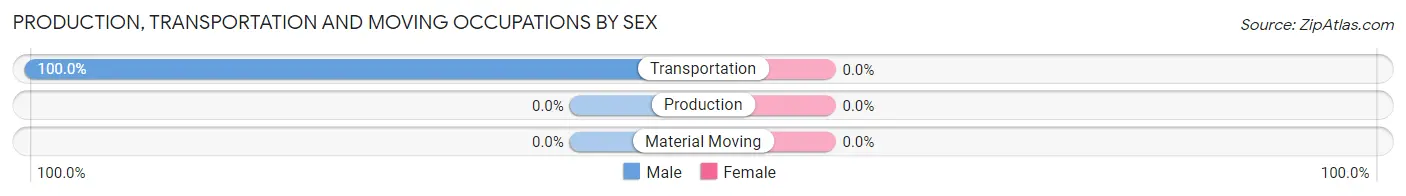
| Occupation | Male | Female |
| Production | 0 (0.0%) | 0 (0.0%) |
| Transportation | 3 (100.0%) | 0 (0.0%) |
| Material Moving | 0 (0.0%) | 0 (0.0%) |
| Total (Category) | 3 (100.0%) | 0 (0.0%) |
| Total (Overall) | 41 (53.2%) | 36 (46.8%) |
Employment Industries by Sex in Maalaea
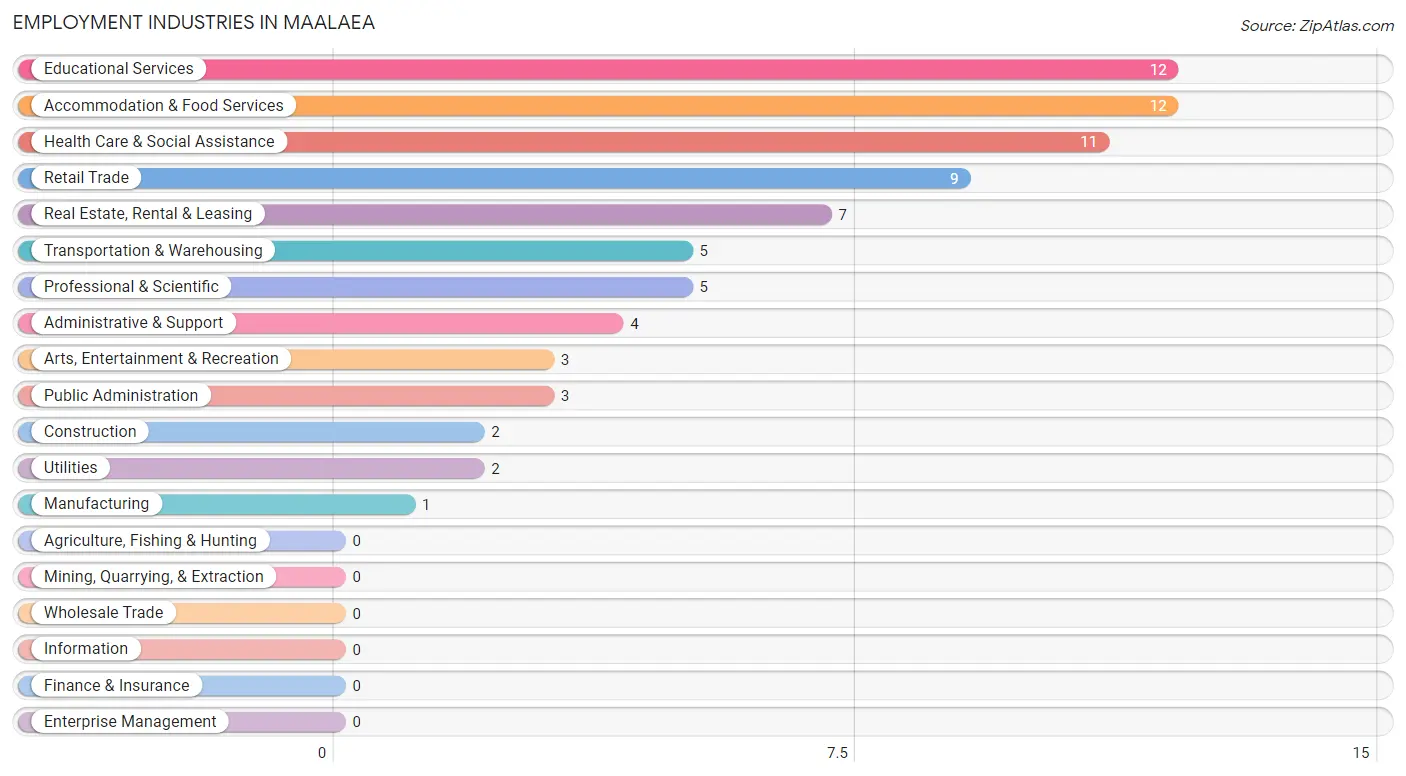
Employment Industries in Maalaea
The major employment industries in Maalaea include Educational Services (12 | 15.6%), Accommodation & Food Services (12 | 15.6%), Health Care & Social Assistance (11 | 14.3%), Retail Trade (9 | 11.7%), and Real Estate, Rental & Leasing (7 | 9.1%).
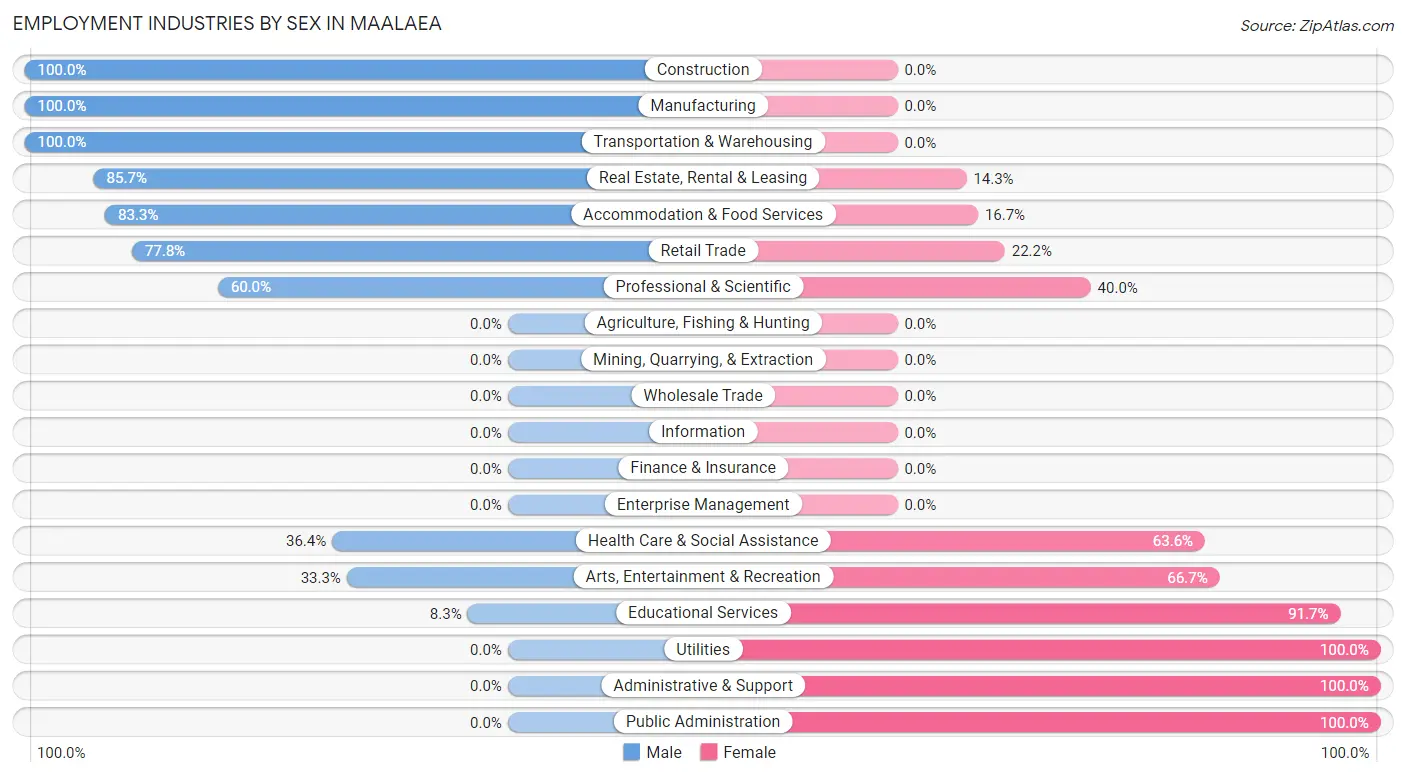
Employment Industries by Sex in Maalaea
The Maalaea industries that see more men than women are Construction (100.0%), Manufacturing (100.0%), and Transportation & Warehousing (100.0%), whereas the industries that tend to have a higher number of women are Utilities (100.0%), Administrative & Support (100.0%), and Public Administration (100.0%).
| Industry | Male | Female |
| Agriculture, Fishing & Hunting | 0 (0.0%) | 0 (0.0%) |
| Mining, Quarrying, & Extraction | 0 (0.0%) | 0 (0.0%) |
| Construction | 2 (100.0%) | 0 (0.0%) |
| Manufacturing | 1 (100.0%) | 0 (0.0%) |
| Wholesale Trade | 0 (0.0%) | 0 (0.0%) |
| Retail Trade | 7 (77.8%) | 2 (22.2%) |
| Transportation & Warehousing | 5 (100.0%) | 0 (0.0%) |
| Utilities | 0 (0.0%) | 2 (100.0%) |
| Information | 0 (0.0%) | 0 (0.0%) |
| Finance & Insurance | 0 (0.0%) | 0 (0.0%) |
| Real Estate, Rental & Leasing | 6 (85.7%) | 1 (14.3%) |
| Professional & Scientific | 3 (60.0%) | 2 (40.0%) |
| Enterprise Management | 0 (0.0%) | 0 (0.0%) |
| Administrative & Support | 0 (0.0%) | 4 (100.0%) |
| Educational Services | 1 (8.3%) | 11 (91.7%) |
| Health Care & Social Assistance | 4 (36.4%) | 7 (63.6%) |
| Arts, Entertainment & Recreation | 1 (33.3%) | 2 (66.7%) |
| Accommodation & Food Services | 10 (83.3%) | 2 (16.7%) |
| Public Administration | 0 (0.0%) | 3 (100.0%) |
| Total | 41 (53.2%) | 36 (46.8%) |
Education in Maalaea
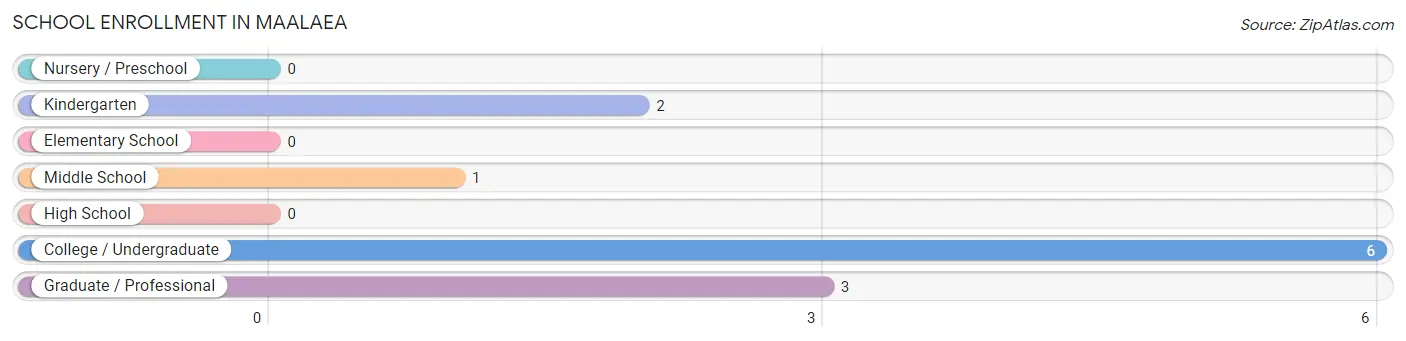
School Enrollment in Maalaea
The most common levels of schooling among the 12 students in Maalaea are college / undergraduate (6 | 50.0%), graduate / professional (3 | 25.0%), and kindergarten (2 | 16.7%).
| School Level | # Students | % Students |
| Nursery / Preschool | 0 | 0.0% |
| Kindergarten | 2 | 16.7% |
| Elementary School | 0 | 0.0% |
| Middle School | 1 | 8.3% |
| High School | 0 | 0.0% |
| College / Undergraduate | 6 | 50.0% |
| Graduate / Professional | 3 | 25.0% |
| Total | 12 | 100.0% |
School Enrollment by Age by Funding Source in Maalaea
Out of a total of 12 students who are enrolled in schools in Maalaea, 4 (33.3%) attend a private institution, while the remaining 8 (66.7%) are enrolled in public schools. The age group of 10 to 14 year olds has the highest likelihood of being enrolled in private schools, with 1 (100.0% in the age bracket) enrolled. Conversely, the age group of 5 to 9 year old has the lowest likelihood of being enrolled in a private school, with 2 (100.0% in the age bracket) attending a public institution.
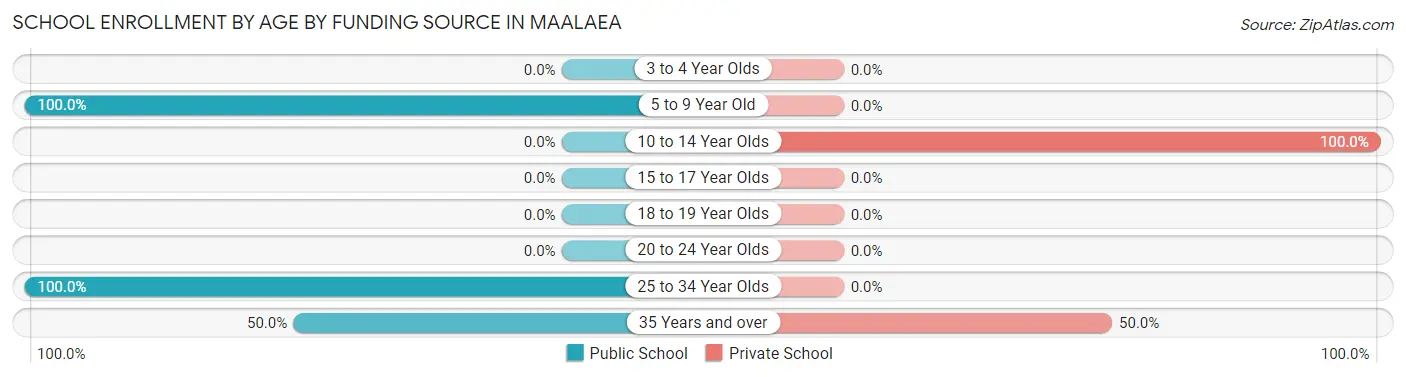
| Age Bracket | Public School | Private School |
| 3 to 4 Year Olds | 0 (0.0%) | 0 (0.0%) |
| 5 to 9 Year Old | 2 (100.0%) | 0 (0.0%) |
| 10 to 14 Year Olds | 0 (0.0%) | 1 (100.0%) |
| 15 to 17 Year Olds | 0 (0.0%) | 0 (0.0%) |
| 18 to 19 Year Olds | 0 (0.0%) | 0 (0.0%) |
| 20 to 24 Year Olds | 0 (0.0%) | 0 (0.0%) |
| 25 to 34 Year Olds | 3 (100.0%) | 0 (0.0%) |
| 35 Years and over | 3 (50.0%) | 3 (50.0%) |
| Total | 8 (66.7%) | 4 (33.3%) |
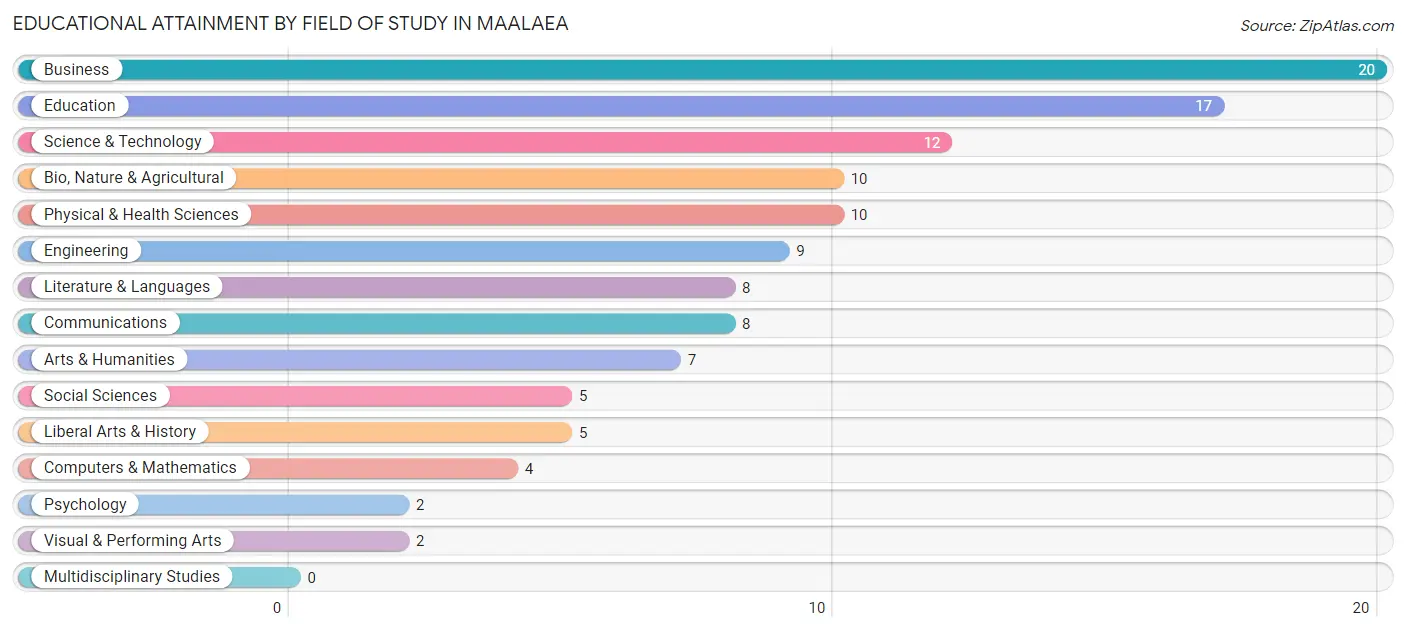
Educational Attainment by Field of Study in Maalaea
Business (20 | 16.8%), education (17 | 14.3%), science & technology (12 | 10.1%), bio, nature & agricultural (10 | 8.4%), and physical & health sciences (10 | 8.4%) are the most common fields of study among 119 individuals in Maalaea who have obtained a bachelor's degree or higher.
| Field of Study | # Graduates | % Graduates |
| Computers & Mathematics | 4 | 3.4% |
| Bio, Nature & Agricultural | 10 | 8.4% |
| Physical & Health Sciences | 10 | 8.4% |
| Psychology | 2 | 1.7% |
| Social Sciences | 5 | 4.2% |
| Engineering | 9 | 7.6% |
| Multidisciplinary Studies | 0 | 0.0% |
| Science & Technology | 12 | 10.1% |
| Business | 20 | 16.8% |
| Education | 17 | 14.3% |
| Literature & Languages | 8 | 6.7% |
| Liberal Arts & History | 5 | 4.2% |
| Visual & Performing Arts | 2 | 1.7% |
| Communications | 8 | 6.7% |
| Arts & Humanities | 7 | 5.9% |
| Total | 119 | 100.0% |
Transportation & Commute in Maalaea
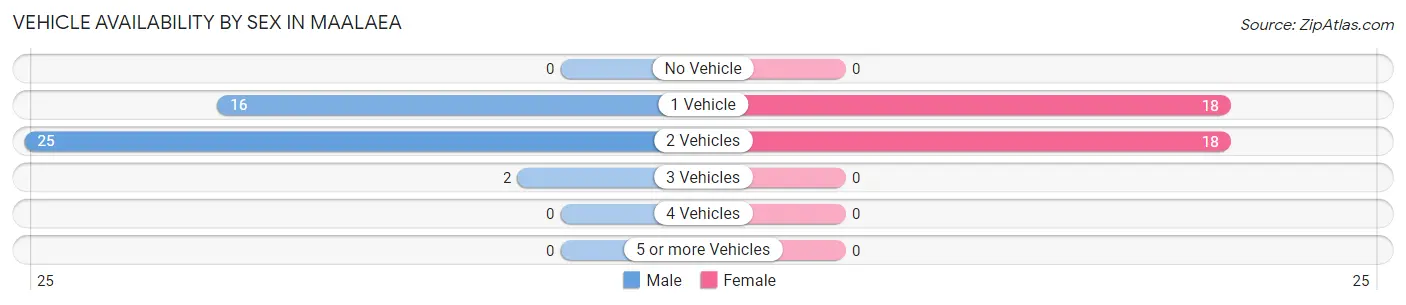
Vehicle Availability by Sex in Maalaea
The most prevalent vehicle ownership categories in Maalaea are males with 2 vehicles (25, accounting for 58.1%) and females with 2 vehicles (18, making up 69.4%).
| Vehicles Available | Male | Female |
| No Vehicle | 0 (0.0%) | 0 (0.0%) |
| 1 Vehicle | 16 (37.2%) | 18 (50.0%) |
| 2 Vehicles | 25 (58.1%) | 18 (50.0%) |
| 3 Vehicles | 2 (4.6%) | 0 (0.0%) |
| 4 Vehicles | 0 (0.0%) | 0 (0.0%) |
| 5 or more Vehicles | 0 (0.0%) | 0 (0.0%) |
| Total | 43 (100.0%) | 36 (100.0%) |
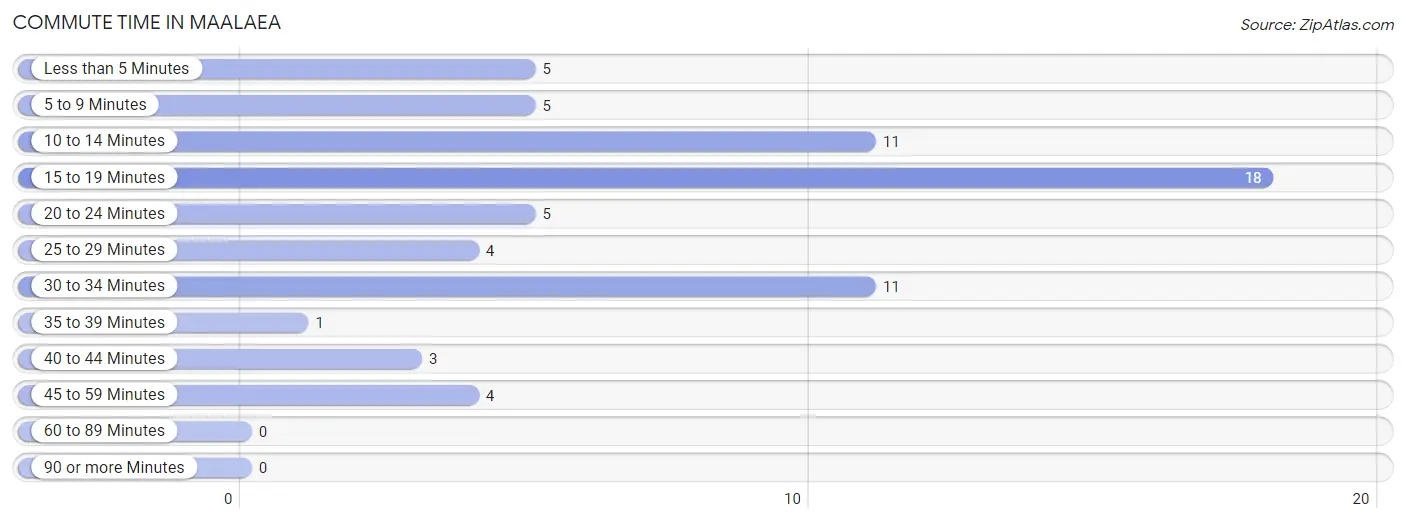
Commute Time in Maalaea
The most frequently occuring commute durations in Maalaea are 15 to 19 minutes (18 commuters, 26.9%), 10 to 14 minutes (11 commuters, 16.4%), and 30 to 34 minutes (11 commuters, 16.4%).
| Commute Time | # Commuters | % Commuters |
| Less than 5 Minutes | 5 | 7.5% |
| 5 to 9 Minutes | 5 | 7.5% |
| 10 to 14 Minutes | 11 | 16.4% |
| 15 to 19 Minutes | 18 | 26.9% |
| 20 to 24 Minutes | 5 | 7.5% |
| 25 to 29 Minutes | 4 | 6.0% |
| 30 to 34 Minutes | 11 | 16.4% |
| 35 to 39 Minutes | 1 | 1.5% |
| 40 to 44 Minutes | 3 | 4.5% |
| 45 to 59 Minutes | 4 | 6.0% |
| 60 to 89 Minutes | 0 | 0.0% |
| 90 or more Minutes | 0 | 0.0% |
Commute Time by Sex in Maalaea
The most common commute times in Maalaea are 10 to 14 minutes (8 commuters, 21.6%) for males and 15 to 19 minutes (11 commuters, 36.7%) for females.
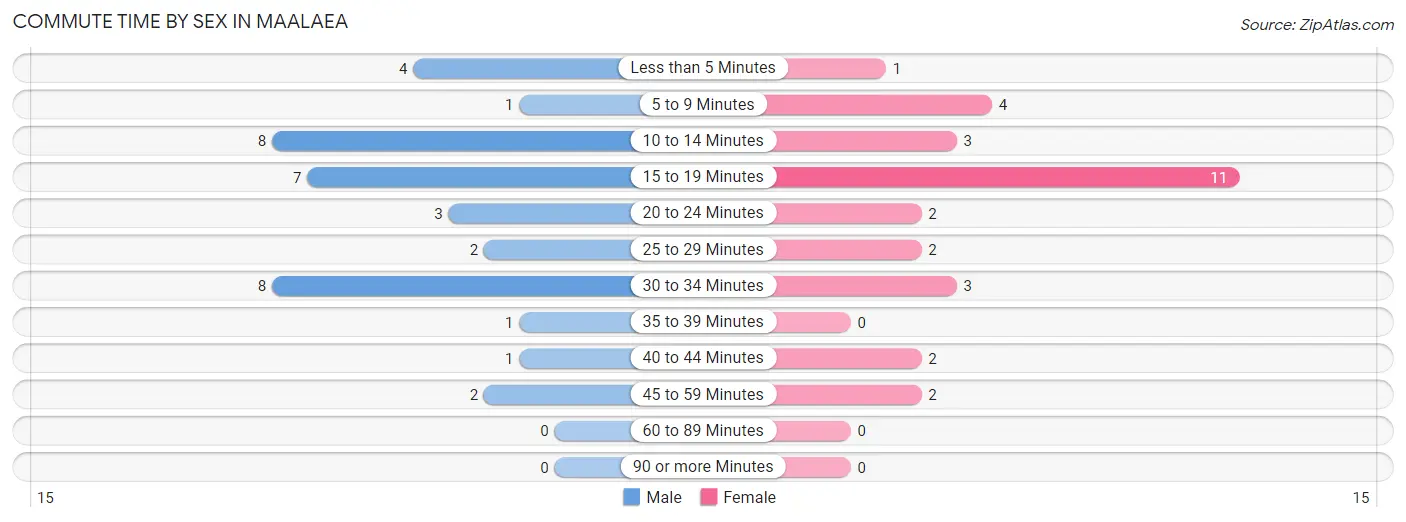
| Commute Time | Male | Female |
| Less than 5 Minutes | 4 (10.8%) | 1 (3.3%) |
| 5 to 9 Minutes | 1 (2.7%) | 4 (13.3%) |
| 10 to 14 Minutes | 8 (21.6%) | 3 (10.0%) |
| 15 to 19 Minutes | 7 (18.9%) | 11 (36.7%) |
| 20 to 24 Minutes | 3 (8.1%) | 2 (6.7%) |
| 25 to 29 Minutes | 2 (5.4%) | 2 (6.7%) |
| 30 to 34 Minutes | 8 (21.6%) | 3 (10.0%) |
| 35 to 39 Minutes | 1 (2.7%) | 0 (0.0%) |
| 40 to 44 Minutes | 1 (2.7%) | 2 (6.7%) |
| 45 to 59 Minutes | 2 (5.4%) | 2 (6.7%) |
| 60 to 89 Minutes | 0 (0.0%) | 0 (0.0%) |
| 90 or more Minutes | 0 (0.0%) | 0 (0.0%) |
Time of Departure to Work by Sex in Maalaea
The most frequent times of departure to work in Maalaea are 9:00 AM to 9:59 AM (7, 18.9%) for males and 6:30 AM to 6:59 AM (6, 20.0%) for females.
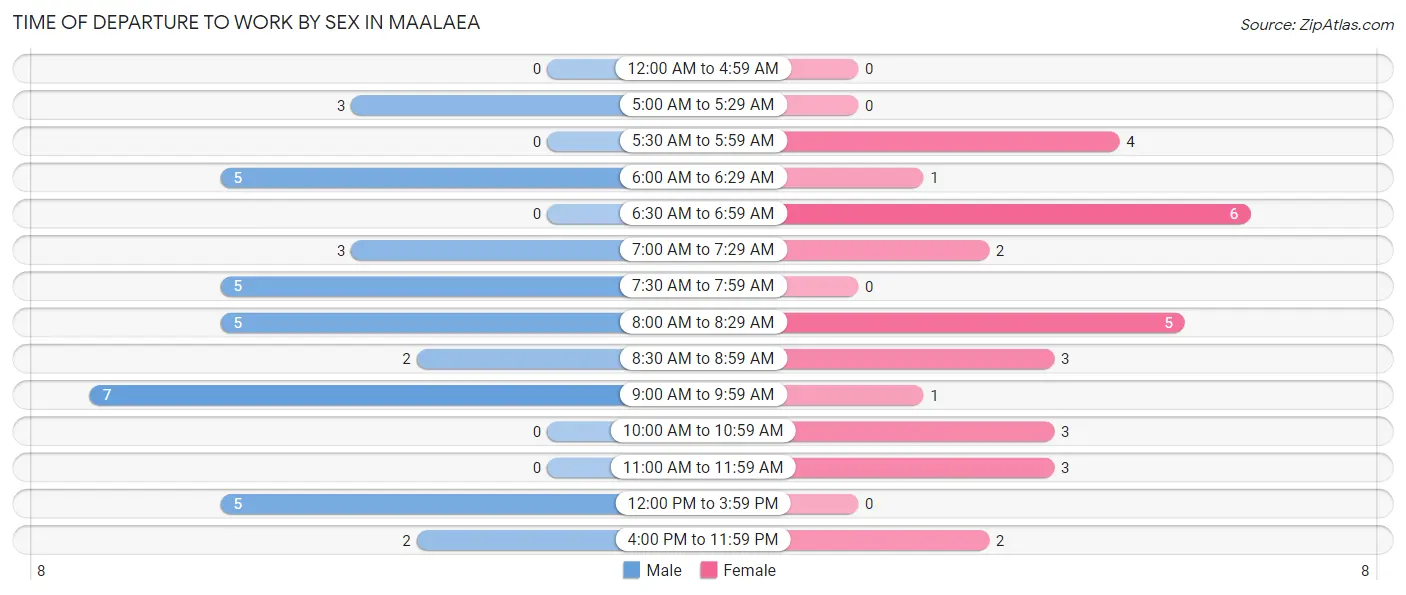
| Time of Departure | Male | Female |
| 12:00 AM to 4:59 AM | 0 (0.0%) | 0 (0.0%) |
| 5:00 AM to 5:29 AM | 3 (8.1%) | 0 (0.0%) |
| 5:30 AM to 5:59 AM | 0 (0.0%) | 4 (13.3%) |
| 6:00 AM to 6:29 AM | 5 (13.5%) | 1 (3.3%) |
| 6:30 AM to 6:59 AM | 0 (0.0%) | 6 (20.0%) |
| 7:00 AM to 7:29 AM | 3 (8.1%) | 2 (6.7%) |
| 7:30 AM to 7:59 AM | 5 (13.5%) | 0 (0.0%) |
| 8:00 AM to 8:29 AM | 5 (13.5%) | 5 (16.7%) |
| 8:30 AM to 8:59 AM | 2 (5.4%) | 3 (10.0%) |
| 9:00 AM to 9:59 AM | 7 (18.9%) | 1 (3.3%) |
| 10:00 AM to 10:59 AM | 0 (0.0%) | 3 (10.0%) |
| 11:00 AM to 11:59 AM | 0 (0.0%) | 3 (10.0%) |
| 12:00 PM to 3:59 PM | 5 (13.5%) | 0 (0.0%) |
| 4:00 PM to 11:59 PM | 2 (5.4%) | 2 (6.7%) |
| Total | 37 (100.0%) | 30 (100.0%) |
Housing Occupancy in Maalaea
Occupancy by Ownership in Maalaea
Of the total 142 dwellings in Maalaea, owner-occupied units account for 92 (64.8%), while renter-occupied units make up 50 (35.2%).
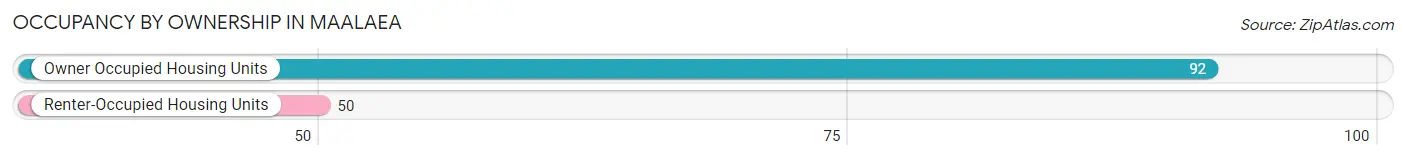
| Occupancy | # Housing Units | % Housing Units |
| Owner Occupied Housing Units | 92 | 64.8% |
| Renter-Occupied Housing Units | 50 | 35.2% |
| Total Occupied Housing Units | 142 | 100.0% |
Occupancy by Household Size in Maalaea
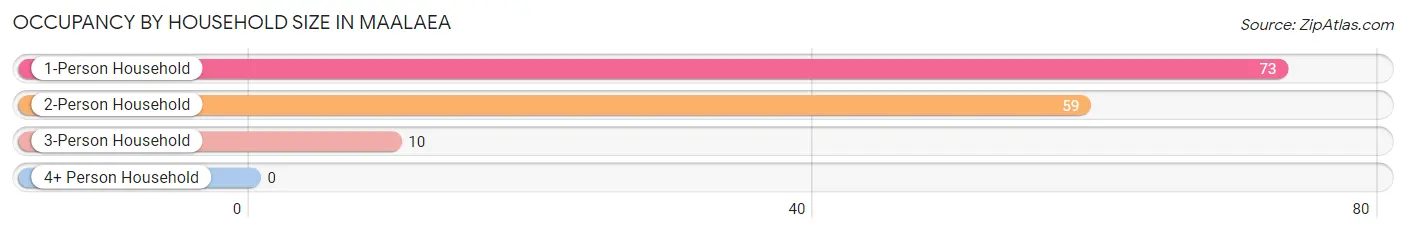
| Household Size | # Housing Units | % Housing Units |
| 1-Person Household | 73 | 51.4% |
| 2-Person Household | 59 | 41.5% |
| 3-Person Household | 10 | 7.0% |
| 4+ Person Household | 0 | 0.0% |
| Total Housing Units | 142 | 100.0% |
Occupancy by Ownership by Household Size in Maalaea
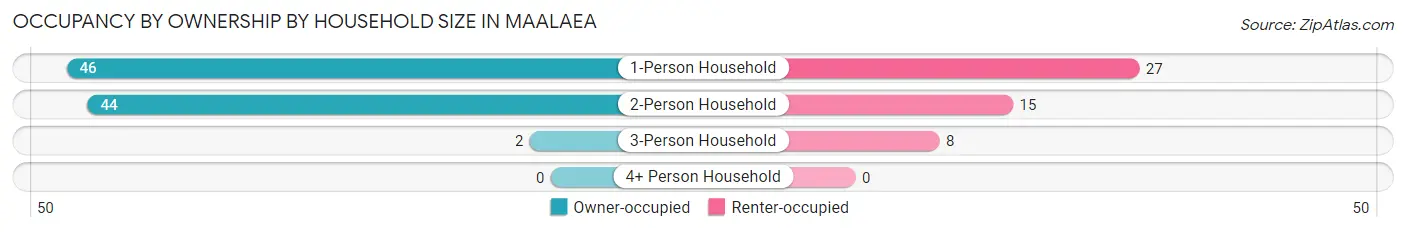
| Household Size | Owner-occupied | Renter-occupied |
| 1-Person Household | 46 (63.0%) | 27 (37.0%) |
| 2-Person Household | 44 (74.6%) | 15 (25.4%) |
| 3-Person Household | 2 (20.0%) | 8 (80.0%) |
| 4+ Person Household | 0 (0.0%) | 0 (0.0%) |
| Total Housing Units | 92 (64.8%) | 50 (35.2%) |
Occupancy by Educational Attainment in Maalaea
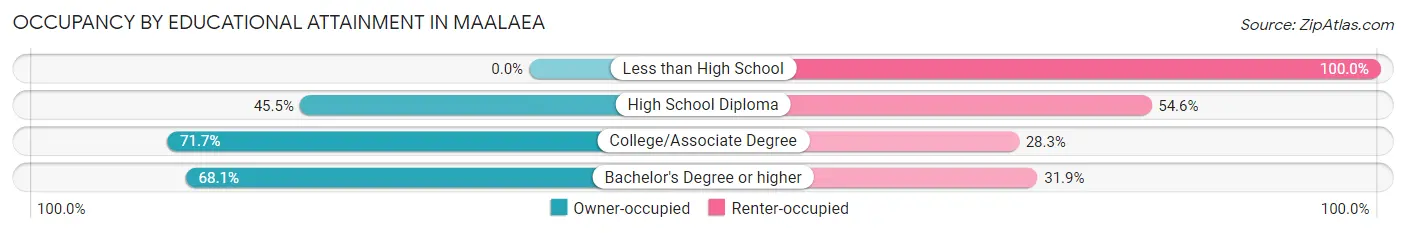
| Household Size | Owner-occupied | Renter-occupied |
| Less than High School | 0 (0.0%) | 2 (100.0%) |
| High School Diploma | 10 (45.5%) | 12 (54.5%) |
| College/Associate Degree | 33 (71.7%) | 13 (28.3%) |
| Bachelor's Degree or higher | 49 (68.1%) | 23 (31.9%) |
Occupancy by Age of Householder in Maalaea
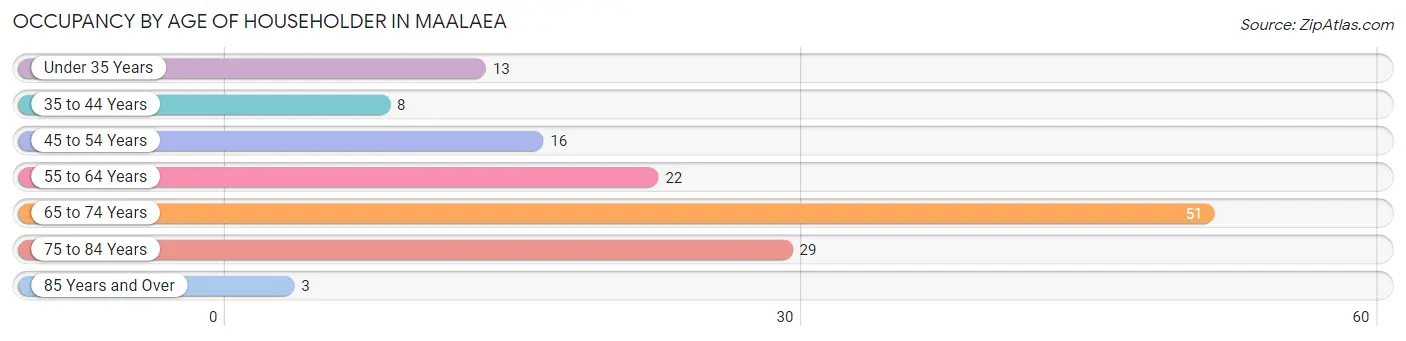
| Age Bracket | # Households | % Households |
| Under 35 Years | 13 | 9.1% |
| 35 to 44 Years | 8 | 5.6% |
| 45 to 54 Years | 16 | 11.3% |
| 55 to 64 Years | 22 | 15.5% |
| 65 to 74 Years | 51 | 35.9% |
| 75 to 84 Years | 29 | 20.4% |
| 85 Years and Over | 3 | 2.1% |
| Total | 142 | 100.0% |
Housing Finances in Maalaea
Median Income by Occupancy in Maalaea
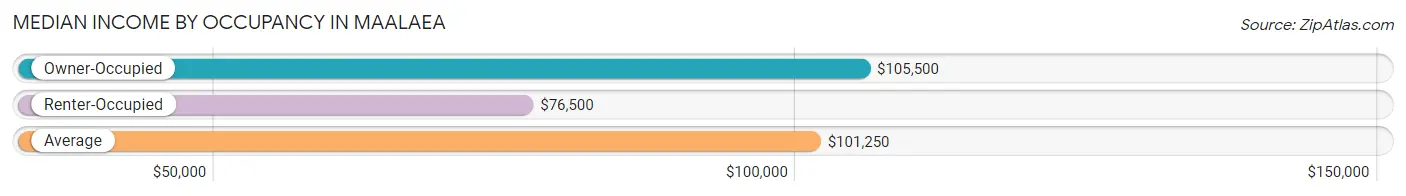
| Occupancy Type | # Households | Median Income |
| Owner-Occupied | 92 (64.8%) | $105,500 |
| Renter-Occupied | 50 (35.2%) | $76,500 |
| Average | 142 (100.0%) | $101,250 |
Occupancy by Householder Income Bracket in Maalaea
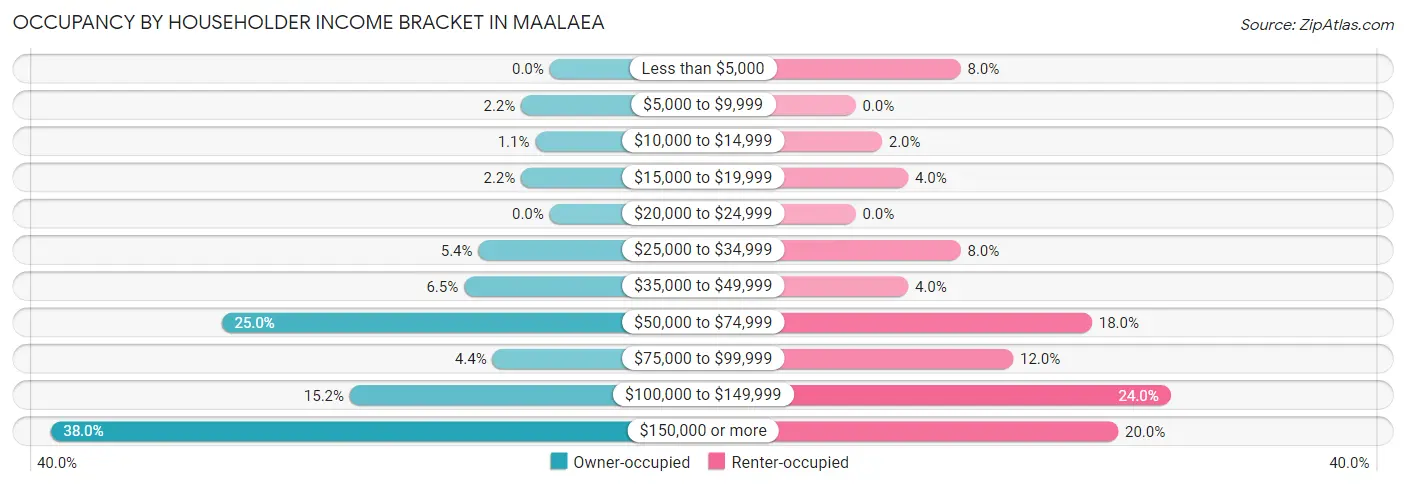
| Income Bracket | Owner-occupied | Renter-occupied |
| Less than $5,000 | 0 (0.0%) | 4 (8.0%) |
| $5,000 to $9,999 | 2 (2.2%) | 0 (0.0%) |
| $10,000 to $14,999 | 1 (1.1%) | 1 (2.0%) |
| $15,000 to $19,999 | 2 (2.2%) | 2 (4.0%) |
| $20,000 to $24,999 | 0 (0.0%) | 0 (0.0%) |
| $25,000 to $34,999 | 5 (5.4%) | 4 (8.0%) |
| $35,000 to $49,999 | 6 (6.5%) | 2 (4.0%) |
| $50,000 to $74,999 | 23 (25.0%) | 9 (18.0%) |
| $75,000 to $99,999 | 4 (4.3%) | 6 (12.0%) |
| $100,000 to $149,999 | 14 (15.2%) | 12 (24.0%) |
| $150,000 or more | 35 (38.0%) | 10 (20.0%) |
| Total | 92 (100.0%) | 50 (100.0%) |
Monthly Housing Cost Tiers in Maalaea
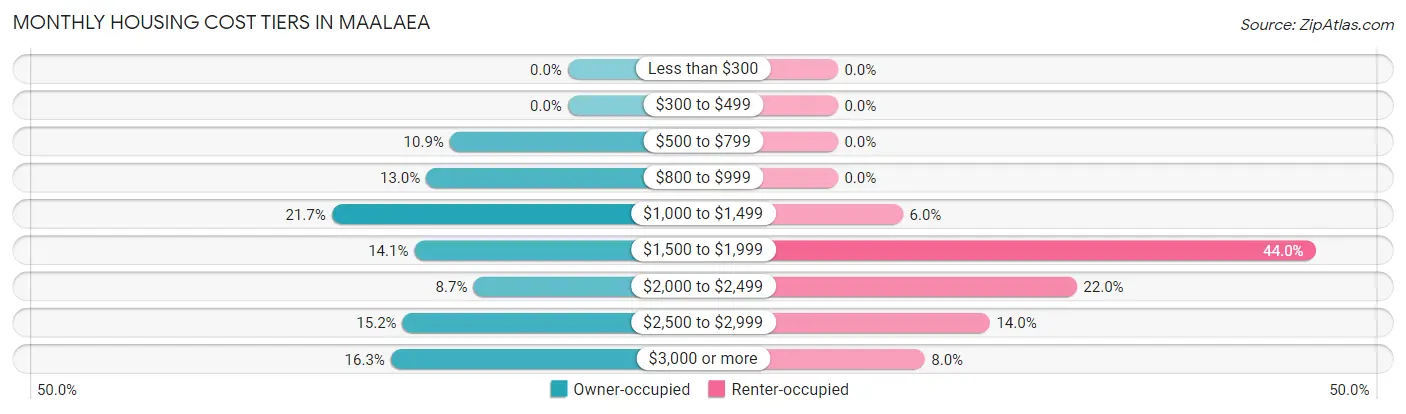
| Monthly Cost | Owner-occupied | Renter-occupied |
| Less than $300 | 0 (0.0%) | 0 (0.0%) |
| $300 to $499 | 0 (0.0%) | 0 (0.0%) |
| $500 to $799 | 10 (10.9%) | 0 (0.0%) |
| $800 to $999 | 12 (13.0%) | 0 (0.0%) |
| $1,000 to $1,499 | 20 (21.7%) | 3 (6.0%) |
| $1,500 to $1,999 | 13 (14.1%) | 22 (44.0%) |
| $2,000 to $2,499 | 8 (8.7%) | 11 (22.0%) |
| $2,500 to $2,999 | 14 (15.2%) | 7 (14.0%) |
| $3,000 or more | 15 (16.3%) | 4 (8.0%) |
| Total | 92 (100.0%) | 50 (100.0%) |
Physical Housing Characteristics in Maalaea
Housing Structures in Maalaea
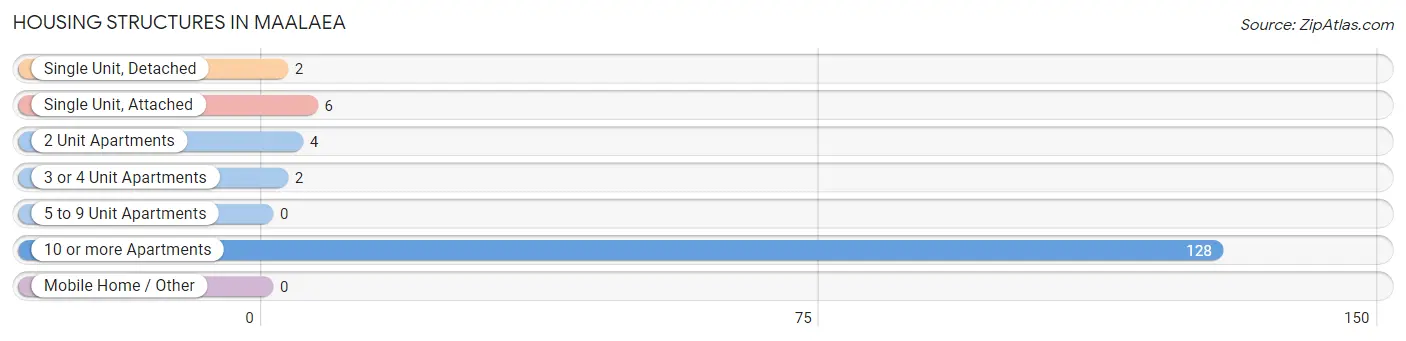
| Structure Type | # Housing Units | % Housing Units |
| Single Unit, Detached | 2 | 1.4% |
| Single Unit, Attached | 6 | 4.2% |
| 2 Unit Apartments | 4 | 2.8% |
| 3 or 4 Unit Apartments | 2 | 1.4% |
| 5 to 9 Unit Apartments | 0 | 0.0% |
| 10 or more Apartments | 128 | 90.1% |
| Mobile Home / Other | 0 | 0.0% |
| Total | 142 | 100.0% |
Housing Structures by Occupancy in Maalaea
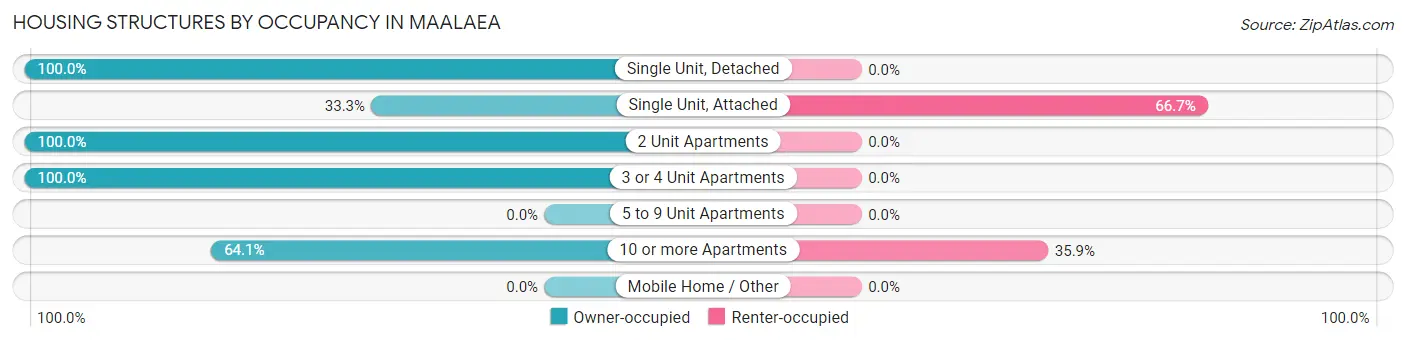
| Structure Type | Owner-occupied | Renter-occupied |
| Single Unit, Detached | 2 (100.0%) | 0 (0.0%) |
| Single Unit, Attached | 2 (33.3%) | 4 (66.7%) |
| 2 Unit Apartments | 4 (100.0%) | 0 (0.0%) |
| 3 or 4 Unit Apartments | 2 (100.0%) | 0 (0.0%) |
| 5 to 9 Unit Apartments | 0 (0.0%) | 0 (0.0%) |
| 10 or more Apartments | 82 (64.1%) | 46 (35.9%) |
| Mobile Home / Other | 0 (0.0%) | 0 (0.0%) |
| Total | 92 (64.8%) | 50 (35.2%) |
Housing Structures by Number of Rooms in Maalaea
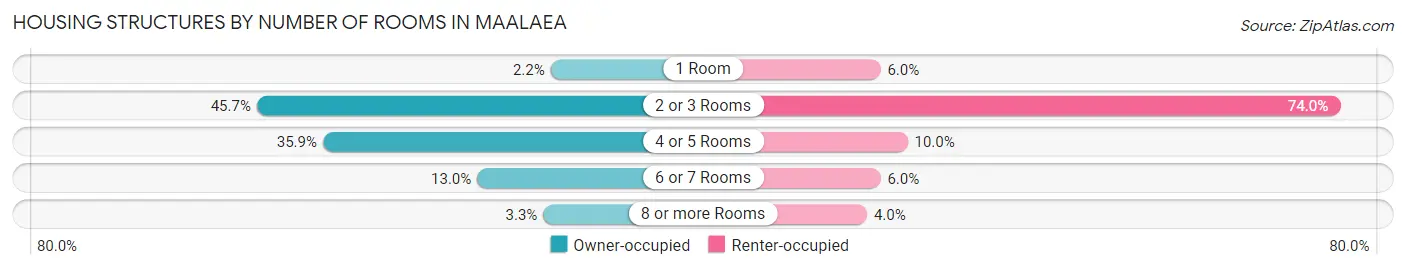
| Number of Rooms | Owner-occupied | Renter-occupied |
| 1 Room | 2 (2.2%) | 3 (6.0%) |
| 2 or 3 Rooms | 42 (45.7%) | 37 (74.0%) |
| 4 or 5 Rooms | 33 (35.9%) | 5 (10.0%) |
| 6 or 7 Rooms | 12 (13.0%) | 3 (6.0%) |
| 8 or more Rooms | 3 (3.3%) | 2 (4.0%) |
| Total | 92 (100.0%) | 50 (100.0%) |
Housing Structure by Heating Type in Maalaea
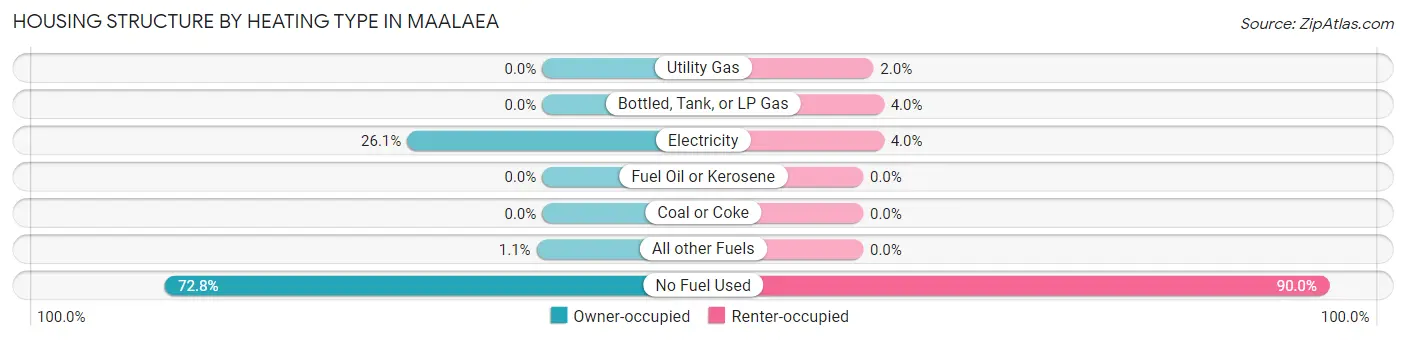
| Heating Type | Owner-occupied | Renter-occupied |
| Utility Gas | 0 (0.0%) | 1 (2.0%) |
| Bottled, Tank, or LP Gas | 0 (0.0%) | 2 (4.0%) |
| Electricity | 24 (26.1%) | 2 (4.0%) |
| Fuel Oil or Kerosene | 0 (0.0%) | 0 (0.0%) |
| Coal or Coke | 0 (0.0%) | 0 (0.0%) |
| All other Fuels | 1 (1.1%) | 0 (0.0%) |
| No Fuel Used | 67 (72.8%) | 45 (90.0%) |
| Total | 92 (100.0%) | 50 (100.0%) |
Household Vehicle Usage in Maalaea
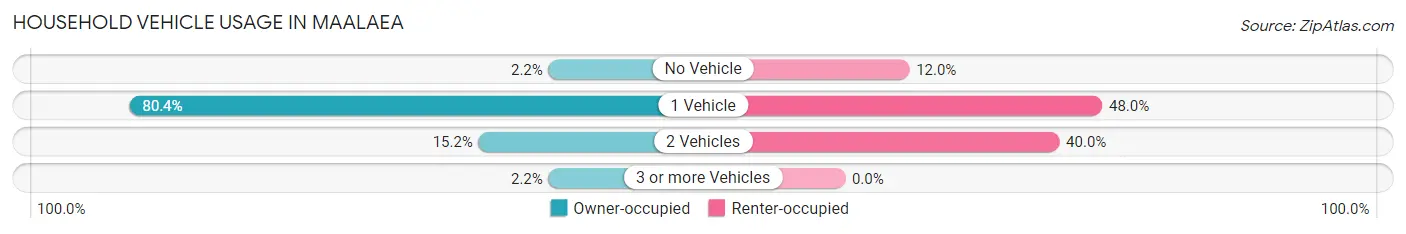
| Vehicles per Household | Owner-occupied | Renter-occupied |
| No Vehicle | 2 (2.2%) | 6 (12.0%) |
| 1 Vehicle | 74 (80.4%) | 24 (48.0%) |
| 2 Vehicles | 14 (15.2%) | 20 (40.0%) |
| 3 or more Vehicles | 2 (2.2%) | 0 (0.0%) |
| Total | 92 (100.0%) | 50 (100.0%) |
Real Estate & Mortgages in Maalaea
Real Estate and Mortgage Overview in Maalaea
| Characteristic | Without Mortgage | With Mortgage |
| Housing Units | 57 | 35 |
| Median Property Value | $460,700 | $586,500 |
| Median Household Income | $106,750 | $13 |
| Monthly Housing Costs | $1,163 | $15 |
| Real Estate Taxes | $2,333 | $2 |
Property Value by Mortgage Status in Maalaea
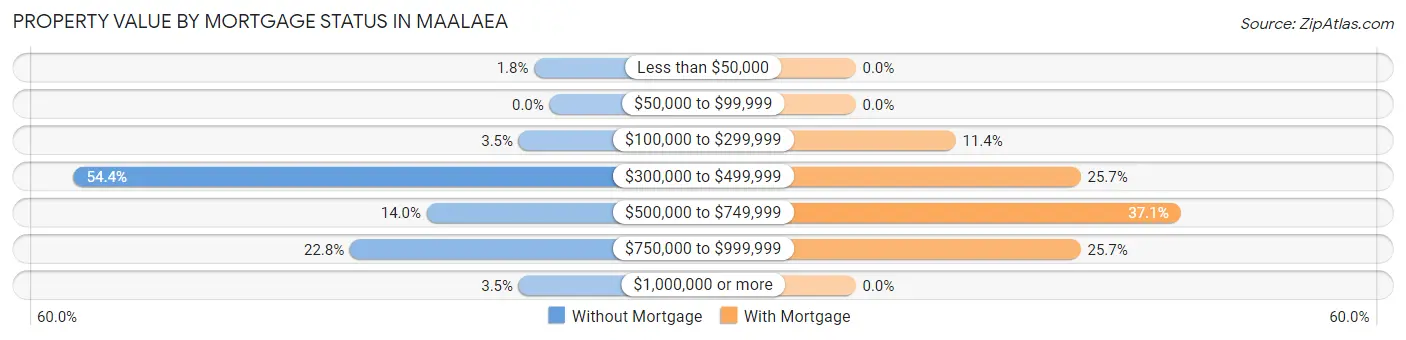
| Property Value | Without Mortgage | With Mortgage |
| Less than $50,000 | 1 (1.8%) | 0 (0.0%) |
| $50,000 to $99,999 | 0 (0.0%) | 0 (0.0%) |
| $100,000 to $299,999 | 2 (3.5%) | 4 (11.4%) |
| $300,000 to $499,999 | 31 (54.4%) | 9 (25.7%) |
| $500,000 to $749,999 | 8 (14.0%) | 13 (37.1%) |
| $750,000 to $999,999 | 13 (22.8%) | 9 (25.7%) |
| $1,000,000 or more | 2 (3.5%) | 0 (0.0%) |
| Total | 57 (100.0%) | 35 (100.0%) |
Household Income by Mortgage Status in Maalaea
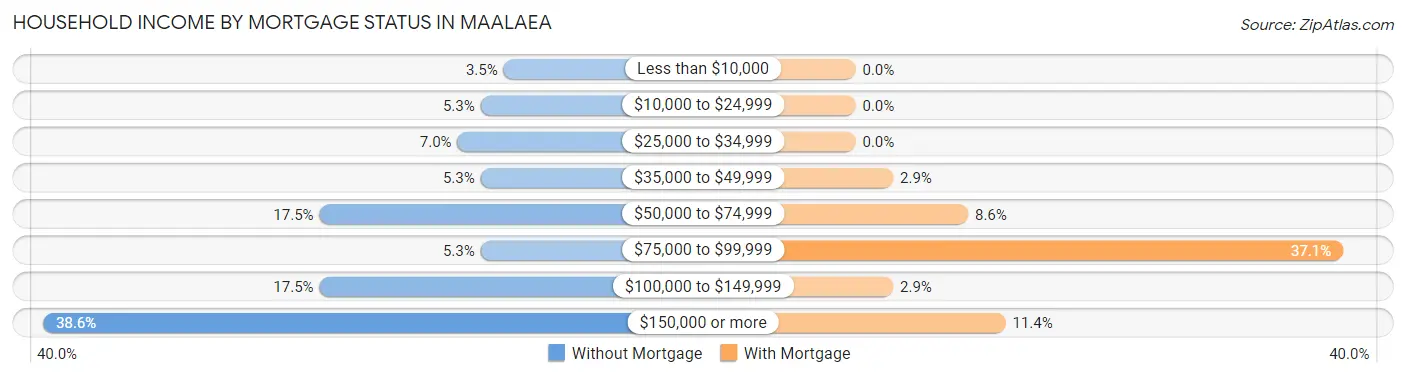
| Household Income | Without Mortgage | With Mortgage |
| Less than $10,000 | 2 (3.5%) | 0 (0.0%) |
| $10,000 to $24,999 | 3 (5.3%) | 0 (0.0%) |
| $25,000 to $34,999 | 4 (7.0%) | 0 (0.0%) |
| $35,000 to $49,999 | 3 (5.3%) | 1 (2.9%) |
| $50,000 to $74,999 | 10 (17.5%) | 3 (8.6%) |
| $75,000 to $99,999 | 3 (5.3%) | 13 (37.1%) |
| $100,000 to $149,999 | 10 (17.5%) | 1 (2.9%) |
| $150,000 or more | 22 (38.6%) | 4 (11.4%) |
| Total | 57 (100.0%) | 35 (100.0%) |
Property Value to Household Income Ratio in Maalaea
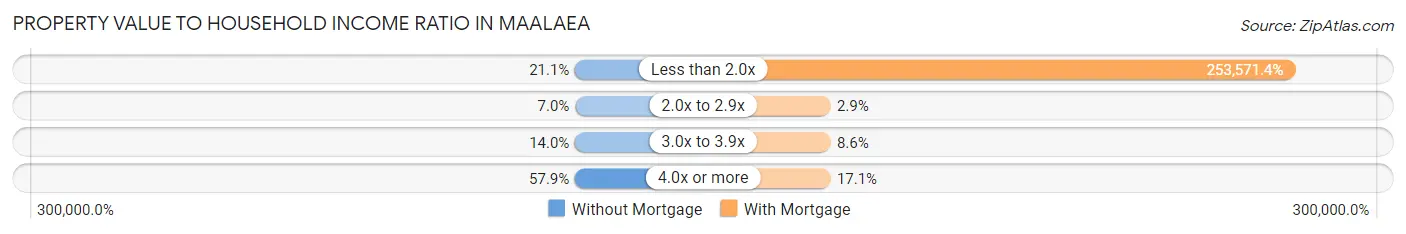
| Value-to-Income Ratio | Without Mortgage | With Mortgage |
| Less than 2.0x | 12 (21.0%) | 88,750 (253,571.4%) |
| 2.0x to 2.9x | 4 (7.0%) | 1 (2.9%) |
| 3.0x to 3.9x | 8 (14.0%) | 3 (8.6%) |
| 4.0x or more | 33 (57.9%) | 6 (17.1%) |
| Total | 57 (100.0%) | 35 (100.0%) |
Real Estate Taxes by Mortgage Status in Maalaea
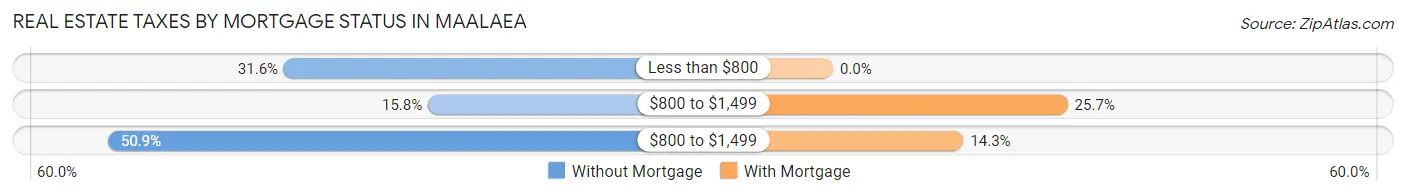
| Property Taxes | Without Mortgage | With Mortgage |
| Less than $800 | 18 (31.6%) | 0 (0.0%) |
| $800 to $1,499 | 9 (15.8%) | 9 (25.7%) |
| $800 to $1,499 | 29 (50.9%) | 5 (14.3%) |
| Total | 57 (100.0%) | 35 (100.0%) |
Health & Disability in Maalaea
Health Insurance Coverage by Age in Maalaea
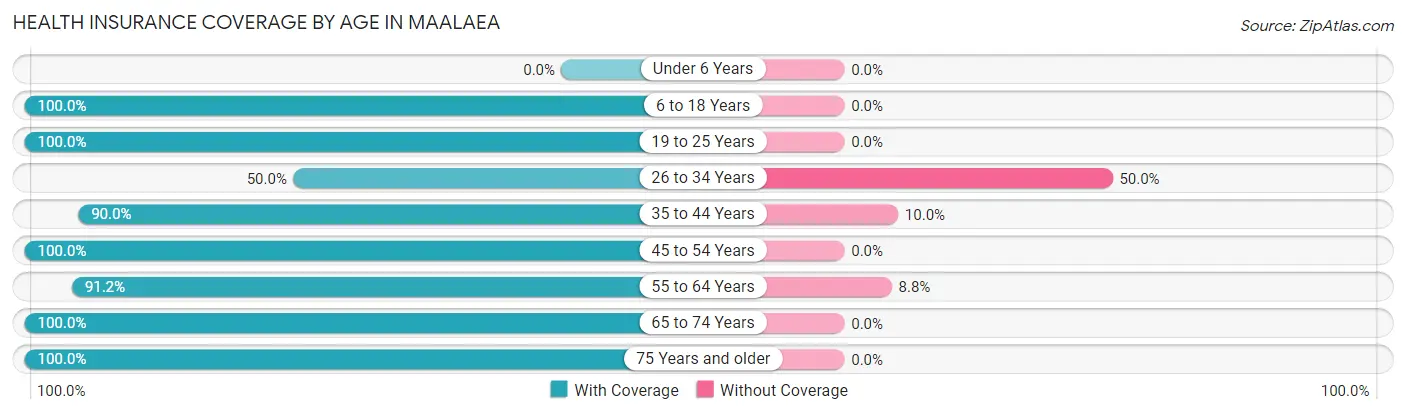
| Age Bracket | With Coverage | Without Coverage |
| Under 6 Years | 0 (0.0%) | 0 (0.0%) |
| 6 to 18 Years | 3 (100.0%) | 0 (0.0%) |
| 19 to 25 Years | 1 (100.0%) | 0 (0.0%) |
| 26 to 34 Years | 12 (50.0%) | 12 (50.0%) |
| 35 to 44 Years | 9 (90.0%) | 1 (10.0%) |
| 45 to 54 Years | 22 (100.0%) | 0 (0.0%) |
| 55 to 64 Years | 31 (91.2%) | 3 (8.8%) |
| 65 to 74 Years | 77 (100.0%) | 0 (0.0%) |
| 75 Years and older | 39 (100.0%) | 0 (0.0%) |
| Total | 194 (92.4%) | 16 (7.6%) |
Health Insurance Coverage by Citizenship Status in Maalaea
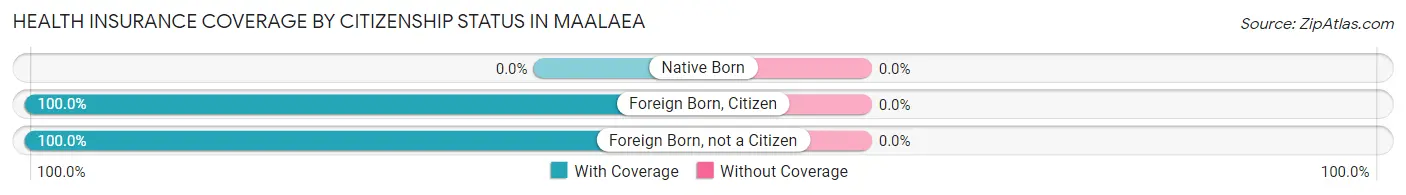
| Citizenship Status | With Coverage | Without Coverage |
| Native Born | 0 (0.0%) | 0 (0.0%) |
| Foreign Born, Citizen | 3 (100.0%) | 0 (0.0%) |
| Foreign Born, not a Citizen | 1 (100.0%) | 0 (0.0%) |
Health Insurance Coverage by Household Income in Maalaea
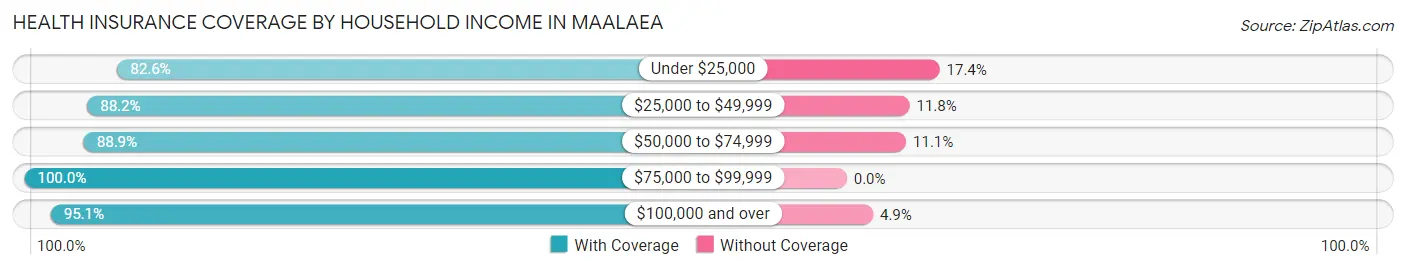
| Household Income | With Coverage | Without Coverage |
| Under $25,000 | 19 (82.6%) | 4 (17.4%) |
| $25,000 to $49,999 | 15 (88.2%) | 2 (11.8%) |
| $50,000 to $74,999 | 32 (88.9%) | 4 (11.1%) |
| $75,000 to $99,999 | 12 (100.0%) | 0 (0.0%) |
| $100,000 and over | 116 (95.1%) | 6 (4.9%) |
Public vs Private Health Insurance Coverage by Age in Maalaea
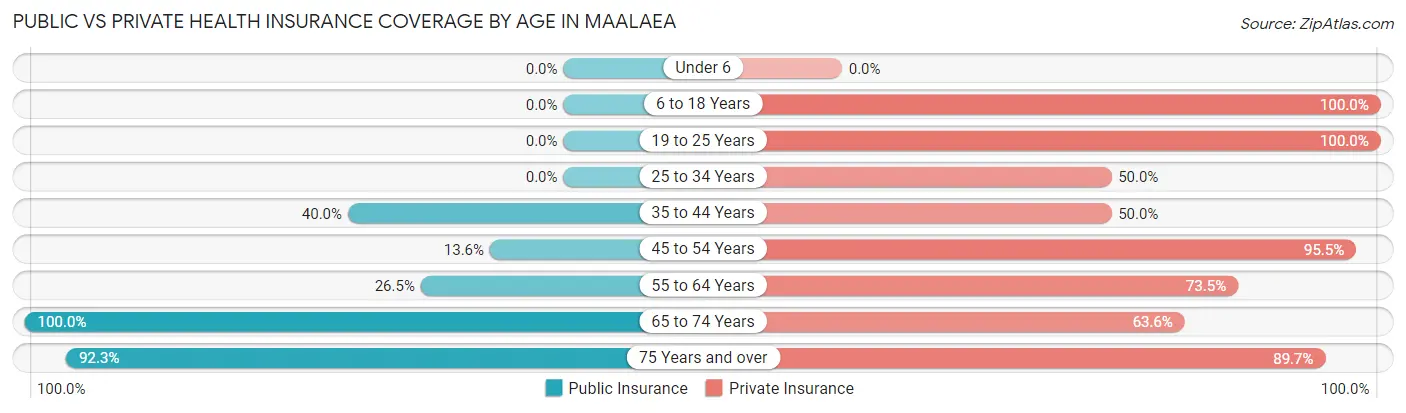
| Age Bracket | Public Insurance | Private Insurance |
| Under 6 | 0 (0.0%) | 0 (0.0%) |
| 6 to 18 Years | 0 (0.0%) | 3 (100.0%) |
| 19 to 25 Years | 0 (0.0%) | 1 (100.0%) |
| 25 to 34 Years | 0 (0.0%) | 12 (50.0%) |
| 35 to 44 Years | 4 (40.0%) | 5 (50.0%) |
| 45 to 54 Years | 3 (13.6%) | 21 (95.5%) |
| 55 to 64 Years | 9 (26.5%) | 25 (73.5%) |
| 65 to 74 Years | 77 (100.0%) | 49 (63.6%) |
| 75 Years and over | 36 (92.3%) | 35 (89.7%) |
| Total | 129 (61.4%) | 151 (71.9%) |
Disability Status by Sex by Age in Maalaea
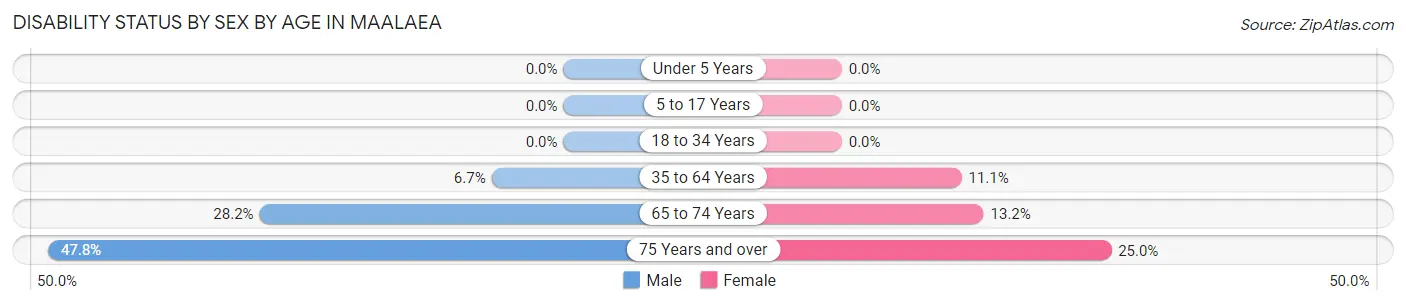
| Age Bracket | Male | Female |
| Under 5 Years | 0 (0.0%) | 0 (0.0%) |
| 5 to 17 Years | 0 (0.0%) | 0 (0.0%) |
| 18 to 34 Years | 0 (0.0%) | 0 (0.0%) |
| 35 to 64 Years | 2 (6.7%) | 4 (11.1%) |
| 65 to 74 Years | 11 (28.2%) | 5 (13.2%) |
| 75 Years and over | 11 (47.8%) | 4 (25.0%) |
Disability Class by Sex by Age in Maalaea
Disability Class: Hearing Difficulty
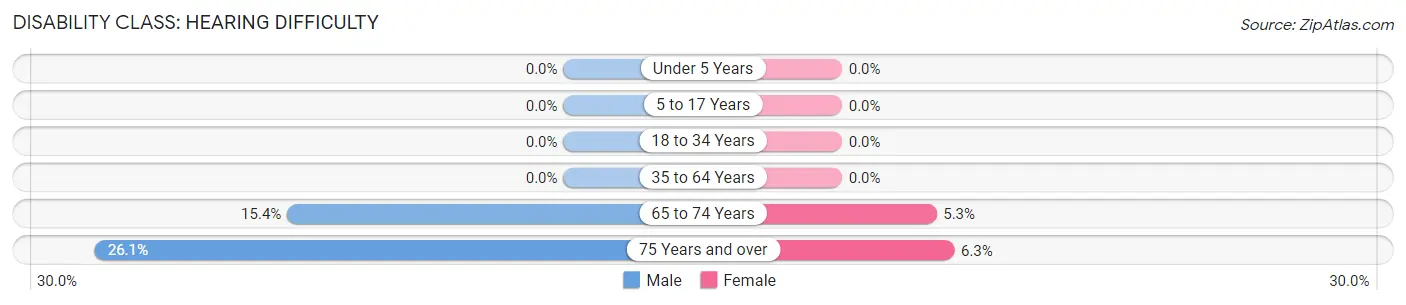
| Age Bracket | Male | Female |
| Under 5 Years | 0 (0.0%) | 0 (0.0%) |
| 5 to 17 Years | 0 (0.0%) | 0 (0.0%) |
| 18 to 34 Years | 0 (0.0%) | 0 (0.0%) |
| 35 to 64 Years | 0 (0.0%) | 0 (0.0%) |
| 65 to 74 Years | 6 (15.4%) | 2 (5.3%) |
| 75 Years and over | 6 (26.1%) | 1 (6.2%) |
Disability Class: Vision Difficulty
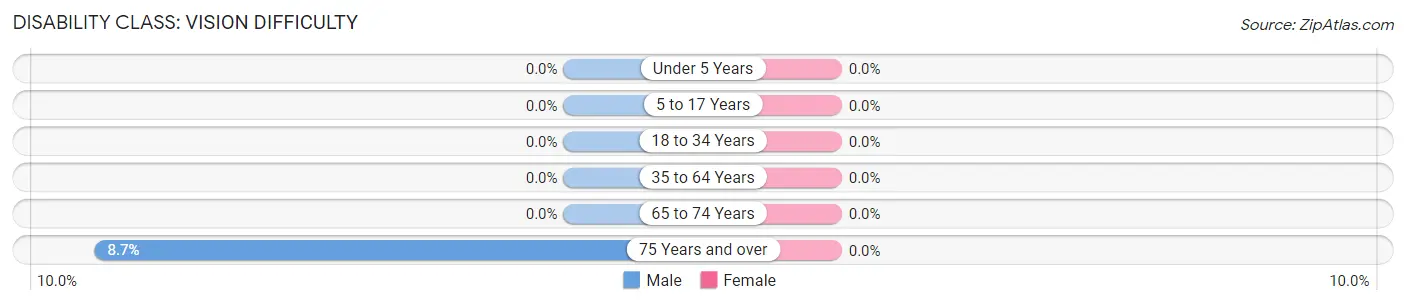
| Age Bracket | Male | Female |
| Under 5 Years | 0 (0.0%) | 0 (0.0%) |
| 5 to 17 Years | 0 (0.0%) | 0 (0.0%) |
| 18 to 34 Years | 0 (0.0%) | 0 (0.0%) |
| 35 to 64 Years | 0 (0.0%) | 0 (0.0%) |
| 65 to 74 Years | 0 (0.0%) | 0 (0.0%) |
| 75 Years and over | 2 (8.7%) | 0 (0.0%) |
Disability Class: Cognitive Difficulty
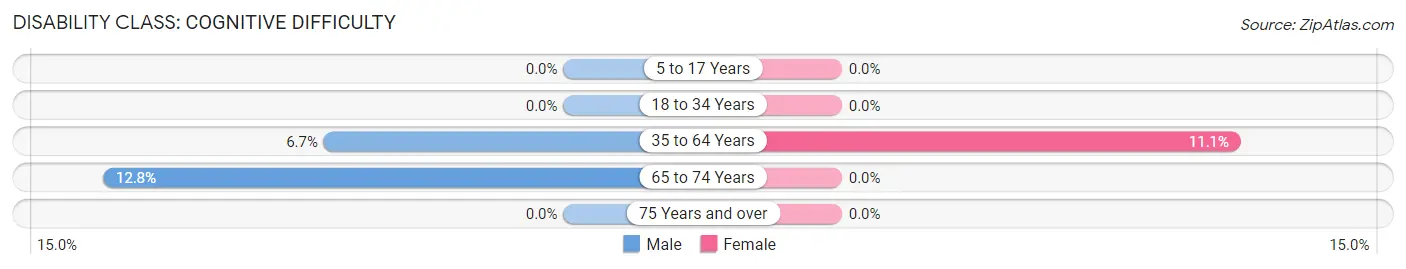
| Age Bracket | Male | Female |
| 5 to 17 Years | 0 (0.0%) | 0 (0.0%) |
| 18 to 34 Years | 0 (0.0%) | 0 (0.0%) |
| 35 to 64 Years | 2 (6.7%) | 4 (11.1%) |
| 65 to 74 Years | 5 (12.8%) | 0 (0.0%) |
| 75 Years and over | 0 (0.0%) | 0 (0.0%) |
Disability Class: Ambulatory Difficulty
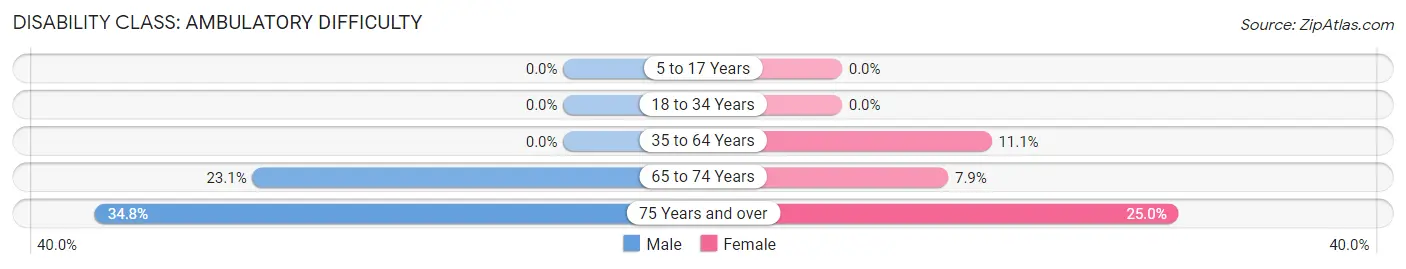
| Age Bracket | Male | Female |
| 5 to 17 Years | 0 (0.0%) | 0 (0.0%) |
| 18 to 34 Years | 0 (0.0%) | 0 (0.0%) |
| 35 to 64 Years | 0 (0.0%) | 4 (11.1%) |
| 65 to 74 Years | 9 (23.1%) | 3 (7.9%) |
| 75 Years and over | 8 (34.8%) | 4 (25.0%) |
Disability Class: Self-Care Difficulty
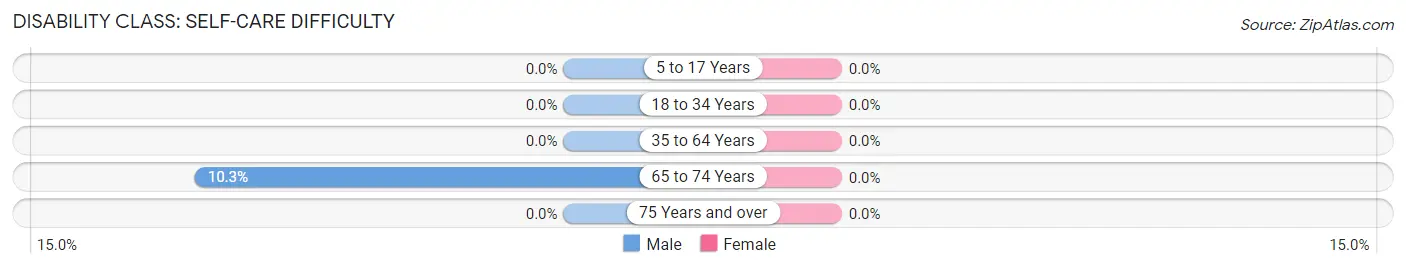
| Age Bracket | Male | Female |
| 5 to 17 Years | 0 (0.0%) | 0 (0.0%) |
| 18 to 34 Years | 0 (0.0%) | 0 (0.0%) |
| 35 to 64 Years | 0 (0.0%) | 0 (0.0%) |
| 65 to 74 Years | 4 (10.3%) | 0 (0.0%) |
| 75 Years and over | 0 (0.0%) | 0 (0.0%) |
Technology Access in Maalaea
Computing Device Access in Maalaea
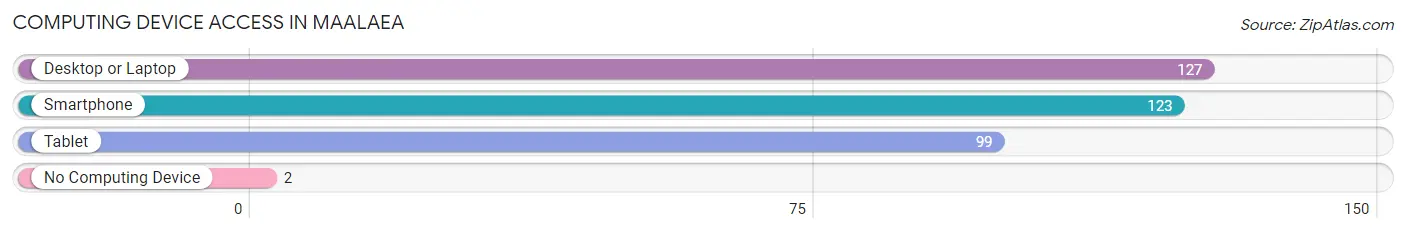
| Device Type | # Households | % Households |
| Desktop or Laptop | 127 | 89.4% |
| Smartphone | 123 | 86.6% |
| Tablet | 99 | 69.7% |
| No Computing Device | 2 | 1.4% |
| Total | 142 | 100.0% |
Internet Access in Maalaea
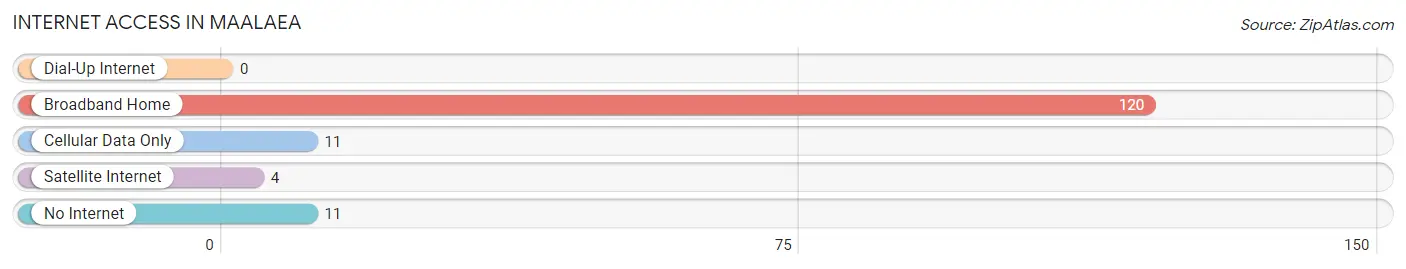
| Internet Type | # Households | % Households |
| Dial-Up Internet | 0 | 0.0% |
| Broadband Home | 120 | 84.5% |
| Cellular Data Only | 11 | 7.7% |
| Satellite Internet | 4 | 2.8% |
| No Internet | 11 | 7.7% |
| Total | 142 | 100.0% |
Maalaea Summary
Maalaea is a small unincorporated community located on the island of Maui in the state of Hawaii. It is located on the western side of the island, just south of the city of Lahaina. The community is situated on the shore of Maalaea Bay, which is a popular spot for fishing, swimming, and other recreational activities.
History
The area now known as Maalaea has a long and rich history. It was first settled by Polynesian voyagers in the late 1700s, and the area was used for fishing and farming. In the early 1800s, the area was used as a whaling station, and the whaling industry was a major part of the local economy. In the late 1800s, the area was developed as a sugar plantation, and the sugar industry was a major part of the local economy until the mid-1900s.
Geography
Maalaea is located on the western side of the island of Maui, just south of the city of Lahaina. The community is situated on the shore of Maalaea Bay, which is a popular spot for fishing, swimming, and other recreational activities. The bay is also home to a variety of marine life, including dolphins, whales, and sea turtles. The area is also home to a variety of plants and animals, including native Hawaiian plants and birds.
Economy
The economy of Maalaea is largely based on tourism. The area is home to a variety of hotels, resorts, and other tourist attractions, including the Maui Ocean Center, which is a popular aquarium and marine life center. The area is also home to a variety of restaurants, shops, and other businesses that cater to tourists. In addition, the area is home to a variety of fishing and boating businesses, as well as a number of charter boat companies.
Demographics
As of the 2010 census, the population of Maalaea was 1,845. The population is largely made up of Native Hawaiians and other Pacific Islanders, as well as a small number of Asian Americans and Caucasians. The median household income in the area is $50,000, and the median age is 44. The area is largely rural, with most of the population living in single-family homes.
Conclusion
Maalaea is a small unincorporated community located on the island of Maui in the state of Hawaii. It is situated on the shore of Maalaea Bay, which is a popular spot for fishing, swimming, and other recreational activities. The area has a long and rich history, and the economy is largely based on tourism. The population is largely made up of Native Hawaiians and other Pacific Islanders, as well as a small number of Asian Americans and Caucasians. The area is largely rural, with most of the population living in single-family homes.
Common Questions
What is Per Capita Income in Maalaea?
Per Capita income in Maalaea is $88,395.
What is the Median Family Income in Maalaea?
Median Family Income in Maalaea is $153,000.
What is the Median Household income in Maalaea?
Median Household Income in Maalaea is $101,250.
What is Income or Wage Gap in Maalaea?
Income or Wage Gap in Maalaea is 6.5%.
Women in Maalaea earn 93.5 cents for every dollar earned by a man.
What is Inequality or Gini Index in Maalaea?
Inequality or Gini Index in Maalaea is 0.47.
What is the Total Population of Maalaea?
Total Population of Maalaea is 214.
What is the Total Male Population of Maalaea?
Total Male Population of Maalaea is 114.
What is the Total Female Population of Maalaea?
Total Female Population of Maalaea is 100.
What is the Ratio of Males per 100 Females in Maalaea?
There are 114.00 Males per 100 Females in Maalaea.
What is the Ratio of Females per 100 Males in Maalaea?
There are 87.72 Females per 100 Males in Maalaea.
What is the Median Population Age in Maalaea?
Median Population Age in Maalaea is 67.3 Years.
What is the Average Family Size in Maalaea
Average Family Size in Maalaea is 1.9 People.
What is the Average Household Size in Maalaea
Average Household Size in Maalaea is 1.5 People.
How Large is the Labor Force in Maalaea?
There are 96 People in the Labor Forcein in Maalaea.
What is the Percentage of People in the Labor Force in Maalaea?
45.5% of People are in the Labor Force in Maalaea.
What is the Unemployment Rate in Maalaea?
Unemployment Rate in Maalaea is 16.3%.