Princeville, HI Map & Demographics
Princeville Map
Princeville Overview
$54,103
PER CAPITA INCOME
$91,989
AVG FAMILY INCOME
$82,250
AVG HOUSEHOLD INCOME
45.2%
WAGE / INCOME GAP [ % ]
54.8¢/ $1
WAGE / INCOME GAP [ $ ]
$10,633
FAMILY INCOME DEFICIT
0.49
INEQUALITY / GINI INDEX
2,007
TOTAL POPULATION
836
MALE POPULATION
1,171
FEMALE POPULATION
71.39
MALES / 100 FEMALES
140.07
FEMALES / 100 MALES
51.8
MEDIAN AGE
2.5
AVG FAMILY SIZE
2.2
AVG HOUSEHOLD SIZE
900
LABOR FORCE [ PEOPLE ]
55.3%
PERCENT IN LABOR FORCE
5.3%
UNEMPLOYMENT RATE
Princeville Zip Codes
Princeville Area Codes
Income in Princeville
Income Overview in Princeville
Per Capita Income in Princeville is $54,103, while median incomes of families and households are $91,989 and $82,250 respectively.
| Characteristic | Number | Measure |
| Per Capita Income | 2,007 | $54,103 |
| Median Family Income | 615 | $91,989 |
| Mean Family Income | 615 | $140,409 |
| Median Household Income | 927 | $82,250 |
| Mean Household Income | 927 | $123,628 |
| Income Deficit | 615 | $10,633 |
| Wage / Income Gap (%) | 2,007 | 45.22% |
| Wage / Income Gap ($) | 2,007 | 54.78¢ per $1 |
| Gini / Inequality Index | 2,007 | 0.49 |
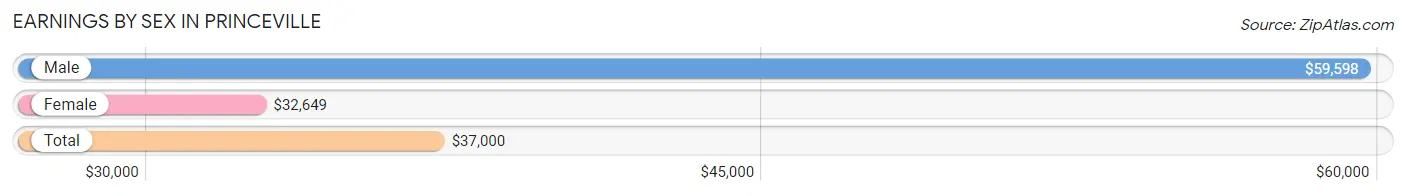
Earnings by Sex in Princeville
Average Earnings in Princeville are $37,000, $59,598 for men and $32,649 for women, a difference of 45.2%.
| Sex | Number | Average Earnings |
| Male | 345 (36.1%) | $59,598 |
| Female | 611 (63.9%) | $32,649 |
| Total | 956 (100.0%) | $37,000 |
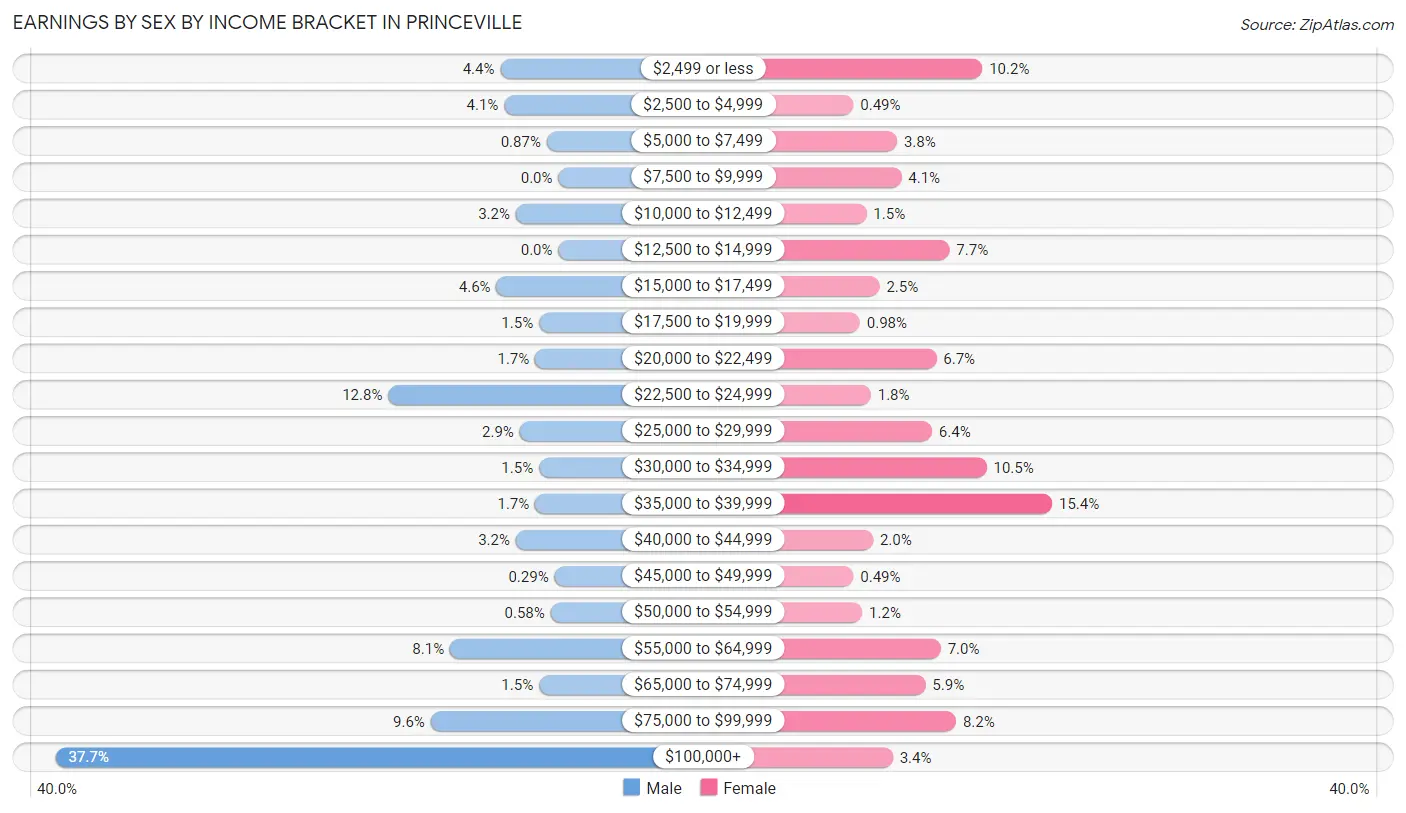
Earnings by Sex by Income Bracket in Princeville
The most common earnings brackets in Princeville are $100,000+ for men (130 | 37.7%) and $35,000 to $39,999 for women (94 | 15.4%).
| Income | Male | Female |
| $2,499 or less | 15 (4.3%) | 62 (10.2%) |
| $2,500 to $4,999 | 14 (4.1%) | 3 (0.5%) |
| $5,000 to $7,499 | 3 (0.9%) | 23 (3.8%) |
| $7,500 to $9,999 | 0 (0.0%) | 25 (4.1%) |
| $10,000 to $12,499 | 11 (3.2%) | 9 (1.5%) |
| $12,500 to $14,999 | 0 (0.0%) | 47 (7.7%) |
| $15,000 to $17,499 | 16 (4.6%) | 15 (2.5%) |
| $17,500 to $19,999 | 5 (1.5%) | 6 (1.0%) |
| $20,000 to $22,499 | 6 (1.7%) | 41 (6.7%) |
| $22,500 to $24,999 | 44 (12.8%) | 11 (1.8%) |
| $25,000 to $29,999 | 10 (2.9%) | 39 (6.4%) |
| $30,000 to $34,999 | 5 (1.5%) | 64 (10.5%) |
| $35,000 to $39,999 | 6 (1.7%) | 94 (15.4%) |
| $40,000 to $44,999 | 11 (3.2%) | 12 (2.0%) |
| $45,000 to $49,999 | 1 (0.3%) | 3 (0.5%) |
| $50,000 to $54,999 | 2 (0.6%) | 7 (1.1%) |
| $55,000 to $64,999 | 28 (8.1%) | 43 (7.0%) |
| $65,000 to $74,999 | 5 (1.5%) | 36 (5.9%) |
| $75,000 to $99,999 | 33 (9.6%) | 50 (8.2%) |
| $100,000+ | 130 (37.7%) | 21 (3.4%) |
| Total | 345 (100.0%) | 611 (100.0%) |
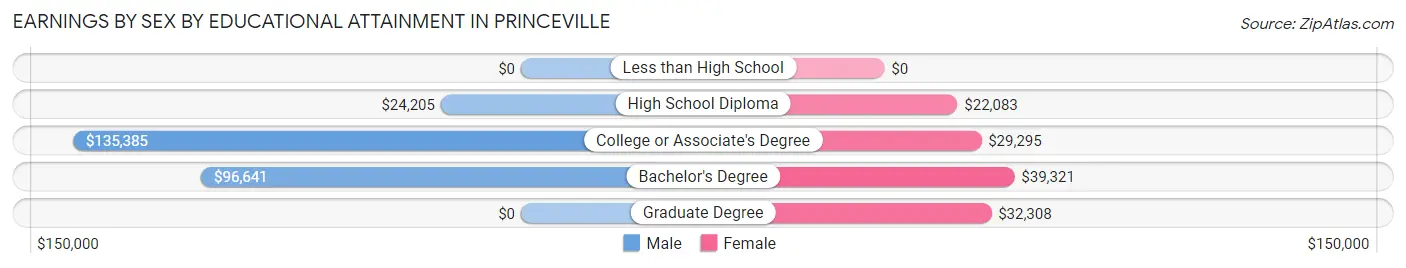
Earnings by Sex by Educational Attainment in Princeville
Average earnings in Princeville are $59,821 for men and $34,286 for women, a difference of 42.7%. Men with an educational attainment of college or associate's degree enjoy the highest average annual earnings of $135,385, while those with high school diploma education earn the least with $24,205. Women with an educational attainment of bachelor's degree earn the most with the average annual earnings of $39,321, while those with high school diploma education have the smallest earnings of $22,083.
| Educational Attainment | Male Income | Female Income |
| Less than High School | - | - |
| High School Diploma | $24,205 | $22,083 |
| College or Associate's Degree | $135,385 | $29,295 |
| Bachelor's Degree | $96,641 | $39,321 |
| Graduate Degree | - | - |
| Total | $59,821 | $34,286 |
Family Income in Princeville
Family Income Brackets in Princeville
According to the Princeville family income data, there are 161 families falling into the $50,000 to $74,999 income range, which is the most common income bracket and makes up 26.2% of all families. Conversely, the $15,000 to $24,999 income bracket is the least frequent group with only 3 families (0.5%) belonging to this category.
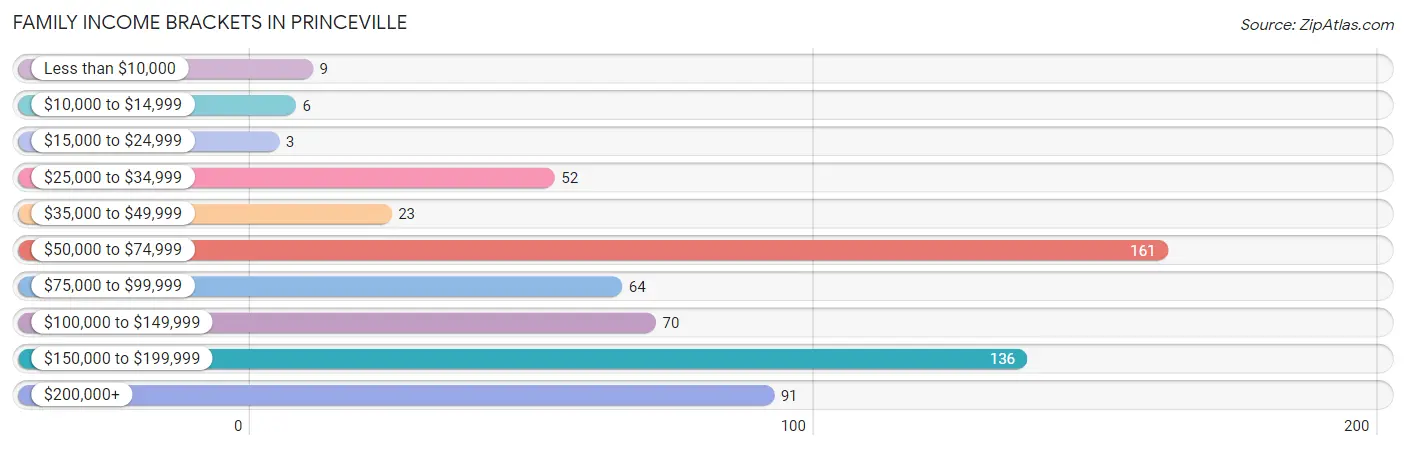
| Income Bracket | # Families | % Families |
| Less than $10,000 | 9 | 1.5% |
| $10,000 to $14,999 | 6 | 1.0% |
| $15,000 to $24,999 | 3 | 0.5% |
| $25,000 to $34,999 | 52 | 8.5% |
| $35,000 to $49,999 | 23 | 3.7% |
| $50,000 to $74,999 | 161 | 26.2% |
| $75,000 to $99,999 | 64 | 10.4% |
| $100,000 to $149,999 | 70 | 11.4% |
| $150,000 to $199,999 | 136 | 22.1% |
| $200,000+ | 91 | 14.8% |
Family Income by Famaliy Size in Princeville
2-person families (431 | 70.1%) account for the highest median family income in Princeville with $110,179 per family, while 2-person families (431 | 70.1%) have the highest median income of $55,090 per family member.
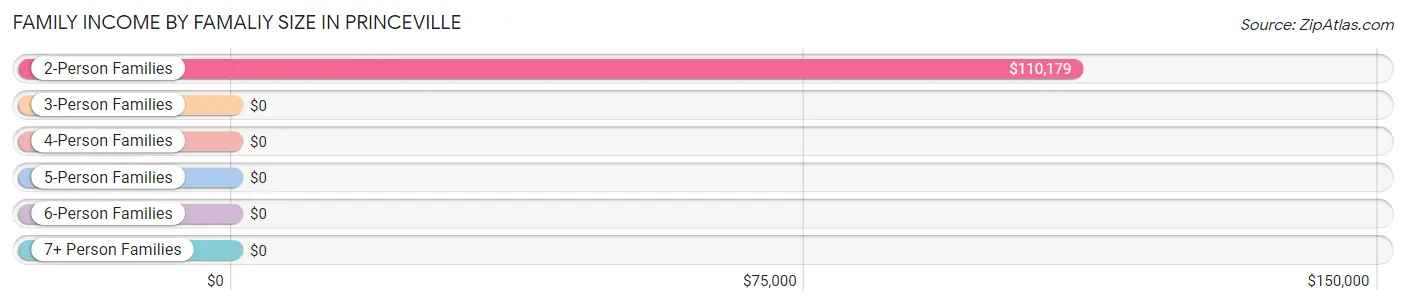
| Income Bracket | # Families | Median Income |
| 2-Person Families | 431 (70.1%) | $110,179 |
| 3-Person Families | 83 (13.5%) | $0 |
| 4-Person Families | 92 (15.0%) | $0 |
| 5-Person Families | 9 (1.5%) | $0 |
| 6-Person Families | 0 (0.0%) | $0 |
| 7+ Person Families | 0 (0.0%) | $0 |
| Total | 615 (100.0%) | $91,989 |
Family Income by Number of Earners in Princeville
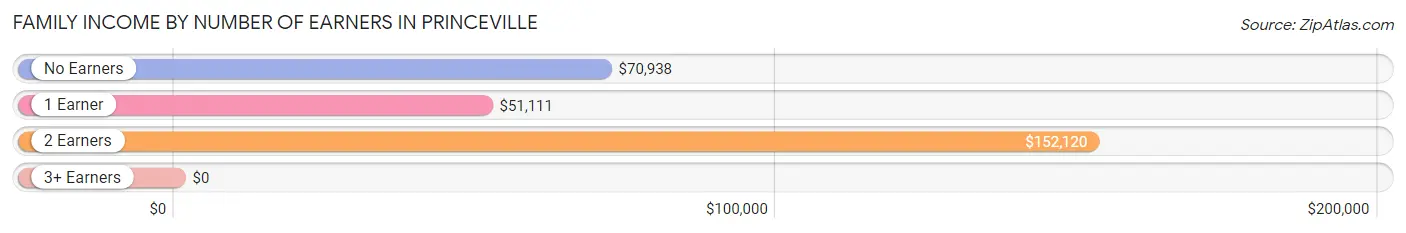
| Number of Earners | # Families | Median Income |
| No Earners | 171 (27.8%) | $70,938 |
| 1 Earner | 122 (19.8%) | $51,111 |
| 2 Earners | 297 (48.3%) | $152,120 |
| 3+ Earners | 25 (4.1%) | $0 |
| Total | 615 (100.0%) | $91,989 |
Household Income in Princeville
Household Income Brackets in Princeville
With 233 households falling in the category, the $50,000 to $74,999 income range is the most frequent in Princeville, accounting for 25.1% of all households. In contrast, only 24 households (2.6%) fall into the $15,000 to $24,999 income bracket, making it the least populous group.
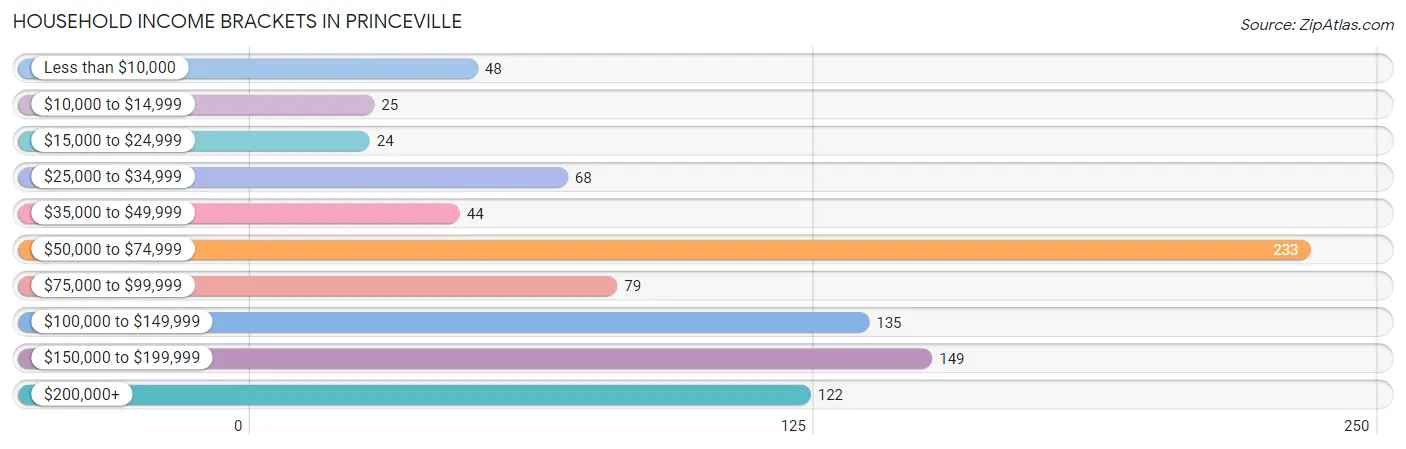
| Income Bracket | # Households | % Households |
| Less than $10,000 | 48 | 5.2% |
| $10,000 to $14,999 | 25 | 2.7% |
| $15,000 to $24,999 | 24 | 2.6% |
| $25,000 to $34,999 | 68 | 7.3% |
| $35,000 to $49,999 | 44 | 4.7% |
| $50,000 to $74,999 | 233 | 25.1% |
| $75,000 to $99,999 | 79 | 8.5% |
| $100,000 to $149,999 | 135 | 14.6% |
| $150,000 to $199,999 | 149 | 16.1% |
| $200,000+ | 122 | 13.2% |
Household Income by Householder Age in Princeville
The median household income in Princeville is $82,250, with the highest median household income of $172,840 found in the 25 to 44 years age bracket for the primary householder. A total of 194 households (20.9%) fall into this category.
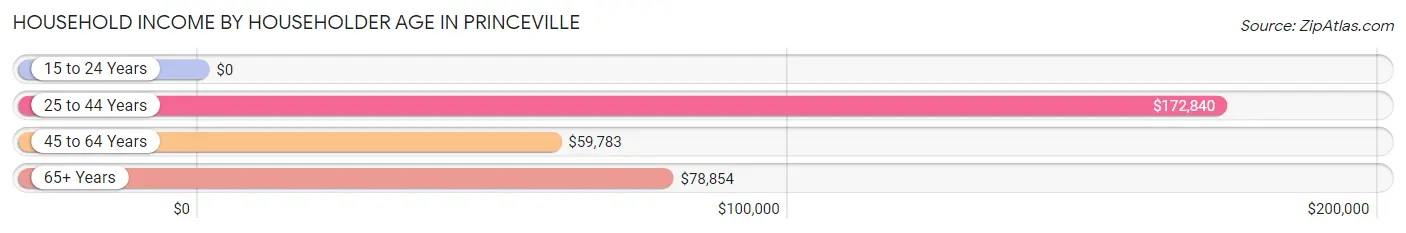
| Income Bracket | # Households | Median Income |
| 15 to 24 Years | 0 (0.0%) | $0 |
| 25 to 44 Years | 194 (20.9%) | $172,840 |
| 45 to 64 Years | 320 (34.5%) | $59,783 |
| 65+ Years | 413 (44.6%) | $78,854 |
| Total | 927 (100.0%) | $82,250 |
Poverty in Princeville
Income Below Poverty by Sex and Age in Princeville
With 6.3% poverty level for males and 8.5% for females among the residents of Princeville, 45 to 54 year old males and 55 to 64 year old females are the most vulnerable to poverty, with 38 males (30.2%) and 40 females (36.4%) in their respective age groups living below the poverty level.
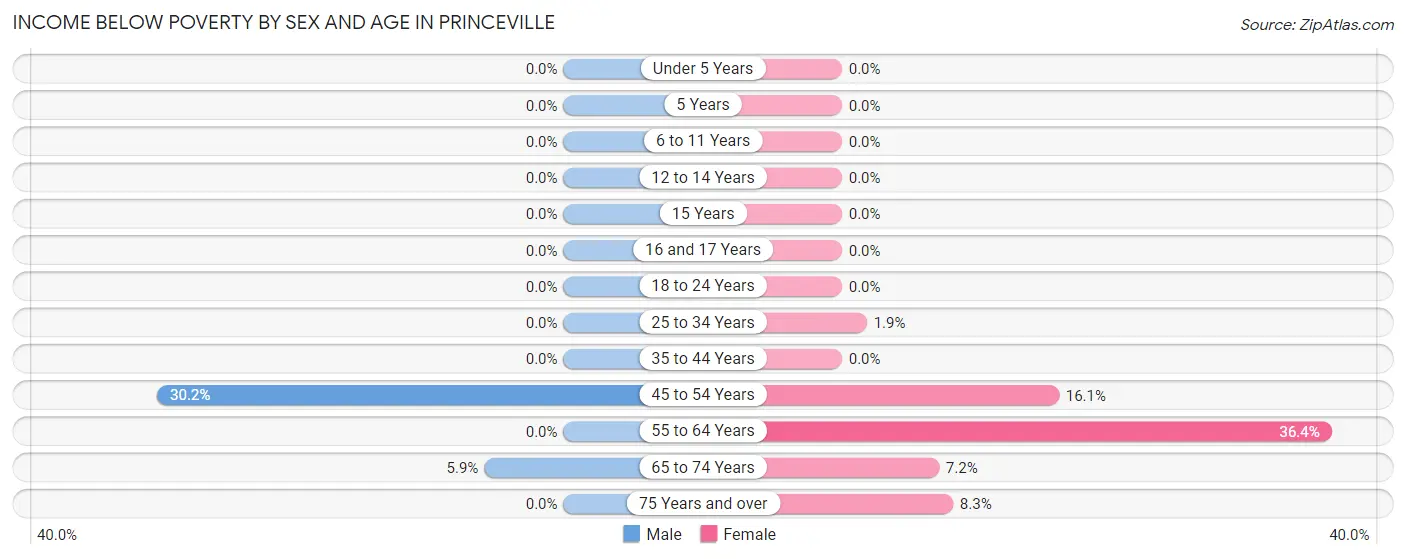
| Age Bracket | Male | Female |
| Under 5 Years | 0 (0.0%) | 0 (0.0%) |
| 5 Years | 0 (0.0%) | 0 (0.0%) |
| 6 to 11 Years | 0 (0.0%) | 0 (0.0%) |
| 12 to 14 Years | 0 (0.0%) | 0 (0.0%) |
| 15 Years | 0 (0.0%) | 0 (0.0%) |
| 16 and 17 Years | 0 (0.0%) | 0 (0.0%) |
| 18 to 24 Years | 0 (0.0%) | 0 (0.0%) |
| 25 to 34 Years | 0 (0.0%) | 1 (1.8%) |
| 35 to 44 Years | 0 (0.0%) | 0 (0.0%) |
| 45 to 54 Years | 38 (30.2%) | 34 (16.1%) |
| 55 to 64 Years | 0 (0.0%) | 40 (36.4%) |
| 65 to 74 Years | 15 (5.9%) | 16 (7.2%) |
| 75 Years and over | 0 (0.0%) | 8 (8.3%) |
| Total | 53 (6.3%) | 99 (8.5%) |
Income Above Poverty by Sex and Age in Princeville
According to the poverty statistics in Princeville, males aged 5 years and females aged under 5 years are the age groups that are most secure financially, with 100.0% of males and 100.0% of females in these age groups living above the poverty line.
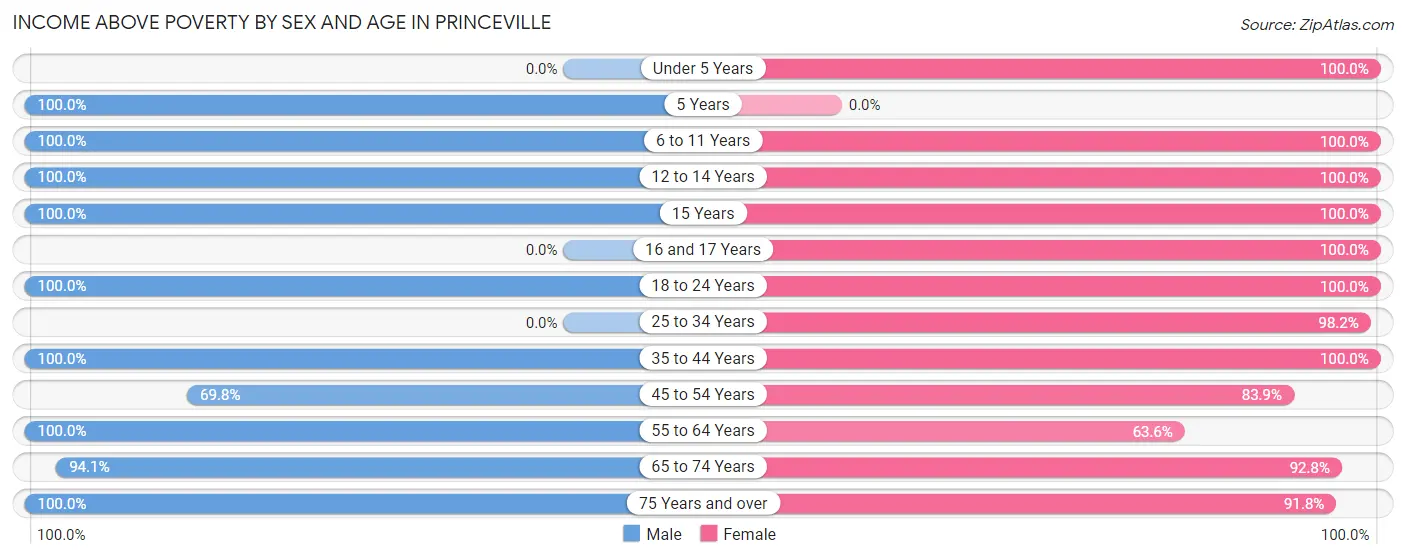
| Age Bracket | Male | Female |
| Under 5 Years | 0 (0.0%) | 59 (100.0%) |
| 5 Years | 27 (100.0%) | 0 (0.0%) |
| 6 to 11 Years | 18 (100.0%) | 66 (100.0%) |
| 12 to 14 Years | 9 (100.0%) | 69 (100.0%) |
| 15 Years | 111 (100.0%) | 21 (100.0%) |
| 16 and 17 Years | 0 (0.0%) | 32 (100.0%) |
| 18 to 24 Years | 9 (100.0%) | 23 (100.0%) |
| 25 to 34 Years | 0 (0.0%) | 53 (98.2%) |
| 35 to 44 Years | 91 (100.0%) | 207 (100.0%) |
| 45 to 54 Years | 88 (69.8%) | 177 (83.9%) |
| 55 to 64 Years | 114 (100.0%) | 70 (63.6%) |
| 65 to 74 Years | 240 (94.1%) | 206 (92.8%) |
| 75 Years and over | 76 (100.0%) | 89 (91.7%) |
| Total | 783 (93.7%) | 1,072 (91.5%) |
Income Below Poverty Among Married-Couple Families in Princeville
The poverty statistics for married-couple families in Princeville show that 2.7% or 15 of the total 553 families live below the poverty line. Families with no children have the highest poverty rate of 3.8%, comprising of 15 families. On the other hand, families with 1 or 2 children have the lowest poverty rate of 0.0%, which includes 0 families.
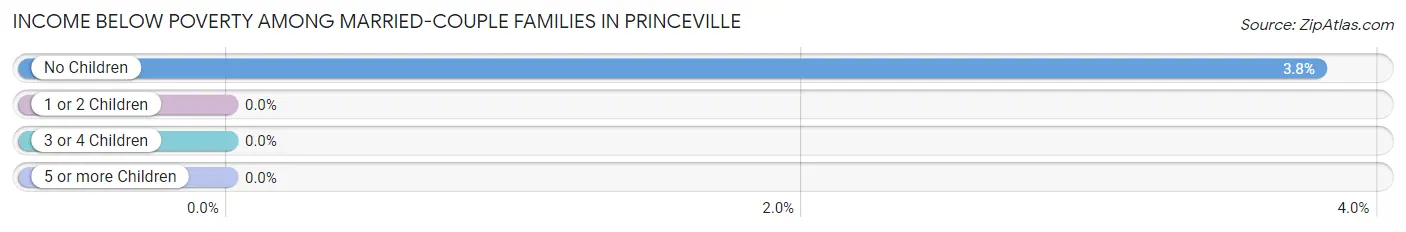
| Children | Above Poverty | Below Poverty |
| No Children | 381 (96.2%) | 15 (3.8%) |
| 1 or 2 Children | 148 (100.0%) | 0 (0.0%) |
| 3 or 4 Children | 9 (100.0%) | 0 (0.0%) |
| 5 or more Children | 0 (0.0%) | 0 (0.0%) |
| Total | 538 (97.3%) | 15 (2.7%) |
Income Below Poverty Among Single-Parent Households in Princeville
| Children | Single Father | Single Mother |
| No Children | 0 (0.0%) | 0 (0.0%) |
| 1 or 2 Children | 0 (0.0%) | 0 (0.0%) |
| 3 or 4 Children | 0 (0.0%) | 0 (0.0%) |
| 5 or more Children | 0 (0.0%) | 0 (0.0%) |
| Total | 0 (0.0%) | 0 (0.0%) |
Income Below Poverty Among Married-Couple vs Single-Parent Households in Princeville
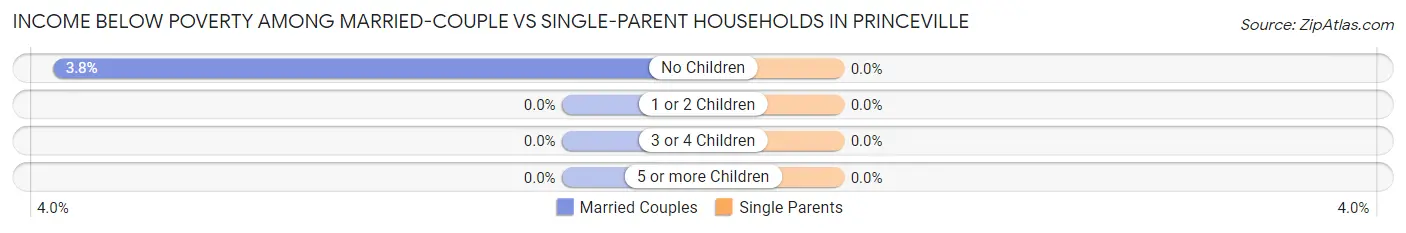
| Children | Married-Couple Families | Single-Parent Households |
| No Children | 15 (3.8%) | 0 (0.0%) |
| 1 or 2 Children | 0 (0.0%) | 0 (0.0%) |
| 3 or 4 Children | 0 (0.0%) | 0 (0.0%) |
| 5 or more Children | 0 (0.0%) | 0 (0.0%) |
| Total | 15 (2.7%) | 0 (0.0%) |
Race in Princeville
The most populous races in Princeville are White / Caucasian (1,488 | 74.1%), Hispanic or Latino (320 | 15.9%), and Two or more Races (268 | 13.4%).
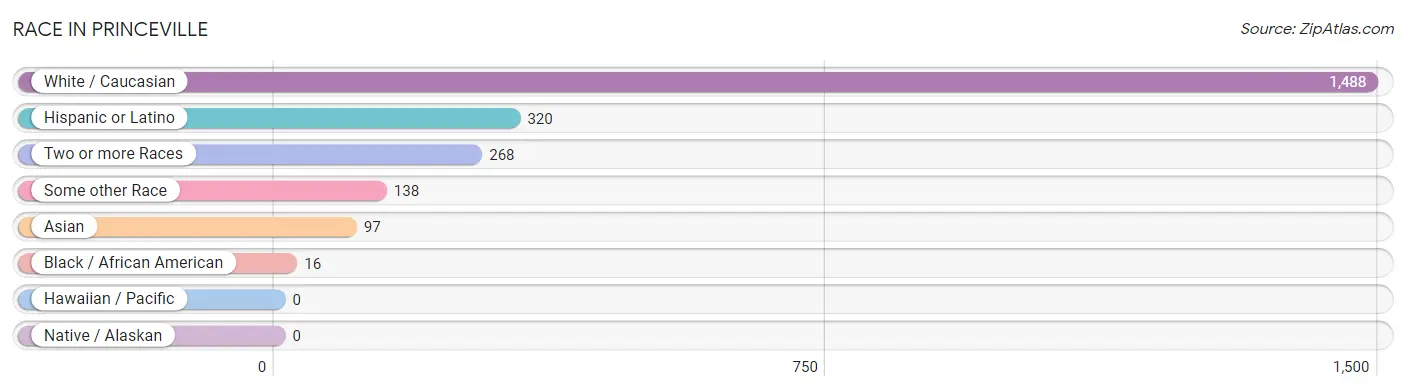
| Race | # Population | % Population |
| Asian | 97 | 4.8% |
| Black / African American | 16 | 0.8% |
| Hawaiian / Pacific | 0 | 0.0% |
| Hispanic or Latino | 320 | 15.9% |
| Native / Alaskan | 0 | 0.0% |
| White / Caucasian | 1,488 | 74.1% |
| Two or more Races | 268 | 13.4% |
| Some other Race | 138 | 6.9% |
| Total | 2,007 | 100.0% |
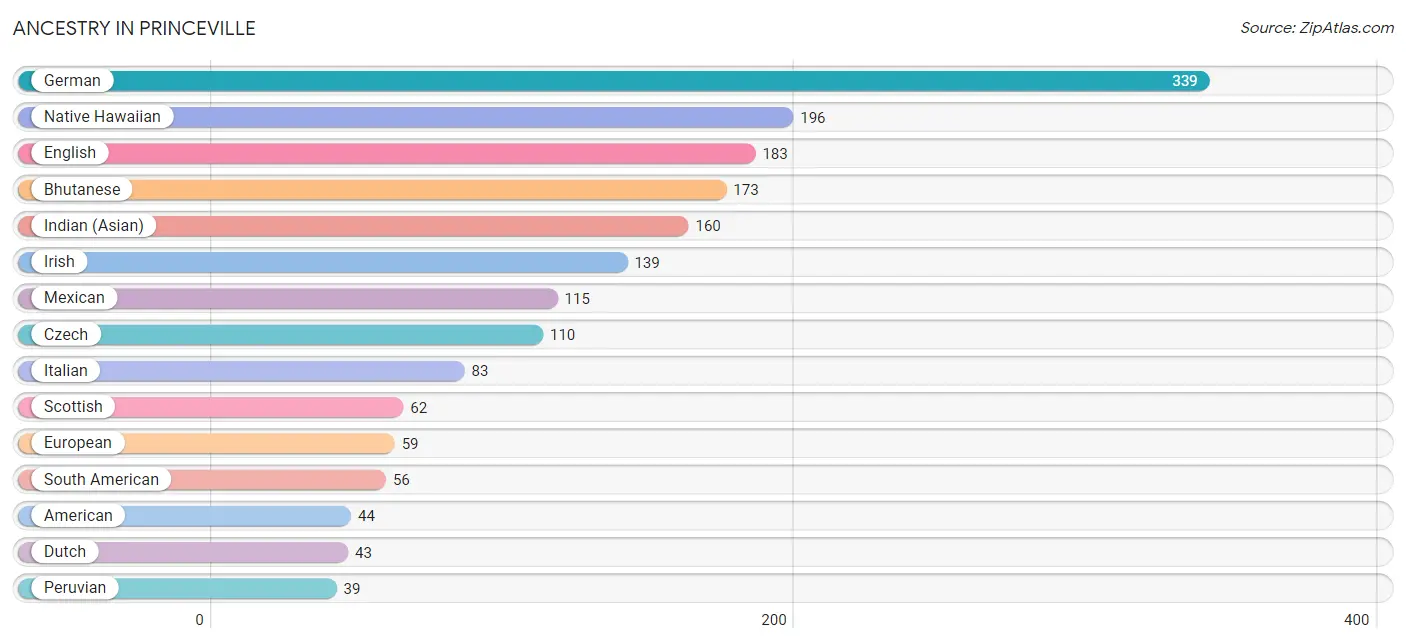
Ancestry in Princeville
The most populous ancestries reported in Princeville are German (339 | 16.9%), Native Hawaiian (196 | 9.8%), English (183 | 9.1%), Bhutanese (173 | 8.6%), and Indian (Asian) (160 | 8.0%), together accounting for 52.4% of all Princeville residents.
| Ancestry | # Population | % Population |
| American | 44 | 2.2% |
| Argentinean | 7 | 0.4% |
| Armenian | 6 | 0.3% |
| Austrian | 18 | 0.9% |
| Basque | 23 | 1.1% |
| Bhutanese | 173 | 8.6% |
| British | 29 | 1.4% |
| Bulgarian | 11 | 0.5% |
| Canadian | 5 | 0.3% |
| Cherokee | 35 | 1.7% |
| Czech | 110 | 5.5% |
| Danish | 5 | 0.3% |
| Dutch | 43 | 2.1% |
| Eastern European | 12 | 0.6% |
| English | 183 | 9.1% |
| European | 59 | 2.9% |
| French | 33 | 1.6% |
| German | 339 | 16.9% |
| Hungarian | 18 | 0.9% |
| Indian (Asian) | 160 | 8.0% |
| Irish | 139 | 6.9% |
| Italian | 83 | 4.1% |
| Korean | 24 | 1.2% |
| Latvian | 3 | 0.2% |
| Lithuanian | 18 | 0.9% |
| Mexican | 115 | 5.7% |
| Native Hawaiian | 196 | 9.8% |
| Northern European | 6 | 0.3% |
| Norwegian | 27 | 1.3% |
| Pakistani | 32 | 1.6% |
| Peruvian | 39 | 1.9% |
| Polish | 10 | 0.5% |
| Russian | 27 | 1.3% |
| Scandinavian | 3 | 0.2% |
| Scotch-Irish | 16 | 0.8% |
| Scottish | 62 | 3.1% |
| Slovak | 8 | 0.4% |
| South American | 56 | 2.8% |
| Spanish | 17 | 0.9% |
| Swedish | 12 | 0.6% |
| Swiss | 5 | 0.3% |
| Thai | 23 | 1.1% |
| Uruguayan | 10 | 0.5% |
| Welsh | 20 | 1.0% | View All 44 Rows |
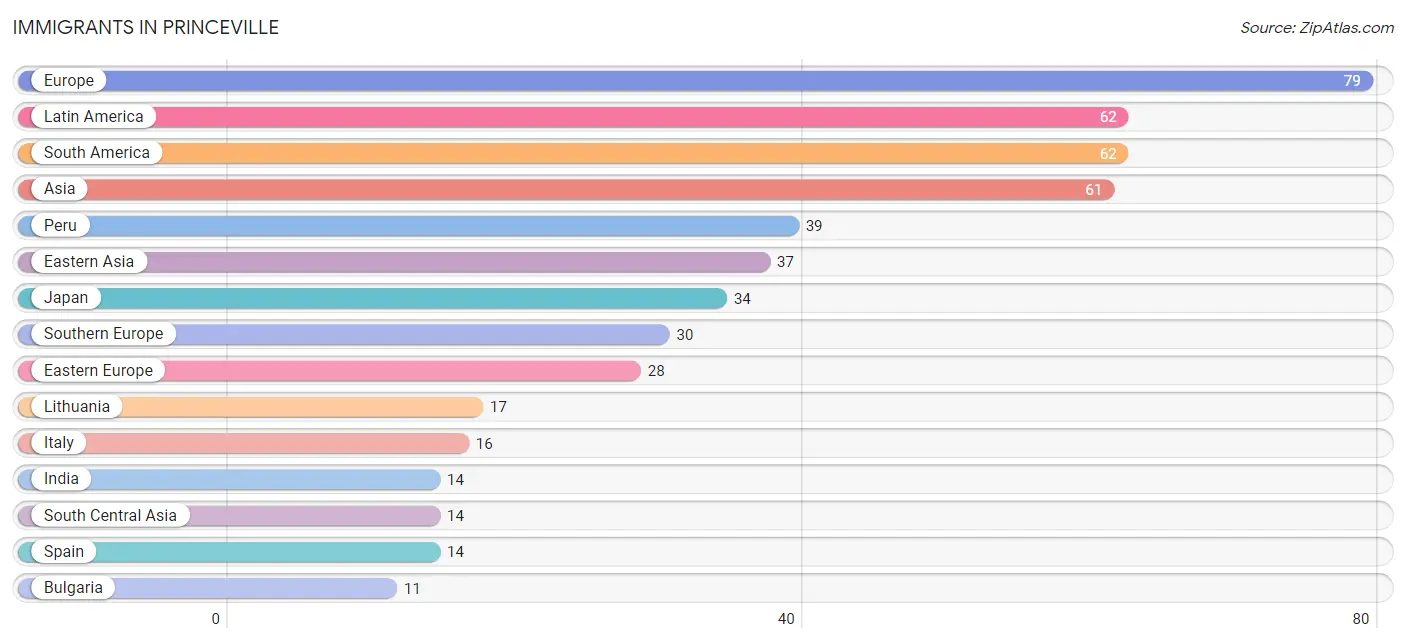
Immigrants in Princeville
The most numerous immigrant groups reported in Princeville came from Europe (79 | 3.9%), Latin America (62 | 3.1%), South America (62 | 3.1%), Asia (61 | 3.0%), and Peru (39 | 1.9%), together accounting for 15.1% of all Princeville residents.
| Immigration Origin | # Population | % Population |
| Africa | 8 | 0.4% |
| Argentina | 7 | 0.4% |
| Asia | 61 | 3.0% |
| Australia | 9 | 0.4% |
| Brazil | 6 | 0.3% |
| Bulgaria | 11 | 0.5% |
| Canada | 5 | 0.3% |
| China | 3 | 0.2% |
| Eastern Asia | 37 | 1.8% |
| Eastern Europe | 28 | 1.4% |
| Europe | 79 | 3.9% |
| Germany | 3 | 0.2% |
| India | 14 | 0.7% |
| Italy | 16 | 0.8% |
| Japan | 34 | 1.7% |
| Latin America | 62 | 3.1% |
| Lithuania | 17 | 0.9% |
| Netherlands | 8 | 0.4% |
| Northern Europe | 10 | 0.5% |
| Oceania | 9 | 0.4% |
| Peru | 39 | 1.9% |
| Philippines | 10 | 0.5% |
| South Africa | 8 | 0.4% |
| South America | 62 | 3.1% |
| South Central Asia | 14 | 0.7% |
| South Eastern Asia | 10 | 0.5% |
| Southern Europe | 30 | 1.5% |
| Spain | 14 | 0.7% |
| Uruguay | 10 | 0.5% |
| Western Europe | 11 | 0.5% | View All 30 Rows |
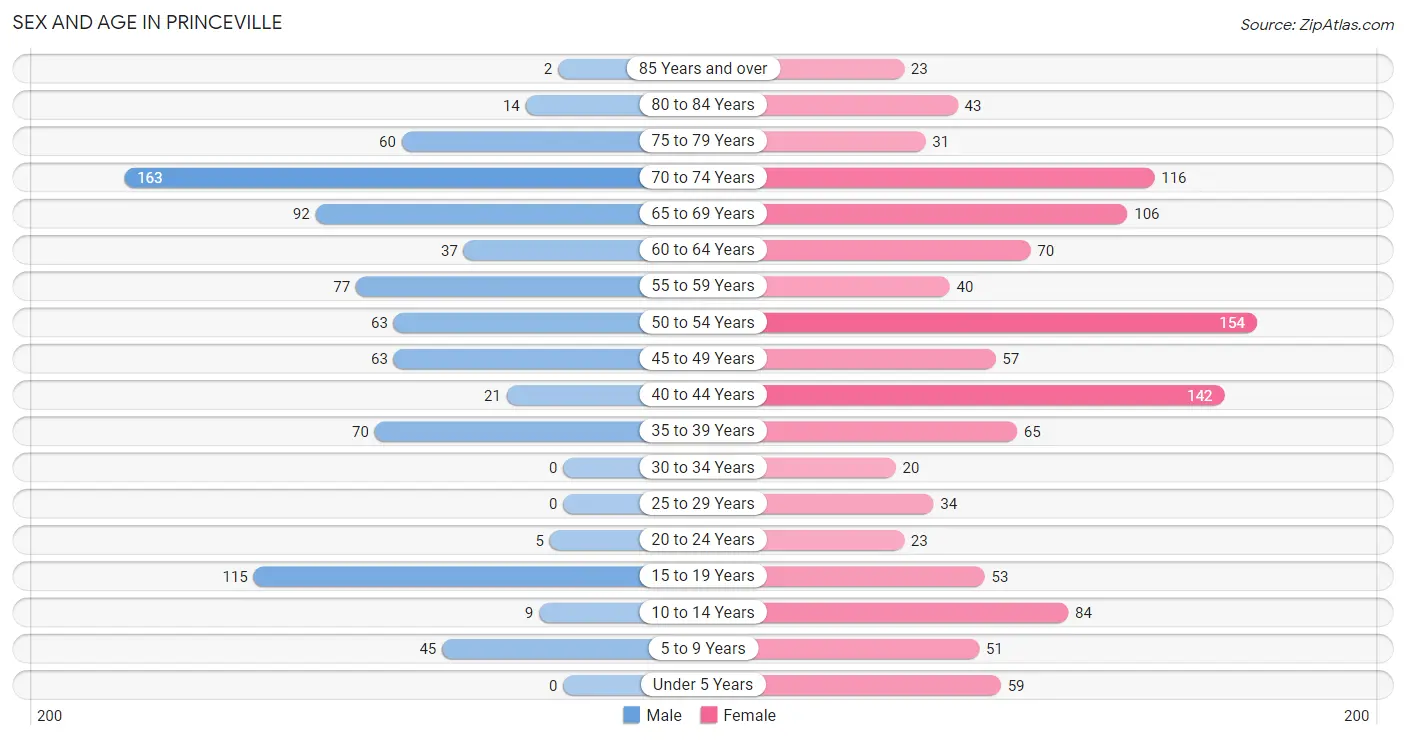
Sex and Age in Princeville
Sex and Age in Princeville
The most populous age groups in Princeville are 70 to 74 Years (163 | 19.5%) for men and 50 to 54 Years (154 | 13.2%) for women.
| Age Bracket | Male | Female |
| Under 5 Years | 0 (0.0%) | 59 (5.0%) |
| 5 to 9 Years | 45 (5.4%) | 51 (4.4%) |
| 10 to 14 Years | 9 (1.1%) | 84 (7.2%) |
| 15 to 19 Years | 115 (13.8%) | 53 (4.5%) |
| 20 to 24 Years | 5 (0.6%) | 23 (2.0%) |
| 25 to 29 Years | 0 (0.0%) | 34 (2.9%) |
| 30 to 34 Years | 0 (0.0%) | 20 (1.7%) |
| 35 to 39 Years | 70 (8.4%) | 65 (5.6%) |
| 40 to 44 Years | 21 (2.5%) | 142 (12.1%) |
| 45 to 49 Years | 63 (7.5%) | 57 (4.9%) |
| 50 to 54 Years | 63 (7.5%) | 154 (13.2%) |
| 55 to 59 Years | 77 (9.2%) | 40 (3.4%) |
| 60 to 64 Years | 37 (4.4%) | 70 (6.0%) |
| 65 to 69 Years | 92 (11.0%) | 106 (9.0%) |
| 70 to 74 Years | 163 (19.5%) | 116 (9.9%) |
| 75 to 79 Years | 60 (7.2%) | 31 (2.6%) |
| 80 to 84 Years | 14 (1.7%) | 43 (3.7%) |
| 85 Years and over | 2 (0.2%) | 23 (2.0%) |
| Total | 836 (100.0%) | 1,171 (100.0%) |
Families and Households in Princeville
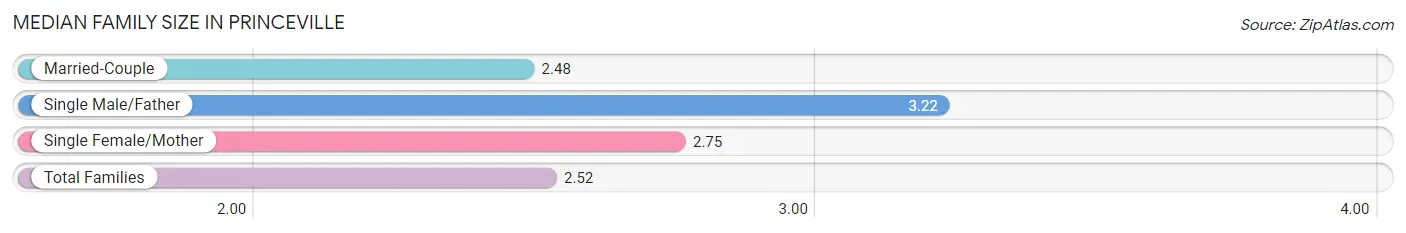
Median Family Size in Princeville
The median family size in Princeville is 2.52 persons per family, with single male/father families (9 | 1.5%) accounting for the largest median family size of 3.22 persons per family. On the other hand, married-couple families (553 | 89.9%) represent the smallest median family size with 2.48 persons per family.
| Family Type | # Families | Family Size |
| Married-Couple | 553 (89.9%) | 2.48 |
| Single Male/Father | 9 (1.5%) | 3.22 |
| Single Female/Mother | 53 (8.6%) | 2.75 |
| Total Families | 615 (100.0%) | 2.52 |
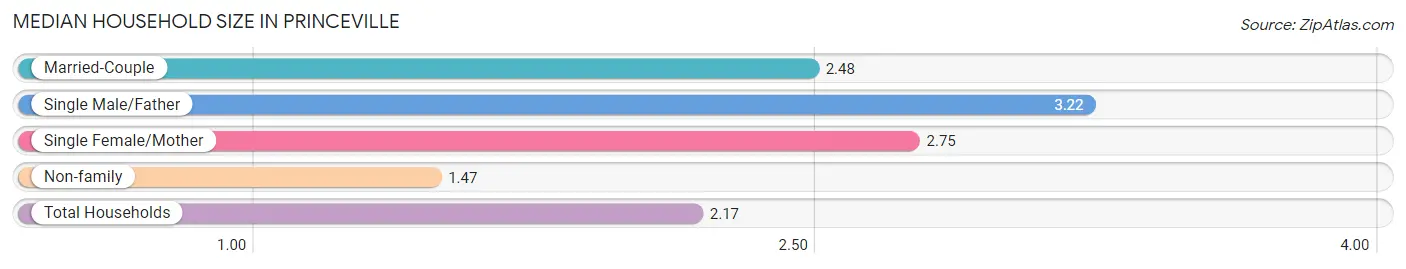
Median Household Size in Princeville
The median household size in Princeville is 2.17 persons per household, with single male/father households (9 | 1.0%) accounting for the largest median household size of 3.22 persons per household. non-family households (312 | 33.7%) represent the smallest median household size with 1.47 persons per household.
| Household Type | # Households | Household Size |
| Married-Couple | 553 (59.7%) | 2.48 |
| Single Male/Father | 9 (1.0%) | 3.22 |
| Single Female/Mother | 53 (5.7%) | 2.75 |
| Non-family | 312 (33.7%) | 1.47 |
| Total Households | 927 (100.0%) | 2.17 |
Household Size by Marriage Status in Princeville
Out of a total of 927 households in Princeville, 615 (66.3%) are family households, while 312 (33.7%) are nonfamily households. The most numerous type of family households are 2-person households, comprising 431, and the most common type of nonfamily households are 1-person households, comprising 223.
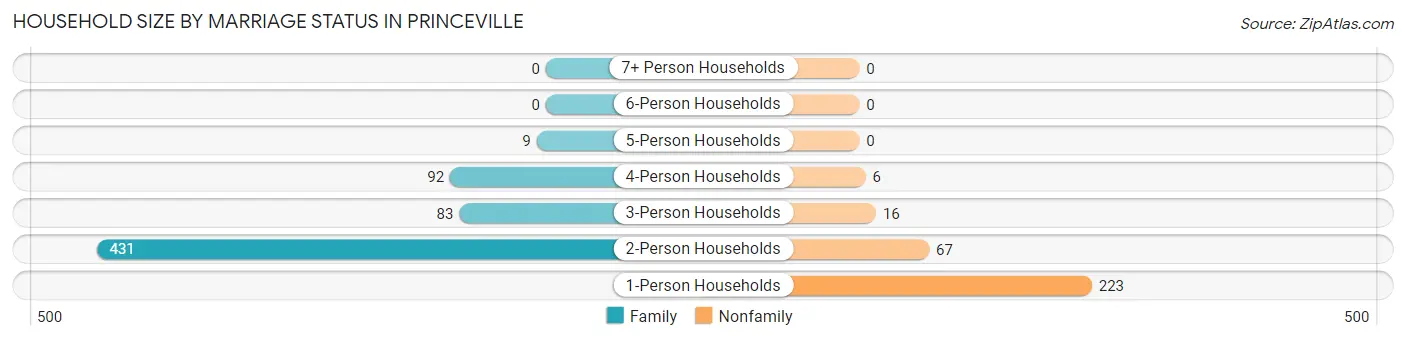
| Household Size | Family Households | Nonfamily Households |
| 1-Person Households | - | 223 (24.1%) |
| 2-Person Households | 431 (46.5%) | 67 (7.2%) |
| 3-Person Households | 83 (8.9%) | 16 (1.7%) |
| 4-Person Households | 92 (9.9%) | 6 (0.6%) |
| 5-Person Households | 9 (1.0%) | 0 (0.0%) |
| 6-Person Households | 0 (0.0%) | 0 (0.0%) |
| 7+ Person Households | 0 (0.0%) | 0 (0.0%) |
| Total | 615 (66.3%) | 312 (33.7%) |
Female Fertility in Princeville
Fertility by Age in Princeville
| Age Bracket | Women with Births | Births / 1,000 Women |
| 15 to 19 years | 0 (0.0%) | 0.0 |
| 20 to 34 years | 0 (0.0%) | 0.0 |
| 35 to 50 years | 0 (0.0%) | 0.0 |
| Total | 0 (0.0%) | 0.0 |
Fertility by Age by Marriage Status in Princeville
| Age Bracket | Married | Unmarried |
| 15 to 19 years | 0 (0.0%) | 0 (0.0%) |
| 20 to 34 years | 0 (0.0%) | 0 (0.0%) |
| 35 to 50 years | 0 (0.0%) | 0 (0.0%) |
| Total | 0 (0.0%) | 0 (0.0%) |
Fertility by Education in Princeville
| Educational Attainment | Women with Births | Births / 1,000 Women |
| Less than High School | 0 (0.0%) | 0.0 |
| High School Diploma | 0 (0.0%) | 0.0 |
| College or Associate's Degree | 0 (0.0%) | 0.0 |
| Bachelor's Degree | 0 (0.0%) | 0.0 |
| Graduate Degree | 0 (0.0%) | 0.0 |
| Total | 0 (0.0%) | 0.0 |
Fertility by Education by Marriage Status in Princeville
| Educational Attainment | Married | Unmarried |
| Less than High School | 0 (0.0%) | 0 (0.0%) |
| High School Diploma | 0 (0.0%) | 0 (0.0%) |
| College or Associate's Degree | 0 (0.0%) | 0 (0.0%) |
| Bachelor's Degree | 0 (0.0%) | 0 (0.0%) |
| Graduate Degree | 0 (0.0%) | 0 (0.0%) |
| Total | 0 (0.0%) | 0 (0.0%) |
Employment Characteristics in Princeville
Employment by Class of Employer in Princeville
Among the 746 employed individuals in Princeville, private company employees (347 | 46.5%), self-employed (not incorporated) (212 | 28.4%), and self-employed (incorporated) (87 | 11.7%) make up the most common classes of employment.
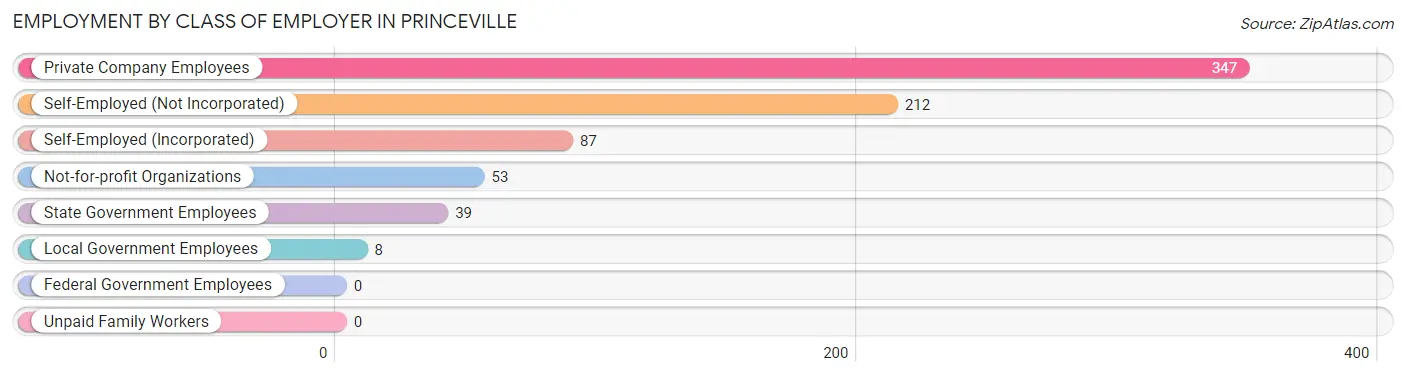
| Employer Class | # Employees | % Employees |
| Private Company Employees | 347 | 46.5% |
| Self-Employed (Incorporated) | 87 | 11.7% |
| Self-Employed (Not Incorporated) | 212 | 28.4% |
| Not-for-profit Organizations | 53 | 7.1% |
| Local Government Employees | 8 | 1.1% |
| State Government Employees | 39 | 5.2% |
| Federal Government Employees | 0 | 0.0% |
| Unpaid Family Workers | 0 | 0.0% |
| Total | 746 | 100.0% |
Employment Status by Age in Princeville
According to the labor force statistics for Princeville, out of the total population over 16 years of age (1,627), 55.3% or 900 individuals are in the labor force, with 5.3% or 48 of them unemployed. The age group with the highest labor force participation rate is 20 to 24 years, with 100.0% or 28 individuals in the labor force. Within the labor force, the 20 to 24 years age range has the highest percentage of unemployed individuals, with 82.1% or 23 of them being unemployed.
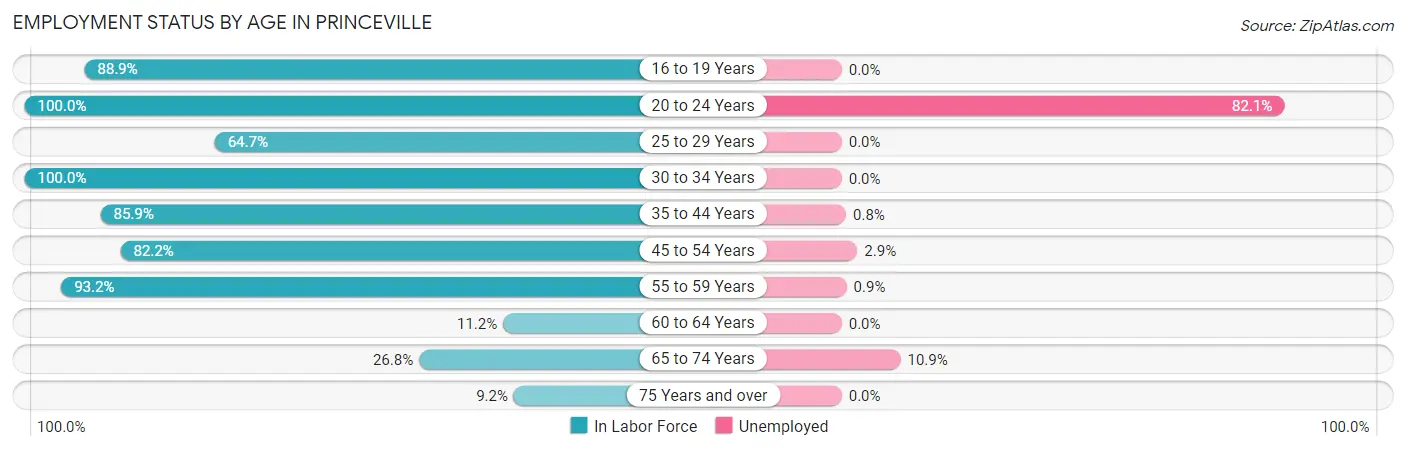
| Age Bracket | In Labor Force | Unemployed |
| 16 to 19 Years | 32 (88.9%) | 0 (0.0%) |
| 20 to 24 Years | 28 (100.0%) | 23 (82.1%) |
| 25 to 29 Years | 22 (64.7%) | 0 (0.0%) |
| 30 to 34 Years | 20 (100.0%) | 0 (0.0%) |
| 35 to 44 Years | 256 (85.9%) | 2 (0.8%) |
| 45 to 54 Years | 277 (82.2%) | 8 (2.9%) |
| 55 to 59 Years | 109 (93.2%) | 1 (0.9%) |
| 60 to 64 Years | 12 (11.2%) | 0 (0.0%) |
| 65 to 74 Years | 128 (26.8%) | 14 (10.9%) |
| 75 Years and over | 16 (9.2%) | 0 (0.0%) |
| Total | 900 (55.3%) | 48 (5.3%) |
Employment Status by Educational Attainment in Princeville
According to labor force statistics for Princeville, 76.2% of individuals (696) out of the total population between 25 and 64 years of age (913) are in the labor force, with 1.6% or 11 of them being unemployed. The group with the highest labor force participation rate are those with the educational attainment of high school diploma, with 87.9% or 145 individuals in the labor force. Within the labor force, individuals with bachelor's degree or higher education have the highest percentage of unemployment, with 2.6% or 10 of them being unemployed.
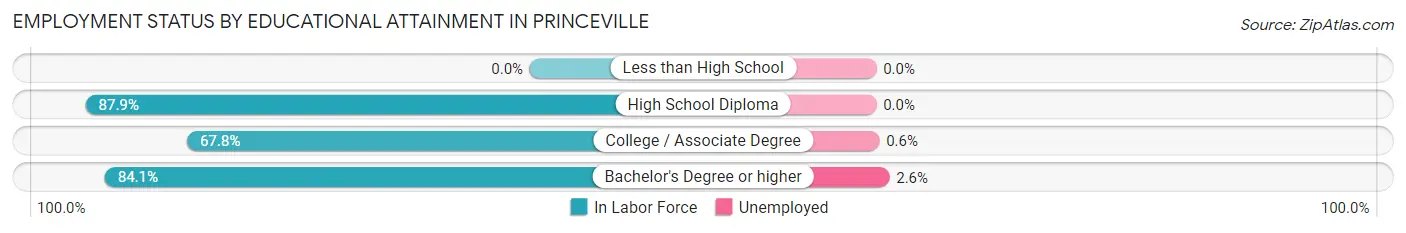
| Educational Attainment | In Labor Force | Unemployed |
| Less than High School | 0 (0.0%) | 0 (0.0%) |
| High School Diploma | 145 (87.9%) | 0 (0.0%) |
| College / Associate Degree | 164 (67.8%) | 1 (0.6%) |
| Bachelor's Degree or higher | 387 (84.1%) | 12 (2.6%) |
| Total | 696 (76.2%) | 15 (1.6%) |
Employment Occupations by Sex in Princeville
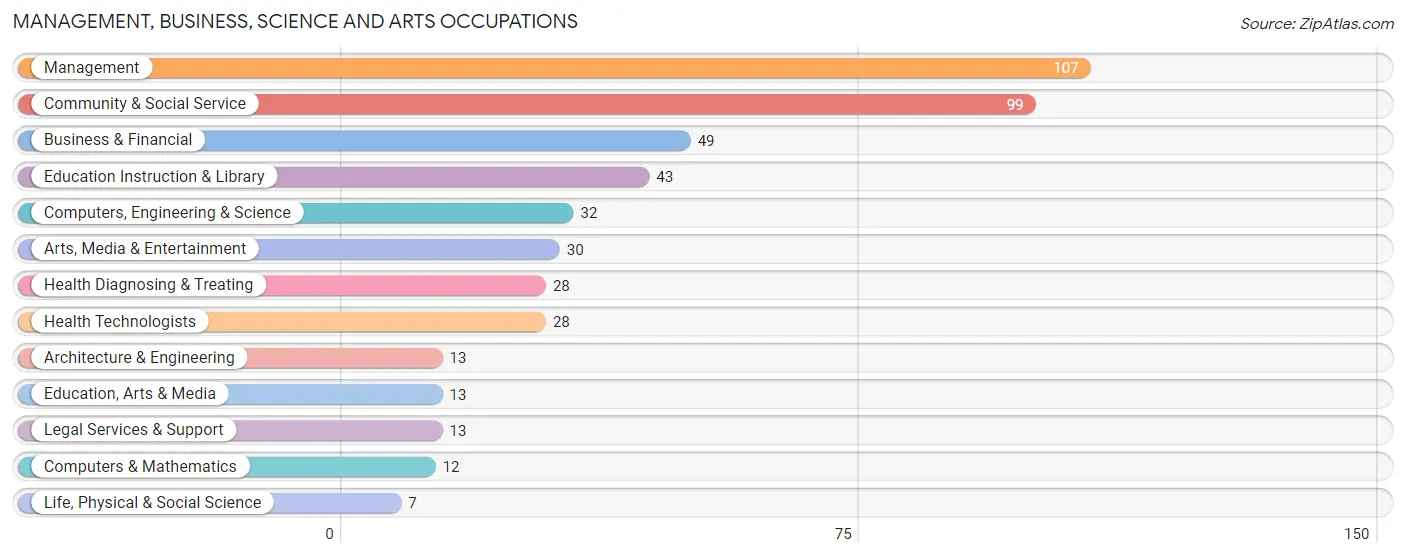
Management, Business, Science and Arts Occupations
The most common Management, Business, Science and Arts occupations in Princeville are Management (107 | 12.6%), Community & Social Service (99 | 11.6%), Business & Financial (49 | 5.8%), Education Instruction & Library (43 | 5.1%), and Computers, Engineering & Science (32 | 3.8%).
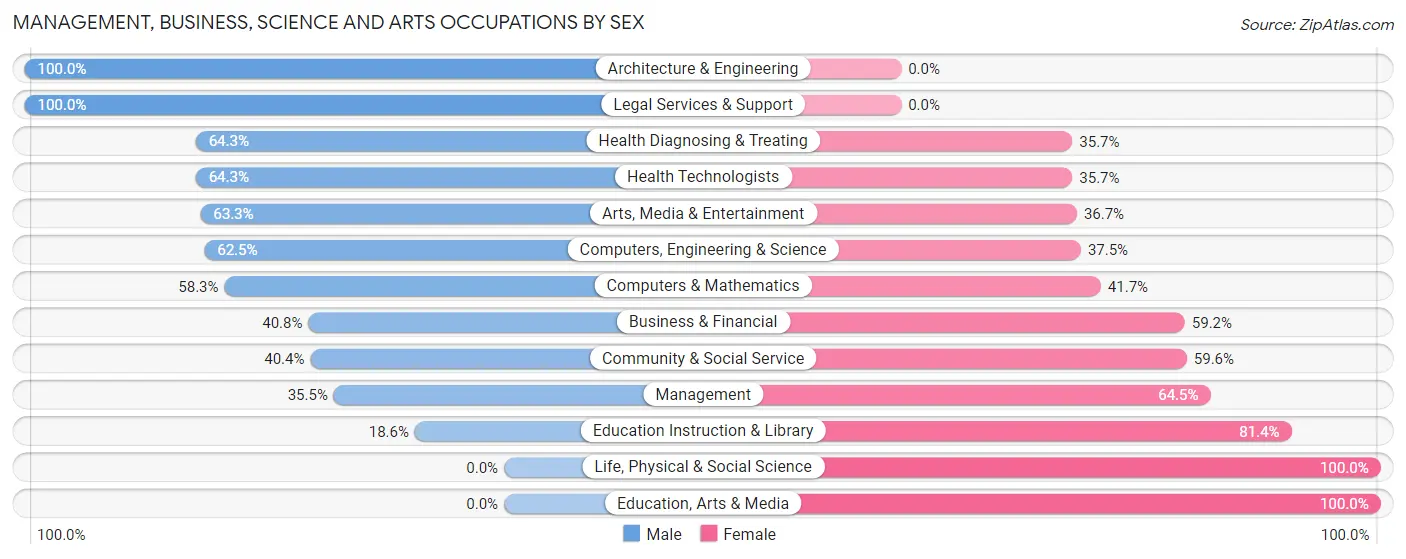
Management, Business, Science and Arts Occupations by Sex
Within the Management, Business, Science and Arts occupations in Princeville, the most male-oriented occupations are Architecture & Engineering (100.0%), Legal Services & Support (100.0%), and Health Diagnosing & Treating (64.3%), while the most female-oriented occupations are Life, Physical & Social Science (100.0%), Education, Arts & Media (100.0%), and Education Instruction & Library (81.4%).
| Occupation | Male | Female |
| Management | 38 (35.5%) | 69 (64.5%) |
| Business & Financial | 20 (40.8%) | 29 (59.2%) |
| Computers, Engineering & Science | 20 (62.5%) | 12 (37.5%) |
| Computers & Mathematics | 7 (58.3%) | 5 (41.7%) |
| Architecture & Engineering | 13 (100.0%) | 0 (0.0%) |
| Life, Physical & Social Science | 0 (0.0%) | 7 (100.0%) |
| Community & Social Service | 40 (40.4%) | 59 (59.6%) |
| Education, Arts & Media | 0 (0.0%) | 13 (100.0%) |
| Legal Services & Support | 13 (100.0%) | 0 (0.0%) |
| Education Instruction & Library | 8 (18.6%) | 35 (81.4%) |
| Arts, Media & Entertainment | 19 (63.3%) | 11 (36.7%) |
| Health Diagnosing & Treating | 18 (64.3%) | 10 (35.7%) |
| Health Technologists | 18 (64.3%) | 10 (35.7%) |
| Total (Category) | 136 (43.2%) | 179 (56.8%) |
| Total (Overall) | 316 (37.1%) | 536 (62.9%) |
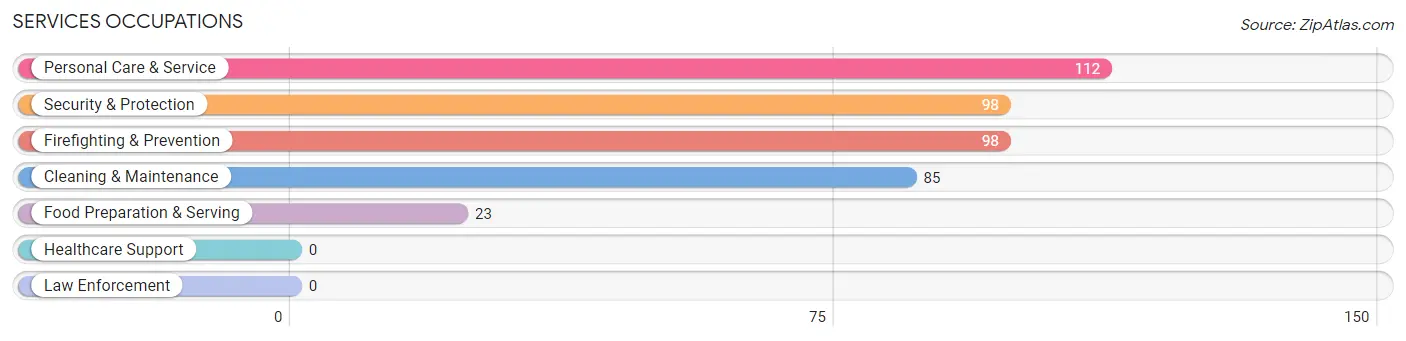
Services Occupations
The most common Services occupations in Princeville are Personal Care & Service (112 | 13.2%), Security & Protection (98 | 11.5%), Firefighting & Prevention (98 | 11.5%), Cleaning & Maintenance (85 | 10.0%), and Food Preparation & Serving (23 | 2.7%).
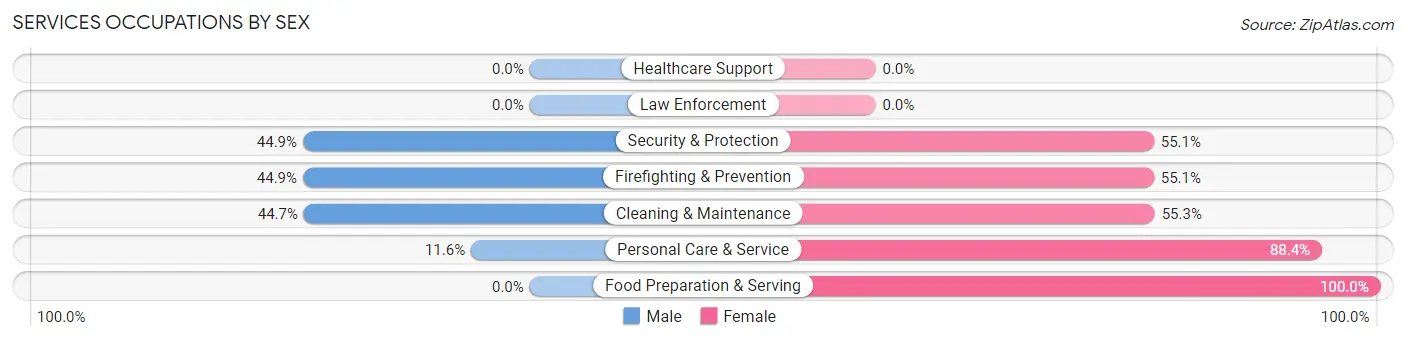
Services Occupations by Sex
Within the Services occupations in Princeville, the most male-oriented occupations are Security & Protection (44.9%), Firefighting & Prevention (44.9%), and Cleaning & Maintenance (44.7%), while the most female-oriented occupations are Food Preparation & Serving (100.0%), Personal Care & Service (88.4%), and Cleaning & Maintenance (55.3%).
| Occupation | Male | Female |
| Healthcare Support | 0 (0.0%) | 0 (0.0%) |
| Security & Protection | 44 (44.9%) | 54 (55.1%) |
| Firefighting & Prevention | 44 (44.9%) | 54 (55.1%) |
| Law Enforcement | 0 (0.0%) | 0 (0.0%) |
| Food Preparation & Serving | 0 (0.0%) | 23 (100.0%) |
| Cleaning & Maintenance | 38 (44.7%) | 47 (55.3%) |
| Personal Care & Service | 13 (11.6%) | 99 (88.4%) |
| Total (Category) | 95 (29.9%) | 223 (70.1%) |
| Total (Overall) | 316 (37.1%) | 536 (62.9%) |
Sales and Office Occupations
The most common Sales and Office occupations in Princeville are Sales & Related (95 | 11.2%), and Office & Administration (70 | 8.2%).
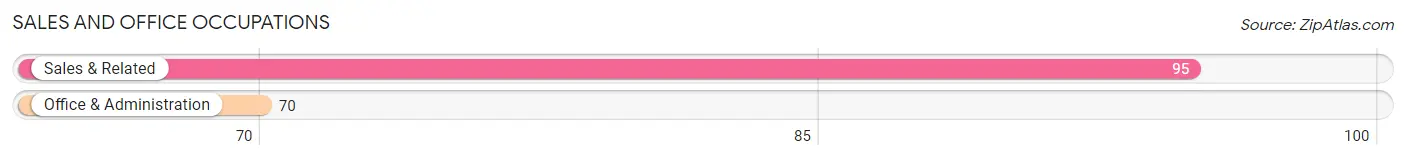
Sales and Office Occupations by Sex
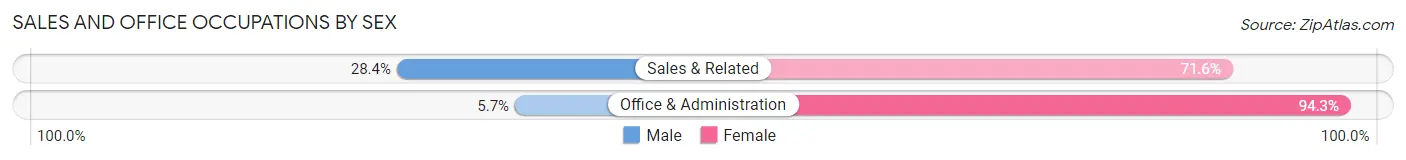
| Occupation | Male | Female |
| Sales & Related | 27 (28.4%) | 68 (71.6%) |
| Office & Administration | 4 (5.7%) | 66 (94.3%) |
| Total (Category) | 31 (18.8%) | 134 (81.2%) |
| Total (Overall) | 316 (37.1%) | 536 (62.9%) |
Natural Resources, Construction and Maintenance Occupations
The most common Natural Resources, Construction and Maintenance occupations in Princeville are Construction & Extraction (44 | 5.2%), and Farming, Fishing & Forestry (5 | 0.6%).
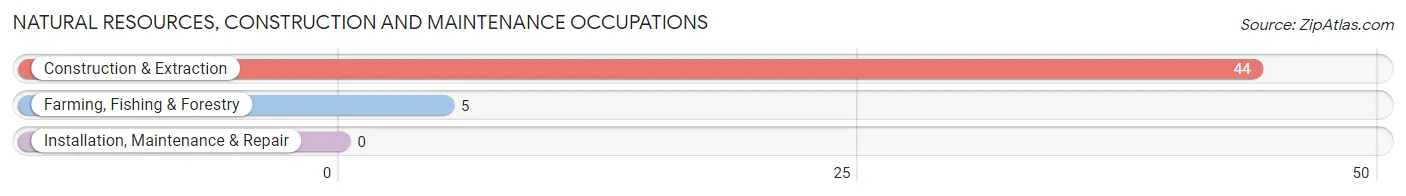
Natural Resources, Construction and Maintenance Occupations by Sex
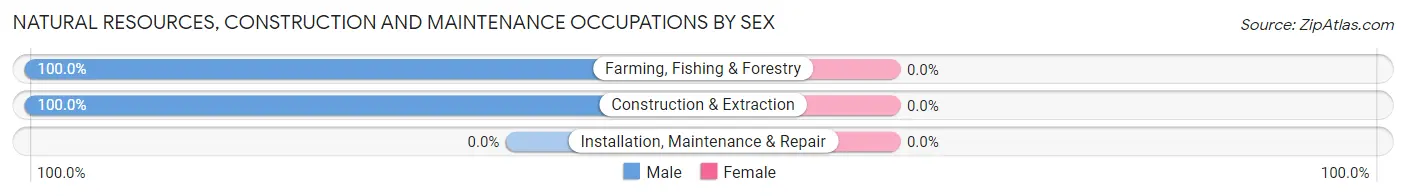
| Occupation | Male | Female |
| Farming, Fishing & Forestry | 5 (100.0%) | 0 (0.0%) |
| Construction & Extraction | 44 (100.0%) | 0 (0.0%) |
| Installation, Maintenance & Repair | 0 (0.0%) | 0 (0.0%) |
| Total (Category) | 49 (100.0%) | 0 (0.0%) |
| Total (Overall) | 316 (37.1%) | 536 (62.9%) |
Production, Transportation and Moving Occupations
The most common Production, Transportation and Moving occupations in Princeville are , and Transportation (5 | 0.6%).
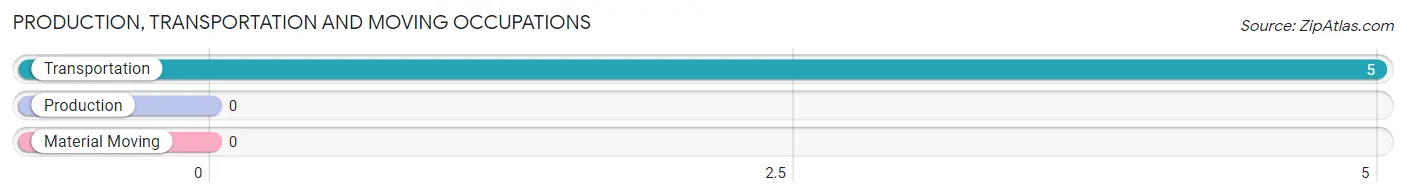
Production, Transportation and Moving Occupations by Sex
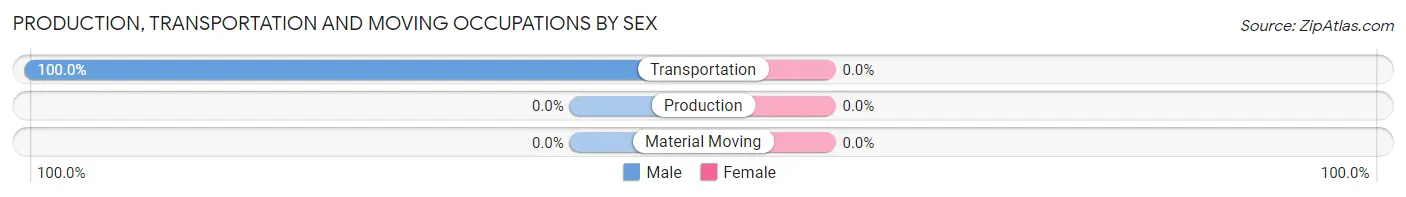
| Occupation | Male | Female |
| Production | 0 (0.0%) | 0 (0.0%) |
| Transportation | 5 (100.0%) | 0 (0.0%) |
| Material Moving | 0 (0.0%) | 0 (0.0%) |
| Total (Category) | 5 (100.0%) | 0 (0.0%) |
| Total (Overall) | 316 (37.1%) | 536 (62.9%) |
Employment Industries by Sex in Princeville
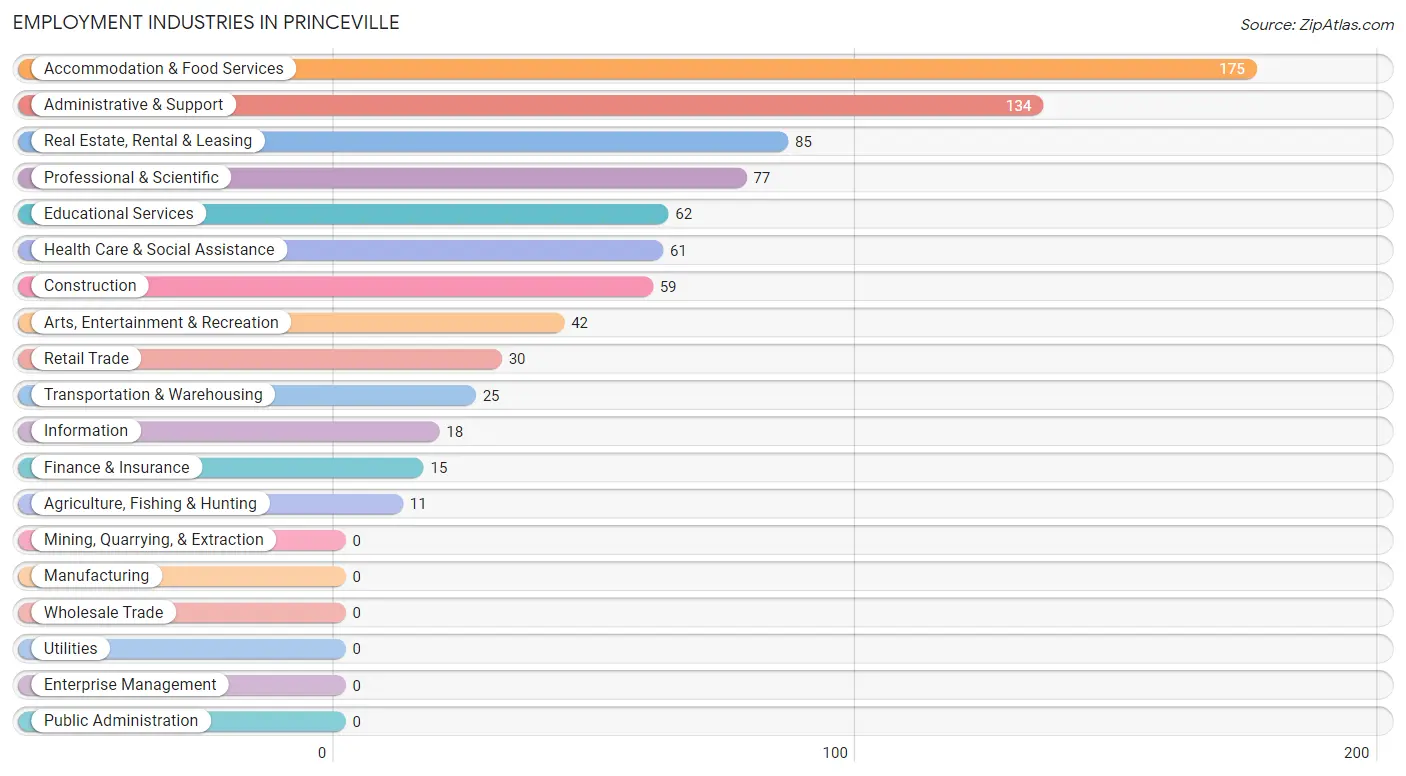
Employment Industries in Princeville
The major employment industries in Princeville include Accommodation & Food Services (175 | 20.5%), Administrative & Support (134 | 15.7%), Real Estate, Rental & Leasing (85 | 10.0%), Professional & Scientific (77 | 9.0%), and Educational Services (62 | 7.3%).
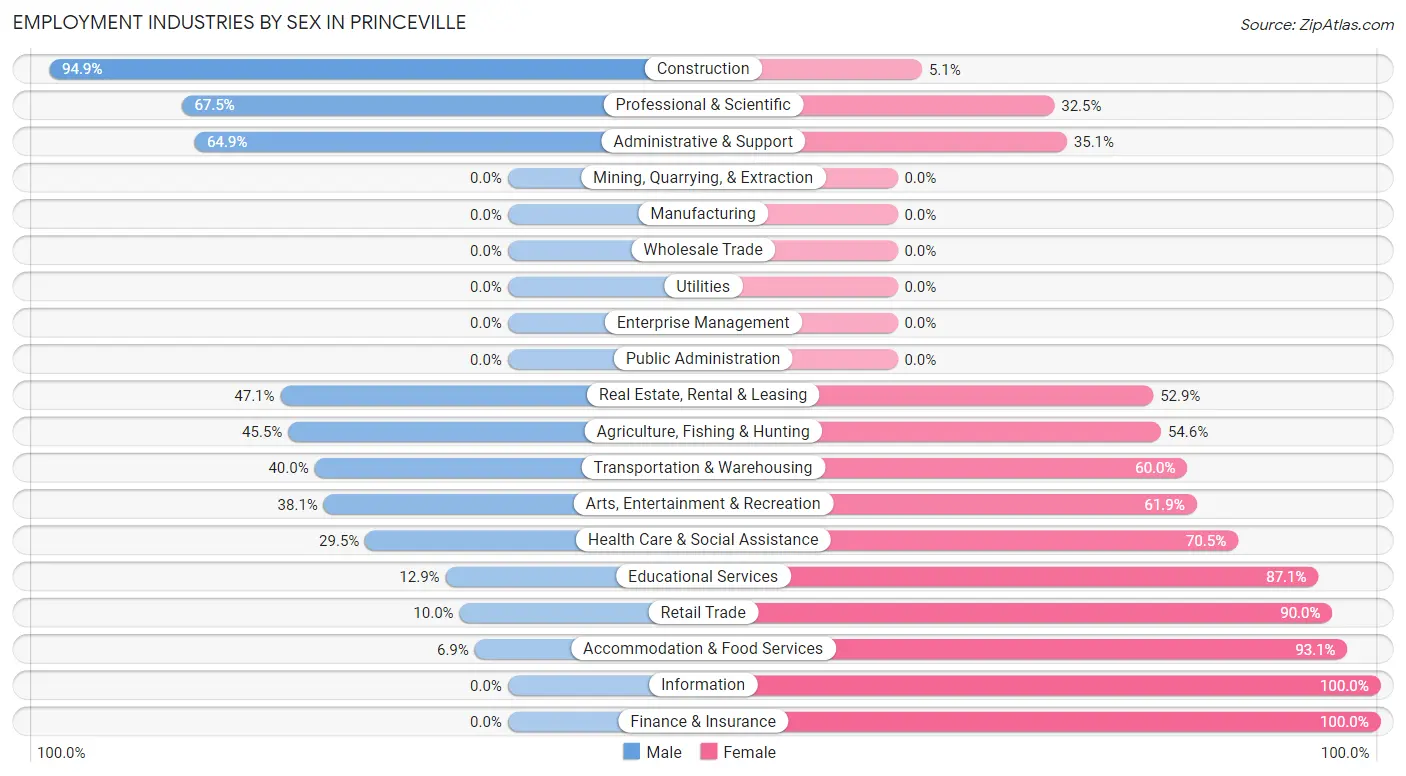
Employment Industries by Sex in Princeville
The Princeville industries that see more men than women are Construction (94.9%), Professional & Scientific (67.5%), and Administrative & Support (64.9%), whereas the industries that tend to have a higher number of women are Information (100.0%), Finance & Insurance (100.0%), and Accommodation & Food Services (93.1%).
| Industry | Male | Female |
| Agriculture, Fishing & Hunting | 5 (45.5%) | 6 (54.5%) |
| Mining, Quarrying, & Extraction | 0 (0.0%) | 0 (0.0%) |
| Construction | 56 (94.9%) | 3 (5.1%) |
| Manufacturing | 0 (0.0%) | 0 (0.0%) |
| Wholesale Trade | 0 (0.0%) | 0 (0.0%) |
| Retail Trade | 3 (10.0%) | 27 (90.0%) |
| Transportation & Warehousing | 10 (40.0%) | 15 (60.0%) |
| Utilities | 0 (0.0%) | 0 (0.0%) |
| Information | 0 (0.0%) | 18 (100.0%) |
| Finance & Insurance | 0 (0.0%) | 15 (100.0%) |
| Real Estate, Rental & Leasing | 40 (47.1%) | 45 (52.9%) |
| Professional & Scientific | 52 (67.5%) | 25 (32.5%) |
| Enterprise Management | 0 (0.0%) | 0 (0.0%) |
| Administrative & Support | 87 (64.9%) | 47 (35.1%) |
| Educational Services | 8 (12.9%) | 54 (87.1%) |
| Health Care & Social Assistance | 18 (29.5%) | 43 (70.5%) |
| Arts, Entertainment & Recreation | 16 (38.1%) | 26 (61.9%) |
| Accommodation & Food Services | 12 (6.9%) | 163 (93.1%) |
| Public Administration | 0 (0.0%) | 0 (0.0%) |
| Total | 316 (37.1%) | 536 (62.9%) |
Education in Princeville
School Enrollment in Princeville
The most common levels of schooling among the 401 students in Princeville are high school (126 | 31.4%), middle school (93 | 23.2%), and elementary school (64 | 16.0%).
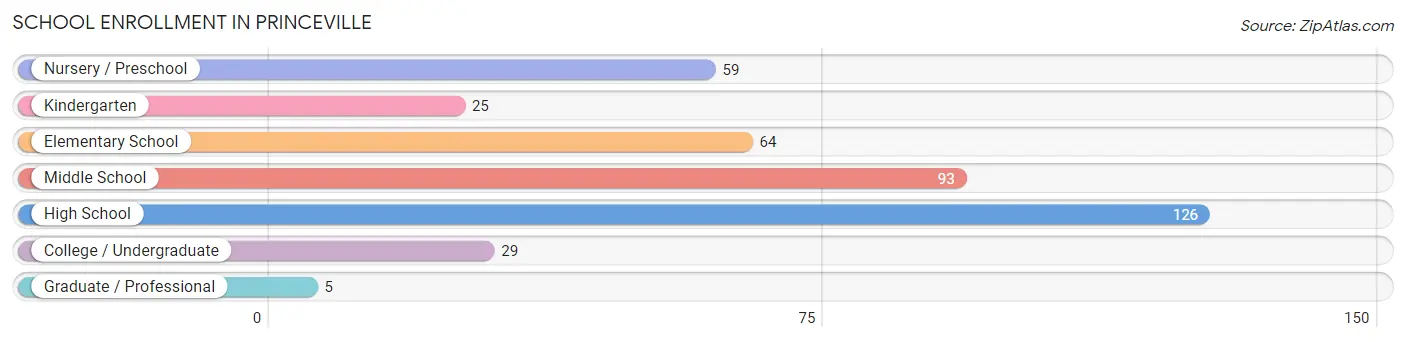
| School Level | # Students | % Students |
| Nursery / Preschool | 59 | 14.7% |
| Kindergarten | 25 | 6.2% |
| Elementary School | 64 | 16.0% |
| Middle School | 93 | 23.2% |
| High School | 126 | 31.4% |
| College / Undergraduate | 29 | 7.2% |
| Graduate / Professional | 5 | 1.3% |
| Total | 401 | 100.0% |
School Enrollment by Age by Funding Source in Princeville
Out of a total of 401 students who are enrolled in schools in Princeville, 124 (30.9%) attend a private institution, while the remaining 277 (69.1%) are enrolled in public schools. The age group of 3 to 4 year olds has the highest likelihood of being enrolled in private schools, with 59 (100.0% in the age bracket) enrolled. Conversely, the age group of 18 to 19 year olds has the lowest likelihood of being enrolled in a private school, with 4 (100.0% in the age bracket) attending a public institution.
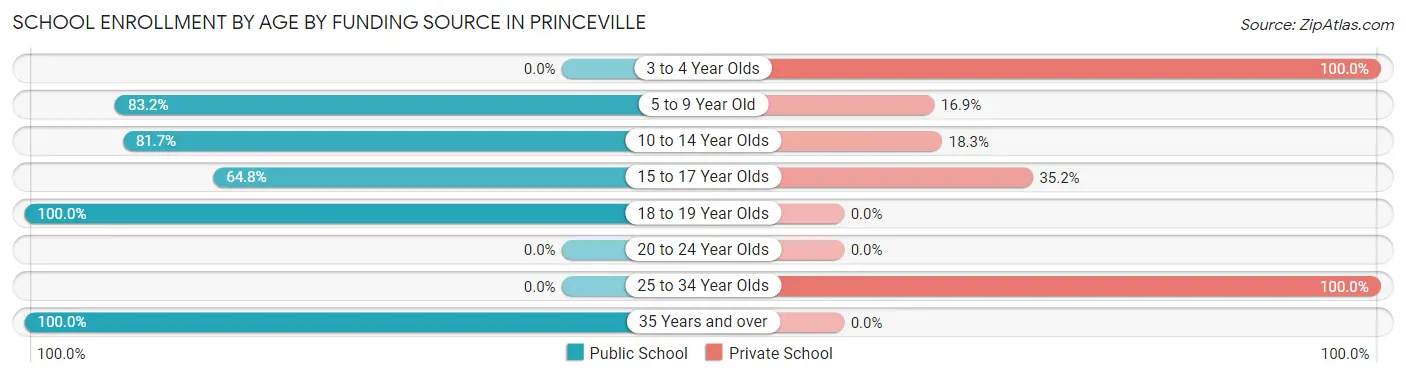
| Age Bracket | Public School | Private School |
| 3 to 4 Year Olds | 0 (0.0%) | 59 (100.0%) |
| 5 to 9 Year Old | 74 (83.2%) | 15 (16.9%) |
| 10 to 14 Year Olds | 76 (81.7%) | 17 (18.3%) |
| 15 to 17 Year Olds | 59 (64.8%) | 32 (35.2%) |
| 18 to 19 Year Olds | 4 (100.0%) | 0 (0.0%) |
| 20 to 24 Year Olds | 0 (0.0%) | 0 (0.0%) |
| 25 to 34 Year Olds | 0 (0.0%) | 1 (100.0%) |
| 35 Years and over | 64 (100.0%) | 0 (0.0%) |
| Total | 277 (69.1%) | 124 (30.9%) |
Educational Attainment by Field of Study in Princeville
Visual & performing arts (123 | 13.9%), business (107 | 12.1%), engineering (95 | 10.7%), social sciences (83 | 9.4%), and education (77 | 8.7%) are the most common fields of study among 886 individuals in Princeville who have obtained a bachelor's degree or higher.
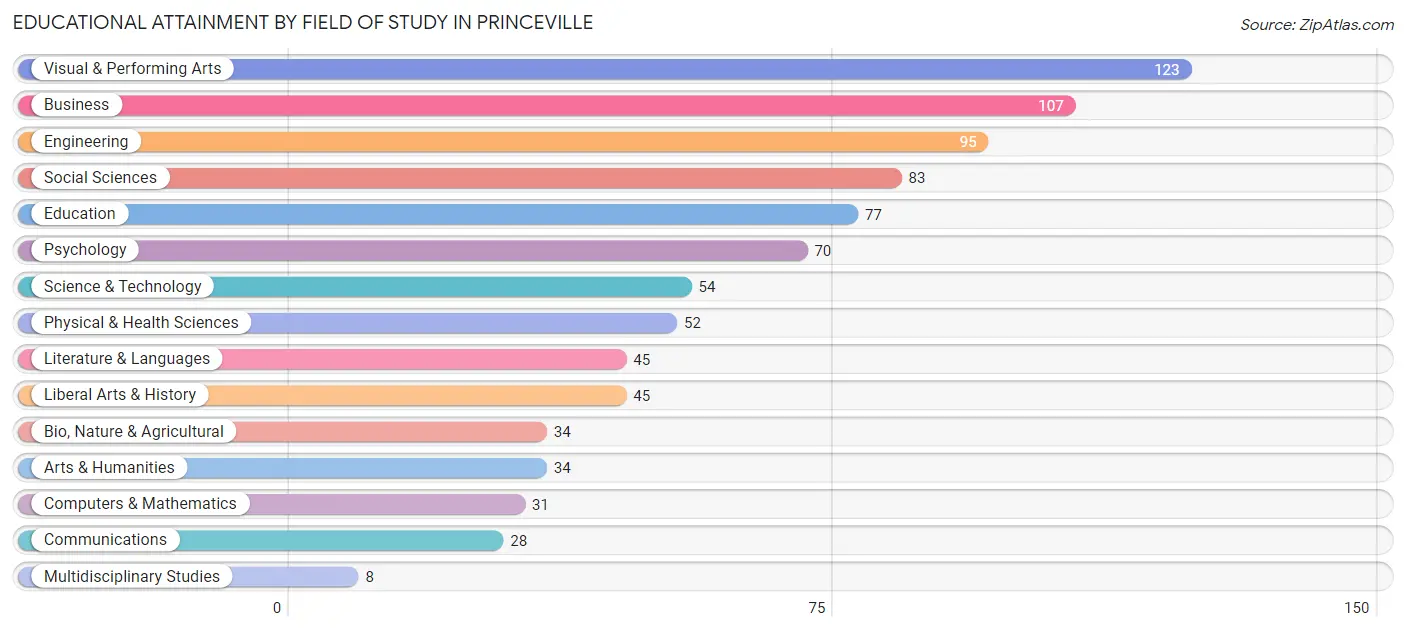
| Field of Study | # Graduates | % Graduates |
| Computers & Mathematics | 31 | 3.5% |
| Bio, Nature & Agricultural | 34 | 3.8% |
| Physical & Health Sciences | 52 | 5.9% |
| Psychology | 70 | 7.9% |
| Social Sciences | 83 | 9.4% |
| Engineering | 95 | 10.7% |
| Multidisciplinary Studies | 8 | 0.9% |
| Science & Technology | 54 | 6.1% |
| Business | 107 | 12.1% |
| Education | 77 | 8.7% |
| Literature & Languages | 45 | 5.1% |
| Liberal Arts & History | 45 | 5.1% |
| Visual & Performing Arts | 123 | 13.9% |
| Communications | 28 | 3.2% |
| Arts & Humanities | 34 | 3.8% |
| Total | 886 | 100.0% |
Transportation & Commute in Princeville
Vehicle Availability by Sex in Princeville
The most prevalent vehicle ownership categories in Princeville are males with 2 vehicles (208, accounting for 67.3%) and females with 2 vehicles (215, making up 47.6%).
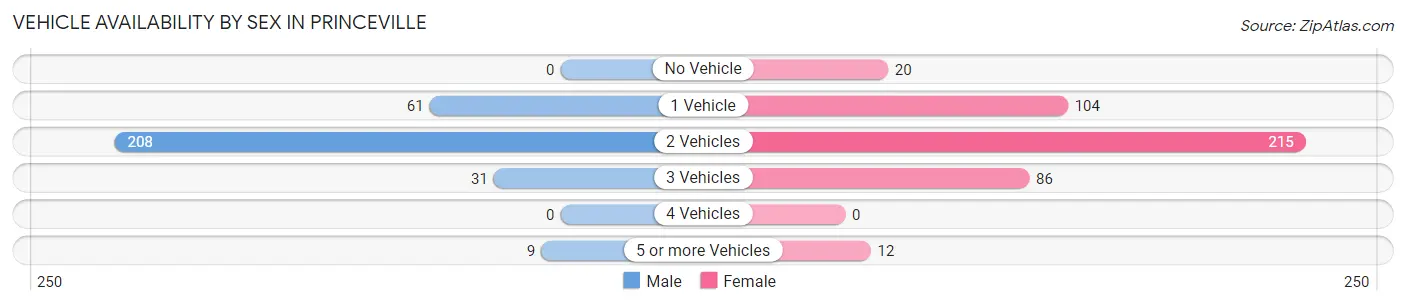
| Vehicles Available | Male | Female |
| No Vehicle | 0 (0.0%) | 20 (4.6%) |
| 1 Vehicle | 61 (19.7%) | 104 (23.8%) |
| 2 Vehicles | 208 (67.3%) | 215 (49.2%) |
| 3 Vehicles | 31 (10.0%) | 86 (19.7%) |
| 4 Vehicles | 0 (0.0%) | 0 (0.0%) |
| 5 or more Vehicles | 9 (2.9%) | 12 (2.8%) |
| Total | 309 (100.0%) | 437 (100.0%) |
Commute Time in Princeville
The most frequently occuring commute durations in Princeville are 15 to 19 minutes (124 commuters, 23.3%), less than 5 minutes (102 commuters, 19.2%), and 10 to 14 minutes (100 commuters, 18.8%).
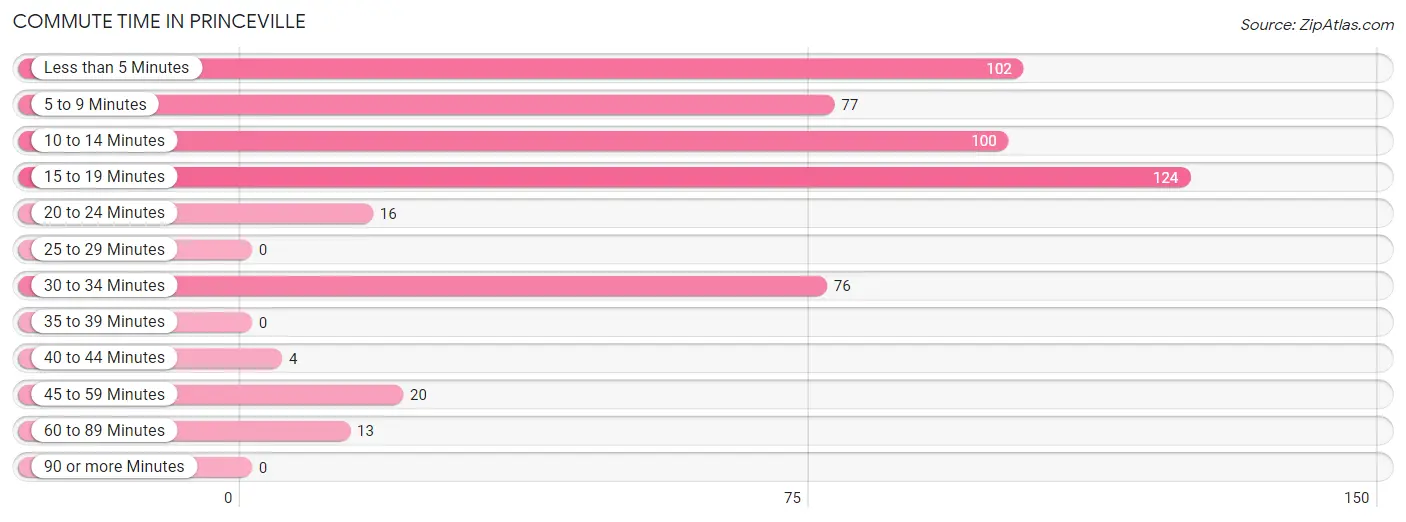
| Commute Time | # Commuters | % Commuters |
| Less than 5 Minutes | 102 | 19.2% |
| 5 to 9 Minutes | 77 | 14.5% |
| 10 to 14 Minutes | 100 | 18.8% |
| 15 to 19 Minutes | 124 | 23.3% |
| 20 to 24 Minutes | 16 | 3.0% |
| 25 to 29 Minutes | 0 | 0.0% |
| 30 to 34 Minutes | 76 | 14.3% |
| 35 to 39 Minutes | 0 | 0.0% |
| 40 to 44 Minutes | 4 | 0.7% |
| 45 to 59 Minutes | 20 | 3.8% |
| 60 to 89 Minutes | 13 | 2.4% |
| 90 or more Minutes | 0 | 0.0% |
Commute Time by Sex in Princeville
The most common commute times in Princeville are less than 5 minutes (63 commuters, 26.1%) for males and 15 to 19 minutes (86 commuters, 29.5%) for females.
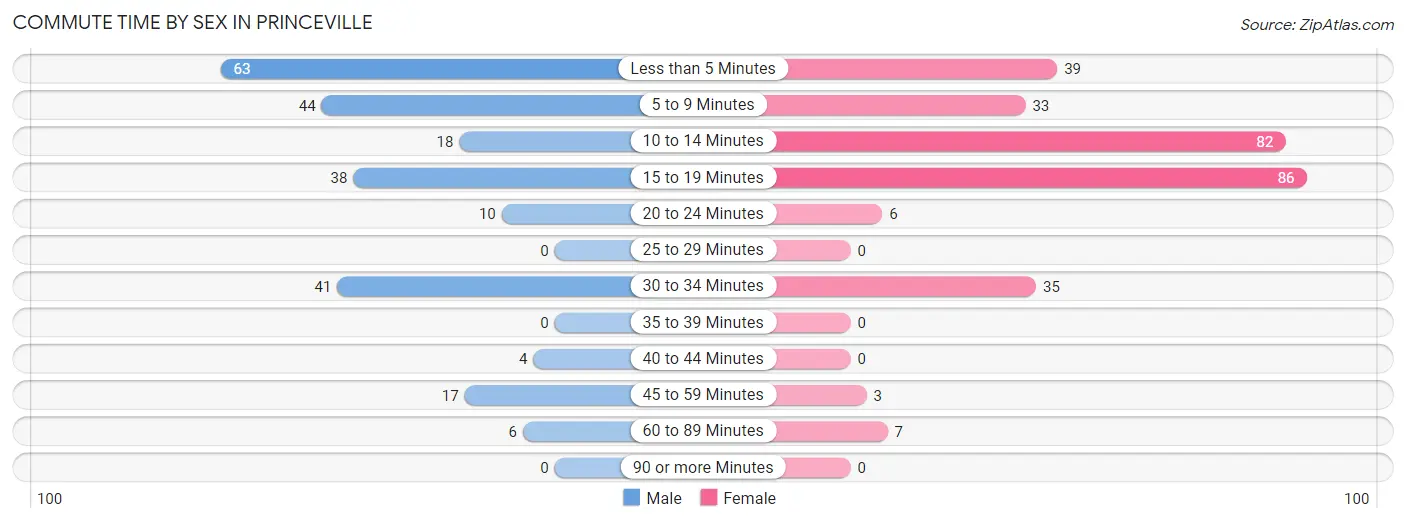
| Commute Time | Male | Female |
| Less than 5 Minutes | 63 (26.1%) | 39 (13.4%) |
| 5 to 9 Minutes | 44 (18.3%) | 33 (11.3%) |
| 10 to 14 Minutes | 18 (7.5%) | 82 (28.2%) |
| 15 to 19 Minutes | 38 (15.8%) | 86 (29.5%) |
| 20 to 24 Minutes | 10 (4.2%) | 6 (2.1%) |
| 25 to 29 Minutes | 0 (0.0%) | 0 (0.0%) |
| 30 to 34 Minutes | 41 (17.0%) | 35 (12.0%) |
| 35 to 39 Minutes | 0 (0.0%) | 0 (0.0%) |
| 40 to 44 Minutes | 4 (1.7%) | 0 (0.0%) |
| 45 to 59 Minutes | 17 (7.0%) | 3 (1.0%) |
| 60 to 89 Minutes | 6 (2.5%) | 7 (2.4%) |
| 90 or more Minutes | 0 (0.0%) | 0 (0.0%) |
Time of Departure to Work by Sex in Princeville
The most frequent times of departure to work in Princeville are 4:00 PM to 11:59 PM (75, 31.1%) for males and 9:00 AM to 9:59 AM (72, 24.7%) for females.
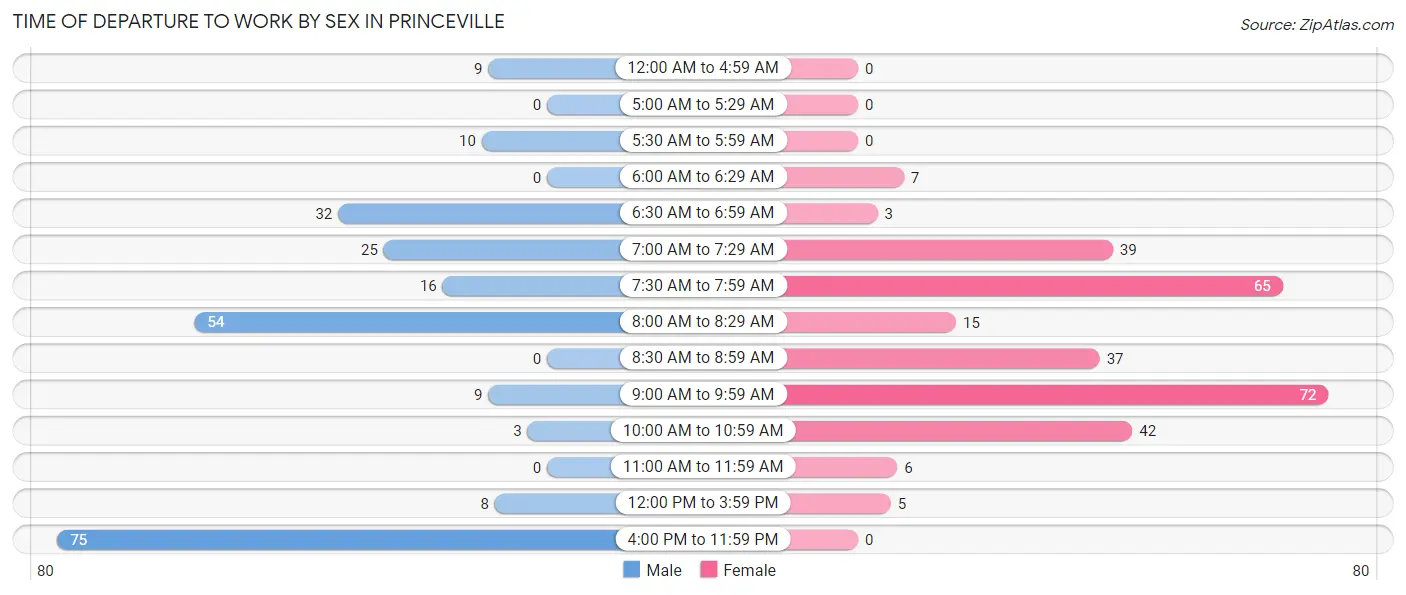
| Time of Departure | Male | Female |
| 12:00 AM to 4:59 AM | 9 (3.7%) | 0 (0.0%) |
| 5:00 AM to 5:29 AM | 0 (0.0%) | 0 (0.0%) |
| 5:30 AM to 5:59 AM | 10 (4.2%) | 0 (0.0%) |
| 6:00 AM to 6:29 AM | 0 (0.0%) | 7 (2.4%) |
| 6:30 AM to 6:59 AM | 32 (13.3%) | 3 (1.0%) |
| 7:00 AM to 7:29 AM | 25 (10.4%) | 39 (13.4%) |
| 7:30 AM to 7:59 AM | 16 (6.6%) | 65 (22.3%) |
| 8:00 AM to 8:29 AM | 54 (22.4%) | 15 (5.1%) |
| 8:30 AM to 8:59 AM | 0 (0.0%) | 37 (12.7%) |
| 9:00 AM to 9:59 AM | 9 (3.7%) | 72 (24.7%) |
| 10:00 AM to 10:59 AM | 3 (1.2%) | 42 (14.4%) |
| 11:00 AM to 11:59 AM | 0 (0.0%) | 6 (2.1%) |
| 12:00 PM to 3:59 PM | 8 (3.3%) | 5 (1.7%) |
| 4:00 PM to 11:59 PM | 75 (31.1%) | 0 (0.0%) |
| Total | 241 (100.0%) | 291 (100.0%) |
Housing Occupancy in Princeville
Occupancy by Ownership in Princeville
Of the total 927 dwellings in Princeville, owner-occupied units account for 631 (68.1%), while renter-occupied units make up 296 (31.9%).
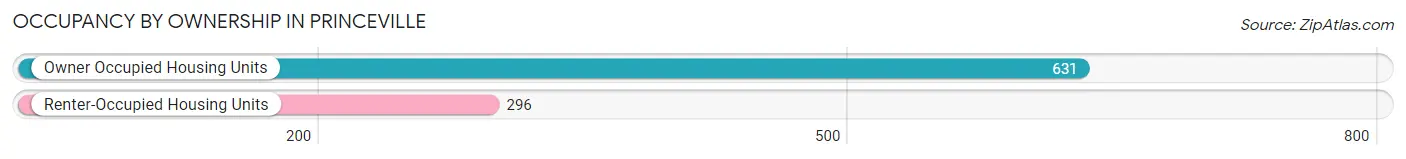
| Occupancy | # Housing Units | % Housing Units |
| Owner Occupied Housing Units | 631 | 68.1% |
| Renter-Occupied Housing Units | 296 | 31.9% |
| Total Occupied Housing Units | 927 | 100.0% |
Occupancy by Household Size in Princeville
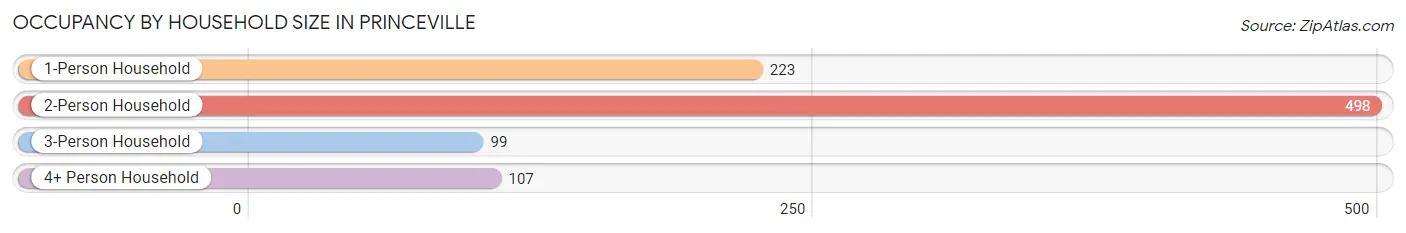
| Household Size | # Housing Units | % Housing Units |
| 1-Person Household | 223 | 24.1% |
| 2-Person Household | 498 | 53.7% |
| 3-Person Household | 99 | 10.7% |
| 4+ Person Household | 107 | 11.5% |
| Total Housing Units | 927 | 100.0% |
Occupancy by Ownership by Household Size in Princeville
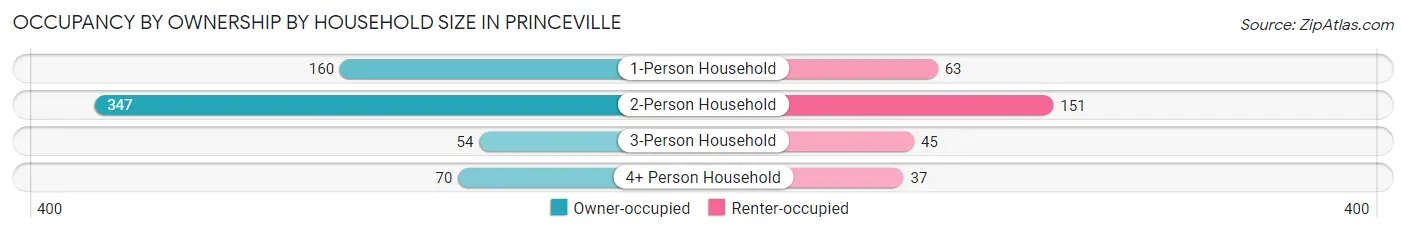
| Household Size | Owner-occupied | Renter-occupied |
| 1-Person Household | 160 (71.8%) | 63 (28.2%) |
| 2-Person Household | 347 (69.7%) | 151 (30.3%) |
| 3-Person Household | 54 (54.5%) | 45 (45.5%) |
| 4+ Person Household | 70 (65.4%) | 37 (34.6%) |
| Total Housing Units | 631 (68.1%) | 296 (31.9%) |
Occupancy by Educational Attainment in Princeville
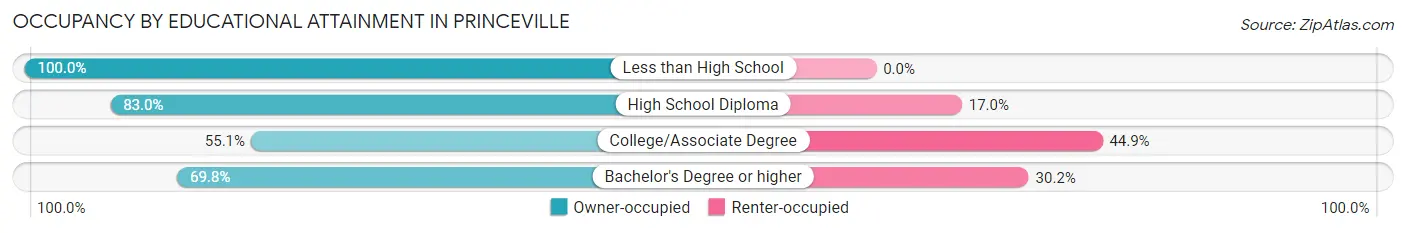
| Household Size | Owner-occupied | Renter-occupied |
| Less than High School | 5 (100.0%) | 0 (0.0%) |
| High School Diploma | 88 (83.0%) | 18 (17.0%) |
| College/Associate Degree | 118 (55.1%) | 96 (44.9%) |
| Bachelor's Degree or higher | 420 (69.8%) | 182 (30.2%) |
Occupancy by Age of Householder in Princeville
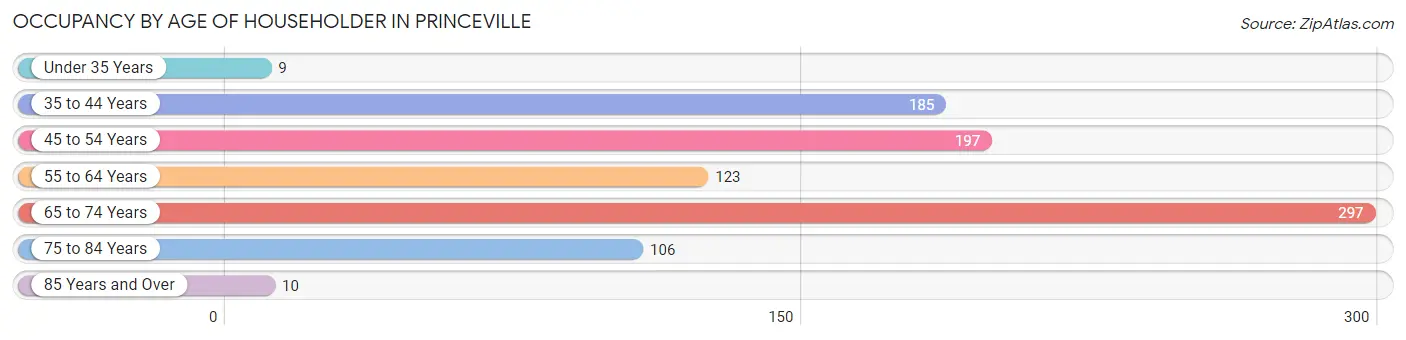
| Age Bracket | # Households | % Households |
| Under 35 Years | 9 | 1.0% |
| 35 to 44 Years | 185 | 20.0% |
| 45 to 54 Years | 197 | 21.2% |
| 55 to 64 Years | 123 | 13.3% |
| 65 to 74 Years | 297 | 32.0% |
| 75 to 84 Years | 106 | 11.4% |
| 85 Years and Over | 10 | 1.1% |
| Total | 927 | 100.0% |
Housing Finances in Princeville
Median Income by Occupancy in Princeville
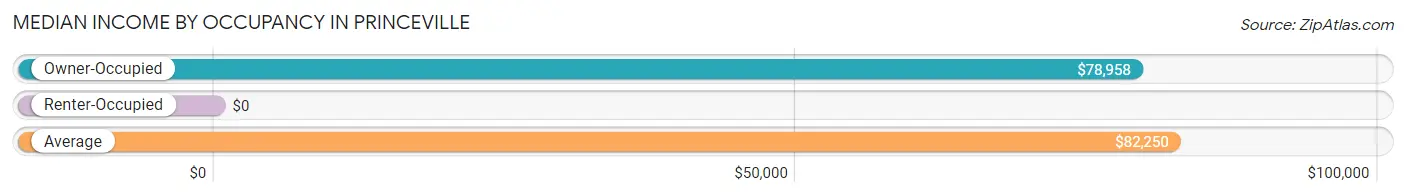
| Occupancy Type | # Households | Median Income |
| Owner-Occupied | 631 (68.1%) | $78,958 |
| Renter-Occupied | 296 (31.9%) | $0 |
| Average | 927 (100.0%) | $82,250 |
Occupancy by Householder Income Bracket in Princeville
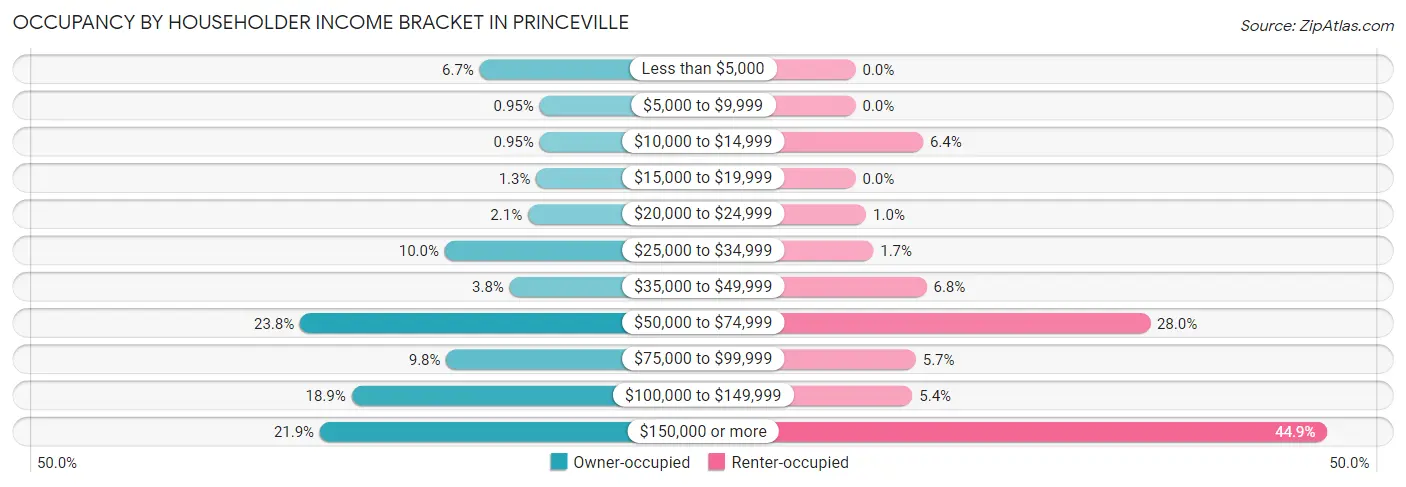
| Income Bracket | Owner-occupied | Renter-occupied |
| Less than $5,000 | 42 (6.7%) | 0 (0.0%) |
| $5,000 to $9,999 | 6 (0.9%) | 0 (0.0%) |
| $10,000 to $14,999 | 6 (0.9%) | 19 (6.4%) |
| $15,000 to $19,999 | 8 (1.3%) | 0 (0.0%) |
| $20,000 to $24,999 | 13 (2.1%) | 3 (1.0%) |
| $25,000 to $34,999 | 63 (10.0%) | 5 (1.7%) |
| $35,000 to $49,999 | 24 (3.8%) | 20 (6.8%) |
| $50,000 to $74,999 | 150 (23.8%) | 83 (28.0%) |
| $75,000 to $99,999 | 62 (9.8%) | 17 (5.7%) |
| $100,000 to $149,999 | 119 (18.9%) | 16 (5.4%) |
| $150,000 or more | 138 (21.9%) | 133 (44.9%) |
| Total | 631 (100.0%) | 296 (100.0%) |
Monthly Housing Cost Tiers in Princeville
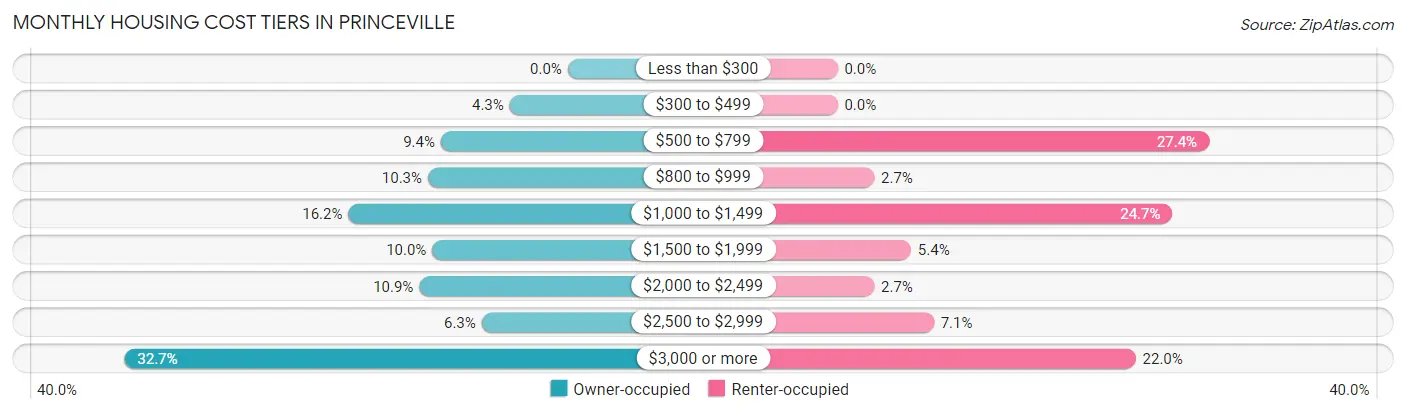
| Monthly Cost | Owner-occupied | Renter-occupied |
| Less than $300 | 0 (0.0%) | 0 (0.0%) |
| $300 to $499 | 27 (4.3%) | 0 (0.0%) |
| $500 to $799 | 59 (9.3%) | 81 (27.4%) |
| $800 to $999 | 65 (10.3%) | 8 (2.7%) |
| $1,000 to $1,499 | 102 (16.2%) | 73 (24.7%) |
| $1,500 to $1,999 | 63 (10.0%) | 16 (5.4%) |
| $2,000 to $2,499 | 69 (10.9%) | 8 (2.7%) |
| $2,500 to $2,999 | 40 (6.3%) | 21 (7.1%) |
| $3,000 or more | 206 (32.7%) | 65 (22.0%) |
| Total | 631 (100.0%) | 296 (100.0%) |
Physical Housing Characteristics in Princeville
Housing Structures in Princeville
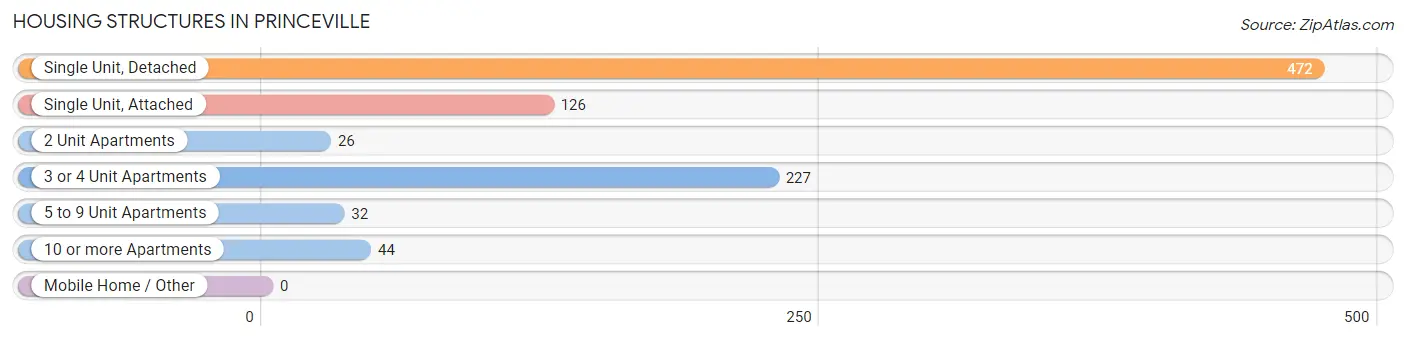
| Structure Type | # Housing Units | % Housing Units |
| Single Unit, Detached | 472 | 50.9% |
| Single Unit, Attached | 126 | 13.6% |
| 2 Unit Apartments | 26 | 2.8% |
| 3 or 4 Unit Apartments | 227 | 24.5% |
| 5 to 9 Unit Apartments | 32 | 3.5% |
| 10 or more Apartments | 44 | 4.8% |
| Mobile Home / Other | 0 | 0.0% |
| Total | 927 | 100.0% |
Housing Structures by Occupancy in Princeville
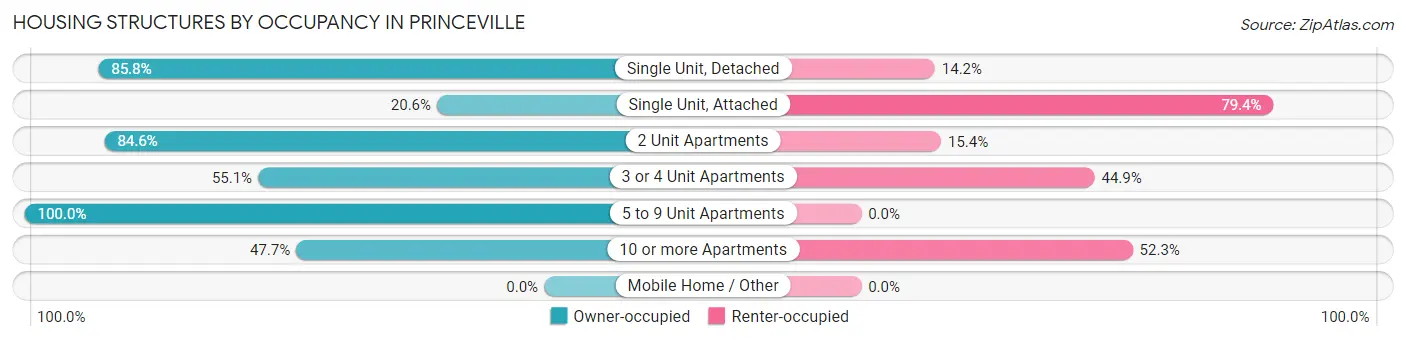
| Structure Type | Owner-occupied | Renter-occupied |
| Single Unit, Detached | 405 (85.8%) | 67 (14.2%) |
| Single Unit, Attached | 26 (20.6%) | 100 (79.4%) |
| 2 Unit Apartments | 22 (84.6%) | 4 (15.4%) |
| 3 or 4 Unit Apartments | 125 (55.1%) | 102 (44.9%) |
| 5 to 9 Unit Apartments | 32 (100.0%) | 0 (0.0%) |
| 10 or more Apartments | 21 (47.7%) | 23 (52.3%) |
| Mobile Home / Other | 0 (0.0%) | 0 (0.0%) |
| Total | 631 (68.1%) | 296 (31.9%) |
Housing Structures by Number of Rooms in Princeville
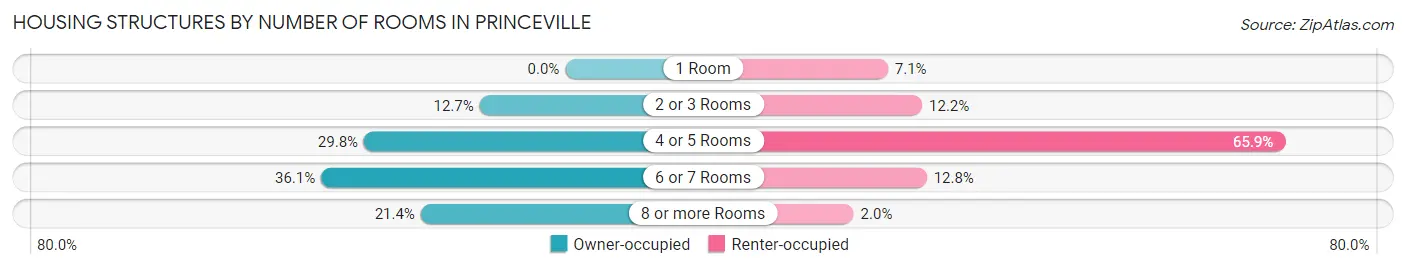
| Number of Rooms | Owner-occupied | Renter-occupied |
| 1 Room | 0 (0.0%) | 21 (7.1%) |
| 2 or 3 Rooms | 80 (12.7%) | 36 (12.2%) |
| 4 or 5 Rooms | 188 (29.8%) | 195 (65.9%) |
| 6 or 7 Rooms | 228 (36.1%) | 38 (12.8%) |
| 8 or more Rooms | 135 (21.4%) | 6 (2.0%) |
| Total | 631 (100.0%) | 296 (100.0%) |
Housing Structure by Heating Type in Princeville
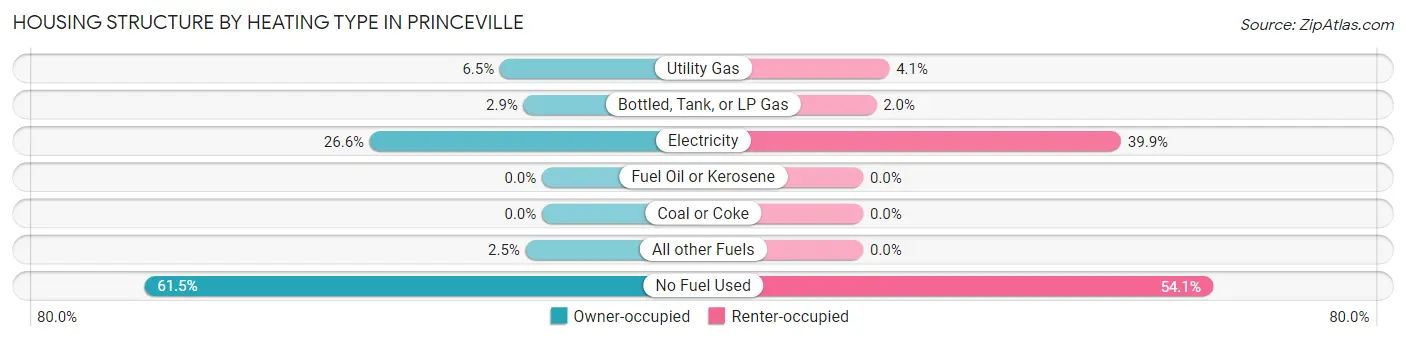
| Heating Type | Owner-occupied | Renter-occupied |
| Utility Gas | 41 (6.5%) | 12 (4.1%) |
| Bottled, Tank, or LP Gas | 18 (2.9%) | 6 (2.0%) |
| Electricity | 168 (26.6%) | 118 (39.9%) |
| Fuel Oil or Kerosene | 0 (0.0%) | 0 (0.0%) |
| Coal or Coke | 0 (0.0%) | 0 (0.0%) |
| All other Fuels | 16 (2.5%) | 0 (0.0%) |
| No Fuel Used | 388 (61.5%) | 160 (54.0%) |
| Total | 631 (100.0%) | 296 (100.0%) |
Household Vehicle Usage in Princeville
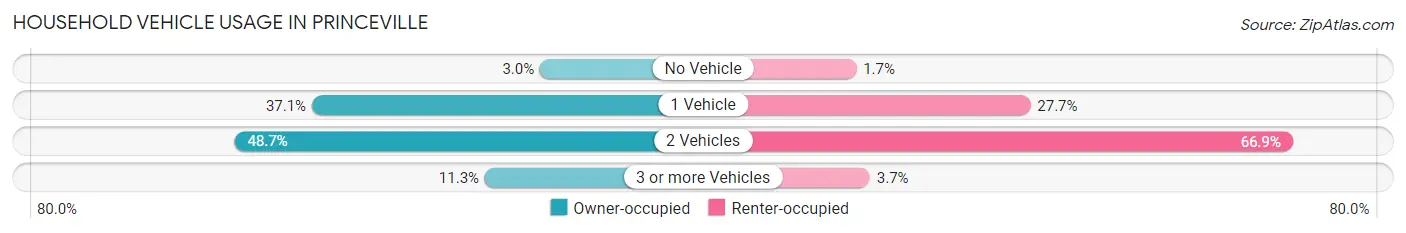
| Vehicles per Household | Owner-occupied | Renter-occupied |
| No Vehicle | 19 (3.0%) | 5 (1.7%) |
| 1 Vehicle | 234 (37.1%) | 82 (27.7%) |
| 2 Vehicles | 307 (48.6%) | 198 (66.9%) |
| 3 or more Vehicles | 71 (11.3%) | 11 (3.7%) |
| Total | 631 (100.0%) | 296 (100.0%) |
Real Estate & Mortgages in Princeville
Real Estate and Mortgage Overview in Princeville
| Characteristic | Without Mortgage | With Mortgage |
| Housing Units | 295 | 336 |
| Median Property Value | $1,168,700 | $887,000 |
| Median Household Income | $85,568 | $70 |
| Monthly Housing Costs | $992 | $180 |
| Real Estate Taxes | $2,774 | $8 |
Property Value by Mortgage Status in Princeville
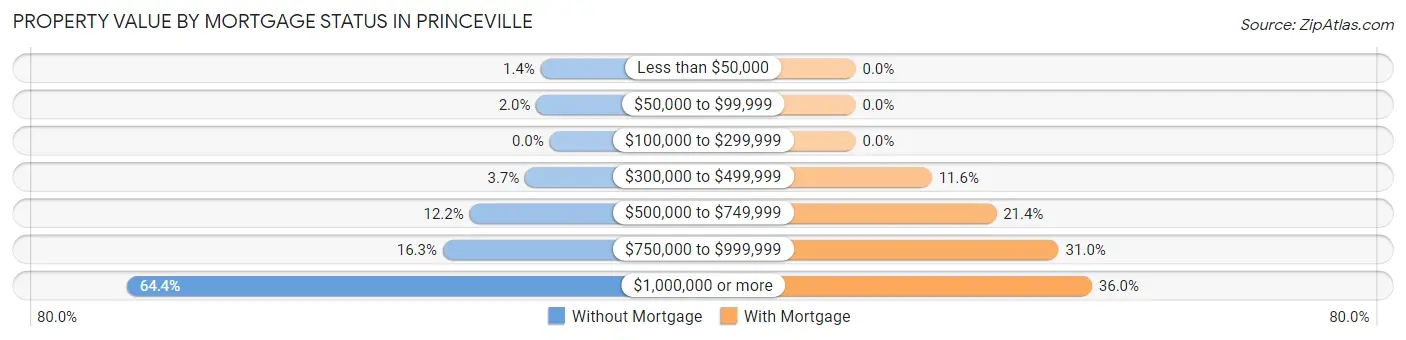
| Property Value | Without Mortgage | With Mortgage |
| Less than $50,000 | 4 (1.4%) | 0 (0.0%) |
| $50,000 to $99,999 | 6 (2.0%) | 0 (0.0%) |
| $100,000 to $299,999 | 0 (0.0%) | 0 (0.0%) |
| $300,000 to $499,999 | 11 (3.7%) | 39 (11.6%) |
| $500,000 to $749,999 | 36 (12.2%) | 72 (21.4%) |
| $750,000 to $999,999 | 48 (16.3%) | 104 (30.9%) |
| $1,000,000 or more | 190 (64.4%) | 121 (36.0%) |
| Total | 295 (100.0%) | 336 (100.0%) |
Household Income by Mortgage Status in Princeville
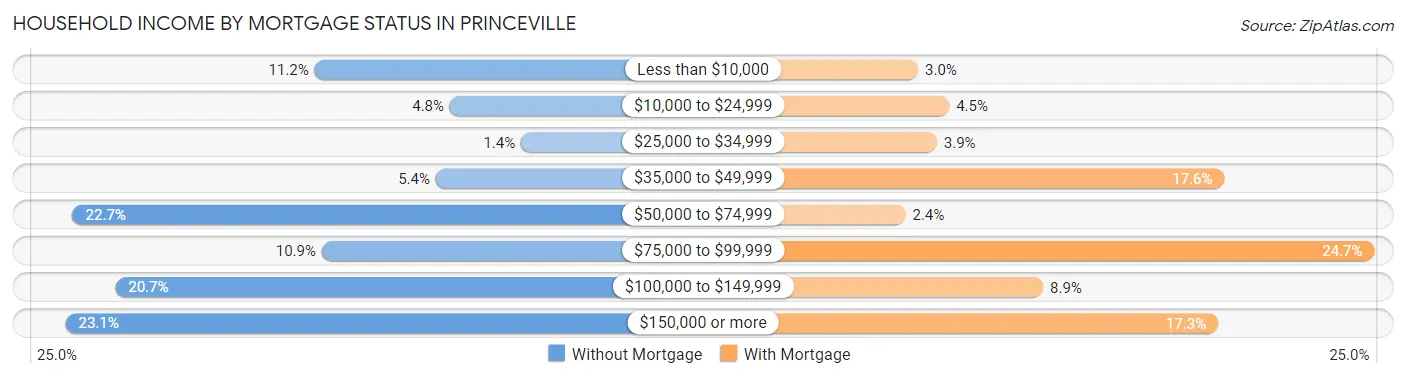
| Household Income | Without Mortgage | With Mortgage |
| Less than $10,000 | 33 (11.2%) | 10 (3.0%) |
| $10,000 to $24,999 | 14 (4.8%) | 15 (4.5%) |
| $25,000 to $34,999 | 4 (1.4%) | 13 (3.9%) |
| $35,000 to $49,999 | 16 (5.4%) | 59 (17.6%) |
| $50,000 to $74,999 | 67 (22.7%) | 8 (2.4%) |
| $75,000 to $99,999 | 32 (10.8%) | 83 (24.7%) |
| $100,000 to $149,999 | 61 (20.7%) | 30 (8.9%) |
| $150,000 or more | 68 (23.1%) | 58 (17.3%) |
| Total | 295 (100.0%) | 336 (100.0%) |
Property Value to Household Income Ratio in Princeville
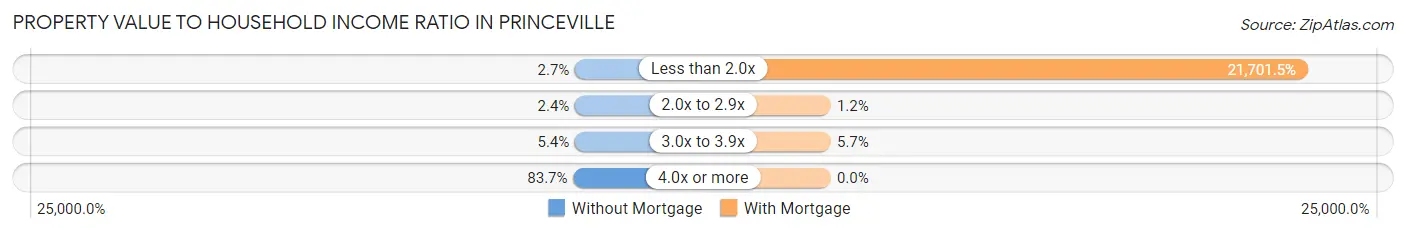
| Value-to-Income Ratio | Without Mortgage | With Mortgage |
| Less than 2.0x | 8 (2.7%) | 72,917 (21,701.5%) |
| 2.0x to 2.9x | 7 (2.4%) | 4 (1.2%) |
| 3.0x to 3.9x | 16 (5.4%) | 19 (5.7%) |
| 4.0x or more | 247 (83.7%) | 0 (0.0%) |
| Total | 295 (100.0%) | 336 (100.0%) |
Real Estate Taxes by Mortgage Status in Princeville
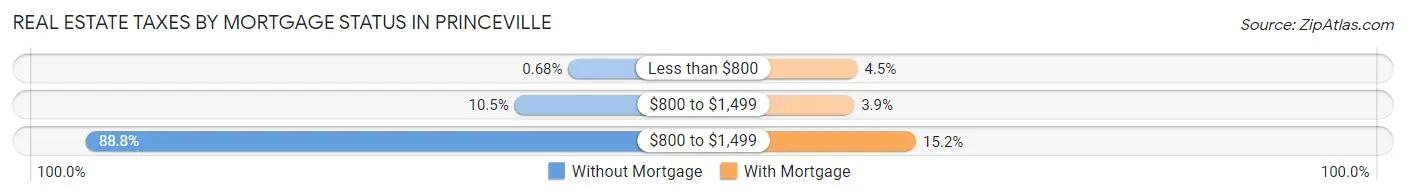
| Property Taxes | Without Mortgage | With Mortgage |
| Less than $800 | 2 (0.7%) | 15 (4.5%) |
| $800 to $1,499 | 31 (10.5%) | 13 (3.9%) |
| $800 to $1,499 | 262 (88.8%) | 51 (15.2%) |
| Total | 295 (100.0%) | 336 (100.0%) |
Health & Disability in Princeville
Health Insurance Coverage by Age in Princeville
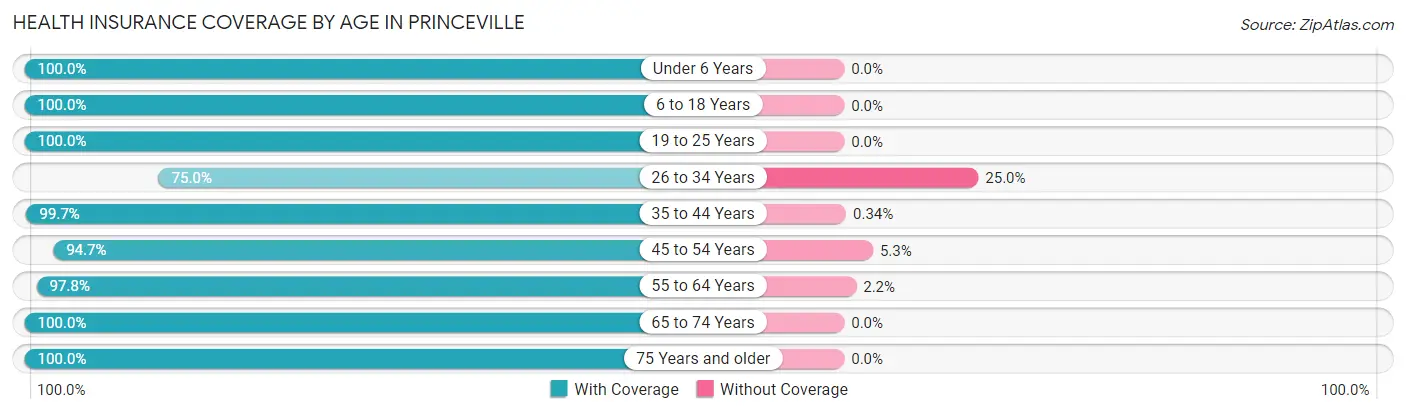
| Age Bracket | With Coverage | Without Coverage |
| Under 6 Years | 86 (100.0%) | 0 (0.0%) |
| 6 to 18 Years | 326 (100.0%) | 0 (0.0%) |
| 19 to 25 Years | 38 (100.0%) | 0 (0.0%) |
| 26 to 34 Years | 36 (75.0%) | 12 (25.0%) |
| 35 to 44 Years | 297 (99.7%) | 1 (0.3%) |
| 45 to 54 Years | 319 (94.7%) | 18 (5.3%) |
| 55 to 64 Years | 219 (97.8%) | 5 (2.2%) |
| 65 to 74 Years | 477 (100.0%) | 0 (0.0%) |
| 75 Years and older | 173 (100.0%) | 0 (0.0%) |
| Total | 1,971 (98.2%) | 36 (1.8%) |
Health Insurance Coverage by Citizenship Status in Princeville
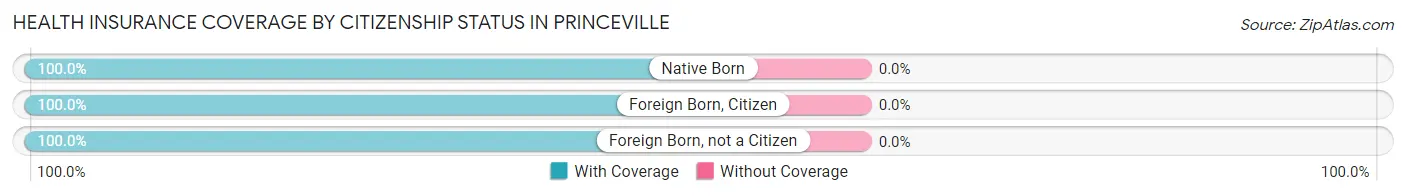
| Citizenship Status | With Coverage | Without Coverage |
| Native Born | 86 (100.0%) | 0 (0.0%) |
| Foreign Born, Citizen | 326 (100.0%) | 0 (0.0%) |
| Foreign Born, not a Citizen | 38 (100.0%) | 0 (0.0%) |
Health Insurance Coverage by Household Income in Princeville
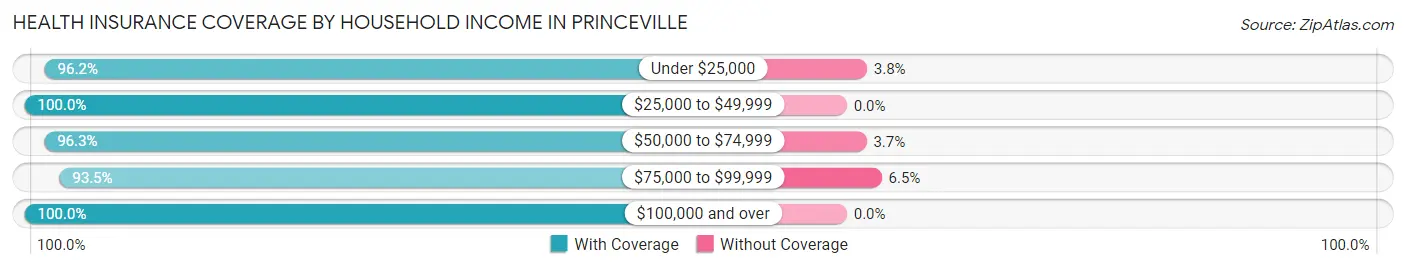
| Household Income | With Coverage | Without Coverage |
| Under $25,000 | 128 (96.2%) | 5 (3.8%) |
| $25,000 to $49,999 | 311 (100.0%) | 0 (0.0%) |
| $50,000 to $74,999 | 497 (96.3%) | 19 (3.7%) |
| $75,000 to $99,999 | 172 (93.5%) | 12 (6.5%) |
| $100,000 and over | 863 (100.0%) | 0 (0.0%) |
Public vs Private Health Insurance Coverage by Age in Princeville
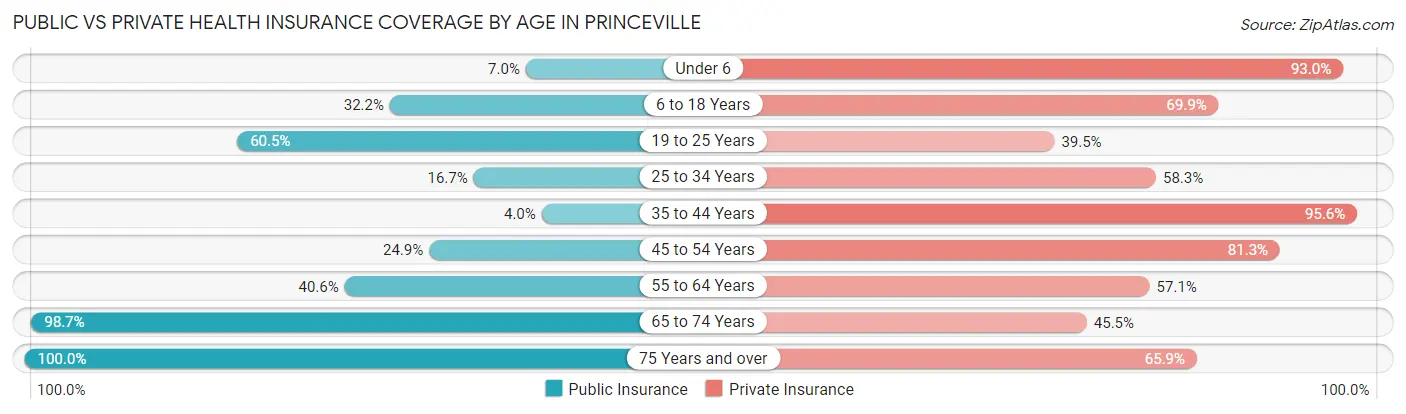
| Age Bracket | Public Insurance | Private Insurance |
| Under 6 | 6 (7.0%) | 80 (93.0%) |
| 6 to 18 Years | 105 (32.2%) | 228 (69.9%) |
| 19 to 25 Years | 23 (60.5%) | 15 (39.5%) |
| 25 to 34 Years | 8 (16.7%) | 28 (58.3%) |
| 35 to 44 Years | 12 (4.0%) | 285 (95.6%) |
| 45 to 54 Years | 84 (24.9%) | 274 (81.3%) |
| 55 to 64 Years | 91 (40.6%) | 128 (57.1%) |
| 65 to 74 Years | 471 (98.7%) | 217 (45.5%) |
| 75 Years and over | 173 (100.0%) | 114 (65.9%) |
| Total | 973 (48.5%) | 1,369 (68.2%) |
Disability Status by Sex by Age in Princeville
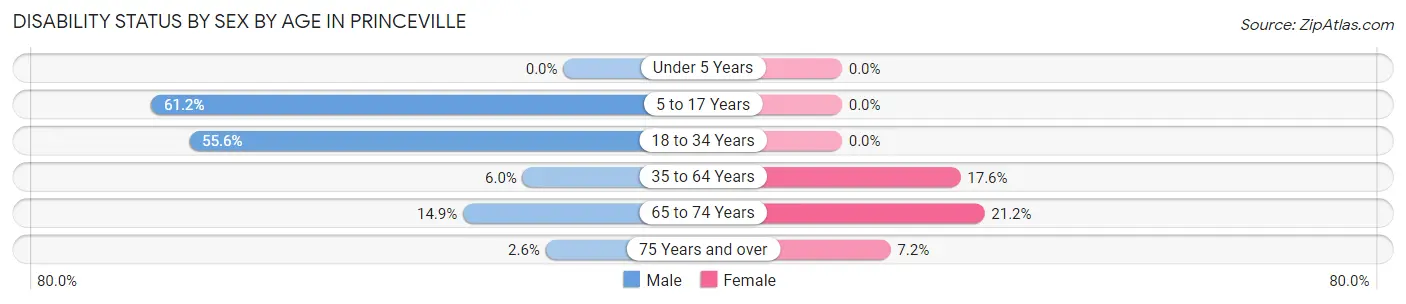
| Age Bracket | Male | Female |
| Under 5 Years | 0 (0.0%) | 0 (0.0%) |
| 5 to 17 Years | 101 (61.2%) | 0 (0.0%) |
| 18 to 34 Years | 5 (55.6%) | 0 (0.0%) |
| 35 to 64 Years | 20 (6.0%) | 93 (17.6%) |
| 65 to 74 Years | 38 (14.9%) | 47 (21.2%) |
| 75 Years and over | 2 (2.6%) | 7 (7.2%) |
Disability Class by Sex by Age in Princeville
Disability Class: Hearing Difficulty
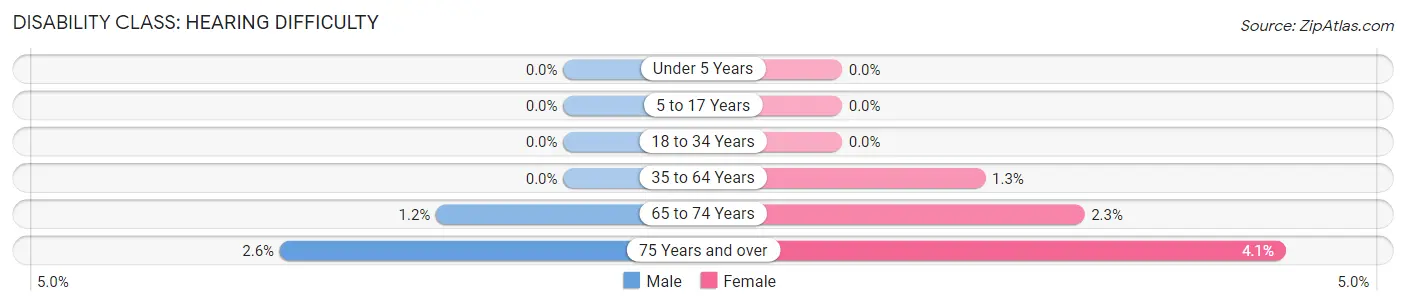
| Age Bracket | Male | Female |
| Under 5 Years | 0 (0.0%) | 0 (0.0%) |
| 5 to 17 Years | 0 (0.0%) | 0 (0.0%) |
| 18 to 34 Years | 0 (0.0%) | 0 (0.0%) |
| 35 to 64 Years | 0 (0.0%) | 7 (1.3%) |
| 65 to 74 Years | 3 (1.2%) | 5 (2.2%) |
| 75 Years and over | 2 (2.6%) | 4 (4.1%) |
Disability Class: Vision Difficulty
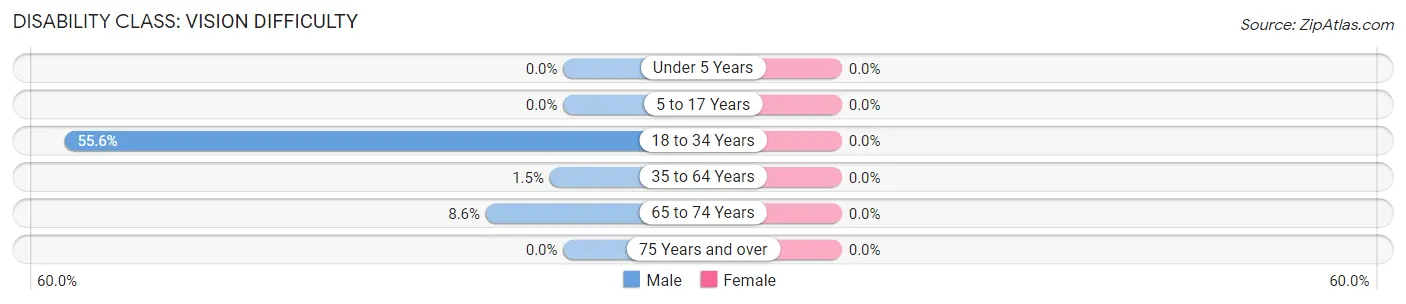
| Age Bracket | Male | Female |
| Under 5 Years | 0 (0.0%) | 0 (0.0%) |
| 5 to 17 Years | 0 (0.0%) | 0 (0.0%) |
| 18 to 34 Years | 5 (55.6%) | 0 (0.0%) |
| 35 to 64 Years | 5 (1.5%) | 0 (0.0%) |
| 65 to 74 Years | 22 (8.6%) | 0 (0.0%) |
| 75 Years and over | 0 (0.0%) | 0 (0.0%) |
Disability Class: Cognitive Difficulty
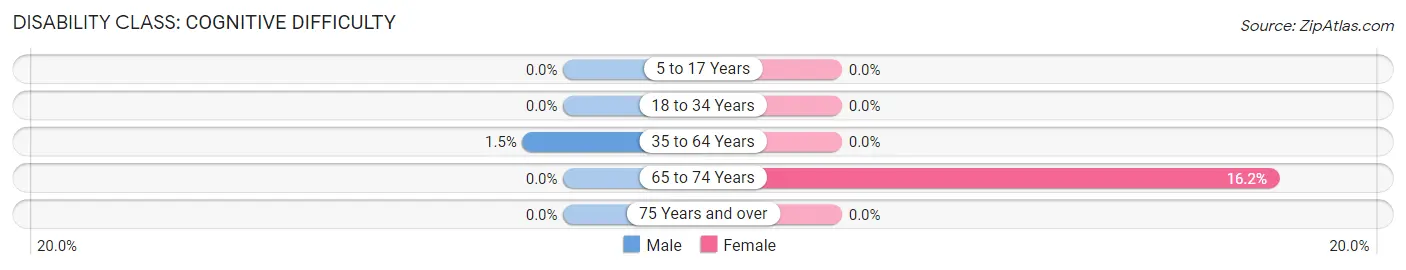
| Age Bracket | Male | Female |
| 5 to 17 Years | 0 (0.0%) | 0 (0.0%) |
| 18 to 34 Years | 0 (0.0%) | 0 (0.0%) |
| 35 to 64 Years | 5 (1.5%) | 0 (0.0%) |
| 65 to 74 Years | 0 (0.0%) | 36 (16.2%) |
| 75 Years and over | 0 (0.0%) | 0 (0.0%) |
Disability Class: Ambulatory Difficulty
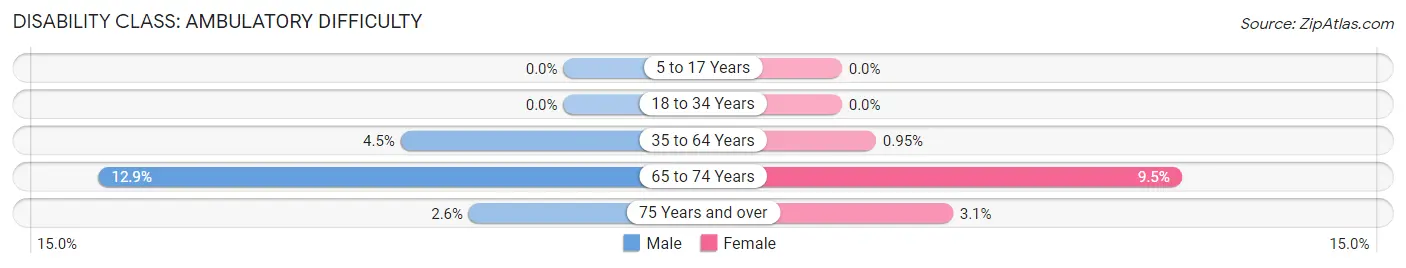
| Age Bracket | Male | Female |
| 5 to 17 Years | 0 (0.0%) | 0 (0.0%) |
| 18 to 34 Years | 0 (0.0%) | 0 (0.0%) |
| 35 to 64 Years | 15 (4.5%) | 5 (0.9%) |
| 65 to 74 Years | 33 (12.9%) | 21 (9.5%) |
| 75 Years and over | 2 (2.6%) | 3 (3.1%) |
Disability Class: Self-Care Difficulty
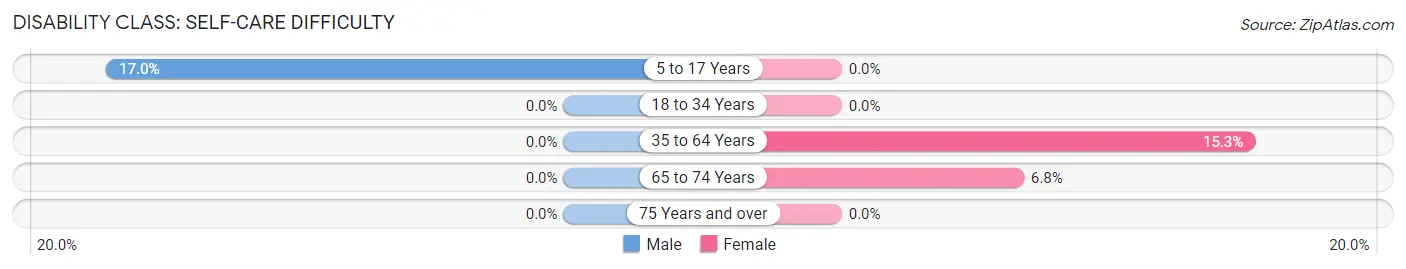
| Age Bracket | Male | Female |
| 5 to 17 Years | 28 (17.0%) | 0 (0.0%) |
| 18 to 34 Years | 0 (0.0%) | 0 (0.0%) |
| 35 to 64 Years | 0 (0.0%) | 81 (15.3%) |
| 65 to 74 Years | 0 (0.0%) | 15 (6.8%) |
| 75 Years and over | 0 (0.0%) | 0 (0.0%) |
Technology Access in Princeville
Computing Device Access in Princeville
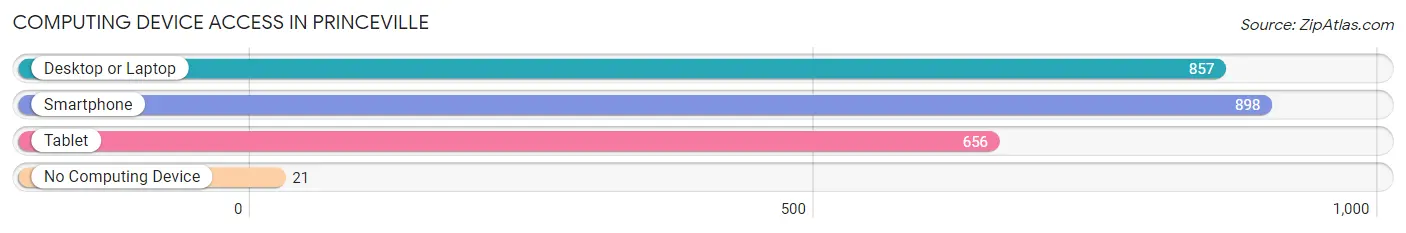
| Device Type | # Households | % Households |
| Desktop or Laptop | 857 | 92.4% |
| Smartphone | 898 | 96.9% |
| Tablet | 656 | 70.8% |
| No Computing Device | 21 | 2.3% |
| Total | 927 | 100.0% |
Internet Access in Princeville
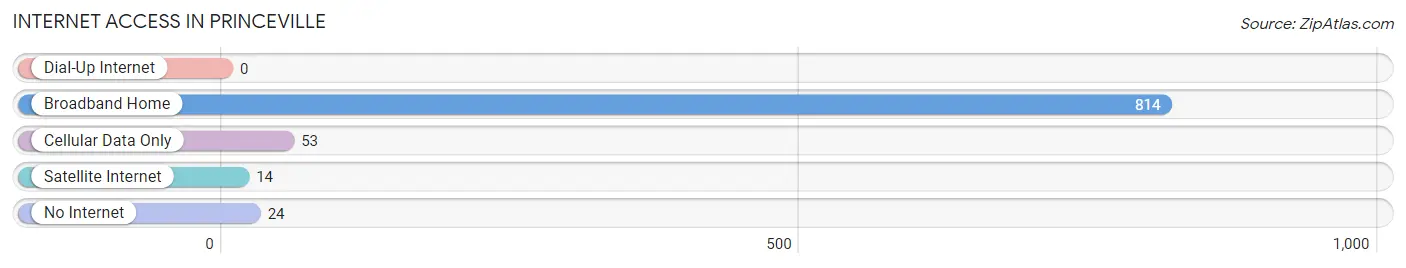
| Internet Type | # Households | % Households |
| Dial-Up Internet | 0 | 0.0% |
| Broadband Home | 814 | 87.8% |
| Cellular Data Only | 53 | 5.7% |
| Satellite Internet | 14 | 1.5% |
| No Internet | 24 | 2.6% |
| Total | 927 | 100.0% |
Princeville Summary
Princeville is a census-designated place (CDP) located on the north shore of the island of Kauai in Kauai County, Hawaii, United States. The population was 1,698 at the 2010 census. Princeville is the largest and oldest planned resort community in the state of Hawaii.
History
Princeville was founded in 1856 by Prince Albert Kamehameha, the son of King Kamehameha IV and Queen Emma. The area was originally known as Makaiwa, which means “by the sea” in Hawaiian. Prince Albert named the area Princeville in honor of his father.
Princeville was a small fishing village until the 1960s, when it was developed into a resort community. The Princeville Corporation was formed in 1965 to develop the area into a resort destination. The Princeville Corporation purchased the land from the Kamehameha family and began construction of the Princeville Resort, which opened in 1971.
The resort was a success and the area quickly grew. In the 1980s, the Princeville Corporation began to develop the area into a residential community. The Princeville Corporation sold the resort to the Princeville Resort Corporation in 1988.
Geography
Princeville is located on the north shore of the island of Kauai at 22°14′17″N 159°27′45″W (22.238, -159.4625). It is bordered to the east by the Hanalei River and to the west by the Pacific Ocean.
The CDP has a total area of 4.2 square miles (10.8 km2), of which 4.1 square miles (10.6 km2) is land and 0.1 square miles (0.2 km2) (2.37%) is water.
Economy
The economy of Princeville is largely based on tourism. The Princeville Resort is the largest employer in the area, providing jobs for over 1,000 people. Other businesses in the area include restaurants, retail stores, and other service-oriented businesses.
Princeville is also home to several golf courses, including the Prince Course at Princeville, the Makai Golf Club, and the Princeville Golf Course. These courses attract golfers from around the world and contribute to the local economy.
Demographics
As of the 2010 census, there were 1,698 people, 745 households, and 463 families residing in the CDP. The population density was 412.3 people per square mile (159.3/km2). There were 890 housing units at an average density of 217.3 per square mile (83.9/km2). The racial makeup of the CDP was 68.2% White, 0.6% African American, 0.4% Native American, 11.2% Asian, 0.1% Pacific Islander, 0.2% from other races, and 19.3% from two or more races. Hispanic or Latino of any race were 5.2% of the population.
There were 745 households, out of which 24.2% had children under the age of 18 living with them, 48.2% were married couples living together, 8.2% had a female householder with no husband present, and 39.2% were non-families. 32.2% of all households were made up of individuals, and 8.2% had someone living alone who was 65 years of age or older. The average household size was 2.27 and the average family size was 2.86.
In the CDP, the population was spread out, with 20.2% under the age of 18, 5.2% from 18 to 24, 24.2% from 25 to 44, 33.2% from 45 to 64, and 17.2% who were 65 years of age or older. The median age was 44 years. For every 100 females, there were 97.2 males. For every 100 females age 18 and over, there were 95.2 males.
The median income for a household in the CDP was $63,958, and the median income for a family was $76,250. Males had a median income of $51,250 versus $37,500 for females. The per capita income for the CDP was $37,958. About 4.2% of families and 6.2% of the population were below the poverty line, including 8.2% of those under age 18 and none of those age 65 or over.
Common Questions
What is Per Capita Income in Princeville?
Per Capita income in Princeville is $54,103.
What is the Median Family Income in Princeville?
Median Family Income in Princeville is $91,989.
What is the Median Household income in Princeville?
Median Household Income in Princeville is $82,250.
What is Income or Wage Gap in Princeville?
Income or Wage Gap in Princeville is 45.2%.
Women in Princeville earn 54.8 cents for every dollar earned by a man.
What is Family Income Deficit in Princeville?
Family Income Deficit in Princeville is $10,633.
Families that are below poverty line in Princeville earn $10,633 less on average than the poverty threshold level.
What is Inequality or Gini Index in Princeville?
Inequality or Gini Index in Princeville is 0.49.
What is the Total Population of Princeville?
Total Population of Princeville is 2,007.
What is the Total Male Population of Princeville?
Total Male Population of Princeville is 836.
What is the Total Female Population of Princeville?
Total Female Population of Princeville is 1,171.
What is the Ratio of Males per 100 Females in Princeville?
There are 71.39 Males per 100 Females in Princeville.
What is the Ratio of Females per 100 Males in Princeville?
There are 140.07 Females per 100 Males in Princeville.
What is the Median Population Age in Princeville?
Median Population Age in Princeville is 51.8 Years.
What is the Average Family Size in Princeville
Average Family Size in Princeville is 2.5 People.
What is the Average Household Size in Princeville
Average Household Size in Princeville is 2.2 People.
How Large is the Labor Force in Princeville?
There are 900 People in the Labor Forcein in Princeville.
What is the Percentage of People in the Labor Force in Princeville?
55.3% of People are in the Labor Force in Princeville.
What is the Unemployment Rate in Princeville?
Unemployment Rate in Princeville is 5.3%.