Wainaku, HI Map & Demographics
Wainaku Map
Wainaku Overview
$31,501
PER CAPITA INCOME
$75,857
AVG FAMILY INCOME
$62,880
AVG HOUSEHOLD INCOME
22.4%
WAGE / INCOME GAP [ % ]
77.6¢/ $1
WAGE / INCOME GAP [ $ ]
$11,910
FAMILY INCOME DEFICIT
0.44
INEQUALITY / GINI INDEX
1,023
TOTAL POPULATION
465
MALE POPULATION
558
FEMALE POPULATION
83.33
MALES / 100 FEMALES
120.00
FEMALES / 100 MALES
44.5
MEDIAN AGE
3.3
AVG FAMILY SIZE
2.7
AVG HOUSEHOLD SIZE
464
LABOR FORCE [ PEOPLE ]
57.0%
PERCENT IN LABOR FORCE
4.8%
UNEMPLOYMENT RATE
Income in Wainaku
Income Overview in Wainaku
Per Capita Income in Wainaku is $31,501, while median incomes of families and households are $75,857 and $62,880 respectively.
| Characteristic | Number | Measure |
| Per Capita Income | 1,023 | $31,501 |
| Median Family Income | 248 | $75,857 |
| Mean Family Income | 248 | $99,572 |
| Median Household Income | 371 | $62,880 |
| Mean Household Income | 371 | $83,687 |
| Income Deficit | 248 | $11,910 |
| Wage / Income Gap (%) | 1,023 | 22.36% |
| Wage / Income Gap ($) | 1,023 | 77.64¢ per $1 |
| Gini / Inequality Index | 1,023 | 0.44 |
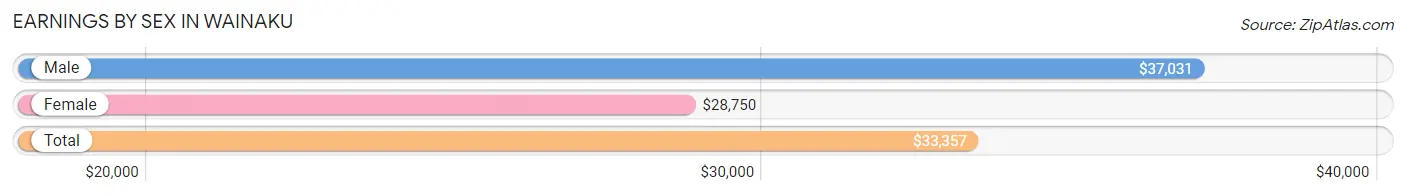
Earnings by Sex in Wainaku
Average Earnings in Wainaku are $33,357, $37,031 for men and $28,750 for women, a difference of 22.4%.
| Sex | Number | Average Earnings |
| Male | 223 (47.2%) | $37,031 |
| Female | 249 (52.7%) | $28,750 |
| Total | 472 (100.0%) | $33,357 |
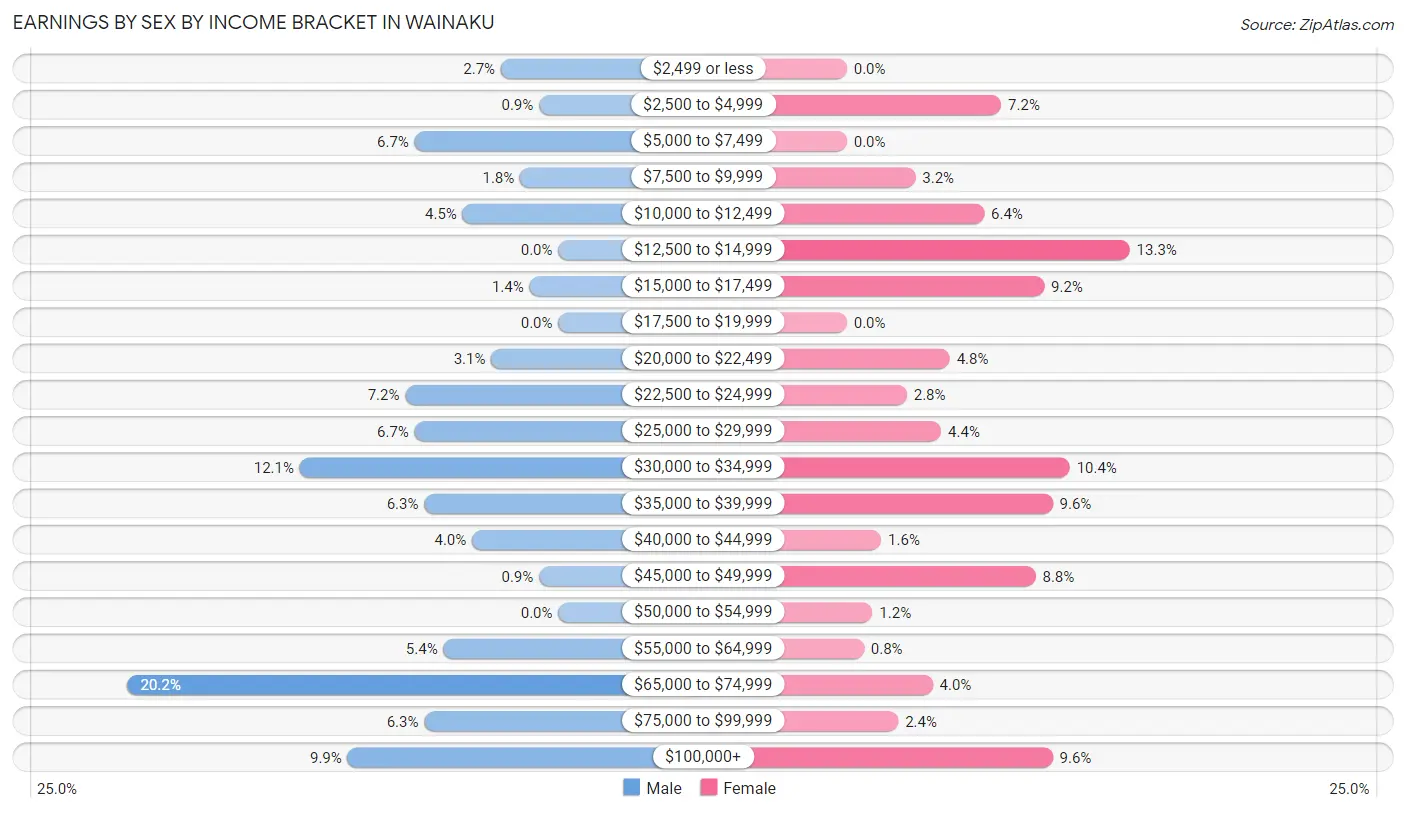
Earnings by Sex by Income Bracket in Wainaku
The most common earnings brackets in Wainaku are $65,000 to $74,999 for men (45 | 20.2%) and $12,500 to $14,999 for women (33 | 13.3%).
| Income | Male | Female |
| $2,499 or less | 6 (2.7%) | 0 (0.0%) |
| $2,500 to $4,999 | 2 (0.9%) | 18 (7.2%) |
| $5,000 to $7,499 | 15 (6.7%) | 0 (0.0%) |
| $7,500 to $9,999 | 4 (1.8%) | 8 (3.2%) |
| $10,000 to $12,499 | 10 (4.5%) | 16 (6.4%) |
| $12,500 to $14,999 | 0 (0.0%) | 33 (13.3%) |
| $15,000 to $17,499 | 3 (1.3%) | 23 (9.2%) |
| $17,500 to $19,999 | 0 (0.0%) | 0 (0.0%) |
| $20,000 to $22,499 | 7 (3.1%) | 12 (4.8%) |
| $22,500 to $24,999 | 16 (7.2%) | 7 (2.8%) |
| $25,000 to $29,999 | 15 (6.7%) | 11 (4.4%) |
| $30,000 to $34,999 | 27 (12.1%) | 26 (10.4%) |
| $35,000 to $39,999 | 14 (6.3%) | 24 (9.6%) |
| $40,000 to $44,999 | 9 (4.0%) | 4 (1.6%) |
| $45,000 to $49,999 | 2 (0.9%) | 22 (8.8%) |
| $50,000 to $54,999 | 0 (0.0%) | 3 (1.2%) |
| $55,000 to $64,999 | 12 (5.4%) | 2 (0.8%) |
| $65,000 to $74,999 | 45 (20.2%) | 10 (4.0%) |
| $75,000 to $99,999 | 14 (6.3%) | 6 (2.4%) |
| $100,000+ | 22 (9.9%) | 24 (9.6%) |
| Total | 223 (100.0%) | 249 (100.0%) |
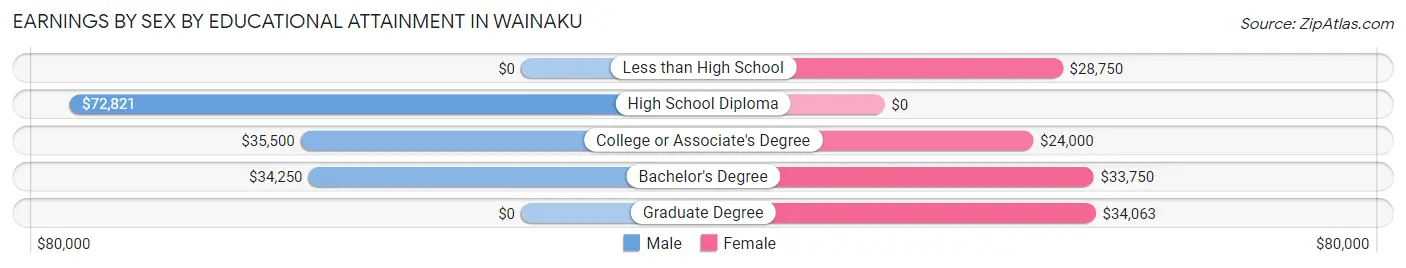
Earnings by Sex by Educational Attainment in Wainaku
Average earnings in Wainaku are $40,694 for men and $31,094 for women, a difference of 23.6%. Men with an educational attainment of high school diploma enjoy the highest average annual earnings of $72,821, while those with bachelor's degree education earn the least with $34,250. Women with an educational attainment of graduate degree earn the most with the average annual earnings of $34,063, while those with college or associate's degree education have the smallest earnings of $24,000.
| Educational Attainment | Male Income | Female Income |
| Less than High School | - | - |
| High School Diploma | $72,821 | $0 |
| College or Associate's Degree | $35,500 | $24,000 |
| Bachelor's Degree | $34,250 | $33,750 |
| Graduate Degree | - | - |
| Total | $40,694 | $31,094 |
Family Income in Wainaku
Family Income Brackets in Wainaku
According to the Wainaku family income data, there are 60 families falling into the $75,000 to $99,999 income range, which is the most common income bracket and makes up 24.2% of all families. Conversely, the $25,000 to $34,999 income bracket is the least frequent group with only 5 families (2.0%) belonging to this category.
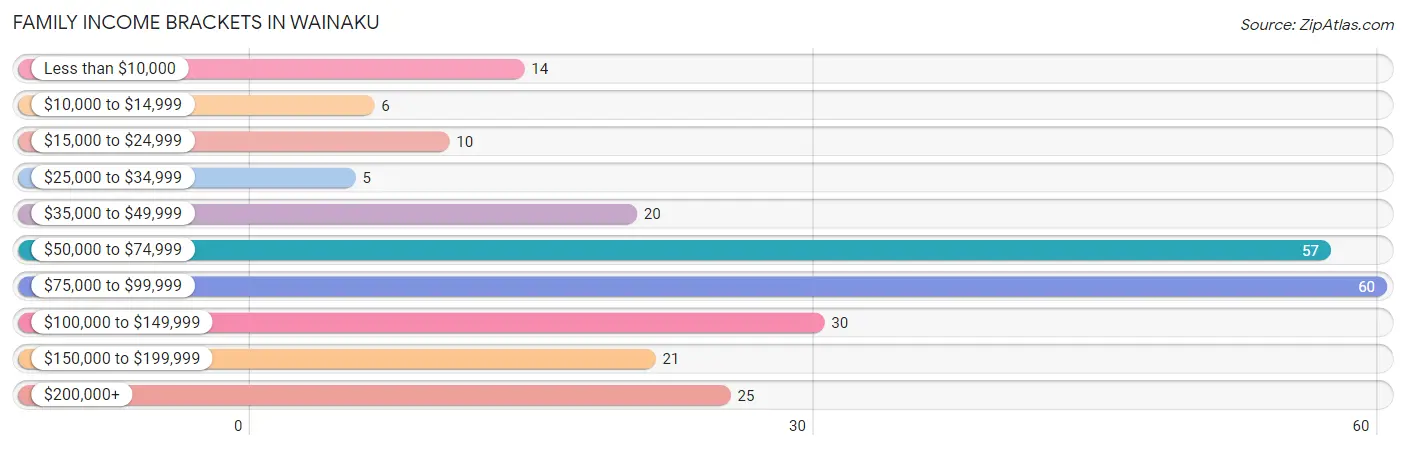
| Income Bracket | # Families | % Families |
| Less than $10,000 | 14 | 5.6% |
| $10,000 to $14,999 | 6 | 2.4% |
| $15,000 to $24,999 | 10 | 4.0% |
| $25,000 to $34,999 | 5 | 2.0% |
| $35,000 to $49,999 | 20 | 8.1% |
| $50,000 to $74,999 | 57 | 23.0% |
| $75,000 to $99,999 | 60 | 24.2% |
| $100,000 to $149,999 | 30 | 12.1% |
| $150,000 to $199,999 | 21 | 8.5% |
| $200,000+ | 25 | 10.1% |
Family Income by Famaliy Size in Wainaku
7+ person families (11 | 4.4%) account for the highest median family income in Wainaku with $250,001 per family, while 7+ person families (11 | 4.4%) have the highest median income of $35,714 per family member.
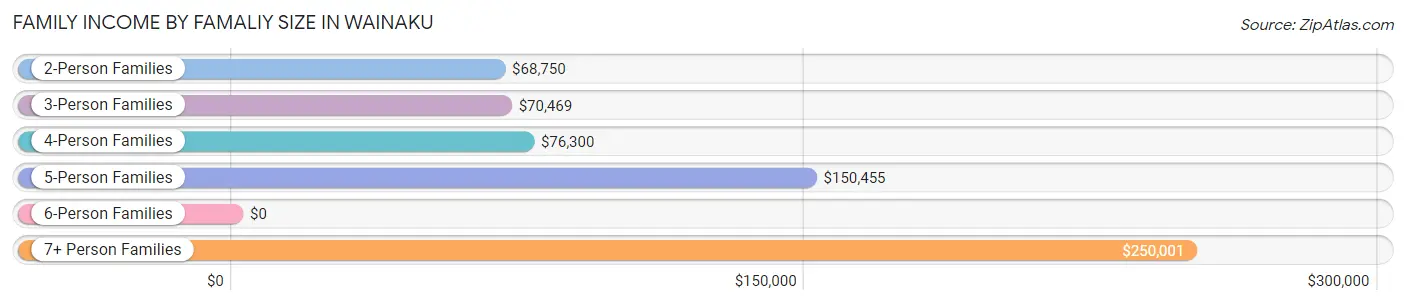
| Income Bracket | # Families | Median Income |
| 2-Person Families | 115 (46.4%) | $68,750 |
| 3-Person Families | 63 (25.4%) | $70,469 |
| 4-Person Families | 34 (13.7%) | $76,300 |
| 5-Person Families | 18 (7.3%) | $150,455 |
| 6-Person Families | 7 (2.8%) | $0 |
| 7+ Person Families | 11 (4.4%) | $250,001 |
| Total | 248 (100.0%) | $75,857 |
Family Income by Number of Earners in Wainaku
The median family income in Wainaku is $75,857, with families comprising 3+ earners (27) having the highest median family income of $133,125, while families with no earners (38) have the lowest median family income of $62,833, accounting for 10.9% and 15.3% of families, respectively.
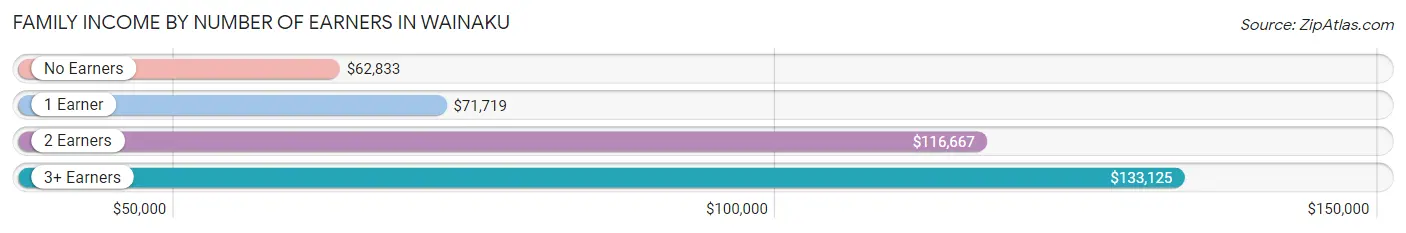
| Number of Earners | # Families | Median Income |
| No Earners | 38 (15.3%) | $62,833 |
| 1 Earner | 101 (40.7%) | $71,719 |
| 2 Earners | 82 (33.1%) | $116,667 |
| 3+ Earners | 27 (10.9%) | $133,125 |
| Total | 248 (100.0%) | $75,857 |
Household Income in Wainaku
Household Income Brackets in Wainaku
With 75 households falling in the category, the $50,000 to $74,999 income range is the most frequent in Wainaku, accounting for 20.2% of all households. In contrast, only 10 households (2.7%) fall into the $10,000 to $14,999 income bracket, making it the least populous group.
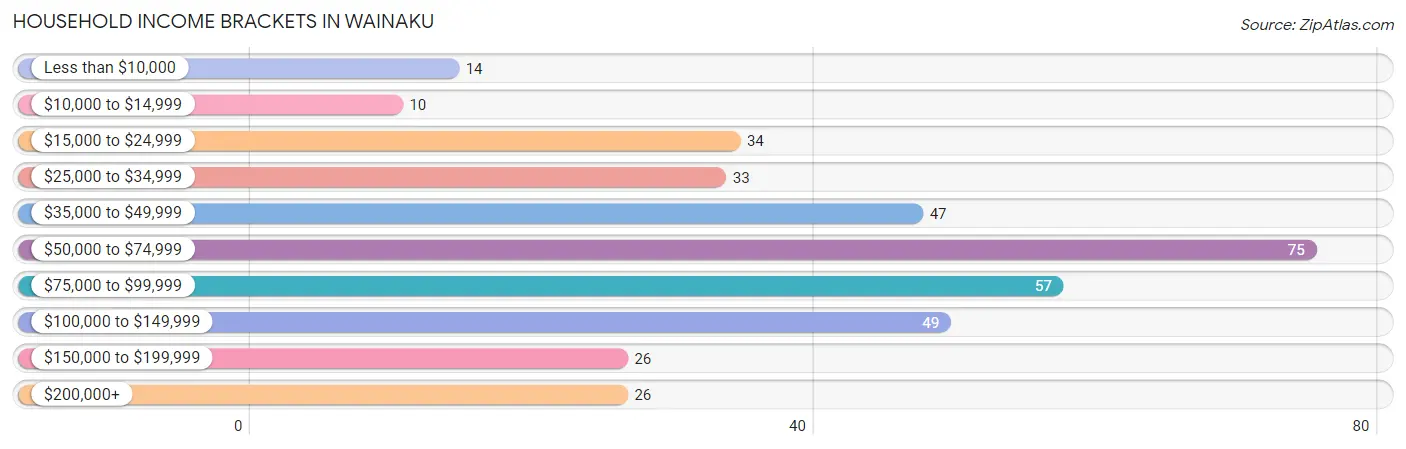
| Income Bracket | # Households | % Households |
| Less than $10,000 | 14 | 3.8% |
| $10,000 to $14,999 | 10 | 2.7% |
| $15,000 to $24,999 | 34 | 9.2% |
| $25,000 to $34,999 | 33 | 8.9% |
| $35,000 to $49,999 | 47 | 12.7% |
| $50,000 to $74,999 | 75 | 20.2% |
| $75,000 to $99,999 | 57 | 15.4% |
| $100,000 to $149,999 | 49 | 13.2% |
| $150,000 to $199,999 | 26 | 7.0% |
| $200,000+ | 26 | 7.0% |
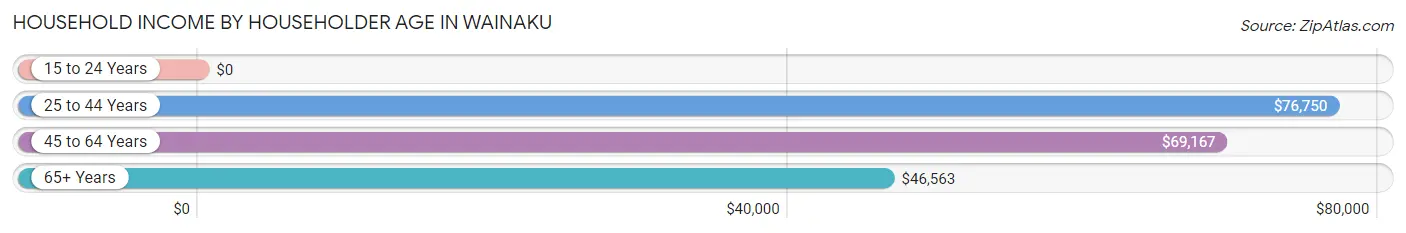
Household Income by Householder Age in Wainaku
The median household income in Wainaku is $62,880, with the highest median household income of $76,750 found in the 25 to 44 years age bracket for the primary householder. A total of 107 households (28.8%) fall into this category.
| Income Bracket | # Households | Median Income |
| 15 to 24 Years | 0 (0.0%) | $0 |
| 25 to 44 Years | 107 (28.8%) | $76,750 |
| 45 to 64 Years | 112 (30.2%) | $69,167 |
| 65+ Years | 152 (41.0%) | $46,563 |
| Total | 371 (100.0%) | $62,880 |
Poverty in Wainaku
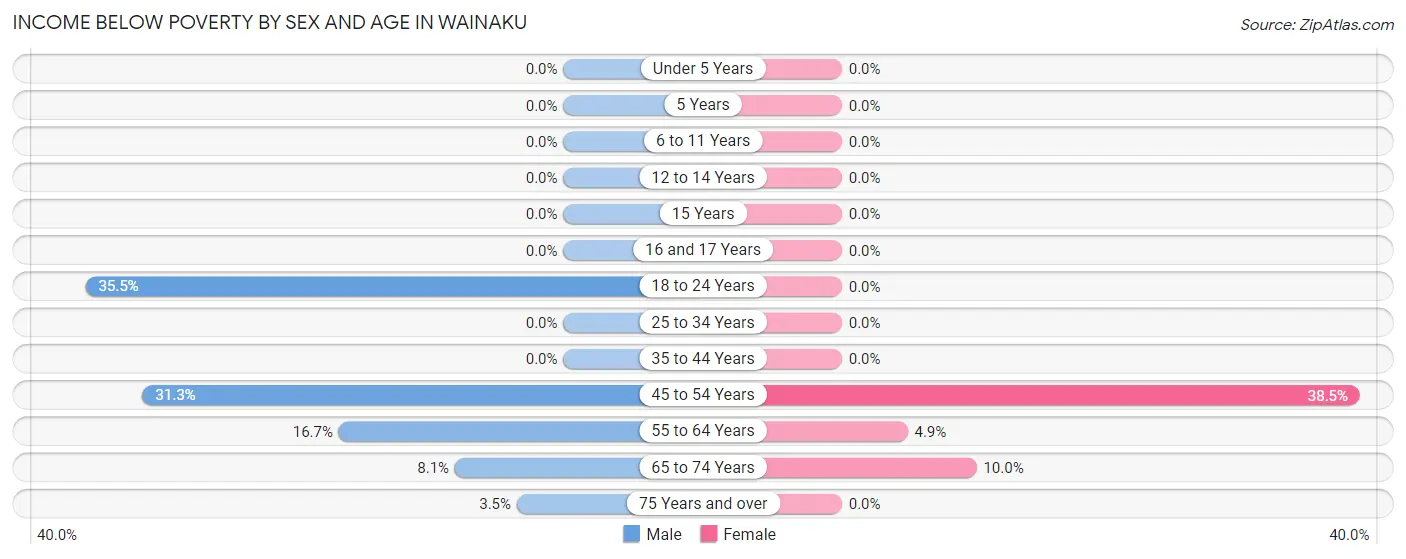
Income Below Poverty by Sex and Age in Wainaku
With 9.9% poverty level for males and 5.6% for females among the residents of Wainaku, 18 to 24 year old males and 45 to 54 year old females are the most vulnerable to poverty, with 11 males (35.5%) and 20 females (38.5%) in their respective age groups living below the poverty level.
| Age Bracket | Male | Female |
| Under 5 Years | 0 (0.0%) | 0 (0.0%) |
| 5 Years | 0 (0.0%) | 0 (0.0%) |
| 6 to 11 Years | 0 (0.0%) | 0 (0.0%) |
| 12 to 14 Years | 0 (0.0%) | 0 (0.0%) |
| 15 Years | 0 (0.0%) | 0 (0.0%) |
| 16 and 17 Years | 0 (0.0%) | 0 (0.0%) |
| 18 to 24 Years | 11 (35.5%) | 0 (0.0%) |
| 25 to 34 Years | 0 (0.0%) | 0 (0.0%) |
| 35 to 44 Years | 0 (0.0%) | 0 (0.0%) |
| 45 to 54 Years | 15 (31.2%) | 20 (38.5%) |
| 55 to 64 Years | 12 (16.7%) | 4 (4.9%) |
| 65 to 74 Years | 7 (8.1%) | 7 (10.0%) |
| 75 Years and over | 1 (3.5%) | 0 (0.0%) |
| Total | 46 (9.9%) | 31 (5.6%) |
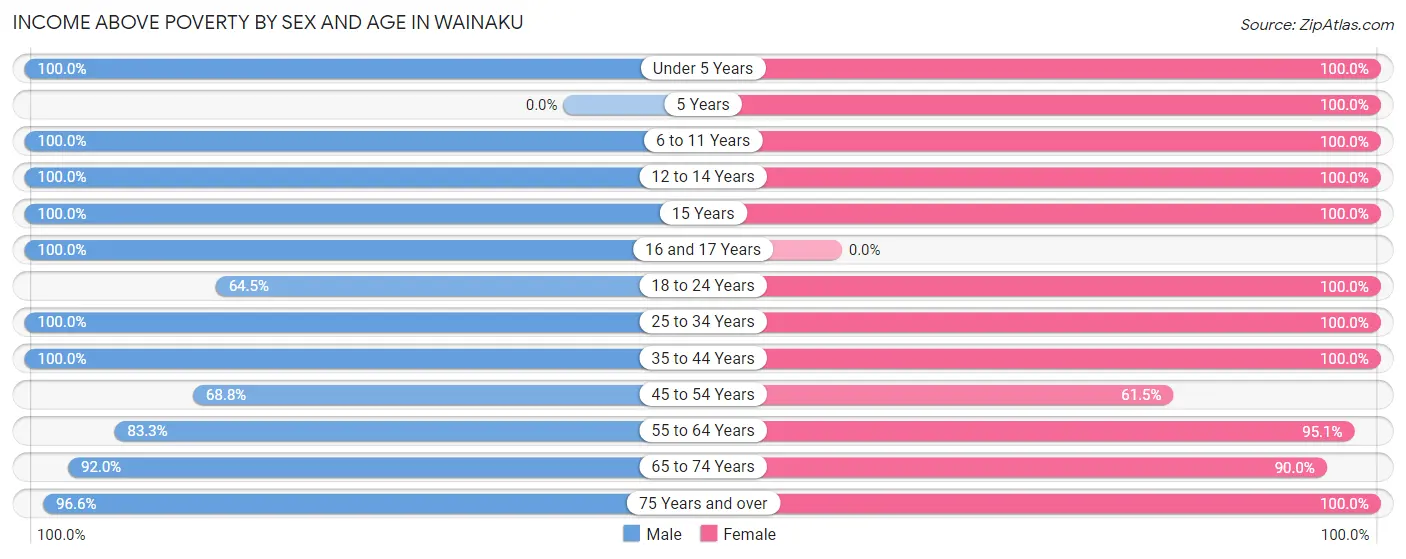
Income Above Poverty by Sex and Age in Wainaku
According to the poverty statistics in Wainaku, males aged under 5 years and females aged under 5 years are the age groups that are most secure financially, with 100.0% of males and 100.0% of females in these age groups living above the poverty line.
| Age Bracket | Male | Female |
| Under 5 Years | 22 (100.0%) | 21 (100.0%) |
| 5 Years | 0 (0.0%) | 3 (100.0%) |
| 6 to 11 Years | 40 (100.0%) | 63 (100.0%) |
| 12 to 14 Years | 6 (100.0%) | 49 (100.0%) |
| 15 Years | 2 (100.0%) | 3 (100.0%) |
| 16 and 17 Years | 4 (100.0%) | 0 (0.0%) |
| 18 to 24 Years | 20 (64.5%) | 20 (100.0%) |
| 25 to 34 Years | 45 (100.0%) | 67 (100.0%) |
| 35 to 44 Years | 79 (100.0%) | 67 (100.0%) |
| 45 to 54 Years | 33 (68.8%) | 32 (61.5%) |
| 55 to 64 Years | 60 (83.3%) | 78 (95.1%) |
| 65 to 74 Years | 80 (91.9%) | 63 (90.0%) |
| 75 Years and over | 28 (96.6%) | 61 (100.0%) |
| Total | 419 (90.1%) | 527 (94.4%) |
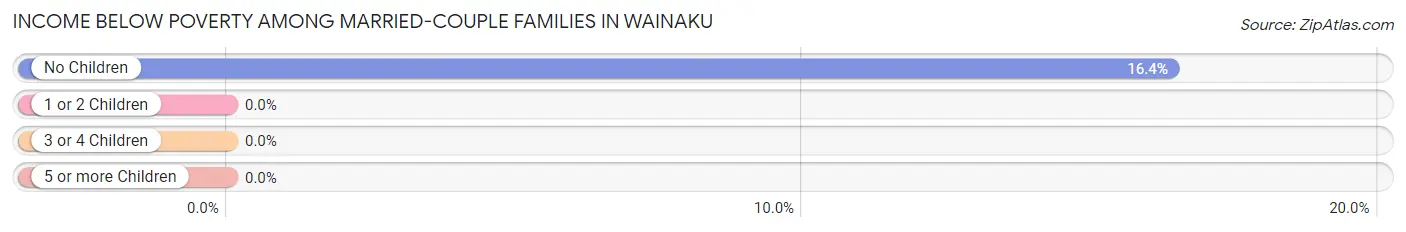
Income Below Poverty Among Married-Couple Families in Wainaku
The poverty statistics for married-couple families in Wainaku show that 10.9% or 20 of the total 183 families live below the poverty line. Families with no children have the highest poverty rate of 16.4%, comprising of 20 families. On the other hand, families with 1 or 2 children have the lowest poverty rate of 0.0%, which includes 0 families.
| Children | Above Poverty | Below Poverty |
| No Children | 102 (83.6%) | 20 (16.4%) |
| 1 or 2 Children | 61 (100.0%) | 0 (0.0%) |
| 3 or 4 Children | 0 (0.0%) | 0 (0.0%) |
| 5 or more Children | 0 (0.0%) | 0 (0.0%) |
| Total | 163 (89.1%) | 20 (10.9%) |
Income Below Poverty Among Single-Parent Households in Wainaku
| Children | Single Father | Single Mother |
| No Children | 0 (0.0%) | 0 (0.0%) |
| 1 or 2 Children | 0 (0.0%) | 0 (0.0%) |
| 3 or 4 Children | 0 (0.0%) | 0 (0.0%) |
| 5 or more Children | 0 (0.0%) | 0 (0.0%) |
| Total | 0 (0.0%) | 0 (0.0%) |
Income Below Poverty Among Married-Couple vs Single-Parent Households in Wainaku
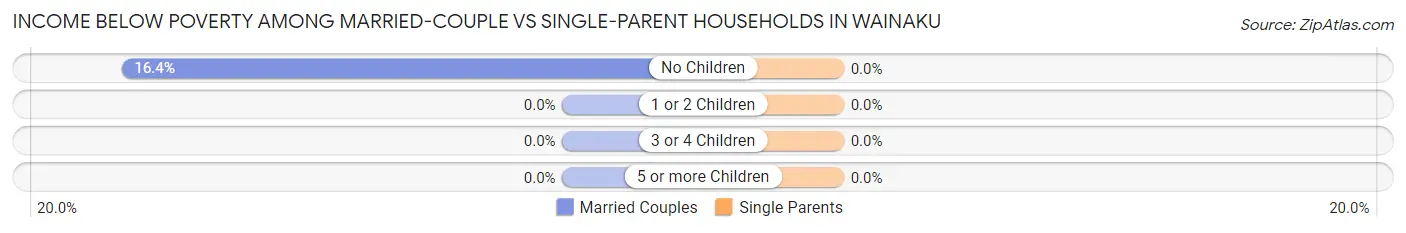
| Children | Married-Couple Families | Single-Parent Households |
| No Children | 20 (16.4%) | 0 (0.0%) |
| 1 or 2 Children | 0 (0.0%) | 0 (0.0%) |
| 3 or 4 Children | 0 (0.0%) | 0 (0.0%) |
| 5 or more Children | 0 (0.0%) | 0 (0.0%) |
| Total | 20 (10.9%) | 0 (0.0%) |
Race in Wainaku
The most populous races in Wainaku are Two or more Races (402 | 39.3%), Asian (328 | 32.1%), and White / Caucasian (242 | 23.7%).
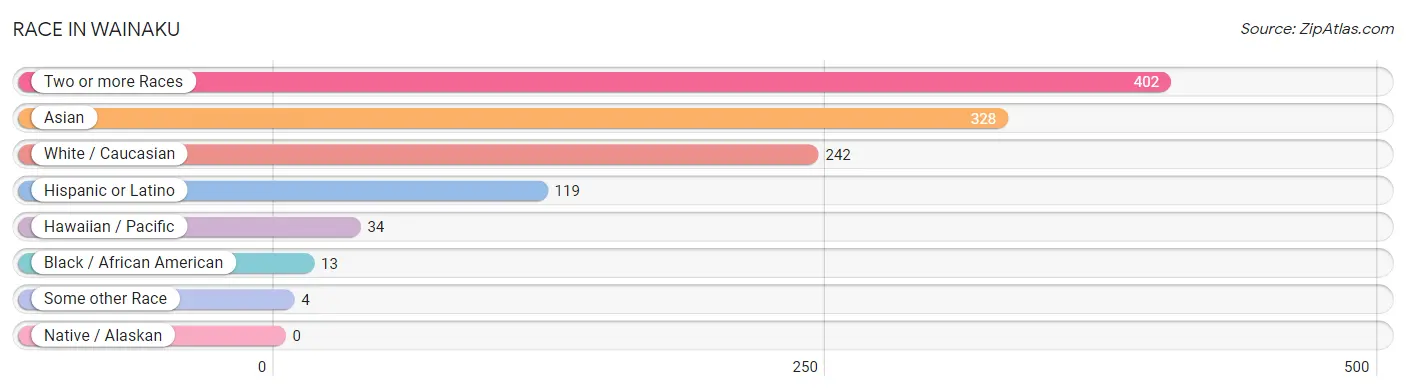
| Race | # Population | % Population |
| Asian | 328 | 32.1% |
| Black / African American | 13 | 1.3% |
| Hawaiian / Pacific | 34 | 3.3% |
| Hispanic or Latino | 119 | 11.6% |
| Native / Alaskan | 0 | 0.0% |
| White / Caucasian | 242 | 23.7% |
| Two or more Races | 402 | 39.3% |
| Some other Race | 4 | 0.4% |
| Total | 1,023 | 100.0% |
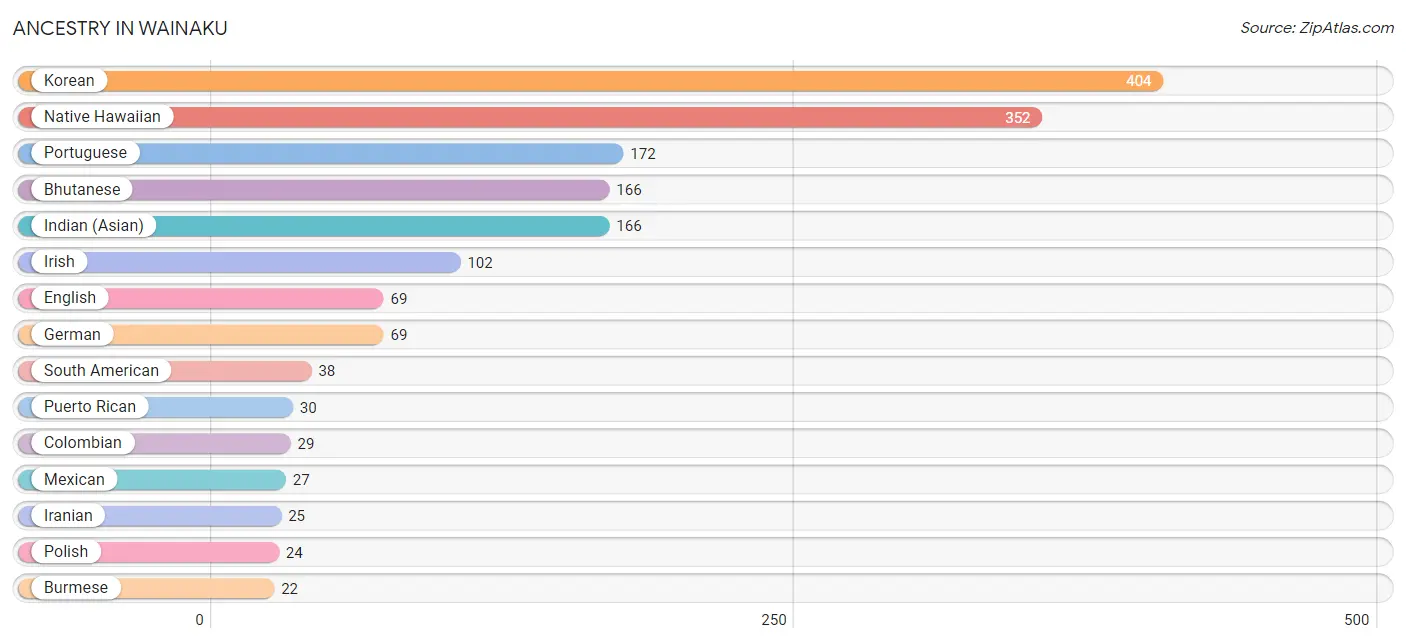
Ancestry in Wainaku
The most populous ancestries reported in Wainaku are Korean (404 | 39.5%), Native Hawaiian (352 | 34.4%), Portuguese (172 | 16.8%), Bhutanese (166 | 16.2%), and Indian (Asian) (166 | 16.2%), together accounting for 123.2% of all Wainaku residents.
| Ancestry | # Population | % Population |
| American | 3 | 0.3% |
| Argentinean | 3 | 0.3% |
| Bhutanese | 166 | 16.2% |
| Burmese | 22 | 2.1% |
| Cherokee | 10 | 1.0% |
| Choctaw | 1 | 0.1% |
| Colombian | 29 | 2.8% |
| Cuban | 3 | 0.3% |
| Czechoslovakian | 3 | 0.3% |
| English | 69 | 6.7% |
| French | 10 | 1.0% |
| German | 69 | 6.7% |
| Indian (Asian) | 166 | 16.2% |
| Iranian | 25 | 2.4% |
| Irish | 102 | 10.0% |
| Italian | 3 | 0.3% |
| Korean | 404 | 39.5% |
| Mexican | 27 | 2.6% |
| Native Hawaiian | 352 | 34.4% |
| Peruvian | 6 | 0.6% |
| Polish | 24 | 2.4% |
| Portuguese | 172 | 16.8% |
| Puerto Rican | 30 | 2.9% |
| Scandinavian | 4 | 0.4% |
| Scotch-Irish | 10 | 1.0% |
| Scottish | 13 | 1.3% |
| South American | 38 | 3.7% |
| Spaniard | 5 | 0.5% |
| Spanish | 11 | 1.1% |
| Sri Lankan | 8 | 0.8% | View All 30 Rows |
Immigrants in Wainaku
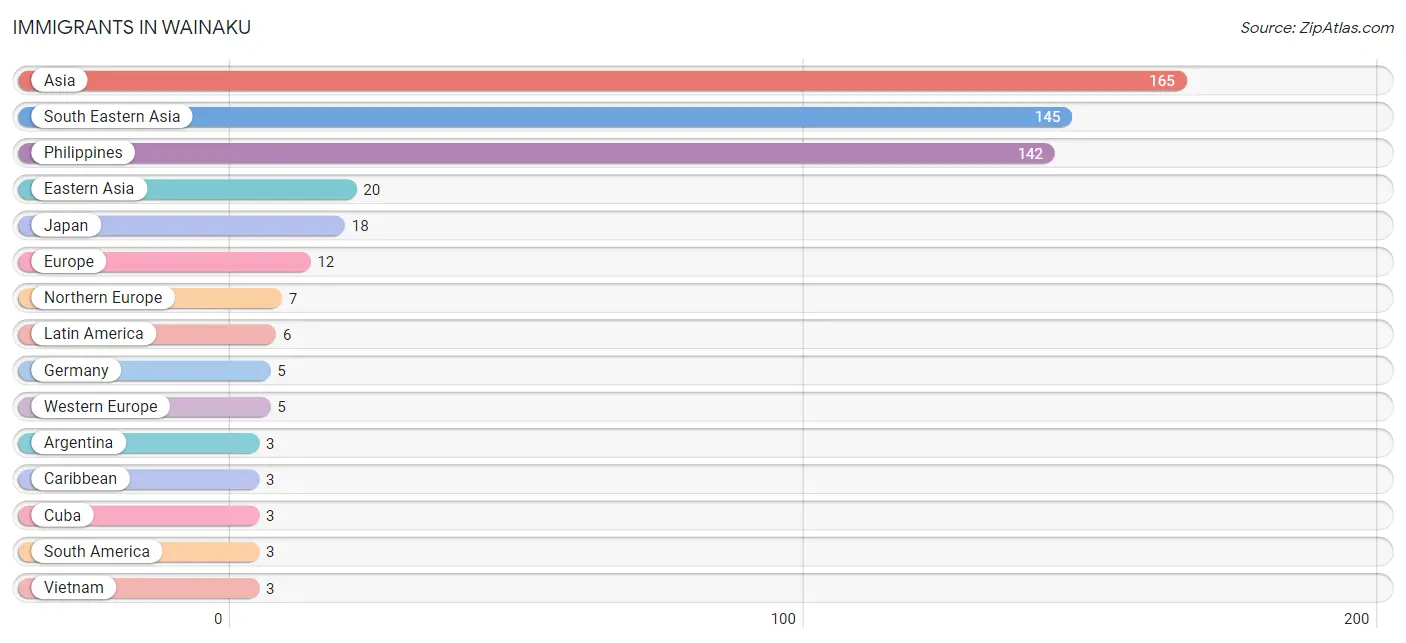
The most numerous immigrant groups reported in Wainaku came from Asia (165 | 16.1%), South Eastern Asia (145 | 14.2%), Philippines (142 | 13.9%), Eastern Asia (20 | 2.0%), and Japan (18 | 1.8%), together accounting for 47.9% of all Wainaku residents.
| Immigration Origin | # Population | % Population |
| Argentina | 3 | 0.3% |
| Asia | 165 | 16.1% |
| Caribbean | 3 | 0.3% |
| China | 2 | 0.2% |
| Cuba | 3 | 0.3% |
| Eastern Asia | 20 | 2.0% |
| Europe | 12 | 1.2% |
| Germany | 5 | 0.5% |
| Japan | 18 | 1.8% |
| Latin America | 6 | 0.6% |
| Northern Europe | 7 | 0.7% |
| Philippines | 142 | 13.9% |
| South America | 3 | 0.3% |
| South Eastern Asia | 145 | 14.2% |
| Vietnam | 3 | 0.3% |
| Western Europe | 5 | 0.5% | View All 16 Rows |
Sex and Age in Wainaku
Sex and Age in Wainaku
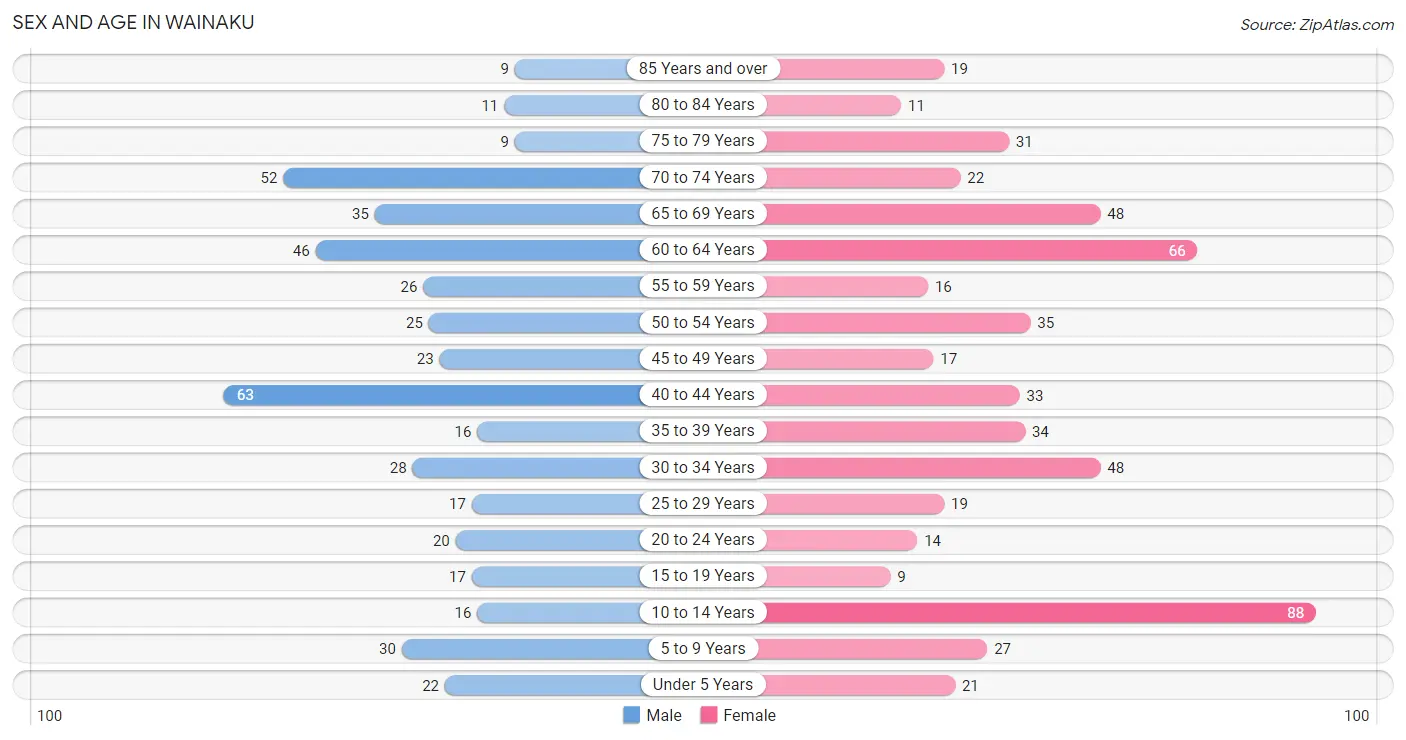
The most populous age groups in Wainaku are 40 to 44 Years (63 | 13.6%) for men and 10 to 14 Years (88 | 15.8%) for women.
| Age Bracket | Male | Female |
| Under 5 Years | 22 (4.7%) | 21 (3.8%) |
| 5 to 9 Years | 30 (6.5%) | 27 (4.8%) |
| 10 to 14 Years | 16 (3.4%) | 88 (15.8%) |
| 15 to 19 Years | 17 (3.7%) | 9 (1.6%) |
| 20 to 24 Years | 20 (4.3%) | 14 (2.5%) |
| 25 to 29 Years | 17 (3.7%) | 19 (3.4%) |
| 30 to 34 Years | 28 (6.0%) | 48 (8.6%) |
| 35 to 39 Years | 16 (3.4%) | 34 (6.1%) |
| 40 to 44 Years | 63 (13.6%) | 33 (5.9%) |
| 45 to 49 Years | 23 (5.0%) | 17 (3.0%) |
| 50 to 54 Years | 25 (5.4%) | 35 (6.3%) |
| 55 to 59 Years | 26 (5.6%) | 16 (2.9%) |
| 60 to 64 Years | 46 (9.9%) | 66 (11.8%) |
| 65 to 69 Years | 35 (7.5%) | 48 (8.6%) |
| 70 to 74 Years | 52 (11.2%) | 22 (3.9%) |
| 75 to 79 Years | 9 (1.9%) | 31 (5.6%) |
| 80 to 84 Years | 11 (2.4%) | 11 (2.0%) |
| 85 Years and over | 9 (1.9%) | 19 (3.4%) |
| Total | 465 (100.0%) | 558 (100.0%) |
Families and Households in Wainaku
Median Family Size in Wainaku
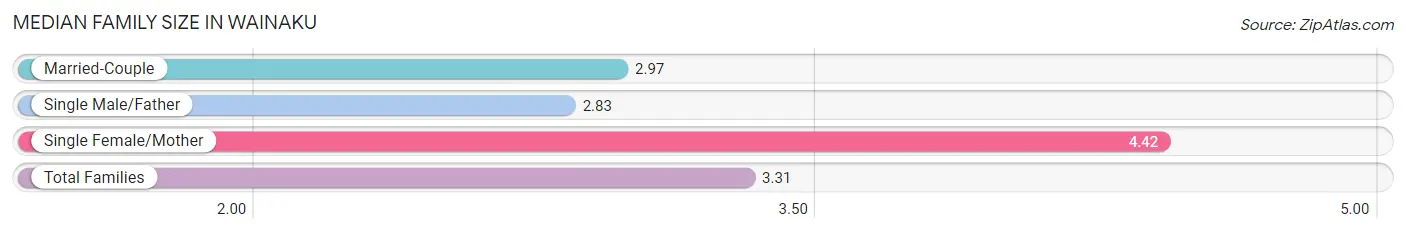
The median family size in Wainaku is 3.31 persons per family, with single female/mother families (59 | 23.8%) accounting for the largest median family size of 4.42 persons per family. On the other hand, single male/father families (6 | 2.4%) represent the smallest median family size with 2.83 persons per family.
| Family Type | # Families | Family Size |
| Married-Couple | 183 (73.8%) | 2.97 |
| Single Male/Father | 6 (2.4%) | 2.83 |
| Single Female/Mother | 59 (23.8%) | 4.42 |
| Total Families | 248 (100.0%) | 3.31 |
Median Household Size in Wainaku
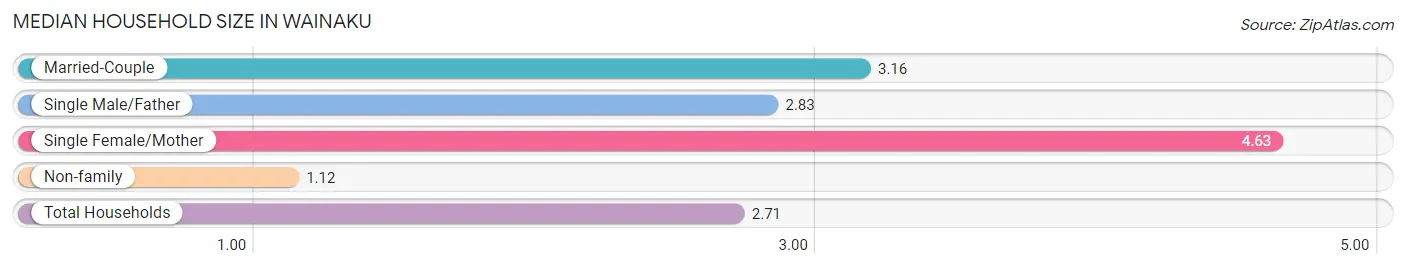
The median household size in Wainaku is 2.71 persons per household, with single female/mother households (59 | 15.9%) accounting for the largest median household size of 4.63 persons per household. non-family households (123 | 33.2%) represent the smallest median household size with 1.12 persons per household.
| Household Type | # Households | Household Size |
| Married-Couple | 183 (49.3%) | 3.16 |
| Single Male/Father | 6 (1.6%) | 2.83 |
| Single Female/Mother | 59 (15.9%) | 4.63 |
| Non-family | 123 (33.2%) | 1.12 |
| Total Households | 371 (100.0%) | 2.71 |
Household Size by Marriage Status in Wainaku
Out of a total of 371 households in Wainaku, 248 (66.8%) are family households, while 123 (33.2%) are nonfamily households. The most numerous type of family households are 2-person households, comprising 106, and the most common type of nonfamily households are 1-person households, comprising 110.
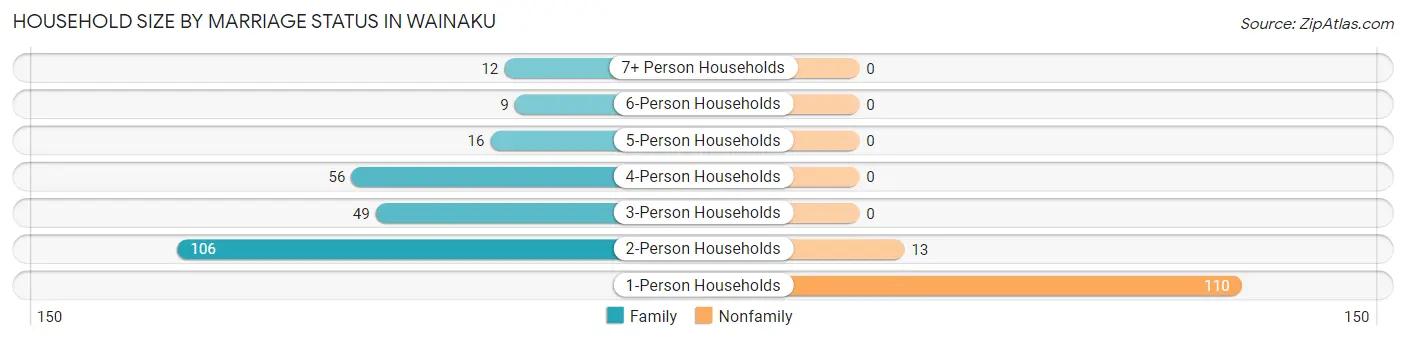
| Household Size | Family Households | Nonfamily Households |
| 1-Person Households | - | 110 (29.6%) |
| 2-Person Households | 106 (28.6%) | 13 (3.5%) |
| 3-Person Households | 49 (13.2%) | 0 (0.0%) |
| 4-Person Households | 56 (15.1%) | 0 (0.0%) |
| 5-Person Households | 16 (4.3%) | 0 (0.0%) |
| 6-Person Households | 9 (2.4%) | 0 (0.0%) |
| 7+ Person Households | 12 (3.2%) | 0 (0.0%) |
| Total | 248 (66.8%) | 123 (33.2%) |
Female Fertility in Wainaku
Fertility by Age in Wainaku
Average fertility rate in Wainaku is 16.0 births per 1,000 women. Women in the age bracket of 35 to 50 years have the highest fertility rate with 31.0 births per 1,000 women. Women in the age bracket of 35 to 50 years acount for 100.0% of all women with births.
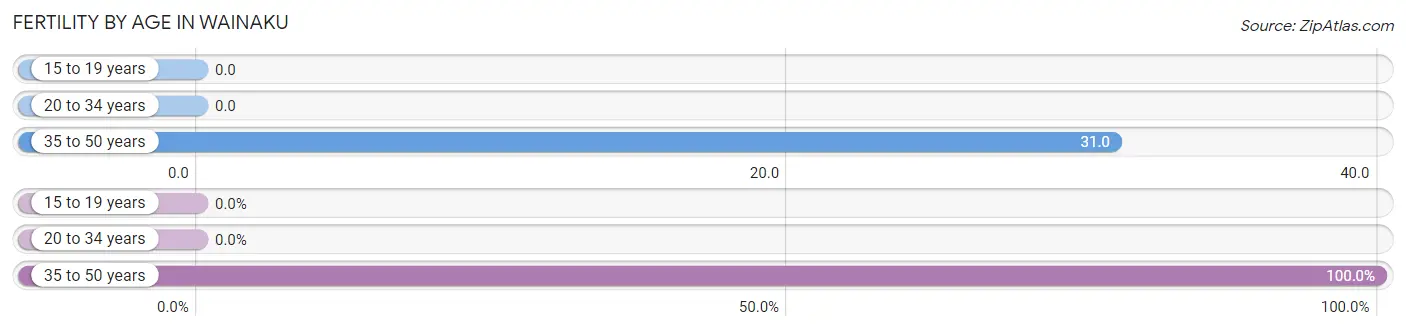
| Age Bracket | Women with Births | Births / 1,000 Women |
| 15 to 19 years | 0 (0.0%) | 0.0 |
| 20 to 34 years | 0 (0.0%) | 0.0 |
| 35 to 50 years | 3 (100.0%) | 31.0 |
| Total | 3 (100.0%) | 16.0 |
Fertility by Age by Marriage Status in Wainaku
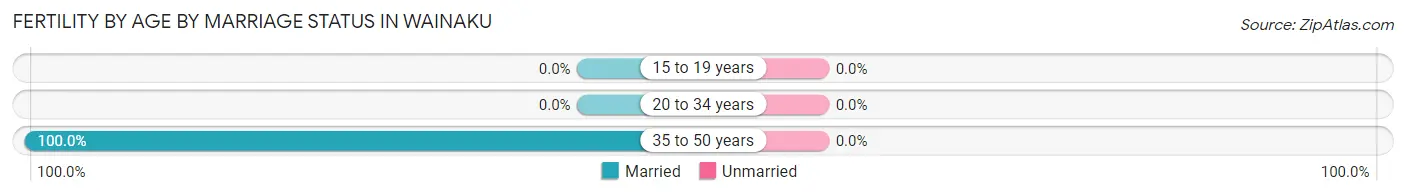
| Age Bracket | Married | Unmarried |
| 15 to 19 years | 0 (0.0%) | 0 (0.0%) |
| 20 to 34 years | 0 (0.0%) | 0 (0.0%) |
| 35 to 50 years | 3 (100.0%) | 0 (0.0%) |
| Total | 3 (100.0%) | 0 (0.0%) |
Fertility by Education in Wainaku
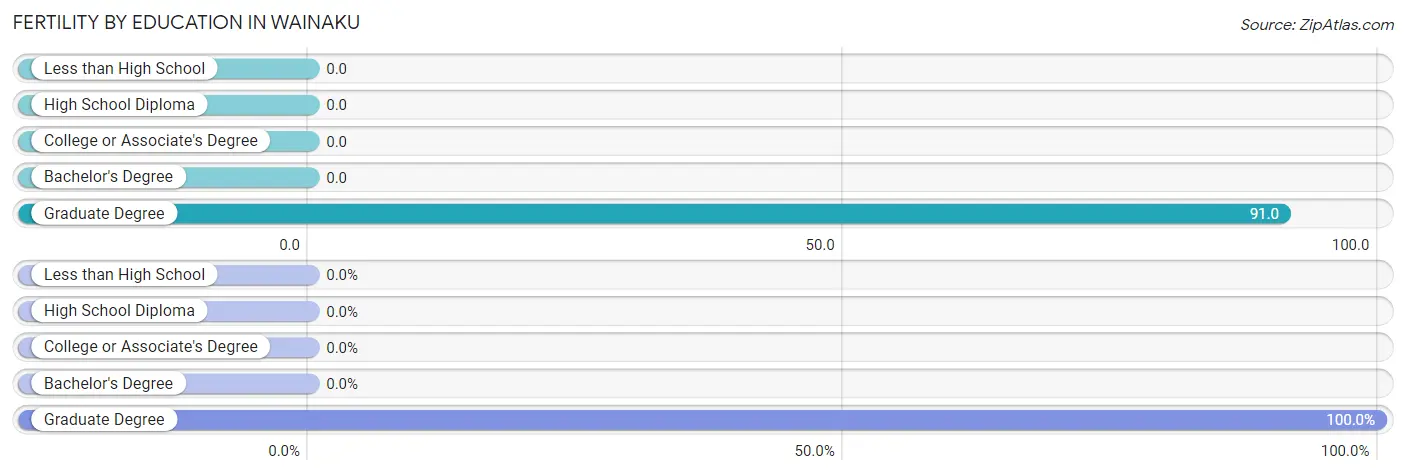
| Educational Attainment | Women with Births | Births / 1,000 Women |
| Less than High School | 0 (0.0%) | 0.0 |
| High School Diploma | 0 (0.0%) | 0.0 |
| College or Associate's Degree | 0 (0.0%) | 0.0 |
| Bachelor's Degree | 0 (0.0%) | 0.0 |
| Graduate Degree | 3 (100.0%) | 91.0 |
| Total | 3 (100.0%) | 16.0 |
Fertility by Education by Marriage Status in Wainaku
| Educational Attainment | Married | Unmarried |
| Less than High School | 0 (0.0%) | 0 (0.0%) |
| High School Diploma | 0 (0.0%) | 0 (0.0%) |
| College or Associate's Degree | 0 (0.0%) | 0 (0.0%) |
| Bachelor's Degree | 0 (0.0%) | 0 (0.0%) |
| Graduate Degree | 3 (100.0%) | 0 (0.0%) |
| Total | 3 (100.0%) | 0 (0.0%) |
Employment Characteristics in Wainaku
Employment by Class of Employer in Wainaku
Among the 437 employed individuals in Wainaku, private company employees (204 | 46.7%), self-employed (not incorporated) (76 | 17.4%), and state government employees (47 | 10.8%) make up the most common classes of employment.
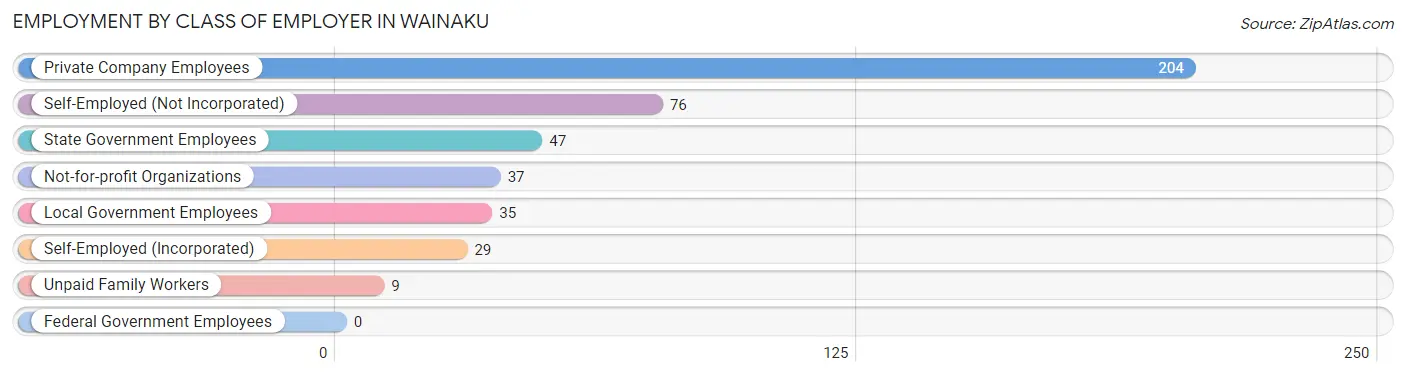
| Employer Class | # Employees | % Employees |
| Private Company Employees | 204 | 46.7% |
| Self-Employed (Incorporated) | 29 | 6.6% |
| Self-Employed (Not Incorporated) | 76 | 17.4% |
| Not-for-profit Organizations | 37 | 8.5% |
| Local Government Employees | 35 | 8.0% |
| State Government Employees | 47 | 10.8% |
| Federal Government Employees | 0 | 0.0% |
| Unpaid Family Workers | 9 | 2.1% |
| Total | 437 | 100.0% |
Employment Status by Age in Wainaku
According to the labor force statistics for Wainaku, out of the total population over 16 years of age (814), 57.0% or 464 individuals are in the labor force, with 4.8% or 22 of them unemployed. The age group with the highest labor force participation rate is 20 to 24 years, with 100.0% or 34 individuals in the labor force. Within the labor force, the 16 to 19 years age range has the highest percentage of unemployed individuals, with 100.0% or 6 of them being unemployed.
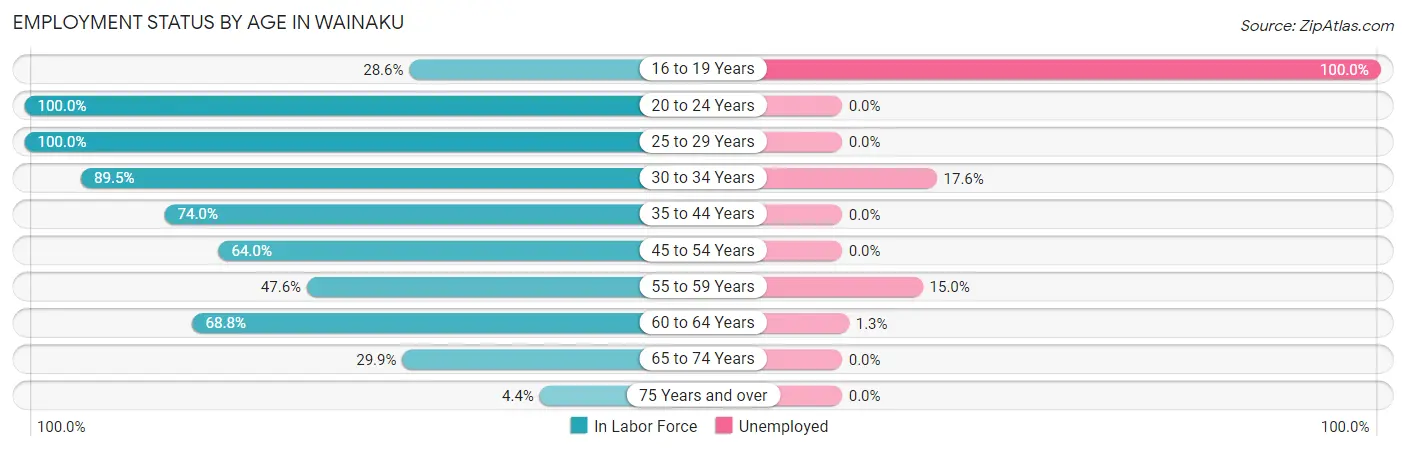
| Age Bracket | In Labor Force | Unemployed |
| 16 to 19 Years | 6 (28.6%) | 6 (100.0%) |
| 20 to 24 Years | 34 (100.0%) | 0 (0.0%) |
| 25 to 29 Years | 36 (100.0%) | 0 (0.0%) |
| 30 to 34 Years | 68 (89.5%) | 12 (17.6%) |
| 35 to 44 Years | 108 (74.0%) | 0 (0.0%) |
| 45 to 54 Years | 64 (64.0%) | 0 (0.0%) |
| 55 to 59 Years | 20 (47.6%) | 3 (15.0%) |
| 60 to 64 Years | 77 (68.8%) | 1 (1.3%) |
| 65 to 74 Years | 47 (29.9%) | 0 (0.0%) |
| 75 Years and over | 4 (4.4%) | 0 (0.0%) |
| Total | 464 (57.0%) | 22 (4.8%) |
Employment Status by Educational Attainment in Wainaku
According to labor force statistics for Wainaku, 72.9% of individuals (373) out of the total population between 25 and 64 years of age (512) are in the labor force, with 4.3% or 16 of them being unemployed. The group with the highest labor force participation rate are those with the educational attainment of bachelor's degree or higher, with 89.3% or 151 individuals in the labor force. Within the labor force, individuals with bachelor's degree or higher education have the highest percentage of unemployment, with 8.1% or 12 of them being unemployed.
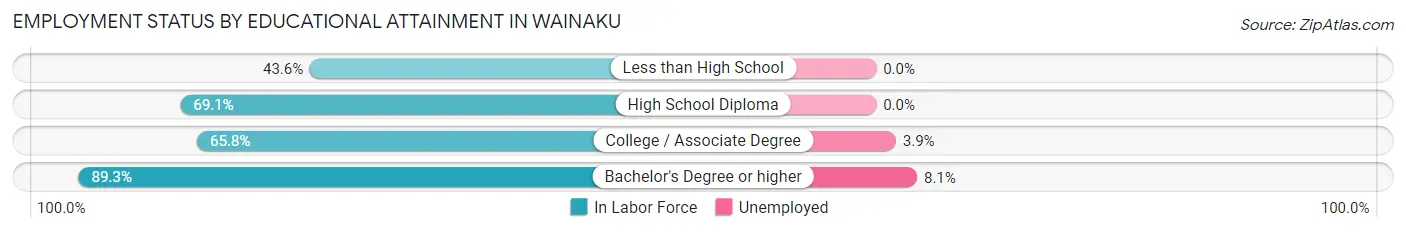
| Educational Attainment | In Labor Force | Unemployed |
| Less than High School | 17 (43.6%) | 0 (0.0%) |
| High School Diploma | 103 (69.1%) | 0 (0.0%) |
| College / Associate Degree | 102 (65.8%) | 6 (3.9%) |
| Bachelor's Degree or higher | 151 (89.3%) | 14 (8.1%) |
| Total | 373 (72.9%) | 22 (4.3%) |
Employment Occupations by Sex in Wainaku
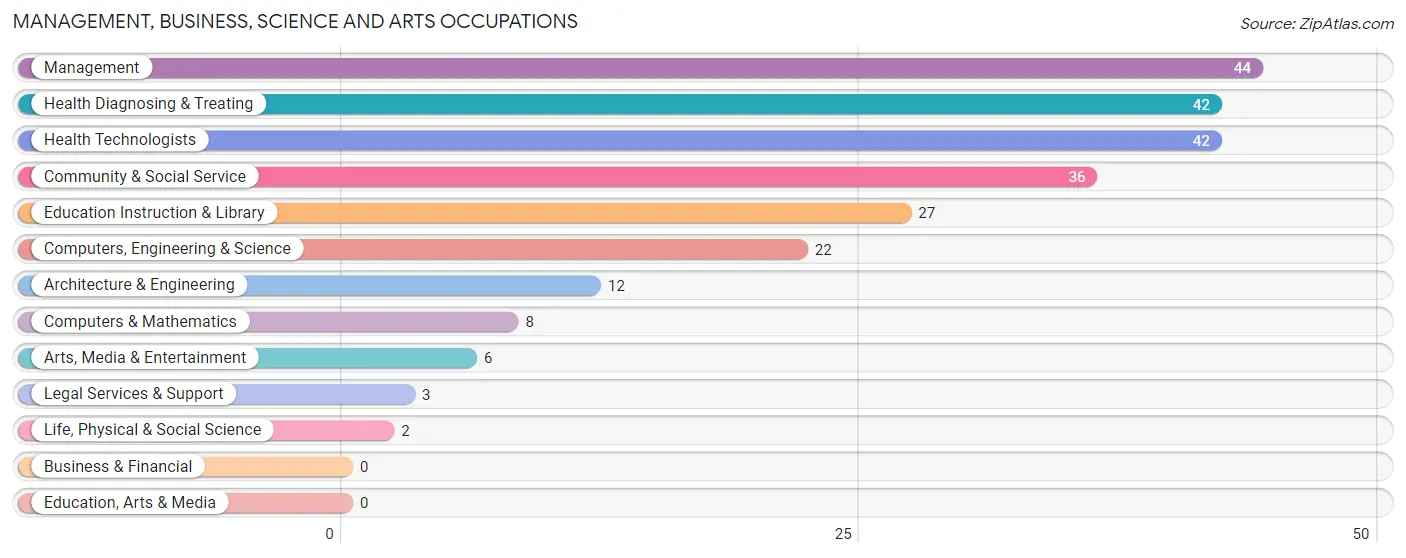
Management, Business, Science and Arts Occupations
The most common Management, Business, Science and Arts occupations in Wainaku are Management (44 | 10.0%), Health Diagnosing & Treating (42 | 9.6%), Health Technologists (42 | 9.6%), Community & Social Service (36 | 8.2%), and Education Instruction & Library (27 | 6.1%).
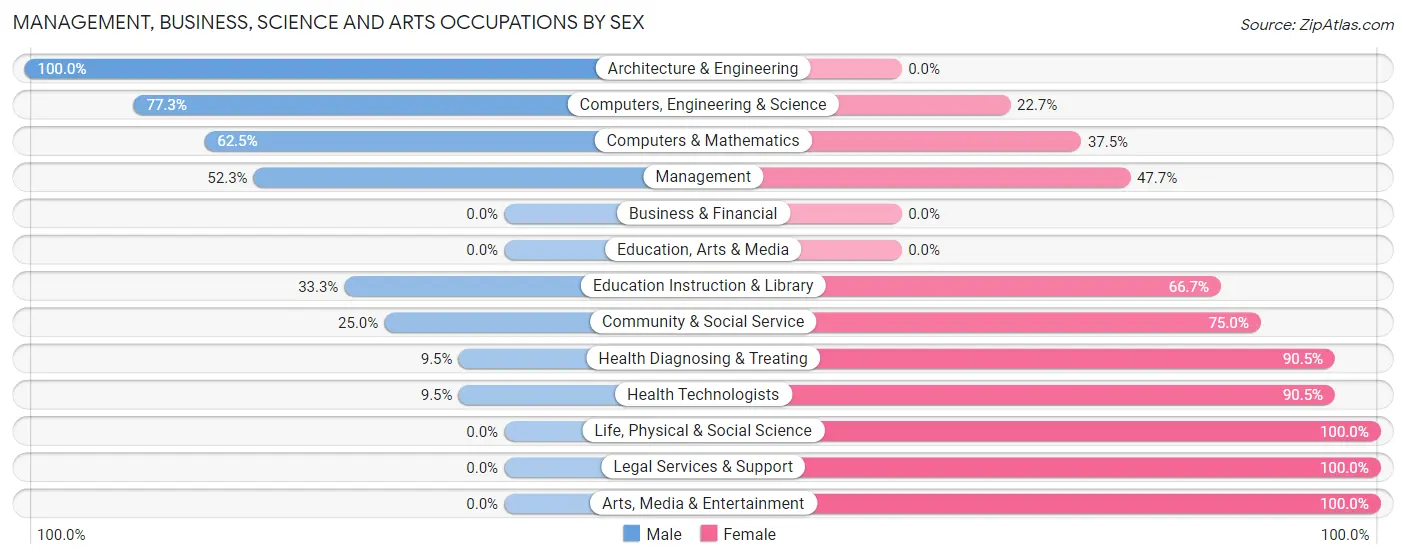
Management, Business, Science and Arts Occupations by Sex
Within the Management, Business, Science and Arts occupations in Wainaku, the most male-oriented occupations are Architecture & Engineering (100.0%), Computers, Engineering & Science (77.3%), and Computers & Mathematics (62.5%), while the most female-oriented occupations are Life, Physical & Social Science (100.0%), Legal Services & Support (100.0%), and Arts, Media & Entertainment (100.0%).
| Occupation | Male | Female |
| Management | 23 (52.3%) | 21 (47.7%) |
| Business & Financial | 0 (0.0%) | 0 (0.0%) |
| Computers, Engineering & Science | 17 (77.3%) | 5 (22.7%) |
| Computers & Mathematics | 5 (62.5%) | 3 (37.5%) |
| Architecture & Engineering | 12 (100.0%) | 0 (0.0%) |
| Life, Physical & Social Science | 0 (0.0%) | 2 (100.0%) |
| Community & Social Service | 9 (25.0%) | 27 (75.0%) |
| Education, Arts & Media | 0 (0.0%) | 0 (0.0%) |
| Legal Services & Support | 0 (0.0%) | 3 (100.0%) |
| Education Instruction & Library | 9 (33.3%) | 18 (66.7%) |
| Arts, Media & Entertainment | 0 (0.0%) | 6 (100.0%) |
| Health Diagnosing & Treating | 4 (9.5%) | 38 (90.5%) |
| Health Technologists | 4 (9.5%) | 38 (90.5%) |
| Total (Category) | 53 (36.8%) | 91 (63.2%) |
| Total (Overall) | 218 (49.7%) | 221 (50.3%) |
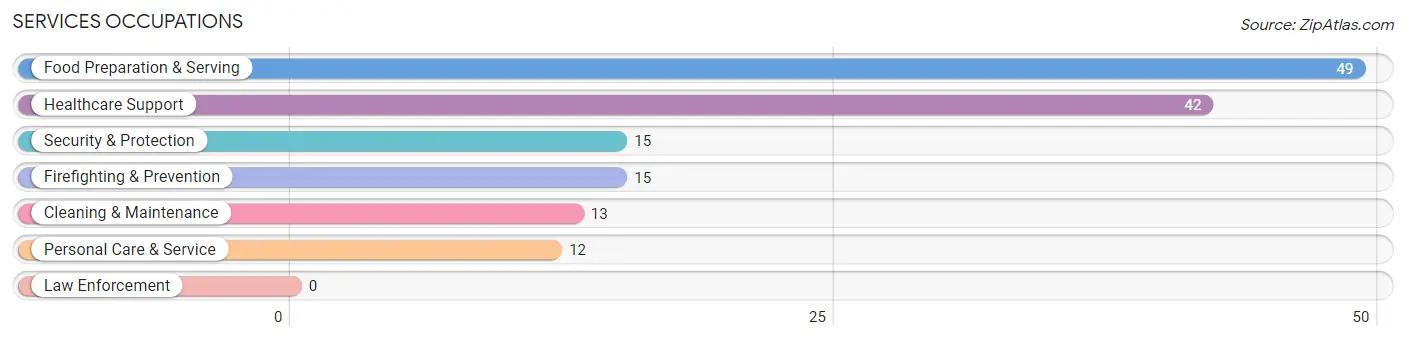
Services Occupations
The most common Services occupations in Wainaku are Food Preparation & Serving (49 | 11.2%), Healthcare Support (42 | 9.6%), Security & Protection (15 | 3.4%), Firefighting & Prevention (15 | 3.4%), and Cleaning & Maintenance (13 | 3.0%).
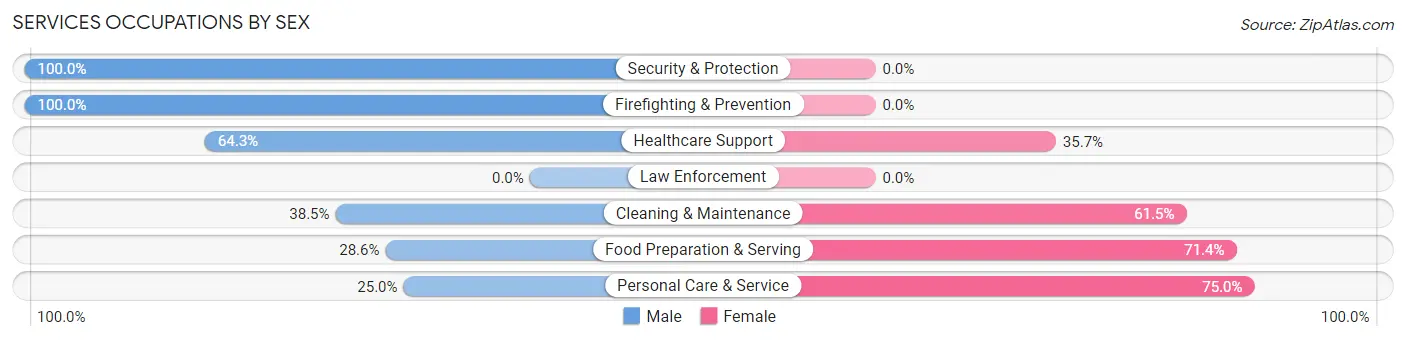
Services Occupations by Sex
Within the Services occupations in Wainaku, the most male-oriented occupations are Security & Protection (100.0%), Firefighting & Prevention (100.0%), and Healthcare Support (64.3%), while the most female-oriented occupations are Personal Care & Service (75.0%), Food Preparation & Serving (71.4%), and Cleaning & Maintenance (61.5%).
| Occupation | Male | Female |
| Healthcare Support | 27 (64.3%) | 15 (35.7%) |
| Security & Protection | 15 (100.0%) | 0 (0.0%) |
| Firefighting & Prevention | 15 (100.0%) | 0 (0.0%) |
| Law Enforcement | 0 (0.0%) | 0 (0.0%) |
| Food Preparation & Serving | 14 (28.6%) | 35 (71.4%) |
| Cleaning & Maintenance | 5 (38.5%) | 8 (61.5%) |
| Personal Care & Service | 3 (25.0%) | 9 (75.0%) |
| Total (Category) | 64 (48.8%) | 67 (51.1%) |
| Total (Overall) | 218 (49.7%) | 221 (50.3%) |
Sales and Office Occupations
The most common Sales and Office occupations in Wainaku are Office & Administration (42 | 9.6%), and Sales & Related (36 | 8.2%).
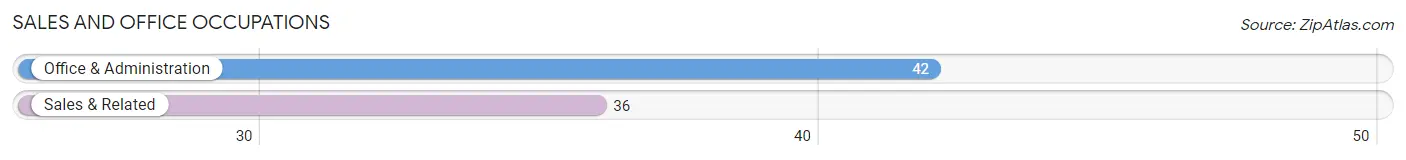
Sales and Office Occupations by Sex
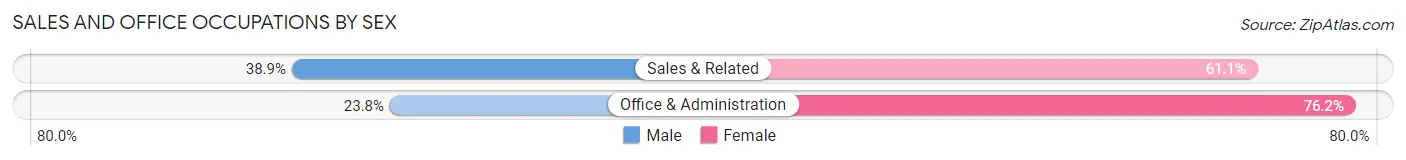
| Occupation | Male | Female |
| Sales & Related | 14 (38.9%) | 22 (61.1%) |
| Office & Administration | 10 (23.8%) | 32 (76.2%) |
| Total (Category) | 24 (30.8%) | 54 (69.2%) |
| Total (Overall) | 218 (49.7%) | 221 (50.3%) |
Natural Resources, Construction and Maintenance Occupations
The most common Natural Resources, Construction and Maintenance occupations in Wainaku are Installation, Maintenance & Repair (47 | 10.7%), Construction & Extraction (6 | 1.4%), and Farming, Fishing & Forestry (2 | 0.5%).
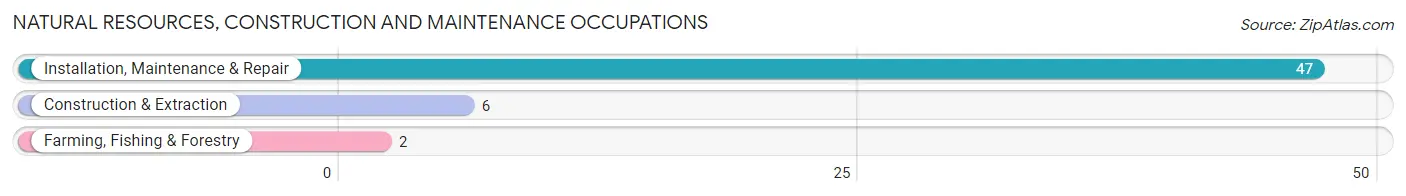
Natural Resources, Construction and Maintenance Occupations by Sex
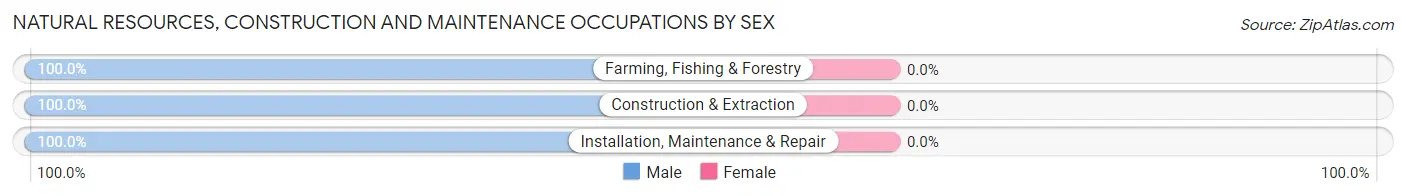
| Occupation | Male | Female |
| Farming, Fishing & Forestry | 2 (100.0%) | 0 (0.0%) |
| Construction & Extraction | 6 (100.0%) | 0 (0.0%) |
| Installation, Maintenance & Repair | 47 (100.0%) | 0 (0.0%) |
| Total (Category) | 55 (100.0%) | 0 (0.0%) |
| Total (Overall) | 218 (49.7%) | 221 (50.3%) |
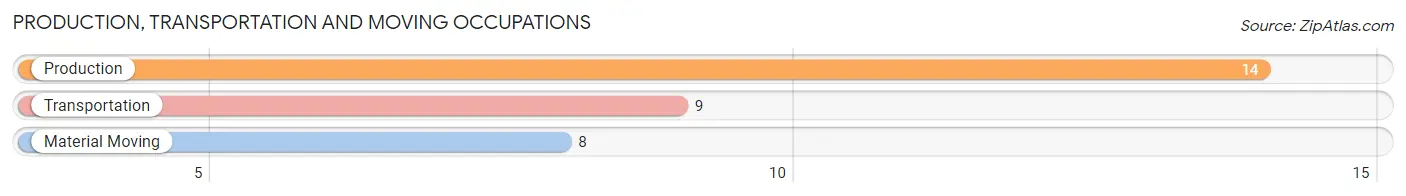
Production, Transportation and Moving Occupations
The most common Production, Transportation and Moving occupations in Wainaku are Production (14 | 3.2%), Transportation (9 | 2.1%), and Material Moving (8 | 1.8%).
Production, Transportation and Moving Occupations by Sex
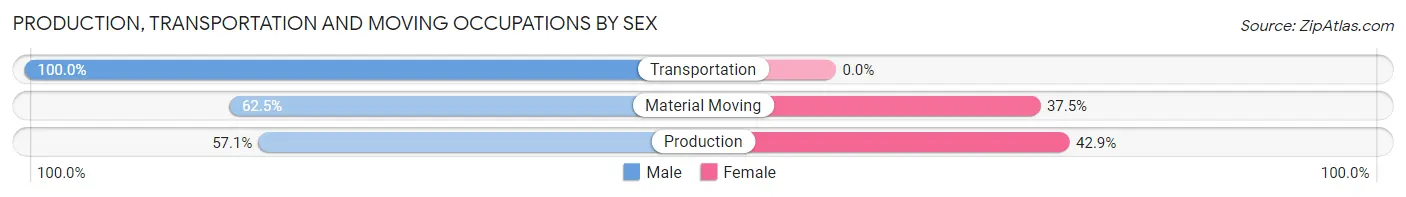
| Occupation | Male | Female |
| Production | 8 (57.1%) | 6 (42.9%) |
| Transportation | 9 (100.0%) | 0 (0.0%) |
| Material Moving | 5 (62.5%) | 3 (37.5%) |
| Total (Category) | 22 (71.0%) | 9 (29.0%) |
| Total (Overall) | 218 (49.7%) | 221 (50.3%) |
Employment Industries by Sex in Wainaku
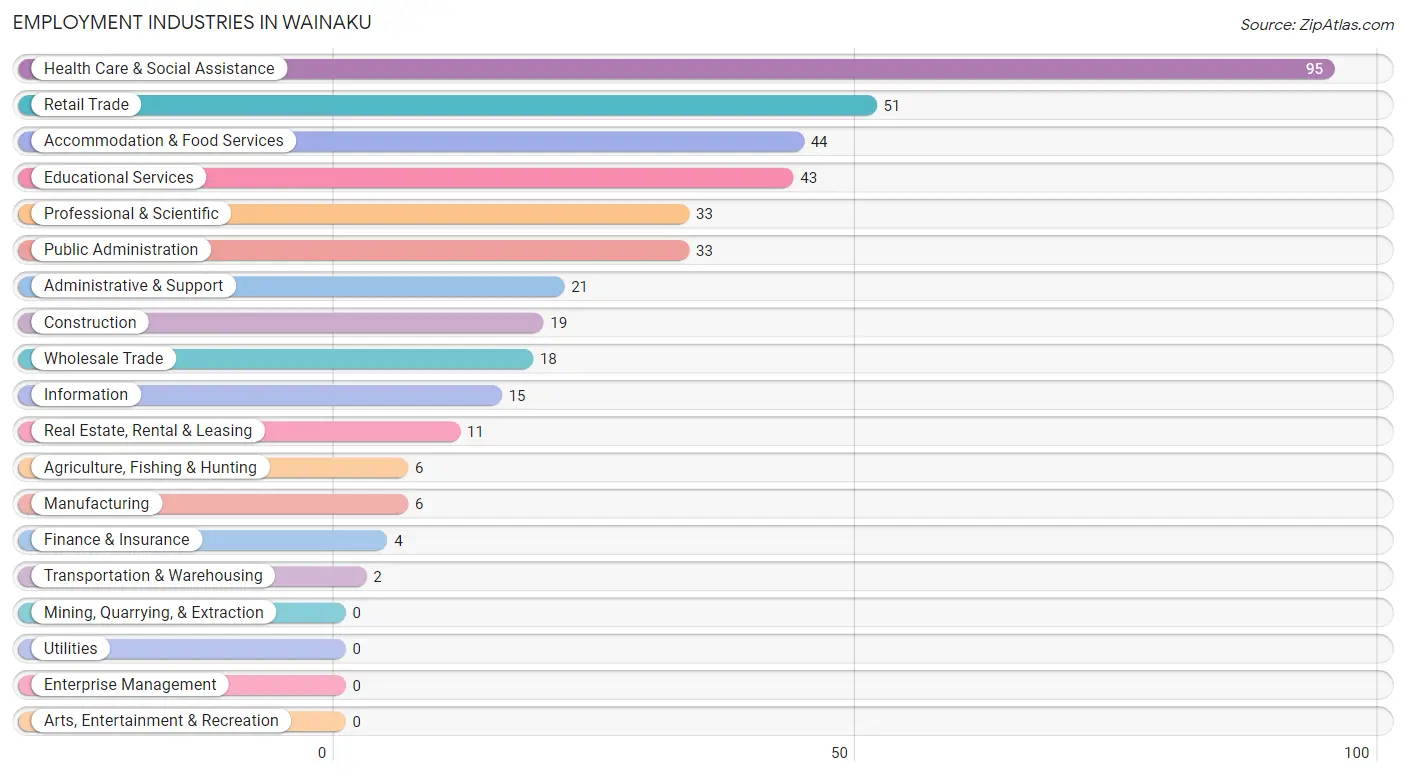
Employment Industries in Wainaku
The major employment industries in Wainaku include Health Care & Social Assistance (95 | 21.6%), Retail Trade (51 | 11.6%), Accommodation & Food Services (44 | 10.0%), Educational Services (43 | 9.8%), and Professional & Scientific (33 | 7.5%).
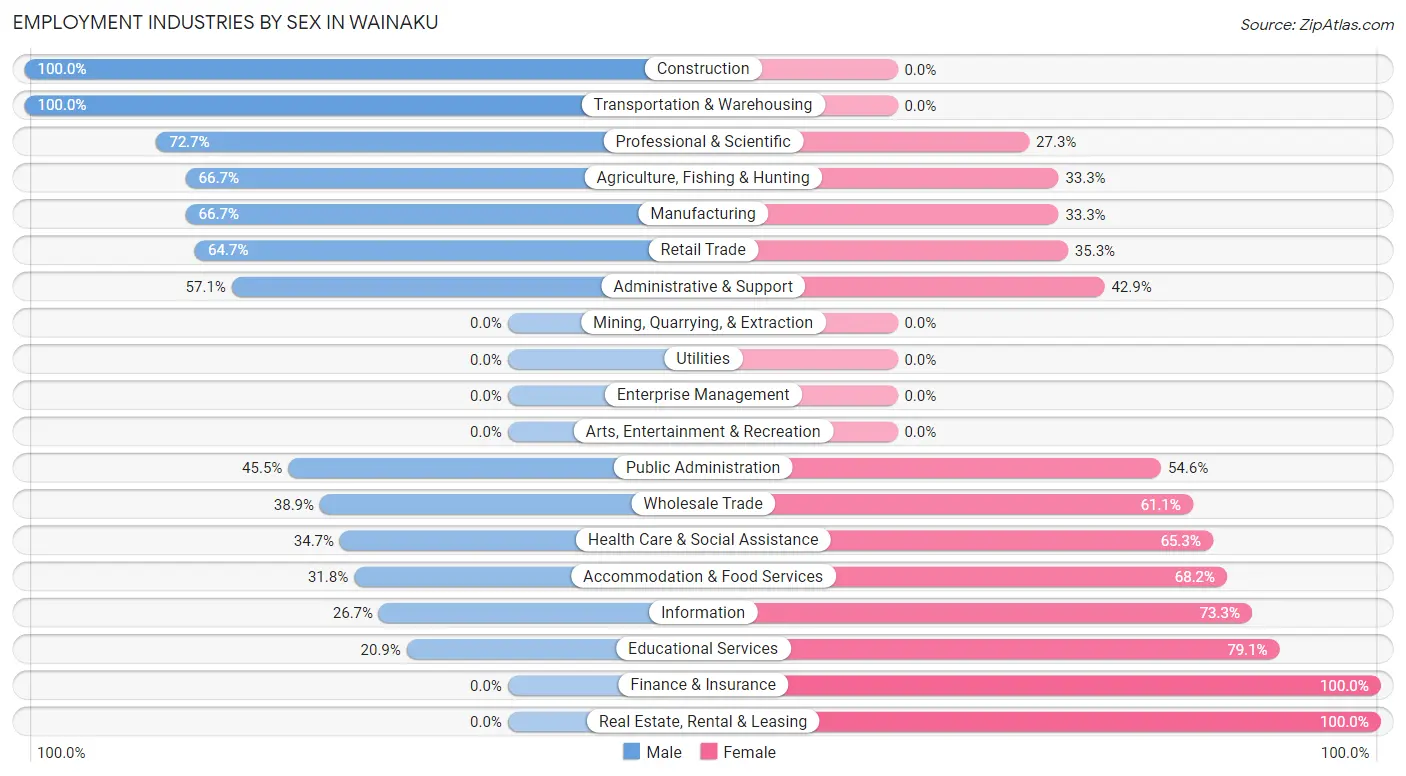
Employment Industries by Sex in Wainaku
The Wainaku industries that see more men than women are Construction (100.0%), Transportation & Warehousing (100.0%), and Professional & Scientific (72.7%), whereas the industries that tend to have a higher number of women are Finance & Insurance (100.0%), Real Estate, Rental & Leasing (100.0%), and Educational Services (79.1%).
| Industry | Male | Female |
| Agriculture, Fishing & Hunting | 4 (66.7%) | 2 (33.3%) |
| Mining, Quarrying, & Extraction | 0 (0.0%) | 0 (0.0%) |
| Construction | 19 (100.0%) | 0 (0.0%) |
| Manufacturing | 4 (66.7%) | 2 (33.3%) |
| Wholesale Trade | 7 (38.9%) | 11 (61.1%) |
| Retail Trade | 33 (64.7%) | 18 (35.3%) |
| Transportation & Warehousing | 2 (100.0%) | 0 (0.0%) |
| Utilities | 0 (0.0%) | 0 (0.0%) |
| Information | 4 (26.7%) | 11 (73.3%) |
| Finance & Insurance | 0 (0.0%) | 4 (100.0%) |
| Real Estate, Rental & Leasing | 0 (0.0%) | 11 (100.0%) |
| Professional & Scientific | 24 (72.7%) | 9 (27.3%) |
| Enterprise Management | 0 (0.0%) | 0 (0.0%) |
| Administrative & Support | 12 (57.1%) | 9 (42.9%) |
| Educational Services | 9 (20.9%) | 34 (79.1%) |
| Health Care & Social Assistance | 33 (34.7%) | 62 (65.3%) |
| Arts, Entertainment & Recreation | 0 (0.0%) | 0 (0.0%) |
| Accommodation & Food Services | 14 (31.8%) | 30 (68.2%) |
| Public Administration | 15 (45.5%) | 18 (54.5%) |
| Total | 218 (49.7%) | 221 (50.3%) |
Education in Wainaku
School Enrollment in Wainaku
The most common levels of schooling among the 243 students in Wainaku are middle school (94 | 38.7%), elementary school (43 | 17.7%), and graduate / professional (40 | 16.5%).
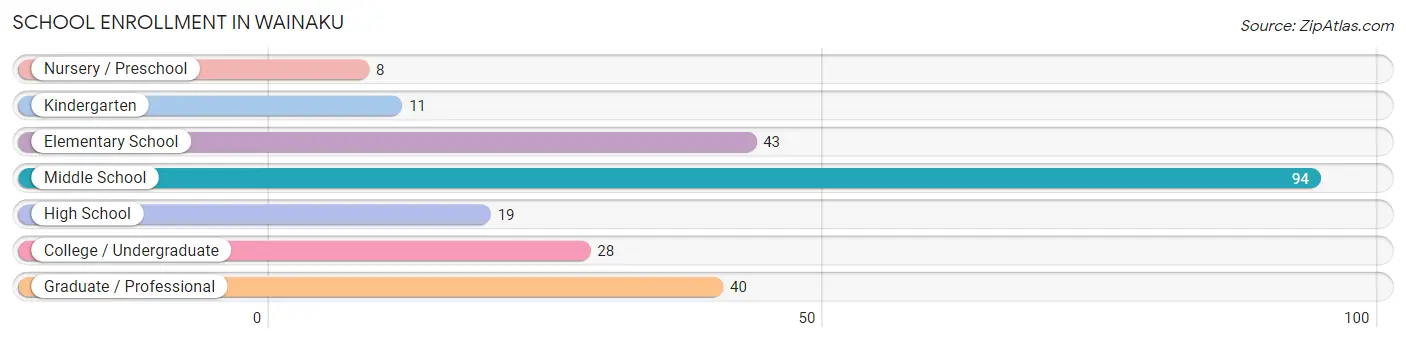
| School Level | # Students | % Students |
| Nursery / Preschool | 8 | 3.3% |
| Kindergarten | 11 | 4.5% |
| Elementary School | 43 | 17.7% |
| Middle School | 94 | 38.7% |
| High School | 19 | 7.8% |
| College / Undergraduate | 28 | 11.5% |
| Graduate / Professional | 40 | 16.5% |
| Total | 243 | 100.0% |
School Enrollment by Age by Funding Source in Wainaku
Out of a total of 243 students who are enrolled in schools in Wainaku, 72 (29.6%) attend a private institution, while the remaining 171 (70.4%) are enrolled in public schools. The age group of 3 to 4 year olds has the highest likelihood of being enrolled in private schools, with 8 (100.0% in the age bracket) enrolled. Conversely, the age group of 15 to 17 year olds has the lowest likelihood of being enrolled in a private school, with 9 (100.0% in the age bracket) attending a public institution.
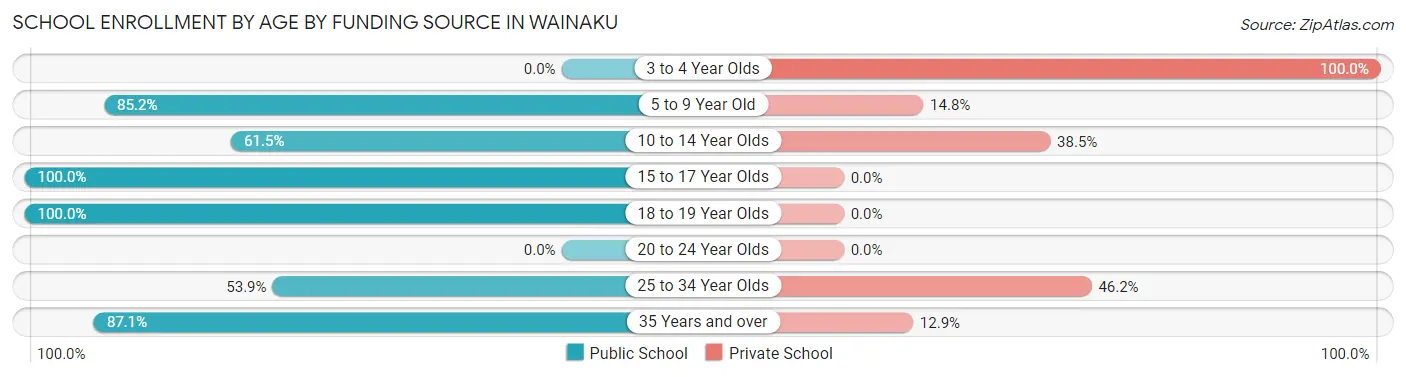
| Age Bracket | Public School | Private School |
| 3 to 4 Year Olds | 0 (0.0%) | 8 (100.0%) |
| 5 to 9 Year Old | 46 (85.2%) | 8 (14.8%) |
| 10 to 14 Year Olds | 64 (61.5%) | 40 (38.5%) |
| 15 to 17 Year Olds | 9 (100.0%) | 0 (0.0%) |
| 18 to 19 Year Olds | 11 (100.0%) | 0 (0.0%) |
| 20 to 24 Year Olds | 0 (0.0%) | 0 (0.0%) |
| 25 to 34 Year Olds | 14 (53.8%) | 12 (46.2%) |
| 35 Years and over | 27 (87.1%) | 4 (12.9%) |
| Total | 171 (70.4%) | 72 (29.6%) |
Educational Attainment by Field of Study in Wainaku
Social sciences (40 | 16.2%), business (36 | 14.6%), visual & performing arts (30 | 12.1%), education (22 | 8.9%), and arts & humanities (22 | 8.9%) are the most common fields of study among 247 individuals in Wainaku who have obtained a bachelor's degree or higher.
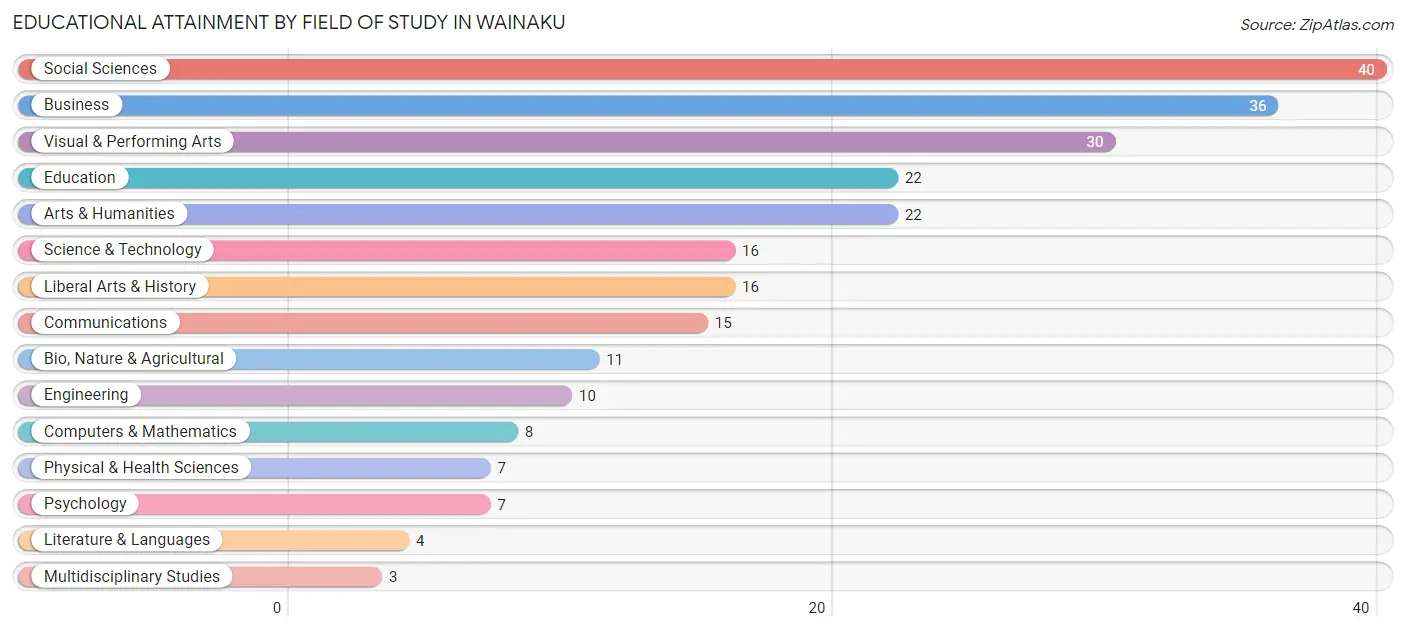
| Field of Study | # Graduates | % Graduates |
| Computers & Mathematics | 8 | 3.2% |
| Bio, Nature & Agricultural | 11 | 4.4% |
| Physical & Health Sciences | 7 | 2.8% |
| Psychology | 7 | 2.8% |
| Social Sciences | 40 | 16.2% |
| Engineering | 10 | 4.1% |
| Multidisciplinary Studies | 3 | 1.2% |
| Science & Technology | 16 | 6.5% |
| Business | 36 | 14.6% |
| Education | 22 | 8.9% |
| Literature & Languages | 4 | 1.6% |
| Liberal Arts & History | 16 | 6.5% |
| Visual & Performing Arts | 30 | 12.1% |
| Communications | 15 | 6.1% |
| Arts & Humanities | 22 | 8.9% |
| Total | 247 | 100.0% |
Transportation & Commute in Wainaku
Vehicle Availability by Sex in Wainaku
The most prevalent vehicle ownership categories in Wainaku are males with 2 vehicles (78, accounting for 35.8%) and females with 2 vehicles (60, making up 35.6%).
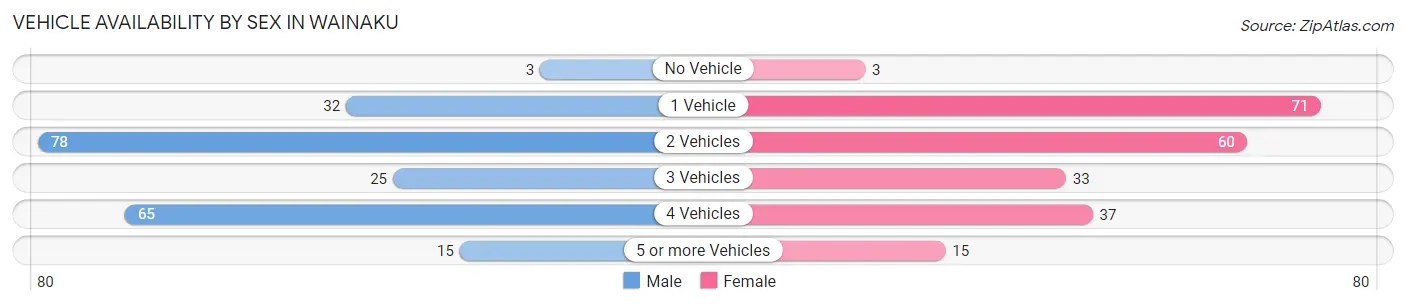
| Vehicles Available | Male | Female |
| No Vehicle | 3 (1.4%) | 3 (1.4%) |
| 1 Vehicle | 32 (14.7%) | 71 (32.4%) |
| 2 Vehicles | 78 (35.8%) | 60 (27.4%) |
| 3 Vehicles | 25 (11.5%) | 33 (15.1%) |
| 4 Vehicles | 65 (29.8%) | 37 (16.9%) |
| 5 or more Vehicles | 15 (6.9%) | 15 (6.9%) |
| Total | 218 (100.0%) | 219 (100.0%) |
Commute Time in Wainaku
The most frequently occuring commute durations in Wainaku are 10 to 14 minutes (116 commuters, 30.7%), 15 to 19 minutes (94 commuters, 24.9%), and 5 to 9 minutes (68 commuters, 18.0%).
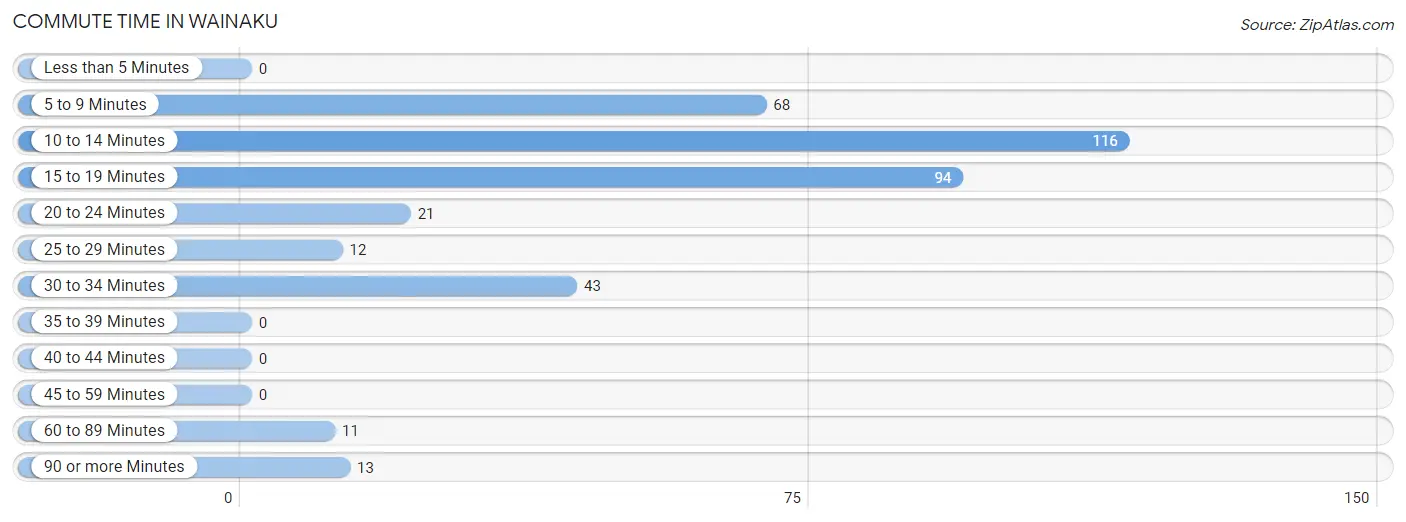
| Commute Time | # Commuters | % Commuters |
| Less than 5 Minutes | 0 | 0.0% |
| 5 to 9 Minutes | 68 | 18.0% |
| 10 to 14 Minutes | 116 | 30.7% |
| 15 to 19 Minutes | 94 | 24.9% |
| 20 to 24 Minutes | 21 | 5.6% |
| 25 to 29 Minutes | 12 | 3.2% |
| 30 to 34 Minutes | 43 | 11.4% |
| 35 to 39 Minutes | 0 | 0.0% |
| 40 to 44 Minutes | 0 | 0.0% |
| 45 to 59 Minutes | 0 | 0.0% |
| 60 to 89 Minutes | 11 | 2.9% |
| 90 or more Minutes | 13 | 3.4% |
Commute Time by Sex in Wainaku
The most common commute times in Wainaku are 5 to 9 minutes (54 commuters, 29.2%) for males and 10 to 14 minutes (82 commuters, 42.5%) for females.
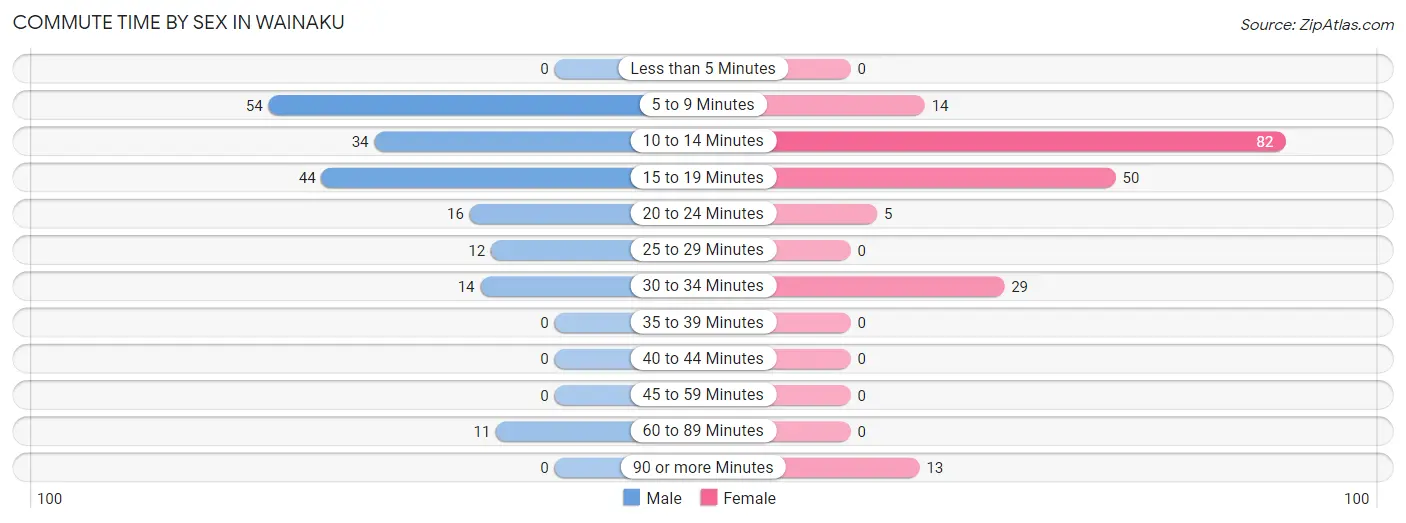
| Commute Time | Male | Female |
| Less than 5 Minutes | 0 (0.0%) | 0 (0.0%) |
| 5 to 9 Minutes | 54 (29.2%) | 14 (7.2%) |
| 10 to 14 Minutes | 34 (18.4%) | 82 (42.5%) |
| 15 to 19 Minutes | 44 (23.8%) | 50 (25.9%) |
| 20 to 24 Minutes | 16 (8.6%) | 5 (2.6%) |
| 25 to 29 Minutes | 12 (6.5%) | 0 (0.0%) |
| 30 to 34 Minutes | 14 (7.6%) | 29 (15.0%) |
| 35 to 39 Minutes | 0 (0.0%) | 0 (0.0%) |
| 40 to 44 Minutes | 0 (0.0%) | 0 (0.0%) |
| 45 to 59 Minutes | 0 (0.0%) | 0 (0.0%) |
| 60 to 89 Minutes | 11 (5.9%) | 0 (0.0%) |
| 90 or more Minutes | 0 (0.0%) | 13 (6.7%) |
Time of Departure to Work by Sex in Wainaku
The most frequent times of departure to work in Wainaku are 7:00 AM to 7:29 AM (64, 34.6%) for males and 7:00 AM to 7:29 AM (43, 22.3%) for females.
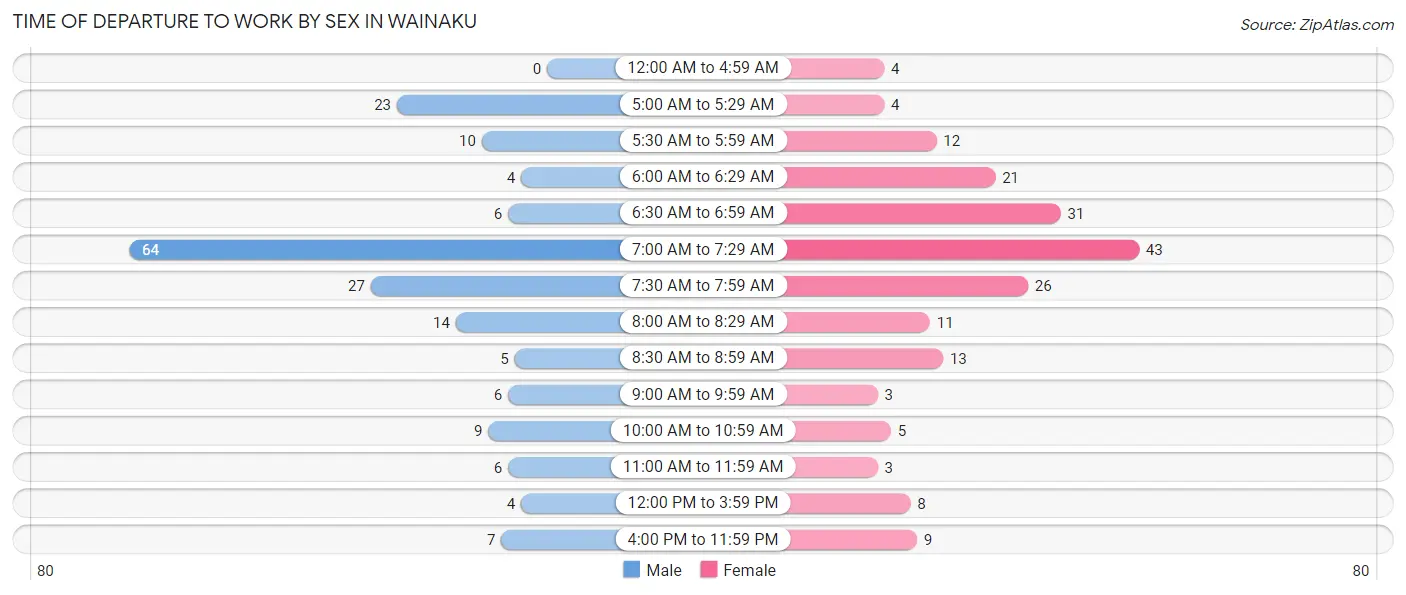
| Time of Departure | Male | Female |
| 12:00 AM to 4:59 AM | 0 (0.0%) | 4 (2.1%) |
| 5:00 AM to 5:29 AM | 23 (12.4%) | 4 (2.1%) |
| 5:30 AM to 5:59 AM | 10 (5.4%) | 12 (6.2%) |
| 6:00 AM to 6:29 AM | 4 (2.2%) | 21 (10.9%) |
| 6:30 AM to 6:59 AM | 6 (3.2%) | 31 (16.1%) |
| 7:00 AM to 7:29 AM | 64 (34.6%) | 43 (22.3%) |
| 7:30 AM to 7:59 AM | 27 (14.6%) | 26 (13.5%) |
| 8:00 AM to 8:29 AM | 14 (7.6%) | 11 (5.7%) |
| 8:30 AM to 8:59 AM | 5 (2.7%) | 13 (6.7%) |
| 9:00 AM to 9:59 AM | 6 (3.2%) | 3 (1.5%) |
| 10:00 AM to 10:59 AM | 9 (4.9%) | 5 (2.6%) |
| 11:00 AM to 11:59 AM | 6 (3.2%) | 3 (1.5%) |
| 12:00 PM to 3:59 PM | 4 (2.2%) | 8 (4.2%) |
| 4:00 PM to 11:59 PM | 7 (3.8%) | 9 (4.7%) |
| Total | 185 (100.0%) | 193 (100.0%) |
Housing Occupancy in Wainaku
Occupancy by Ownership in Wainaku
Of the total 371 dwellings in Wainaku, owner-occupied units account for 303 (81.7%), while renter-occupied units make up 68 (18.3%).
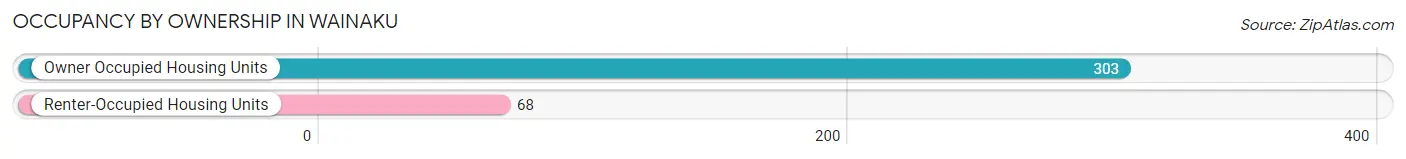
| Occupancy | # Housing Units | % Housing Units |
| Owner Occupied Housing Units | 303 | 81.7% |
| Renter-Occupied Housing Units | 68 | 18.3% |
| Total Occupied Housing Units | 371 | 100.0% |
Occupancy by Household Size in Wainaku
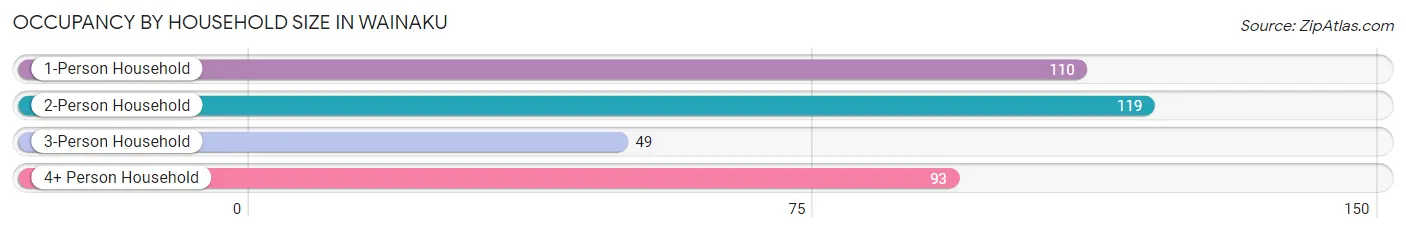
| Household Size | # Housing Units | % Housing Units |
| 1-Person Household | 110 | 29.6% |
| 2-Person Household | 119 | 32.1% |
| 3-Person Household | 49 | 13.2% |
| 4+ Person Household | 93 | 25.1% |
| Total Housing Units | 371 | 100.0% |
Occupancy by Ownership by Household Size in Wainaku
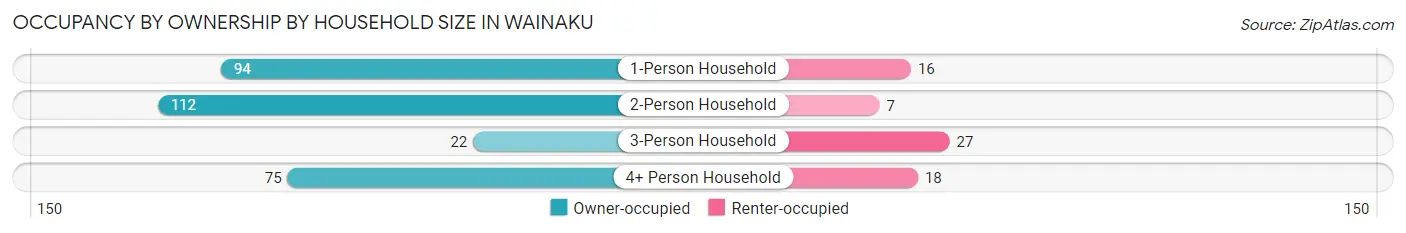
| Household Size | Owner-occupied | Renter-occupied |
| 1-Person Household | 94 (85.5%) | 16 (14.5%) |
| 2-Person Household | 112 (94.1%) | 7 (5.9%) |
| 3-Person Household | 22 (44.9%) | 27 (55.1%) |
| 4+ Person Household | 75 (80.6%) | 18 (19.4%) |
| Total Housing Units | 303 (81.7%) | 68 (18.3%) |
Occupancy by Educational Attainment in Wainaku
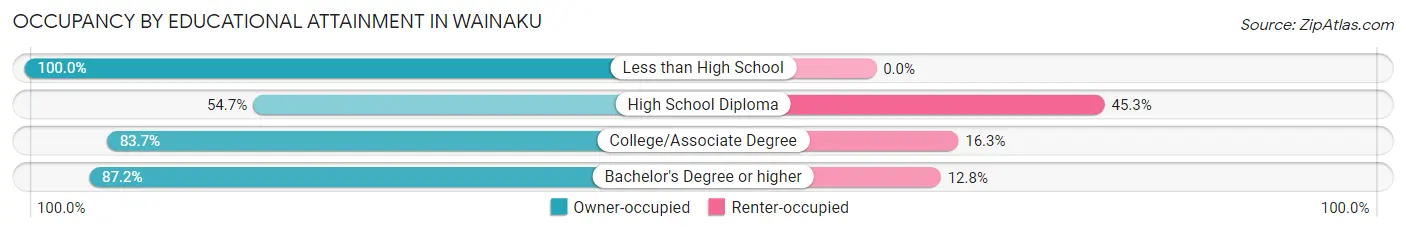
| Household Size | Owner-occupied | Renter-occupied |
| Less than High School | 21 (100.0%) | 0 (0.0%) |
| High School Diploma | 29 (54.7%) | 24 (45.3%) |
| College/Associate Degree | 144 (83.7%) | 28 (16.3%) |
| Bachelor's Degree or higher | 109 (87.2%) | 16 (12.8%) |
Occupancy by Age of Householder in Wainaku
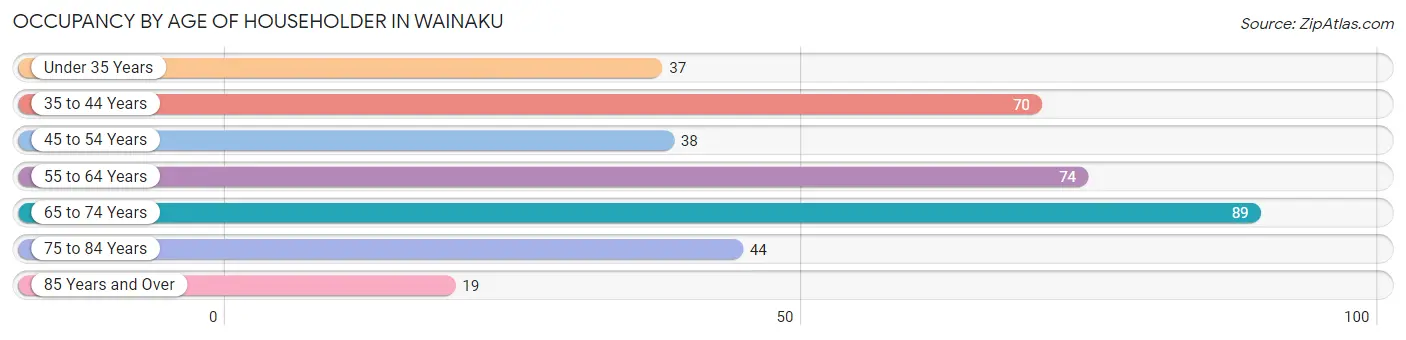
| Age Bracket | # Households | % Households |
| Under 35 Years | 37 | 10.0% |
| 35 to 44 Years | 70 | 18.9% |
| 45 to 54 Years | 38 | 10.2% |
| 55 to 64 Years | 74 | 20.0% |
| 65 to 74 Years | 89 | 24.0% |
| 75 to 84 Years | 44 | 11.9% |
| 85 Years and Over | 19 | 5.1% |
| Total | 371 | 100.0% |
Housing Finances in Wainaku
Median Income by Occupancy in Wainaku
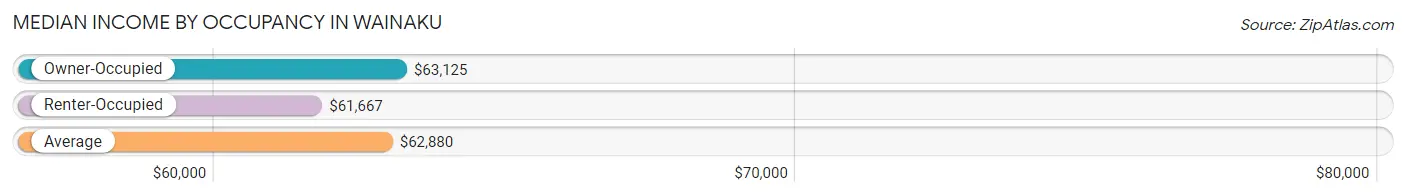
| Occupancy Type | # Households | Median Income |
| Owner-Occupied | 303 (81.7%) | $63,125 |
| Renter-Occupied | 68 (18.3%) | $61,667 |
| Average | 371 (100.0%) | $62,880 |
Occupancy by Householder Income Bracket in Wainaku
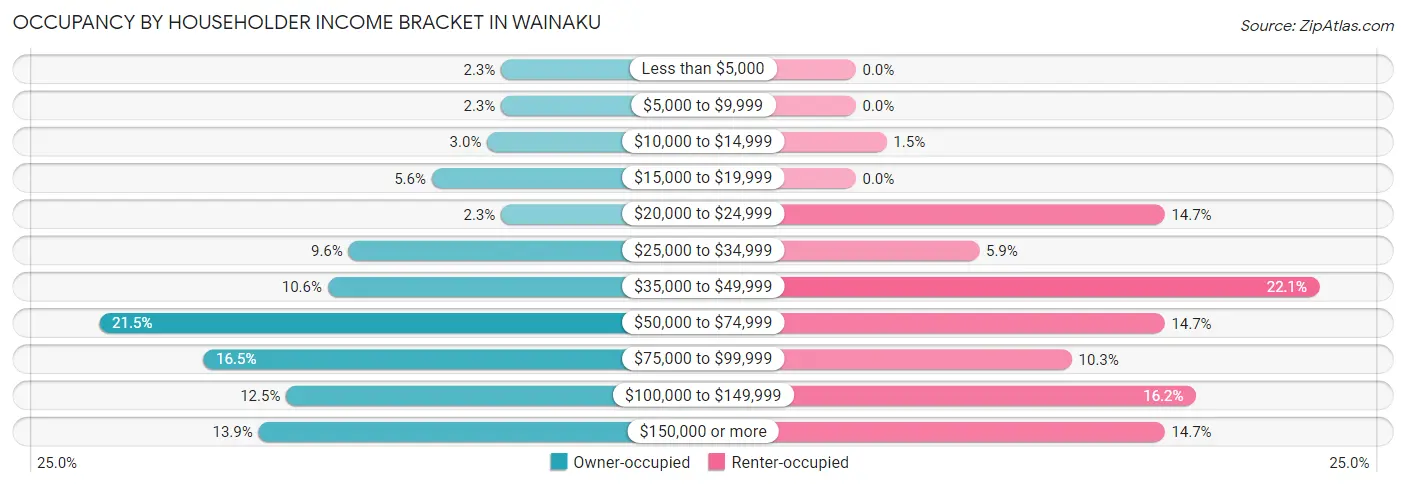
| Income Bracket | Owner-occupied | Renter-occupied |
| Less than $5,000 | 7 (2.3%) | 0 (0.0%) |
| $5,000 to $9,999 | 7 (2.3%) | 0 (0.0%) |
| $10,000 to $14,999 | 9 (3.0%) | 1 (1.5%) |
| $15,000 to $19,999 | 17 (5.6%) | 0 (0.0%) |
| $20,000 to $24,999 | 7 (2.3%) | 10 (14.7%) |
| $25,000 to $34,999 | 29 (9.6%) | 4 (5.9%) |
| $35,000 to $49,999 | 32 (10.6%) | 15 (22.1%) |
| $50,000 to $74,999 | 65 (21.4%) | 10 (14.7%) |
| $75,000 to $99,999 | 50 (16.5%) | 7 (10.3%) |
| $100,000 to $149,999 | 38 (12.5%) | 11 (16.2%) |
| $150,000 or more | 42 (13.9%) | 10 (14.7%) |
| Total | 303 (100.0%) | 68 (100.0%) |
Monthly Housing Cost Tiers in Wainaku
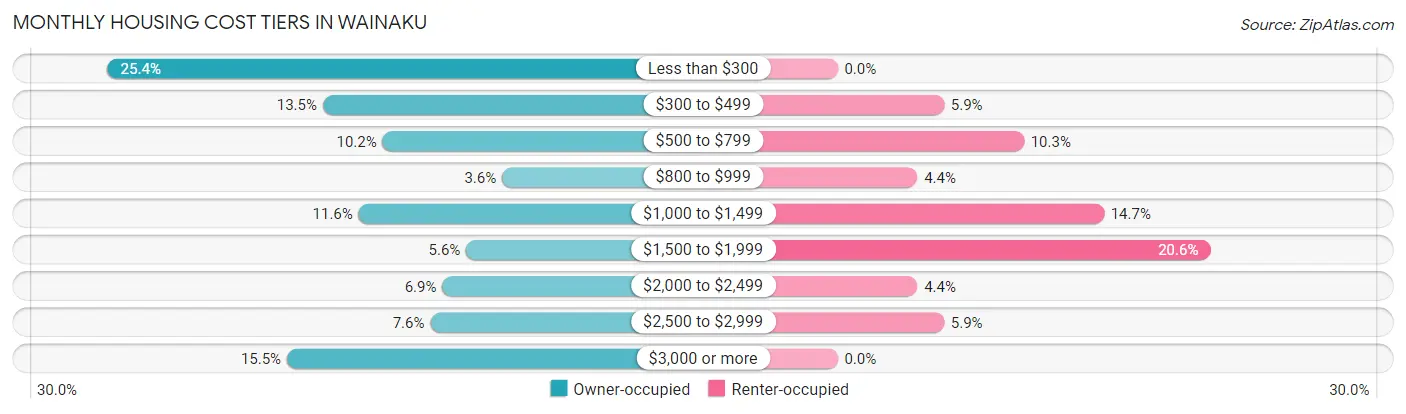
| Monthly Cost | Owner-occupied | Renter-occupied |
| Less than $300 | 77 (25.4%) | 0 (0.0%) |
| $300 to $499 | 41 (13.5%) | 4 (5.9%) |
| $500 to $799 | 31 (10.2%) | 7 (10.3%) |
| $800 to $999 | 11 (3.6%) | 3 (4.4%) |
| $1,000 to $1,499 | 35 (11.6%) | 10 (14.7%) |
| $1,500 to $1,999 | 17 (5.6%) | 14 (20.6%) |
| $2,000 to $2,499 | 21 (6.9%) | 3 (4.4%) |
| $2,500 to $2,999 | 23 (7.6%) | 4 (5.9%) |
| $3,000 or more | 47 (15.5%) | 0 (0.0%) |
| Total | 303 (100.0%) | 68 (100.0%) |
Physical Housing Characteristics in Wainaku
Housing Structures in Wainaku
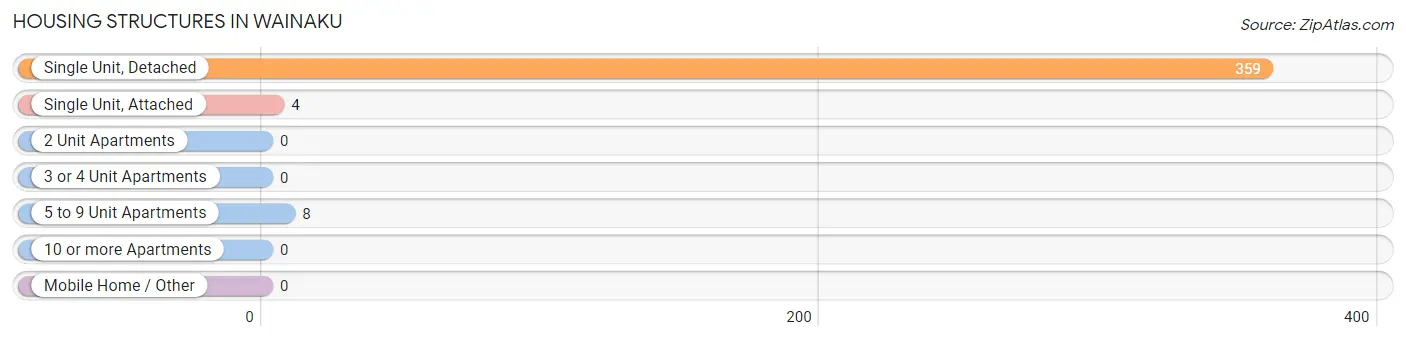
| Structure Type | # Housing Units | % Housing Units |
| Single Unit, Detached | 359 | 96.8% |
| Single Unit, Attached | 4 | 1.1% |
| 2 Unit Apartments | 0 | 0.0% |
| 3 or 4 Unit Apartments | 0 | 0.0% |
| 5 to 9 Unit Apartments | 8 | 2.2% |
| 10 or more Apartments | 0 | 0.0% |
| Mobile Home / Other | 0 | 0.0% |
| Total | 371 | 100.0% |
Housing Structures by Occupancy in Wainaku
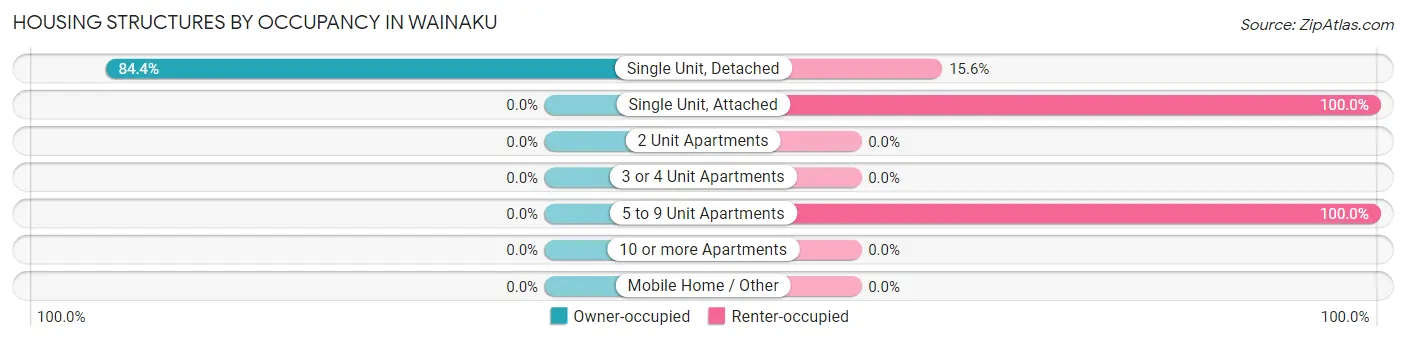
| Structure Type | Owner-occupied | Renter-occupied |
| Single Unit, Detached | 303 (84.4%) | 56 (15.6%) |
| Single Unit, Attached | 0 (0.0%) | 4 (100.0%) |
| 2 Unit Apartments | 0 (0.0%) | 0 (0.0%) |
| 3 or 4 Unit Apartments | 0 (0.0%) | 0 (0.0%) |
| 5 to 9 Unit Apartments | 0 (0.0%) | 8 (100.0%) |
| 10 or more Apartments | 0 (0.0%) | 0 (0.0%) |
| Mobile Home / Other | 0 (0.0%) | 0 (0.0%) |
| Total | 303 (81.7%) | 68 (18.3%) |
Housing Structures by Number of Rooms in Wainaku
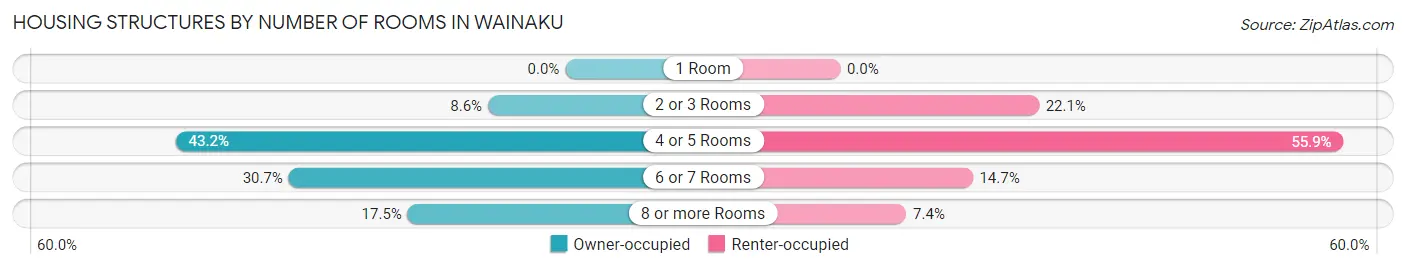
| Number of Rooms | Owner-occupied | Renter-occupied |
| 1 Room | 0 (0.0%) | 0 (0.0%) |
| 2 or 3 Rooms | 26 (8.6%) | 15 (22.1%) |
| 4 or 5 Rooms | 131 (43.2%) | 38 (55.9%) |
| 6 or 7 Rooms | 93 (30.7%) | 10 (14.7%) |
| 8 or more Rooms | 53 (17.5%) | 5 (7.3%) |
| Total | 303 (100.0%) | 68 (100.0%) |
Housing Structure by Heating Type in Wainaku
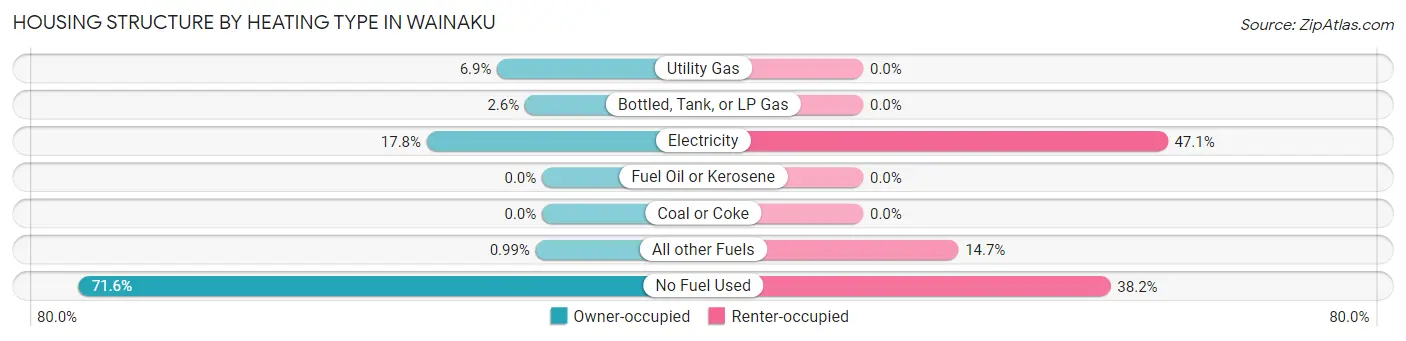
| Heating Type | Owner-occupied | Renter-occupied |
| Utility Gas | 21 (6.9%) | 0 (0.0%) |
| Bottled, Tank, or LP Gas | 8 (2.6%) | 0 (0.0%) |
| Electricity | 54 (17.8%) | 32 (47.1%) |
| Fuel Oil or Kerosene | 0 (0.0%) | 0 (0.0%) |
| Coal or Coke | 0 (0.0%) | 0 (0.0%) |
| All other Fuels | 3 (1.0%) | 10 (14.7%) |
| No Fuel Used | 217 (71.6%) | 26 (38.2%) |
| Total | 303 (100.0%) | 68 (100.0%) |
Household Vehicle Usage in Wainaku
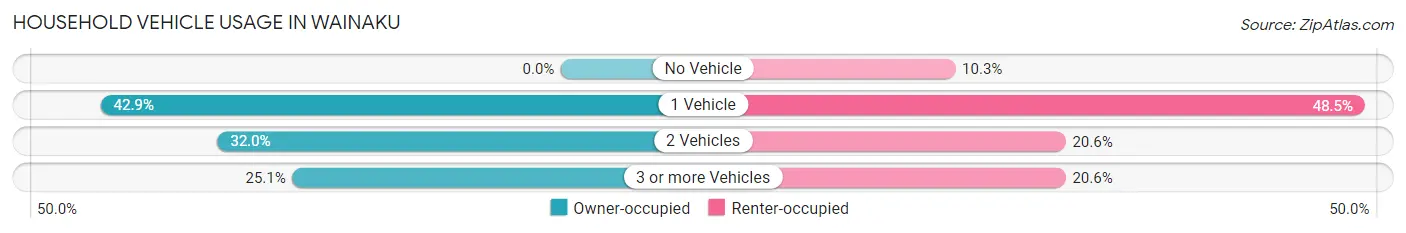
| Vehicles per Household | Owner-occupied | Renter-occupied |
| No Vehicle | 0 (0.0%) | 7 (10.3%) |
| 1 Vehicle | 130 (42.9%) | 33 (48.5%) |
| 2 Vehicles | 97 (32.0%) | 14 (20.6%) |
| 3 or more Vehicles | 76 (25.1%) | 14 (20.6%) |
| Total | 303 (100.0%) | 68 (100.0%) |
Real Estate & Mortgages in Wainaku
Real Estate and Mortgage Overview in Wainaku
| Characteristic | Without Mortgage | With Mortgage |
| Housing Units | 148 | 155 |
| Median Property Value | $356,300 | $532,100 |
| Median Household Income | $46,042 | $31 |
| Monthly Housing Costs | $294 | $47 |
| Real Estate Taxes | $653 | $6 |
Property Value by Mortgage Status in Wainaku
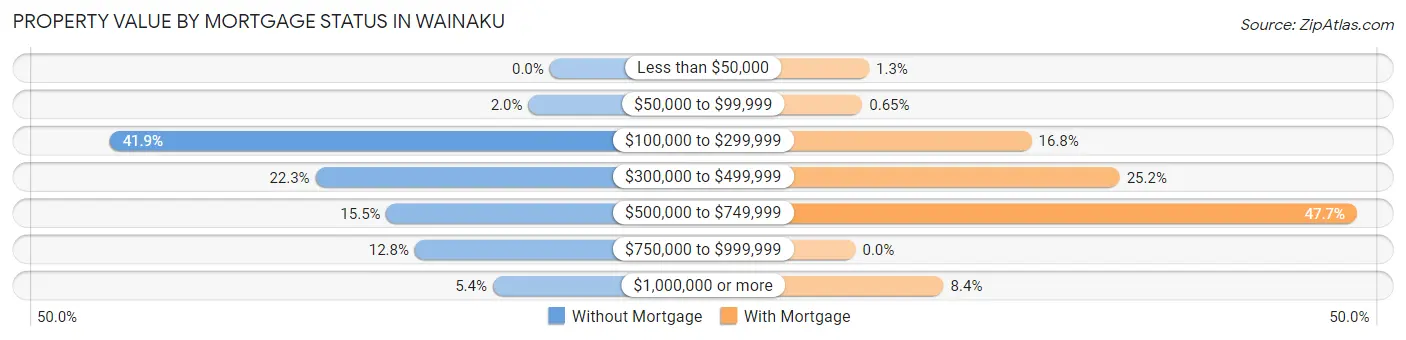
| Property Value | Without Mortgage | With Mortgage |
| Less than $50,000 | 0 (0.0%) | 2 (1.3%) |
| $50,000 to $99,999 | 3 (2.0%) | 1 (0.6%) |
| $100,000 to $299,999 | 62 (41.9%) | 26 (16.8%) |
| $300,000 to $499,999 | 33 (22.3%) | 39 (25.2%) |
| $500,000 to $749,999 | 23 (15.5%) | 74 (47.7%) |
| $750,000 to $999,999 | 19 (12.8%) | 0 (0.0%) |
| $1,000,000 or more | 8 (5.4%) | 13 (8.4%) |
| Total | 148 (100.0%) | 155 (100.0%) |
Household Income by Mortgage Status in Wainaku
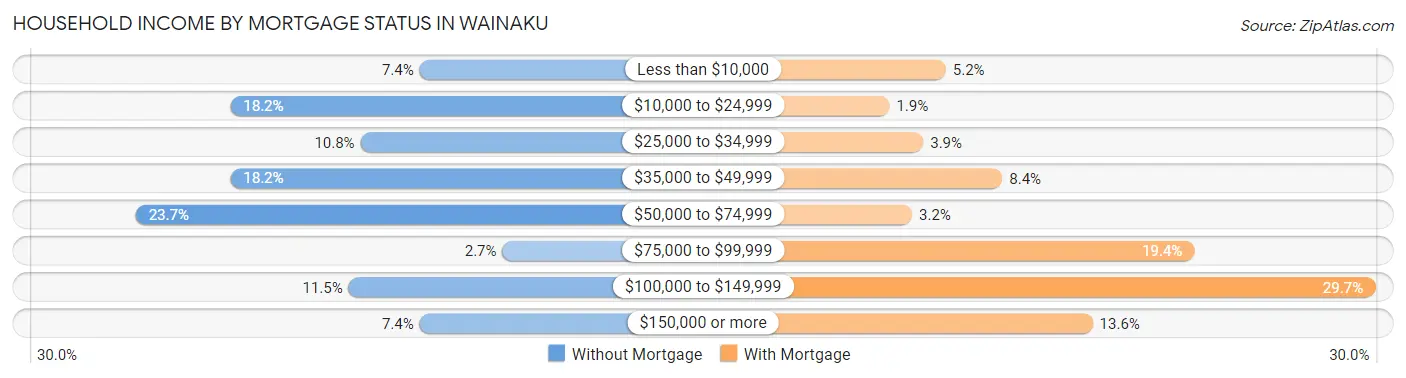
| Household Income | Without Mortgage | With Mortgage |
| Less than $10,000 | 11 (7.4%) | 8 (5.2%) |
| $10,000 to $24,999 | 27 (18.2%) | 3 (1.9%) |
| $25,000 to $34,999 | 16 (10.8%) | 6 (3.9%) |
| $35,000 to $49,999 | 27 (18.2%) | 13 (8.4%) |
| $50,000 to $74,999 | 35 (23.6%) | 5 (3.2%) |
| $75,000 to $99,999 | 4 (2.7%) | 30 (19.4%) |
| $100,000 to $149,999 | 17 (11.5%) | 46 (29.7%) |
| $150,000 or more | 11 (7.4%) | 21 (13.6%) |
| Total | 148 (100.0%) | 155 (100.0%) |
Property Value to Household Income Ratio in Wainaku
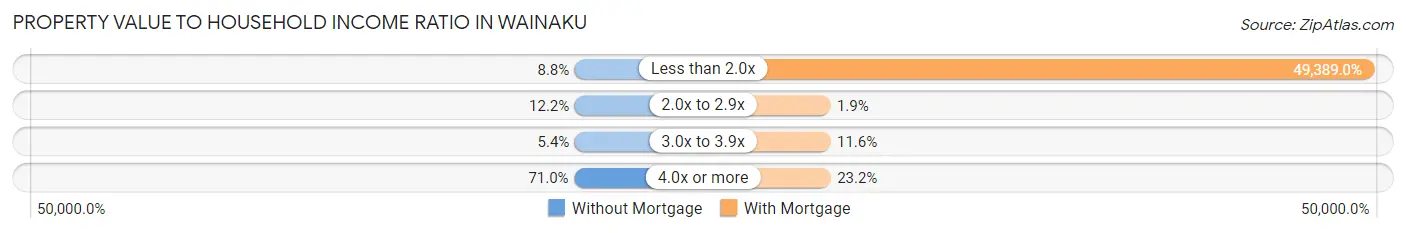
| Value-to-Income Ratio | Without Mortgage | With Mortgage |
| Less than 2.0x | 13 (8.8%) | 76,553 (49,389.0%) |
| 2.0x to 2.9x | 18 (12.2%) | 3 (1.9%) |
| 3.0x to 3.9x | 8 (5.4%) | 18 (11.6%) |
| 4.0x or more | 105 (71.0%) | 36 (23.2%) |
| Total | 148 (100.0%) | 155 (100.0%) |
Real Estate Taxes by Mortgage Status in Wainaku
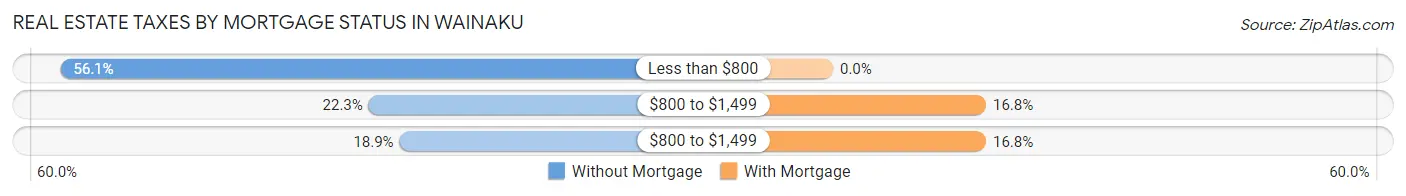
| Property Taxes | Without Mortgage | With Mortgage |
| Less than $800 | 83 (56.1%) | 0 (0.0%) |
| $800 to $1,499 | 33 (22.3%) | 26 (16.8%) |
| $800 to $1,499 | 28 (18.9%) | 26 (16.8%) |
| Total | 148 (100.0%) | 155 (100.0%) |
Health & Disability in Wainaku
Health Insurance Coverage by Age in Wainaku
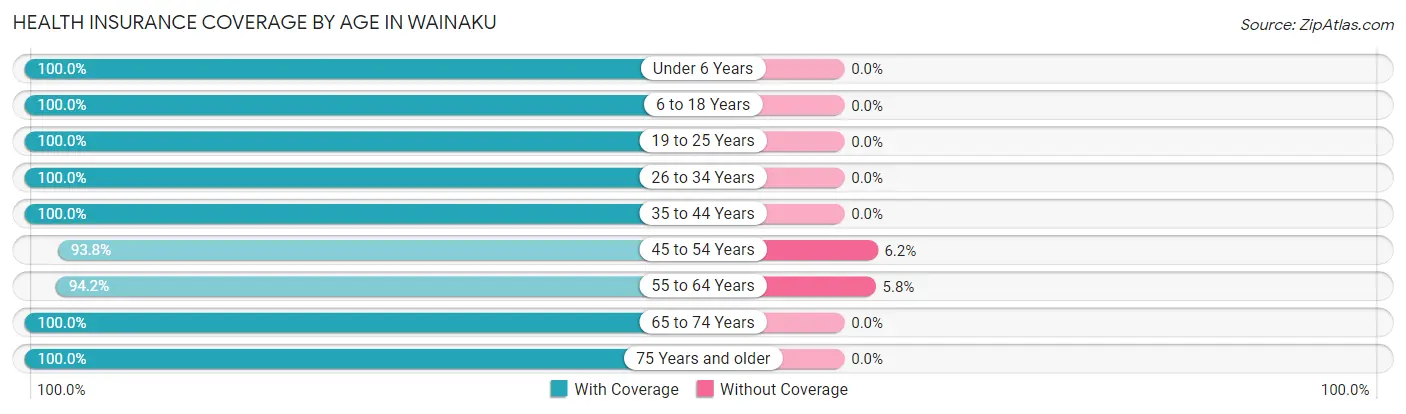
| Age Bracket | With Coverage | Without Coverage |
| Under 6 Years | 46 (100.0%) | 0 (0.0%) |
| 6 to 18 Years | 184 (100.0%) | 0 (0.0%) |
| 19 to 25 Years | 38 (100.0%) | 0 (0.0%) |
| 26 to 34 Years | 108 (100.0%) | 0 (0.0%) |
| 35 to 44 Years | 146 (100.0%) | 0 (0.0%) |
| 45 to 54 Years | 91 (93.8%) | 6 (6.2%) |
| 55 to 64 Years | 145 (94.2%) | 9 (5.8%) |
| 65 to 74 Years | 157 (100.0%) | 0 (0.0%) |
| 75 Years and older | 90 (100.0%) | 0 (0.0%) |
| Total | 1,005 (98.5%) | 15 (1.5%) |
Health Insurance Coverage by Citizenship Status in Wainaku
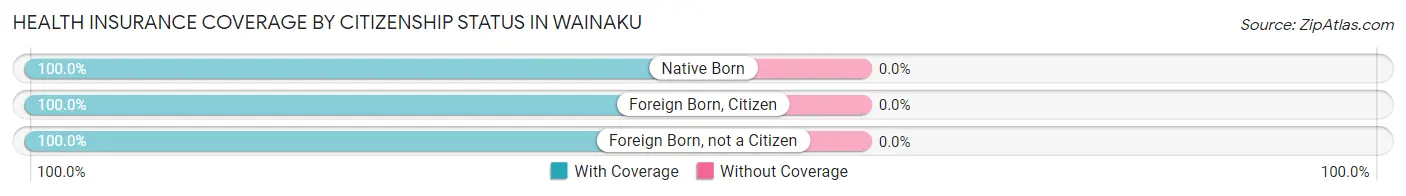
| Citizenship Status | With Coverage | Without Coverage |
| Native Born | 46 (100.0%) | 0 (0.0%) |
| Foreign Born, Citizen | 184 (100.0%) | 0 (0.0%) |
| Foreign Born, not a Citizen | 38 (100.0%) | 0 (0.0%) |
Health Insurance Coverage by Household Income in Wainaku
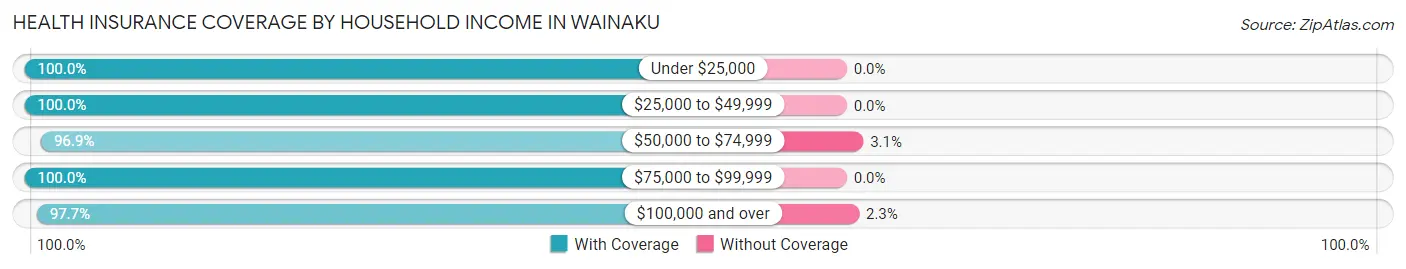
| Household Income | With Coverage | Without Coverage |
| Under $25,000 | 99 (100.0%) | 0 (0.0%) |
| $25,000 to $49,999 | 107 (100.0%) | 0 (0.0%) |
| $50,000 to $74,999 | 189 (96.9%) | 6 (3.1%) |
| $75,000 to $99,999 | 210 (100.0%) | 0 (0.0%) |
| $100,000 and over | 384 (97.7%) | 9 (2.3%) |
Public vs Private Health Insurance Coverage by Age in Wainaku
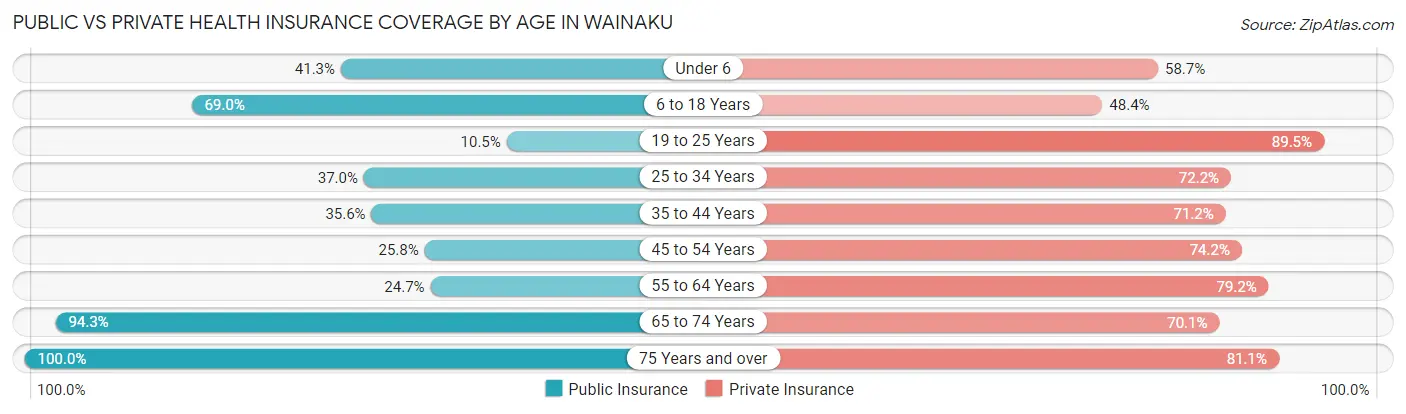
| Age Bracket | Public Insurance | Private Insurance |
| Under 6 | 19 (41.3%) | 27 (58.7%) |
| 6 to 18 Years | 127 (69.0%) | 89 (48.4%) |
| 19 to 25 Years | 4 (10.5%) | 34 (89.5%) |
| 25 to 34 Years | 40 (37.0%) | 78 (72.2%) |
| 35 to 44 Years | 52 (35.6%) | 104 (71.2%) |
| 45 to 54 Years | 25 (25.8%) | 72 (74.2%) |
| 55 to 64 Years | 38 (24.7%) | 122 (79.2%) |
| 65 to 74 Years | 148 (94.3%) | 110 (70.1%) |
| 75 Years and over | 90 (100.0%) | 73 (81.1%) |
| Total | 543 (53.2%) | 709 (69.5%) |
Disability Status by Sex by Age in Wainaku
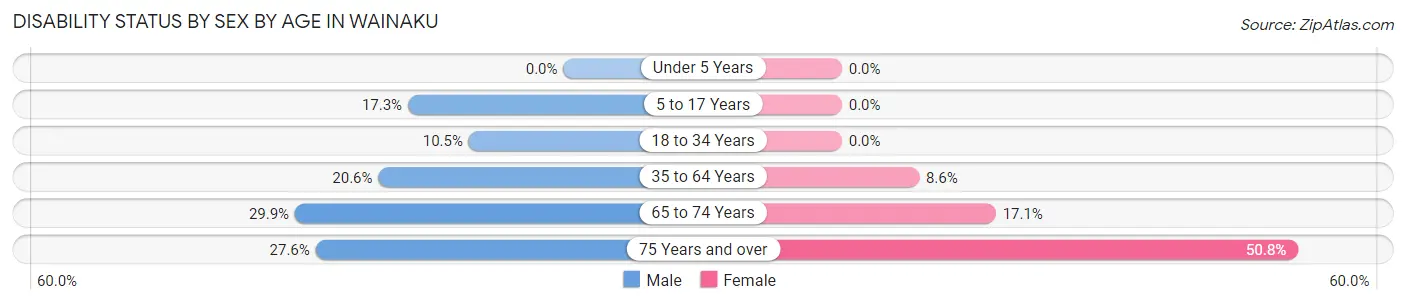
| Age Bracket | Male | Female |
| Under 5 Years | 0 (0.0%) | 0 (0.0%) |
| 5 to 17 Years | 9 (17.3%) | 0 (0.0%) |
| 18 to 34 Years | 8 (10.5%) | 0 (0.0%) |
| 35 to 64 Years | 41 (20.6%) | 17 (8.6%) |
| 65 to 74 Years | 26 (29.9%) | 12 (17.1%) |
| 75 Years and over | 8 (27.6%) | 31 (50.8%) |
Disability Class by Sex by Age in Wainaku
Disability Class: Hearing Difficulty
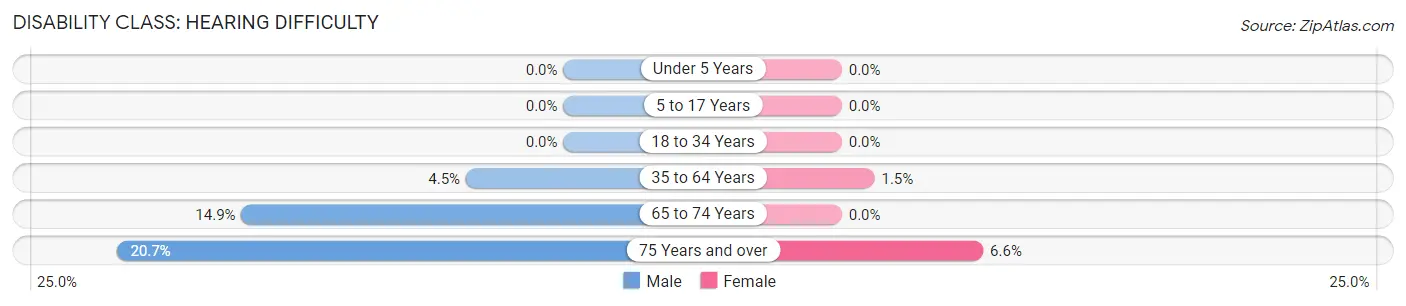
| Age Bracket | Male | Female |
| Under 5 Years | 0 (0.0%) | 0 (0.0%) |
| 5 to 17 Years | 0 (0.0%) | 0 (0.0%) |
| 18 to 34 Years | 0 (0.0%) | 0 (0.0%) |
| 35 to 64 Years | 9 (4.5%) | 3 (1.5%) |
| 65 to 74 Years | 13 (14.9%) | 0 (0.0%) |
| 75 Years and over | 6 (20.7%) | 4 (6.6%) |
Disability Class: Vision Difficulty
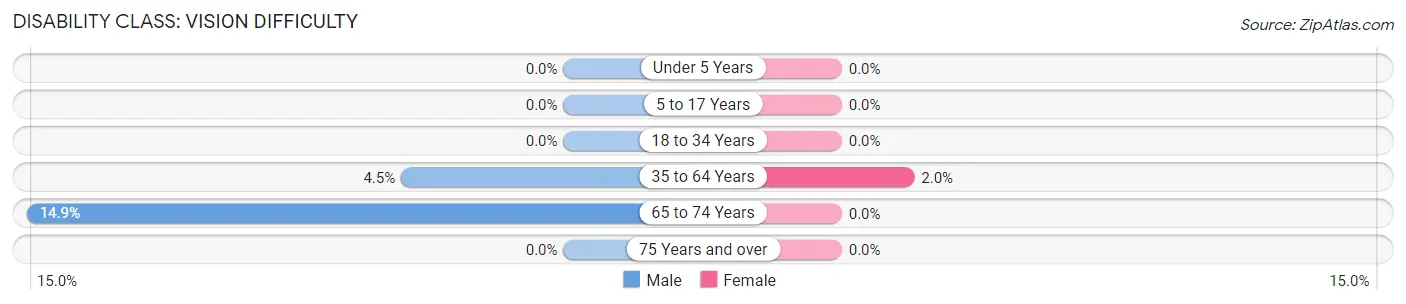
| Age Bracket | Male | Female |
| Under 5 Years | 0 (0.0%) | 0 (0.0%) |
| 5 to 17 Years | 0 (0.0%) | 0 (0.0%) |
| 18 to 34 Years | 0 (0.0%) | 0 (0.0%) |
| 35 to 64 Years | 9 (4.5%) | 4 (2.0%) |
| 65 to 74 Years | 13 (14.9%) | 0 (0.0%) |
| 75 Years and over | 0 (0.0%) | 0 (0.0%) |
Disability Class: Cognitive Difficulty
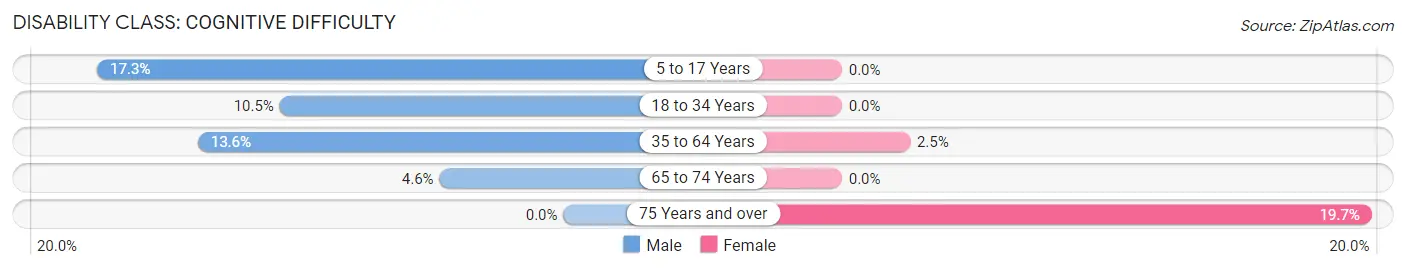
| Age Bracket | Male | Female |
| 5 to 17 Years | 9 (17.3%) | 0 (0.0%) |
| 18 to 34 Years | 8 (10.5%) | 0 (0.0%) |
| 35 to 64 Years | 27 (13.6%) | 5 (2.5%) |
| 65 to 74 Years | 4 (4.6%) | 0 (0.0%) |
| 75 Years and over | 0 (0.0%) | 12 (19.7%) |
Disability Class: Ambulatory Difficulty
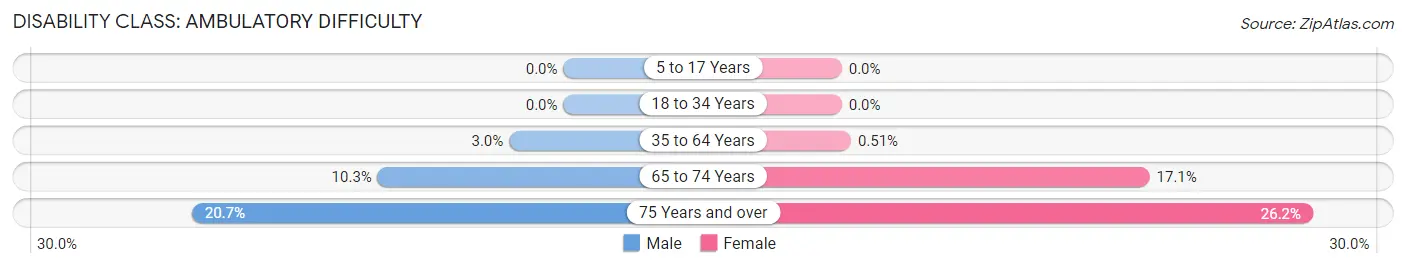
| Age Bracket | Male | Female |
| 5 to 17 Years | 0 (0.0%) | 0 (0.0%) |
| 18 to 34 Years | 0 (0.0%) | 0 (0.0%) |
| 35 to 64 Years | 6 (3.0%) | 1 (0.5%) |
| 65 to 74 Years | 9 (10.3%) | 12 (17.1%) |
| 75 Years and over | 6 (20.7%) | 16 (26.2%) |
Disability Class: Self-Care Difficulty
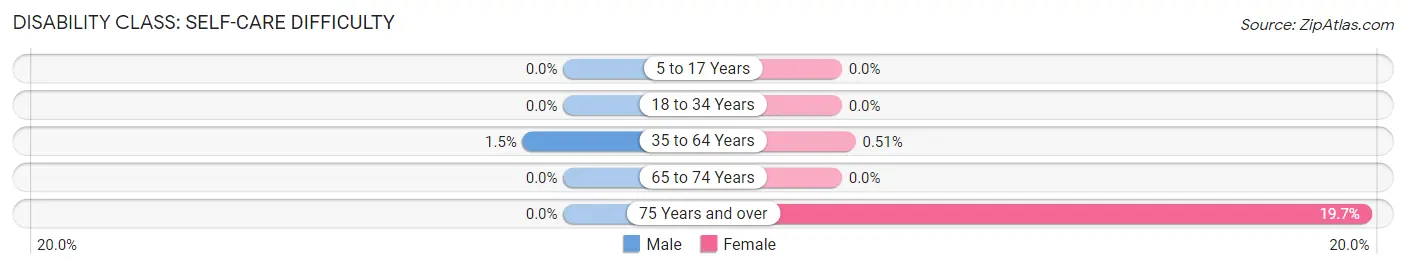
| Age Bracket | Male | Female |
| 5 to 17 Years | 0 (0.0%) | 0 (0.0%) |
| 18 to 34 Years | 0 (0.0%) | 0 (0.0%) |
| 35 to 64 Years | 3 (1.5%) | 1 (0.5%) |
| 65 to 74 Years | 0 (0.0%) | 0 (0.0%) |
| 75 Years and over | 0 (0.0%) | 12 (19.7%) |
Technology Access in Wainaku
Computing Device Access in Wainaku
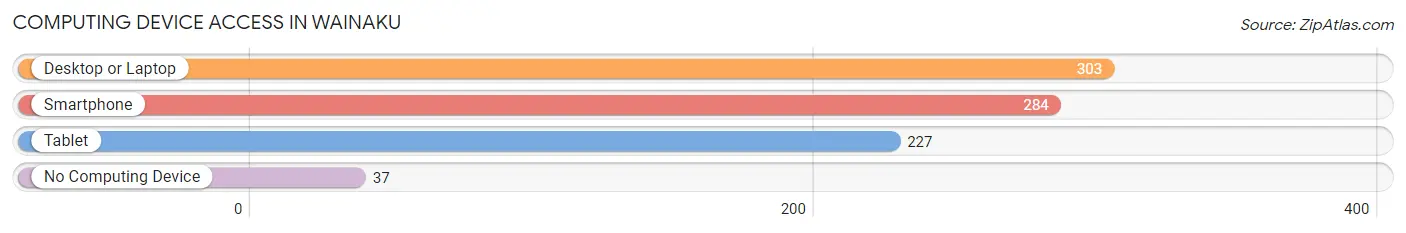
| Device Type | # Households | % Households |
| Desktop or Laptop | 303 | 81.7% |
| Smartphone | 284 | 76.5% |
| Tablet | 227 | 61.2% |
| No Computing Device | 37 | 10.0% |
| Total | 371 | 100.0% |
Internet Access in Wainaku
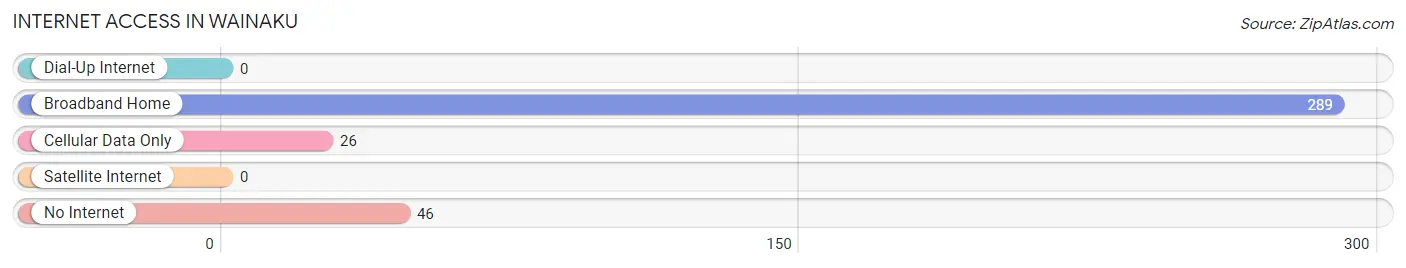
| Internet Type | # Households | % Households |
| Dial-Up Internet | 0 | 0.0% |
| Broadband Home | 289 | 77.9% |
| Cellular Data Only | 26 | 7.0% |
| Satellite Internet | 0 | 0.0% |
| No Internet | 46 | 12.4% |
| Total | 371 | 100.0% |
Wainaku Summary
Wainaku is a small town located on the island of Hawaii in the United States. It is situated in the Hilo District of Hawaii County, and is part of the Hilo-Wainaku-Papaikou CDP. The town is located on the north side of Hilo Bay, and is bordered by the Wailuku River to the east and the Wailoa River to the west. The population of Wainaku was 1,845 at the 2010 census.
Geography
Wainaku is located at 19°43'17" North, 155°3'17" West (19.7214, -155.0548). It is situated on the north side of Hilo Bay, and is bordered by the Wailuku River to the east and the Wailoa River to the west. The town is located at an elevation of approximately 20 feet (6.1 m) above sea level.
The climate in Wainaku is tropical, with temperatures ranging from an average low of 65°F (18°C) in the winter to an average high of 85°F (29°C) in the summer. The town receives an average of about 75 inches (190 cm) of rain per year.
History
The area that is now Wainaku was originally inhabited by the native Hawaiian people. The first Europeans to visit the area were the crew of the HMS Resolution, which arrived in 1779. The town was founded in 1856 by American missionaries, who named it after the nearby Wainaku River.
In the late 19th century, Wainaku was a thriving port town, with a population of over 1,000 people. The town was home to a number of businesses, including a sugar mill, a sawmill, and a fish cannery. The town also had a number of churches, schools, and other civic buildings.
In the early 20th century, the town began to decline as the sugar industry moved away from the area. By the 1950s, the population had dropped to just over 500 people. In the late 20th century, the town began to experience a resurgence, as new businesses and residents moved into the area.
Economy
The economy of Wainaku is largely based on tourism and agriculture. The town is home to a number of small businesses, including restaurants, shops, and galleries. The town is also home to a number of farms, which produce a variety of fruits and vegetables.
The town is also home to a number of government offices, including the Hawaii County Courthouse and the Hawaii County Police Department.
Demographics
As of the 2010 census, the population of Wainaku was 1,845. The racial makeup of the town was 57.3% White, 0.7% African American, 0.3% Native American, 24.2% Asian, 0.2% Pacific Islander, 11.2% from other races, and 6.2% from two or more races. Hispanic or Latino of any race were 20.2% of the population.
The median income for a household in Wainaku was $45,938, and the median income for a family was $50,938. The per capita income for the town was $20,938. About 11.2% of families and 14.2% of the population were below the poverty line, including 18.2% of those under age 18 and 8.2% of those age 65 or over.
Conclusion
Wainaku is a small town located on the island of Hawaii in the United States. It is situated in the Hilo District of Hawaii County, and is part of the Hilo-Wainaku-Papaikou CDP. The town is located on the north side of Hilo Bay, and is bordered by the Wailuku River to the east and the Wailoa River to the west. The population of Wainaku was 1,845 at the 2010 census.
The economy of Wainaku is largely based on tourism and agriculture. The town is home to a number of small businesses, including restaurants, shops, and galleries. The town is also home to a number of farms, which produce a variety of fruits and vegetables. The town is also home to a number of government offices, including the Hawaii County Courthouse and the Hawaii County Police Department.
The racial makeup of the town was 57.3% White, 0.7% African American, 0.3% Native American, 24.2% Asian, 0.2% Pacific Islander, 11.2% from other races, and 6.2% from two or more races. Hispanic or Latino of any race were 20.2% of the population. The median income for a household in Wainaku was $45,938, and the median income for a family was $50,938. The per capita income for the town was $20,938. About 11.2% of families and 14.2% of the population were below the poverty line, including 18.2% of those under age 18 and 8.2% of those age 65 or over.
Common Questions
What is Per Capita Income in Wainaku?
Per Capita income in Wainaku is $31,501.
What is the Median Family Income in Wainaku?
Median Family Income in Wainaku is $75,857.
What is the Median Household income in Wainaku?
Median Household Income in Wainaku is $62,880.
What is Income or Wage Gap in Wainaku?
Income or Wage Gap in Wainaku is 22.4%.
Women in Wainaku earn 77.6 cents for every dollar earned by a man.
What is Family Income Deficit in Wainaku?
Family Income Deficit in Wainaku is $11,910.
Families that are below poverty line in Wainaku earn $11,910 less on average than the poverty threshold level.
What is Inequality or Gini Index in Wainaku?
Inequality or Gini Index in Wainaku is 0.44.
What is the Total Population of Wainaku?
Total Population of Wainaku is 1,023.
What is the Total Male Population of Wainaku?
Total Male Population of Wainaku is 465.
What is the Total Female Population of Wainaku?
Total Female Population of Wainaku is 558.
What is the Ratio of Males per 100 Females in Wainaku?
There are 83.33 Males per 100 Females in Wainaku.
What is the Ratio of Females per 100 Males in Wainaku?
There are 120.00 Females per 100 Males in Wainaku.
What is the Median Population Age in Wainaku?
Median Population Age in Wainaku is 44.5 Years.
What is the Average Family Size in Wainaku
Average Family Size in Wainaku is 3.3 People.
What is the Average Household Size in Wainaku
Average Household Size in Wainaku is 2.7 People.
How Large is the Labor Force in Wainaku?
There are 464 People in the Labor Forcein in Wainaku.
What is the Percentage of People in the Labor Force in Wainaku?
57.0% of People are in the Labor Force in Wainaku.
What is the Unemployment Rate in Wainaku?
Unemployment Rate in Wainaku is 4.8%.