Puhi, HI Map & Demographics
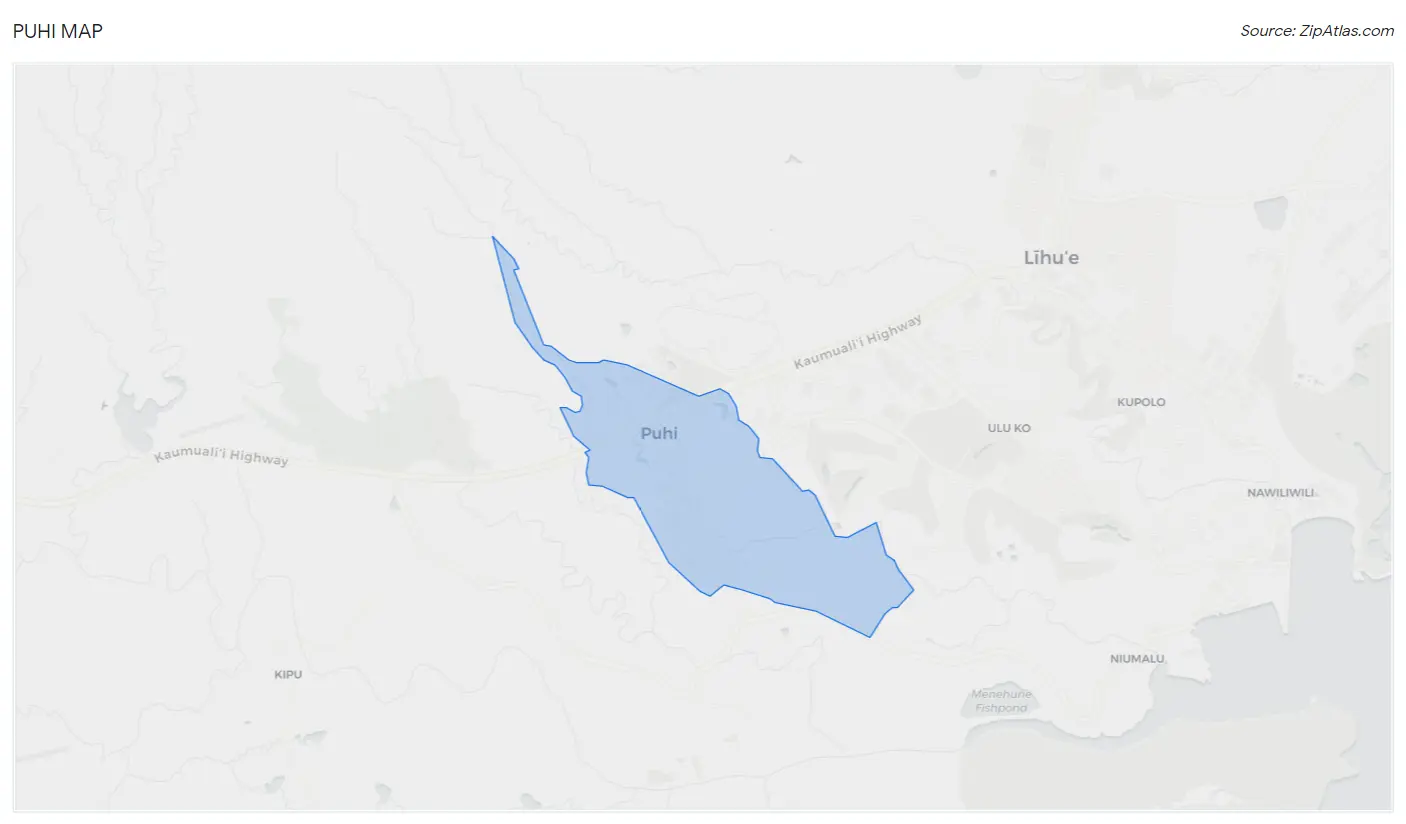
Puhi Map
Puhi Overview
$33,064
PER CAPITA INCOME
$119,779
AVG FAMILY INCOME
$118,676
AVG HOUSEHOLD INCOME
34.0%
WAGE / INCOME GAP [ % ]
66.0¢/ $1
WAGE / INCOME GAP [ $ ]
0.30
INEQUALITY / GINI INDEX
3,961
TOTAL POPULATION
1,999
MALE POPULATION
1,962
FEMALE POPULATION
101.89
MALES / 100 FEMALES
98.15
FEMALES / 100 MALES
38.5
MEDIAN AGE
4.0
AVG FAMILY SIZE
3.9
AVG HOUSEHOLD SIZE
2,403
LABOR FORCE [ PEOPLE ]
75.2%
PERCENT IN LABOR FORCE
2.8%
UNEMPLOYMENT RATE
Income in Puhi
Income Overview in Puhi
Per Capita Income in Puhi is $33,064, while median incomes of families and households are $119,779 and $118,676 respectively.
| Characteristic | Number | Measure |
| Per Capita Income | 3,961 | $33,064 |
| Median Family Income | 897 | $119,779 |
| Mean Family Income | 897 | $117,180 |
| Median Household Income | 1,008 | $118,676 |
| Mean Household Income | 1,008 | $117,910 |
| Income Deficit | 897 | $0 |
| Wage / Income Gap (%) | 3,961 | 34.00% |
| Wage / Income Gap ($) | 3,961 | 66.00¢ per $1 |
| Gini / Inequality Index | 3,961 | 0.30 |
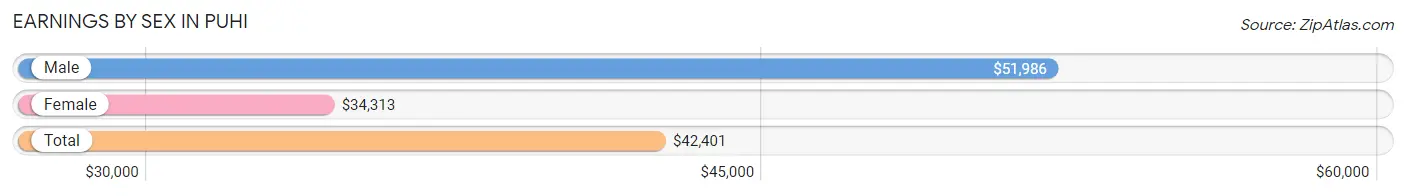
Earnings by Sex in Puhi
Average Earnings in Puhi are $42,401, $51,986 for men and $34,313 for women, a difference of 34.0%.
| Sex | Number | Average Earnings |
| Male | 1,204 (49.9%) | $51,986 |
| Female | 1,207 (50.1%) | $34,313 |
| Total | 2,411 (100.0%) | $42,401 |
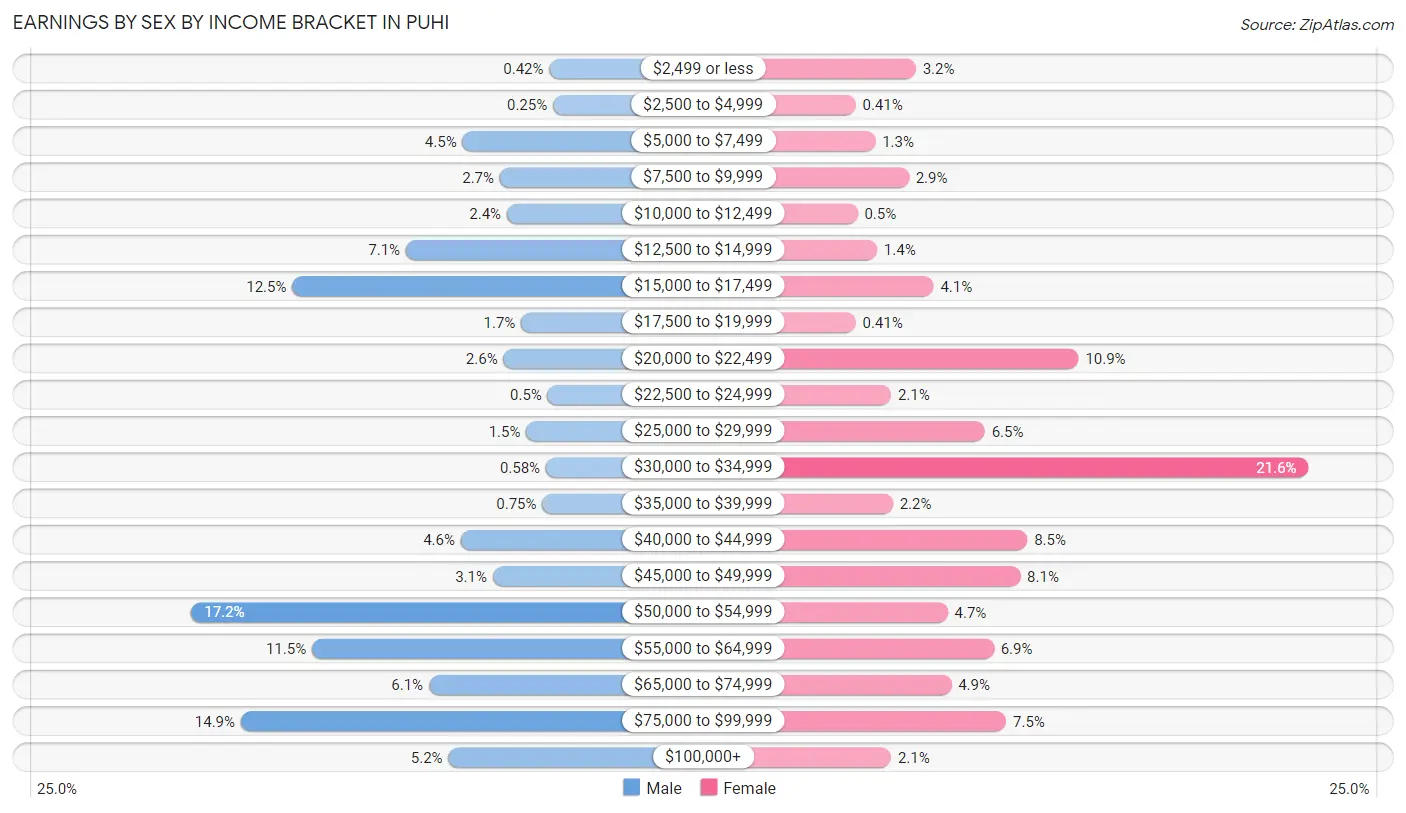
Earnings by Sex by Income Bracket in Puhi
The most common earnings brackets in Puhi are $50,000 to $54,999 for men (207 | 17.2%) and $30,000 to $34,999 for women (261 | 21.6%).
| Income | Male | Female |
| $2,499 or less | 5 (0.4%) | 39 (3.2%) |
| $2,500 to $4,999 | 3 (0.3%) | 5 (0.4%) |
| $5,000 to $7,499 | 54 (4.5%) | 16 (1.3%) |
| $7,500 to $9,999 | 33 (2.7%) | 35 (2.9%) |
| $10,000 to $12,499 | 29 (2.4%) | 6 (0.5%) |
| $12,500 to $14,999 | 86 (7.1%) | 17 (1.4%) |
| $15,000 to $17,499 | 150 (12.5%) | 49 (4.1%) |
| $17,500 to $19,999 | 21 (1.7%) | 5 (0.4%) |
| $20,000 to $22,499 | 31 (2.6%) | 131 (10.8%) |
| $22,500 to $24,999 | 6 (0.5%) | 25 (2.1%) |
| $25,000 to $29,999 | 18 (1.5%) | 78 (6.5%) |
| $30,000 to $34,999 | 7 (0.6%) | 261 (21.6%) |
| $35,000 to $39,999 | 9 (0.7%) | 26 (2.1%) |
| $40,000 to $44,999 | 55 (4.6%) | 102 (8.5%) |
| $45,000 to $49,999 | 37 (3.1%) | 98 (8.1%) |
| $50,000 to $54,999 | 207 (17.2%) | 57 (4.7%) |
| $55,000 to $64,999 | 139 (11.5%) | 83 (6.9%) |
| $65,000 to $74,999 | 73 (6.1%) | 59 (4.9%) |
| $75,000 to $99,999 | 179 (14.9%) | 90 (7.5%) |
| $100,000+ | 62 (5.1%) | 25 (2.1%) |
| Total | 1,204 (100.0%) | 1,207 (100.0%) |
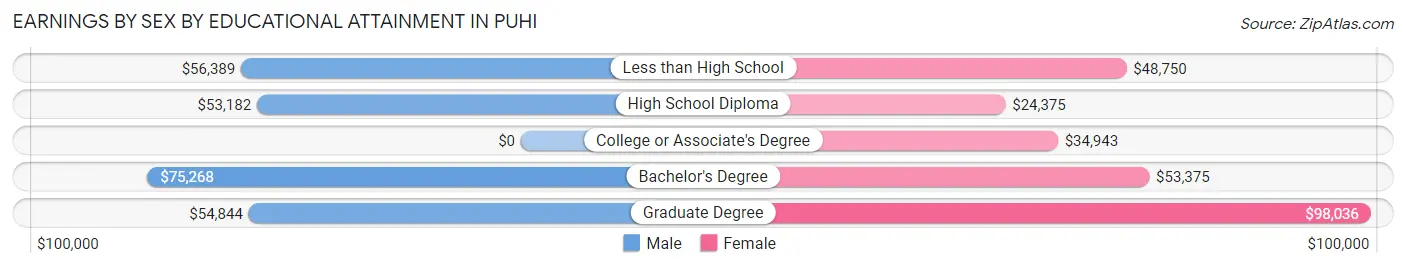
Earnings by Sex by Educational Attainment in Puhi
Average earnings in Puhi are $53,228 for men and $34,789 for women, a difference of 34.6%. Men with an educational attainment of bachelor's degree enjoy the highest average annual earnings of $75,268, while those with high school diploma education earn the least with $53,182. Women with an educational attainment of graduate degree earn the most with the average annual earnings of $98,036, while those with high school diploma education have the smallest earnings of $24,375.
| Educational Attainment | Male Income | Female Income |
| Less than High School | $56,389 | $48,750 |
| High School Diploma | $53,182 | $24,375 |
| College or Associate's Degree | - | - |
| Bachelor's Degree | $75,268 | $53,375 |
| Graduate Degree | $54,844 | $98,036 |
| Total | $53,228 | $34,789 |
Family Income in Puhi
Family Income Brackets in Puhi
According to the Puhi family income data, there are 283 families falling into the $100,000 to $149,999 income range, which is the most common income bracket and makes up 31.6% of all families.
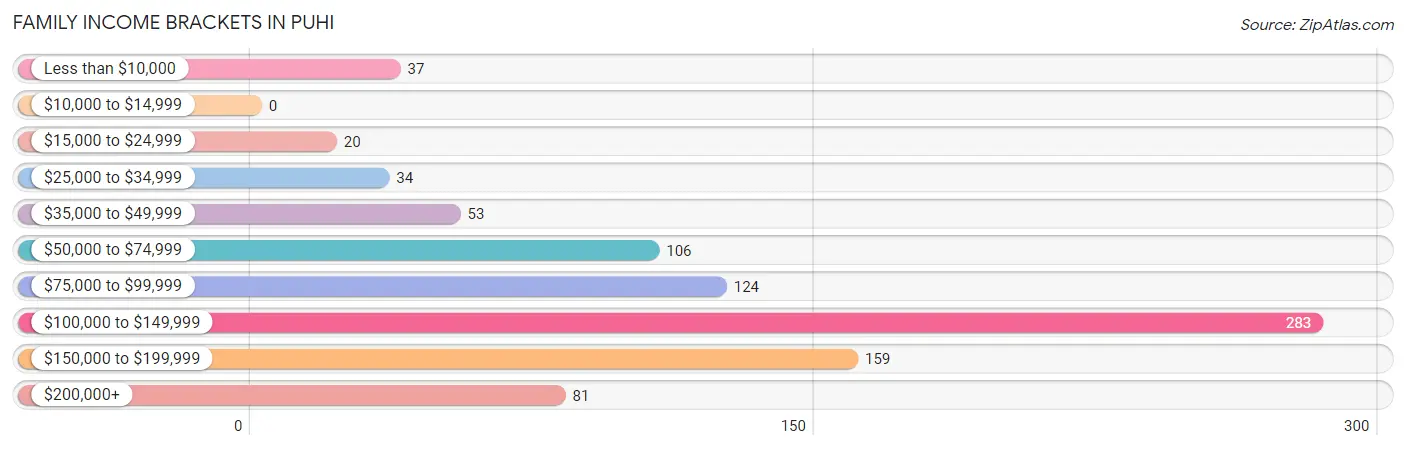
| Income Bracket | # Families | % Families |
| Less than $10,000 | 37 | 4.1% |
| $10,000 to $14,999 | 0 | 0.0% |
| $15,000 to $24,999 | 20 | 2.2% |
| $25,000 to $34,999 | 34 | 3.8% |
| $35,000 to $49,999 | 53 | 5.9% |
| $50,000 to $74,999 | 106 | 11.8% |
| $75,000 to $99,999 | 124 | 13.8% |
| $100,000 to $149,999 | 283 | 31.5% |
| $150,000 to $199,999 | 159 | 17.7% |
| $200,000+ | 81 | 9.0% |
Family Income by Famaliy Size in Puhi
7+ person families (35 | 3.9%) account for the highest median family income in Puhi with $250,001 per family, while 2-person families (400 | 44.6%) have the highest median income of $52,812 per family member.
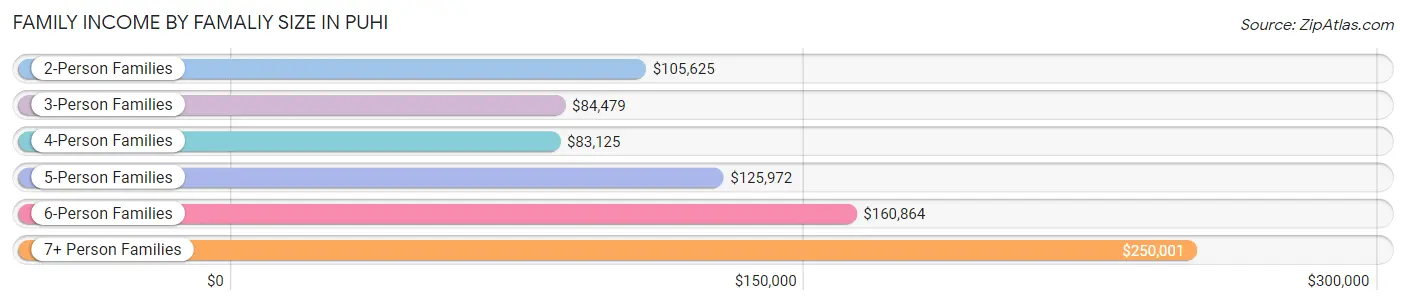
| Income Bracket | # Families | Median Income |
| 2-Person Families | 400 (44.6%) | $105,625 |
| 3-Person Families | 107 (11.9%) | $84,479 |
| 4-Person Families | 176 (19.6%) | $83,125 |
| 5-Person Families | 56 (6.2%) | $125,972 |
| 6-Person Families | 123 (13.7%) | $160,864 |
| 7+ Person Families | 35 (3.9%) | $250,001 |
| Total | 897 (100.0%) | $119,779 |
Family Income by Number of Earners in Puhi
The median family income in Puhi is $119,779, with families comprising 3+ earners (239) having the highest median family income of $161,396, while families with no earners (65) have the lowest median family income of $50,288, accounting for 26.6% and 7.2% of families, respectively.
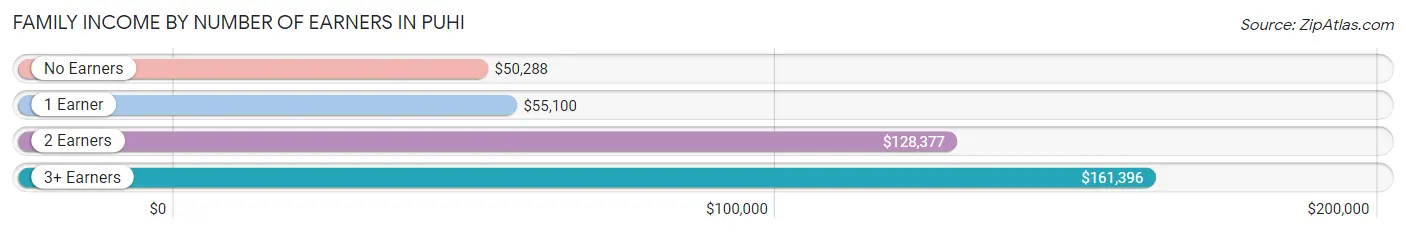
| Number of Earners | # Families | Median Income |
| No Earners | 65 (7.2%) | $50,288 |
| 1 Earner | 218 (24.3%) | $55,100 |
| 2 Earners | 375 (41.8%) | $128,377 |
| 3+ Earners | 239 (26.6%) | $161,396 |
| Total | 897 (100.0%) | $119,779 |
Household Income in Puhi
Household Income Brackets in Puhi
With 308 households falling in the category, the $100,000 to $149,999 income range is the most frequent in Puhi, accounting for 30.6% of all households.
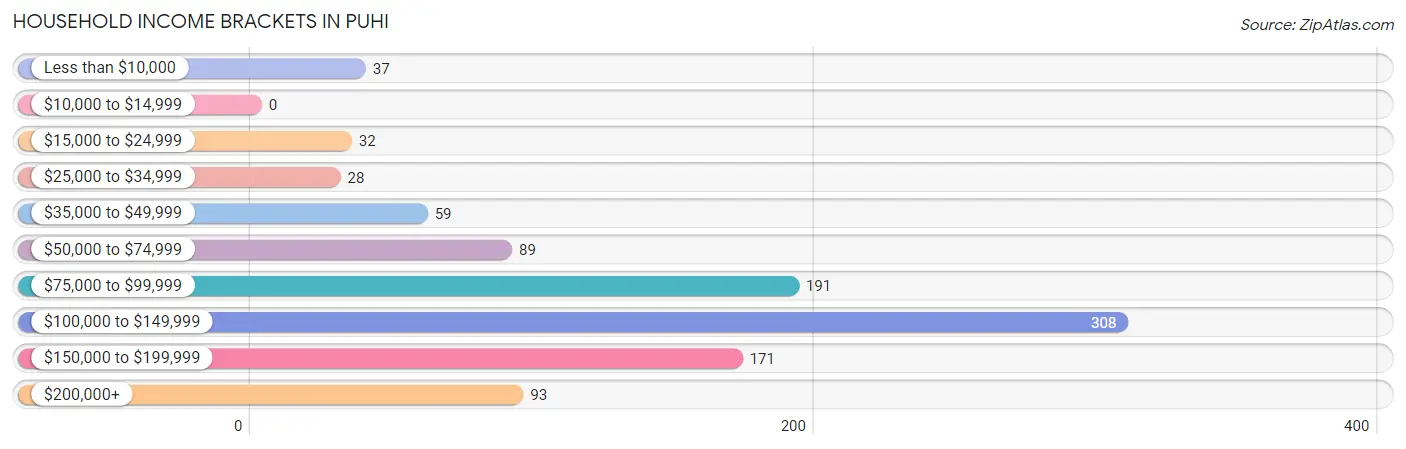
| Income Bracket | # Households | % Households |
| Less than $10,000 | 37 | 3.7% |
| $10,000 to $14,999 | 0 | 0.0% |
| $15,000 to $24,999 | 32 | 3.2% |
| $25,000 to $34,999 | 28 | 2.8% |
| $35,000 to $49,999 | 59 | 5.9% |
| $50,000 to $74,999 | 89 | 8.8% |
| $75,000 to $99,999 | 191 | 18.9% |
| $100,000 to $149,999 | 308 | 30.6% |
| $150,000 to $199,999 | 171 | 17.0% |
| $200,000+ | 93 | 9.2% |
Household Income by Householder Age in Puhi
The median household income in Puhi is $118,676, with the highest median household income of $135,231 found in the 45 to 64 years age bracket for the primary householder. A total of 529 households (52.5%) fall into this category.
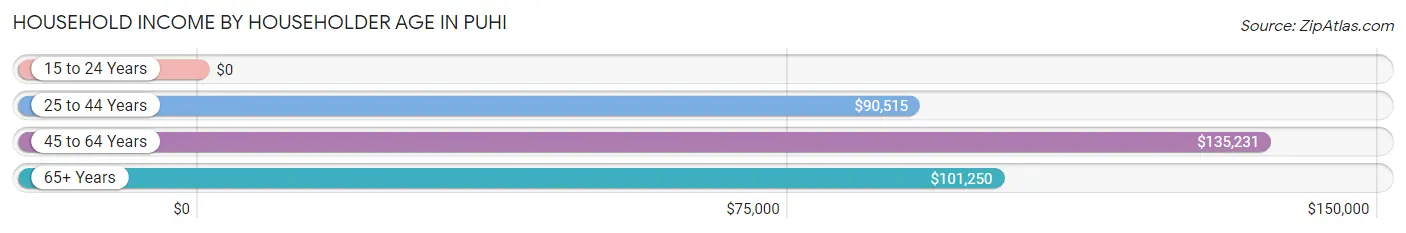
| Income Bracket | # Households | Median Income |
| 15 to 24 Years | 0 (0.0%) | $0 |
| 25 to 44 Years | 235 (23.3%) | $90,515 |
| 45 to 64 Years | 529 (52.5%) | $135,231 |
| 65+ Years | 244 (24.2%) | $101,250 |
| Total | 1,008 (100.0%) | $118,676 |
Poverty in Puhi
Income Below Poverty by Sex and Age in Puhi
With 5.9% poverty level for males and 6.3% for females among the residents of Puhi, 12 to 14 year old males and 12 to 14 year old females are the most vulnerable to poverty, with 46 males (64.8%) and 32 females (38.6%) in their respective age groups living below the poverty level.
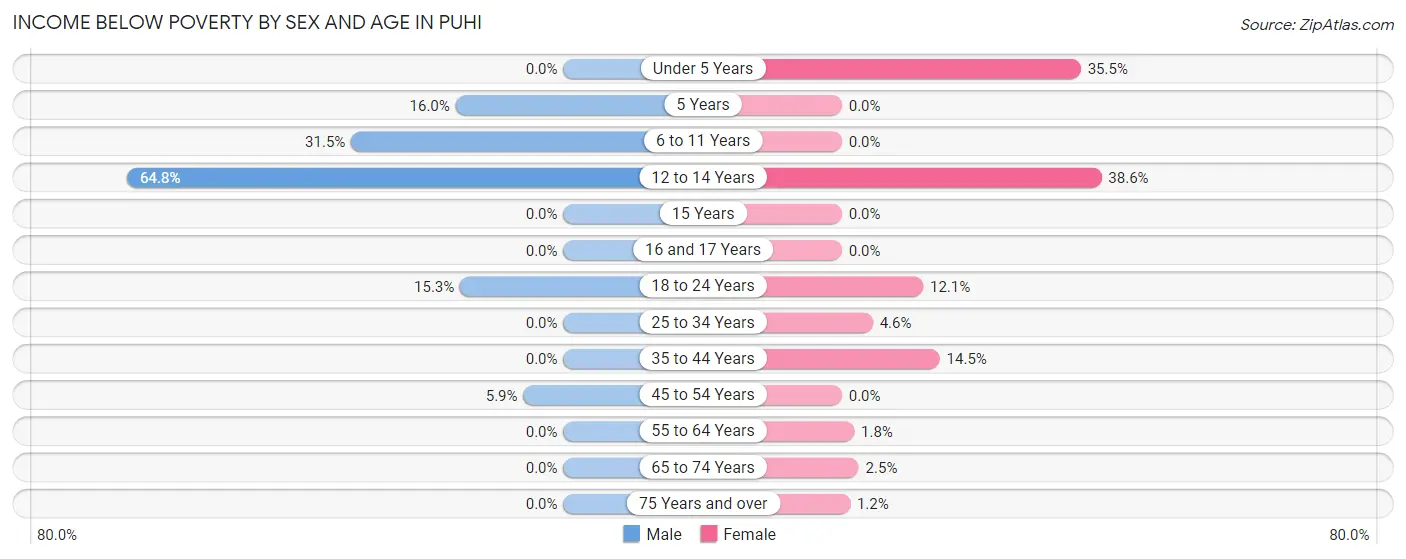
| Age Bracket | Male | Female |
| Under 5 Years | 0 (0.0%) | 22 (35.5%) |
| 5 Years | 8 (16.0%) | 0 (0.0%) |
| 6 to 11 Years | 23 (31.5%) | 0 (0.0%) |
| 12 to 14 Years | 46 (64.8%) | 32 (38.6%) |
| 15 Years | 0 (0.0%) | 0 (0.0%) |
| 16 and 17 Years | 0 (0.0%) | 0 (0.0%) |
| 18 to 24 Years | 23 (15.3%) | 17 (12.1%) |
| 25 to 34 Years | 0 (0.0%) | 15 (4.6%) |
| 35 to 44 Years | 0 (0.0%) | 25 (14.5%) |
| 45 to 54 Years | 17 (5.9%) | 0 (0.0%) |
| 55 to 64 Years | 0 (0.0%) | 4 (1.8%) |
| 65 to 74 Years | 0 (0.0%) | 5 (2.5%) |
| 75 Years and over | 0 (0.0%) | 3 (1.2%) |
| Total | 117 (5.9%) | 123 (6.3%) |
Income Above Poverty by Sex and Age in Puhi
According to the poverty statistics in Puhi, males aged under 5 years and females aged 6 to 11 years are the age groups that are most secure financially, with 100.0% of males and 100.0% of females in these age groups living above the poverty line.
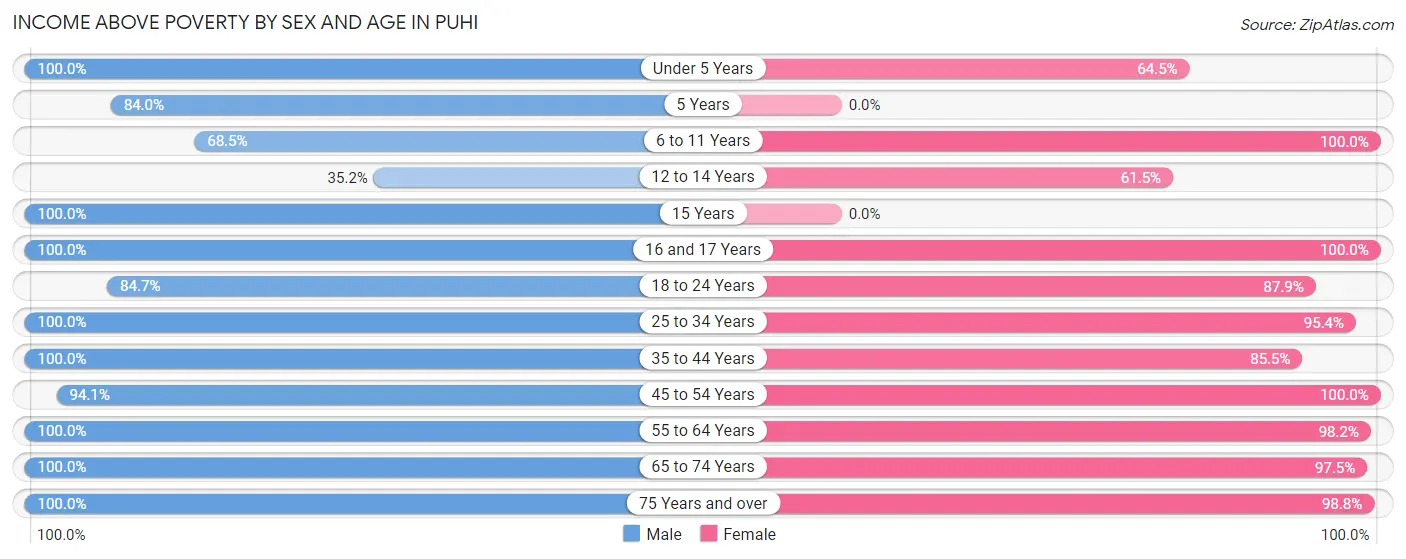
| Age Bracket | Male | Female |
| Under 5 Years | 225 (100.0%) | 40 (64.5%) |
| 5 Years | 42 (84.0%) | 0 (0.0%) |
| 6 to 11 Years | 50 (68.5%) | 172 (100.0%) |
| 12 to 14 Years | 25 (35.2%) | 51 (61.5%) |
| 15 Years | 18 (100.0%) | 0 (0.0%) |
| 16 and 17 Years | 75 (100.0%) | 13 (100.0%) |
| 18 to 24 Years | 127 (84.7%) | 124 (87.9%) |
| 25 to 34 Years | 375 (100.0%) | 312 (95.4%) |
| 35 to 44 Years | 196 (100.0%) | 147 (85.5%) |
| 45 to 54 Years | 269 (94.1%) | 313 (100.0%) |
| 55 to 64 Years | 310 (100.0%) | 215 (98.2%) |
| 65 to 74 Years | 81 (100.0%) | 195 (97.5%) |
| 75 Years and over | 89 (100.0%) | 245 (98.8%) |
| Total | 1,882 (94.2%) | 1,827 (93.7%) |
Income Below Poverty Among Married-Couple Families in Puhi
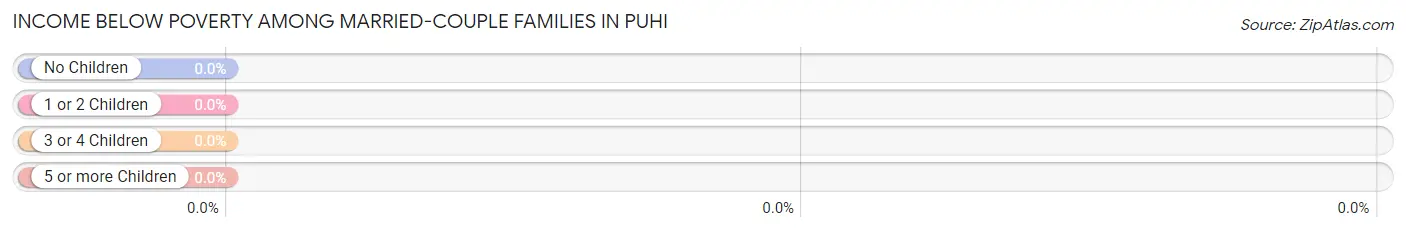
| Children | Above Poverty | Below Poverty |
| No Children | 484 (100.0%) | 0 (0.0%) |
| 1 or 2 Children | 152 (100.0%) | 0 (0.0%) |
| 3 or 4 Children | 26 (100.0%) | 0 (0.0%) |
| 5 or more Children | 2 (100.0%) | 0 (0.0%) |
| Total | 664 (100.0%) | 0 (0.0%) |
Income Below Poverty Among Single-Parent Households in Puhi
According to the poverty data in Puhi, 38.6% or 17 single-father households and 21.2% or 40 single-mother households are living below the poverty line. Among single-father households, those with 1 or 2 children have the highest poverty rate, with 17 households (77.3%) experiencing poverty. Likewise, among single-mother households, those with 1 or 2 children have the highest poverty rate, with 27 households (39.1%) falling below the poverty line.
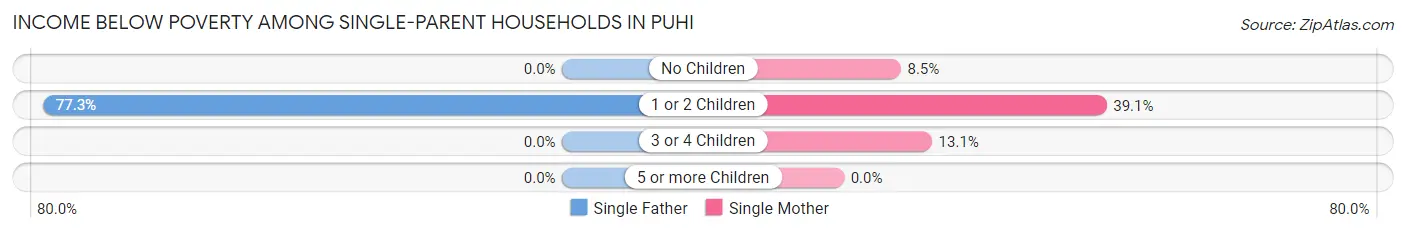
| Children | Single Father | Single Mother |
| No Children | 0 (0.0%) | 5 (8.5%) |
| 1 or 2 Children | 17 (77.3%) | 27 (39.1%) |
| 3 or 4 Children | 0 (0.0%) | 8 (13.1%) |
| 5 or more Children | 0 (0.0%) | 0 (0.0%) |
| Total | 17 (38.6%) | 40 (21.2%) |
Income Below Poverty Among Married-Couple vs Single-Parent Households in Puhi
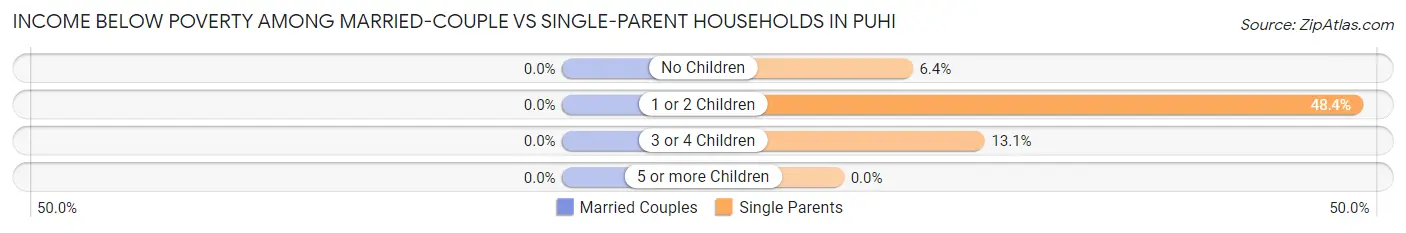
| Children | Married-Couple Families | Single-Parent Households |
| No Children | 0 (0.0%) | 5 (6.4%) |
| 1 or 2 Children | 0 (0.0%) | 44 (48.3%) |
| 3 or 4 Children | 0 (0.0%) | 8 (13.1%) |
| 5 or more Children | 0 (0.0%) | 0 (0.0%) |
| Total | 0 (0.0%) | 57 (24.5%) |
Race in Puhi
The most populous races in Puhi are Asian (2,143 | 54.1%), Two or more Races (1,049 | 26.5%), and White / Caucasian (576 | 14.5%).
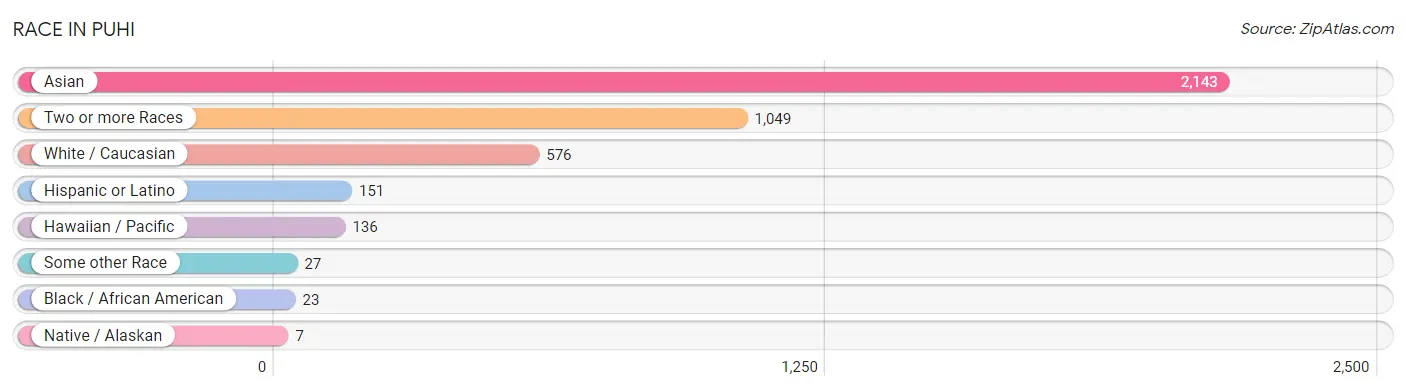
| Race | # Population | % Population |
| Asian | 2,143 | 54.1% |
| Black / African American | 23 | 0.6% |
| Hawaiian / Pacific | 136 | 3.4% |
| Hispanic or Latino | 151 | 3.8% |
| Native / Alaskan | 7 | 0.2% |
| White / Caucasian | 576 | 14.5% |
| Two or more Races | 1,049 | 26.5% |
| Some other Race | 27 | 0.7% |
| Total | 3,961 | 100.0% |
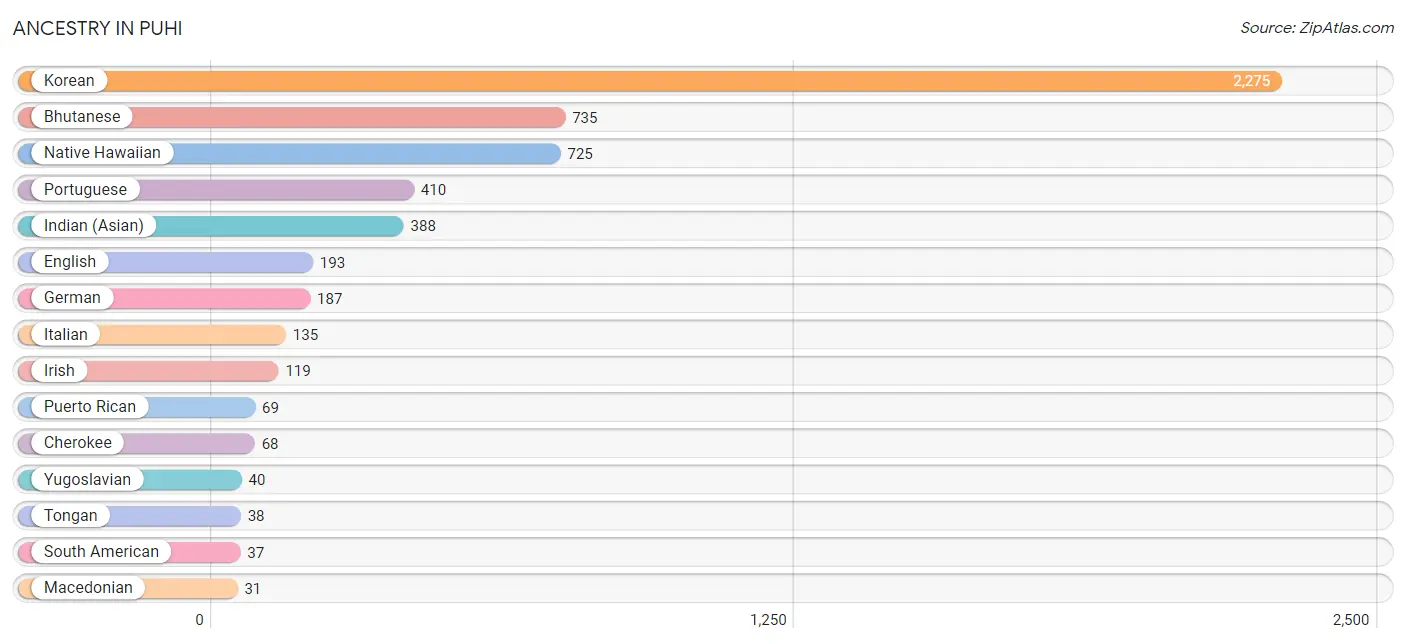
Ancestry in Puhi
The most populous ancestries reported in Puhi are Korean (2,275 | 57.4%), Bhutanese (735 | 18.6%), Native Hawaiian (725 | 18.3%), Portuguese (410 | 10.3%), and Indian (Asian) (388 | 9.8%), together accounting for 114.4% of all Puhi residents.
| Ancestry | # Population | % Population |
| Arab | 5 | 0.1% |
| Belgian | 5 | 0.1% |
| Bhutanese | 735 | 18.6% |
| Burmese | 11 | 0.3% |
| Central American | 28 | 0.7% |
| Cherokee | 68 | 1.7% |
| Cheyenne | 8 | 0.2% |
| Chinese | 8 | 0.2% |
| Choctaw | 8 | 0.2% |
| Colombian | 21 | 0.5% |
| Danish | 9 | 0.2% |
| Dutch | 5 | 0.1% |
| Ecuadorian | 16 | 0.4% |
| English | 193 | 4.9% |
| European | 21 | 0.5% |
| French | 10 | 0.3% |
| German | 187 | 4.7% |
| Greek | 5 | 0.1% |
| Guamanian / Chamorro | 9 | 0.2% |
| Guatemalan | 28 | 0.7% |
| Indian (Asian) | 388 | 9.8% |
| Irish | 119 | 3.0% |
| Italian | 135 | 3.4% |
| Korean | 2,275 | 57.4% |
| Lebanese | 5 | 0.1% |
| Macedonian | 31 | 0.8% |
| Mexican | 17 | 0.4% |
| Native Hawaiian | 725 | 18.3% |
| Norwegian | 31 | 0.8% |
| Polish | 15 | 0.4% |
| Portuguese | 410 | 10.3% |
| Potawatomi | 7 | 0.2% |
| Puerto Rican | 69 | 1.7% |
| Russian | 11 | 0.3% |
| Samoan | 27 | 0.7% |
| Scandinavian | 12 | 0.3% |
| Scottish | 15 | 0.4% |
| South American | 37 | 0.9% |
| Sri Lankan | 26 | 0.7% |
| Swedish | 16 | 0.4% |
| Thai | 17 | 0.4% |
| Tongan | 38 | 1.0% |
| Yugoslavian | 40 | 1.0% | View All 43 Rows |
Immigrants in Puhi
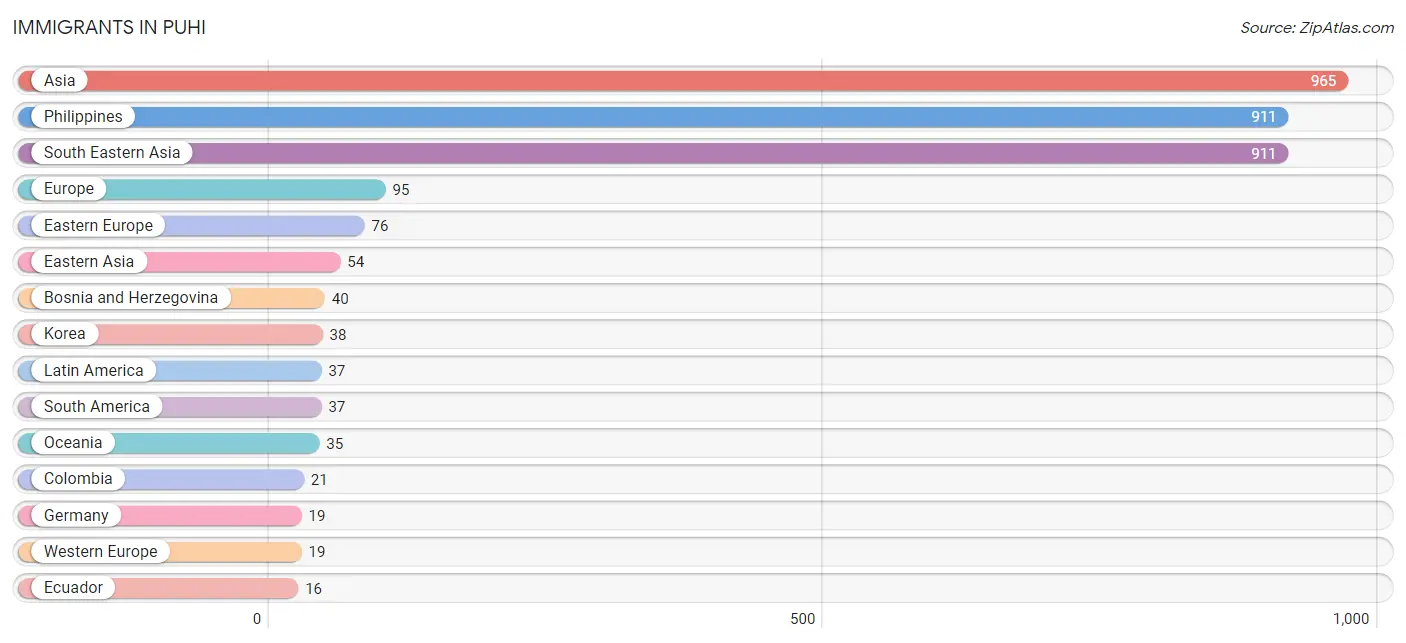
The most numerous immigrant groups reported in Puhi came from Asia (965 | 24.4%), Philippines (911 | 23.0%), South Eastern Asia (911 | 23.0%), Europe (95 | 2.4%), and Eastern Europe (76 | 1.9%), together accounting for 74.7% of all Puhi residents.
| Immigration Origin | # Population | % Population |
| Asia | 965 | 24.4% |
| Bosnia and Herzegovina | 40 | 1.0% |
| Colombia | 21 | 0.5% |
| Eastern Asia | 54 | 1.4% |
| Eastern Europe | 76 | 1.9% |
| Ecuador | 16 | 0.4% |
| Europe | 95 | 2.4% |
| Fiji | 4 | 0.1% |
| Germany | 19 | 0.5% |
| Japan | 16 | 0.4% |
| Korea | 38 | 1.0% |
| Latin America | 37 | 0.9% |
| Oceania | 35 | 0.9% |
| Philippines | 911 | 23.0% |
| South America | 37 | 0.9% |
| South Eastern Asia | 911 | 23.0% |
| Western Europe | 19 | 0.5% | View All 17 Rows |
Sex and Age in Puhi
Sex and Age in Puhi
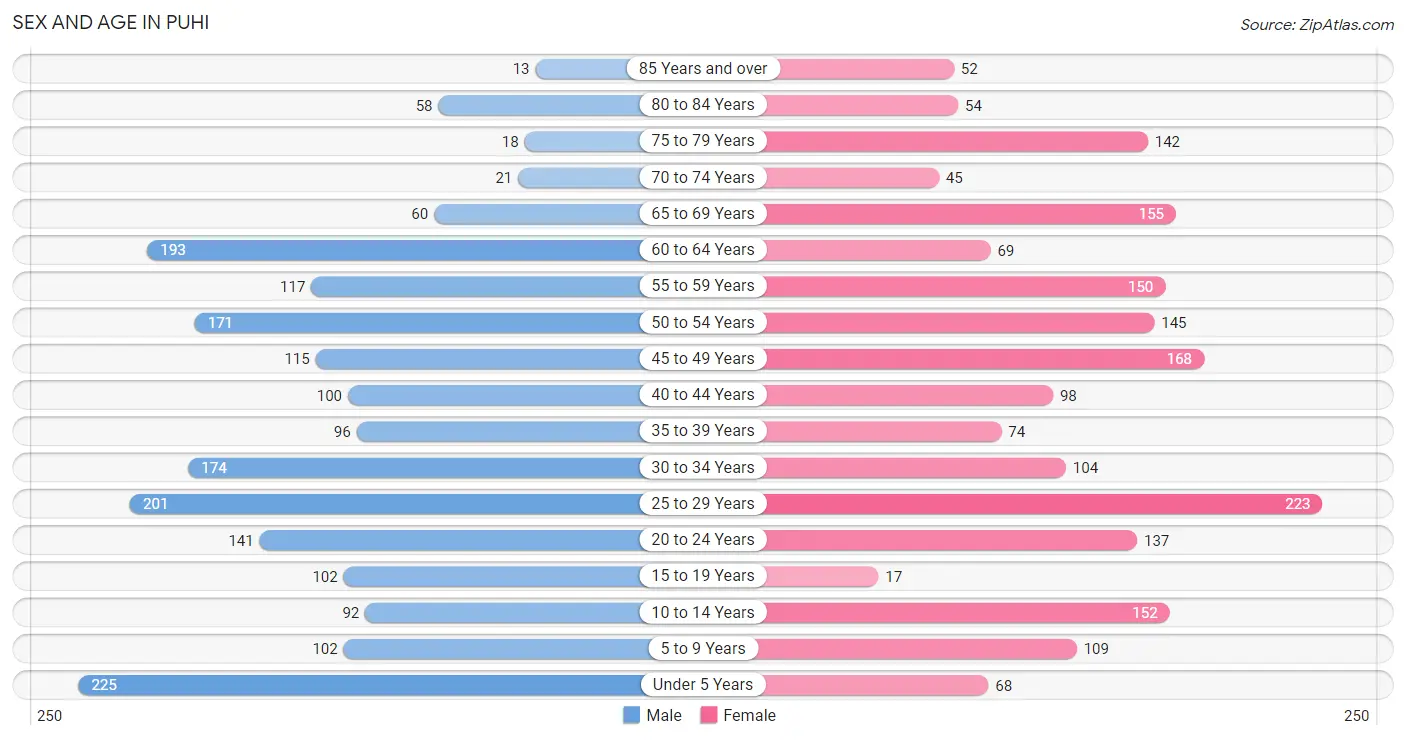
The most populous age groups in Puhi are Under 5 Years (225 | 11.3%) for men and 25 to 29 Years (223 | 11.4%) for women.
| Age Bracket | Male | Female |
| Under 5 Years | 225 (11.3%) | 68 (3.5%) |
| 5 to 9 Years | 102 (5.1%) | 109 (5.6%) |
| 10 to 14 Years | 92 (4.6%) | 152 (7.7%) |
| 15 to 19 Years | 102 (5.1%) | 17 (0.9%) |
| 20 to 24 Years | 141 (7.0%) | 137 (7.0%) |
| 25 to 29 Years | 201 (10.1%) | 223 (11.4%) |
| 30 to 34 Years | 174 (8.7%) | 104 (5.3%) |
| 35 to 39 Years | 96 (4.8%) | 74 (3.8%) |
| 40 to 44 Years | 100 (5.0%) | 98 (5.0%) |
| 45 to 49 Years | 115 (5.8%) | 168 (8.6%) |
| 50 to 54 Years | 171 (8.6%) | 145 (7.4%) |
| 55 to 59 Years | 117 (5.9%) | 150 (7.6%) |
| 60 to 64 Years | 193 (9.7%) | 69 (3.5%) |
| 65 to 69 Years | 60 (3.0%) | 155 (7.9%) |
| 70 to 74 Years | 21 (1.1%) | 45 (2.3%) |
| 75 to 79 Years | 18 (0.9%) | 142 (7.2%) |
| 80 to 84 Years | 58 (2.9%) | 54 (2.8%) |
| 85 Years and over | 13 (0.6%) | 52 (2.6%) |
| Total | 1,999 (100.0%) | 1,962 (100.0%) |
Families and Households in Puhi
Median Family Size in Puhi
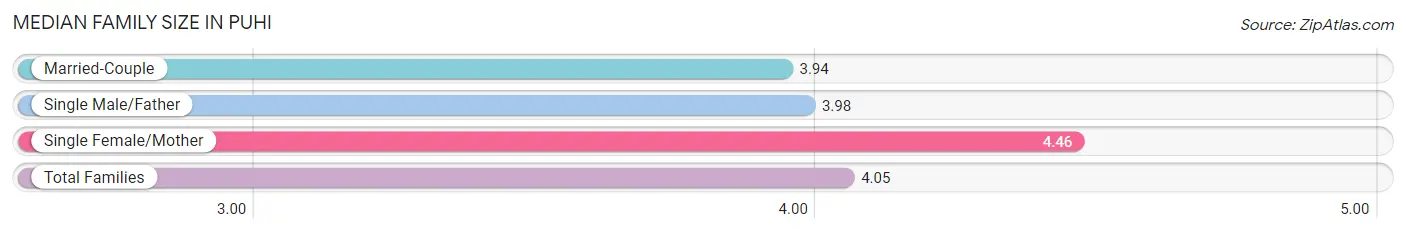
The median family size in Puhi is 4.05 persons per family, with single female/mother families (189 | 21.1%) accounting for the largest median family size of 4.46 persons per family. On the other hand, married-couple families (664 | 74.0%) represent the smallest median family size with 3.94 persons per family.
| Family Type | # Families | Family Size |
| Married-Couple | 664 (74.0%) | 3.94 |
| Single Male/Father | 44 (4.9%) | 3.98 |
| Single Female/Mother | 189 (21.1%) | 4.46 |
| Total Families | 897 (100.0%) | 4.05 |
Median Household Size in Puhi
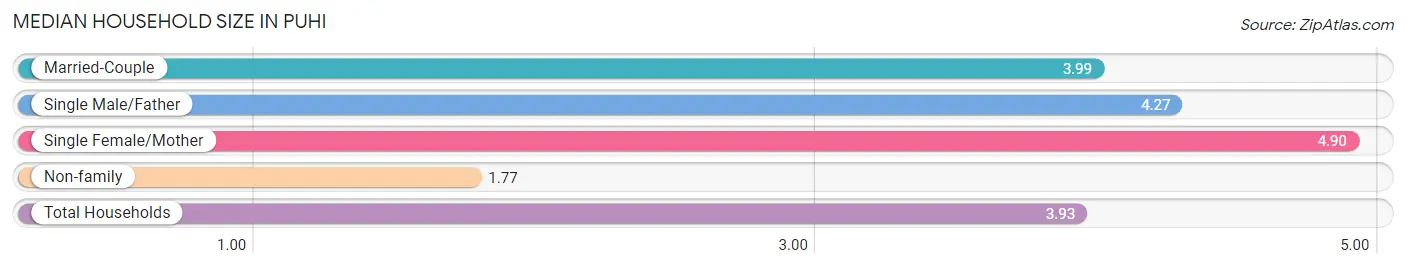
The median household size in Puhi is 3.93 persons per household, with single female/mother households (189 | 18.8%) accounting for the largest median household size of 4.9 persons per household. non-family households (111 | 11.0%) represent the smallest median household size with 1.77 persons per household.
| Household Type | # Households | Household Size |
| Married-Couple | 664 (65.9%) | 3.99 |
| Single Male/Father | 44 (4.4%) | 4.27 |
| Single Female/Mother | 189 (18.8%) | 4.90 |
| Non-family | 111 (11.0%) | 1.77 |
| Total Households | 1,008 (100.0%) | 3.93 |
Household Size by Marriage Status in Puhi
Out of a total of 1,008 households in Puhi, 897 (89.0%) are family households, while 111 (11.0%) are nonfamily households. The most numerous type of family households are 2-person households, comprising 353, and the most common type of nonfamily households are 1-person households, comprising 78.
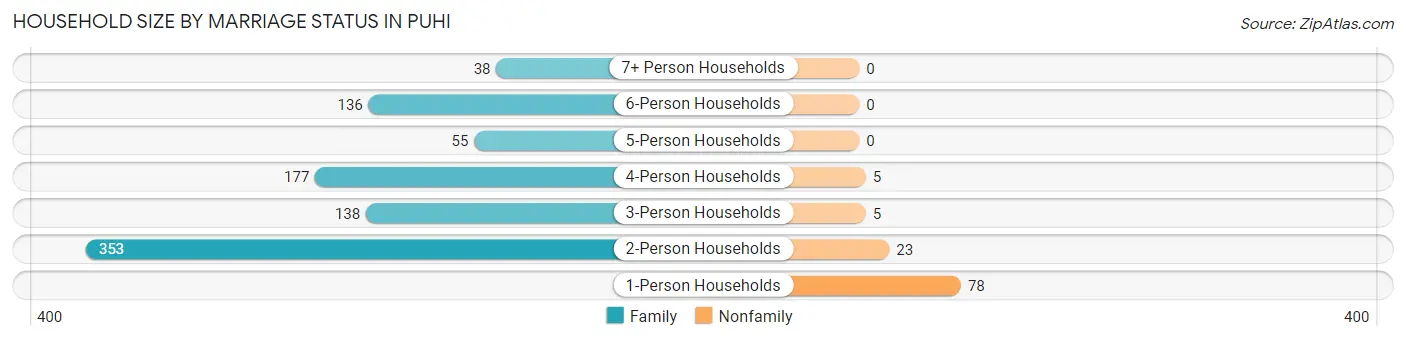
| Household Size | Family Households | Nonfamily Households |
| 1-Person Households | - | 78 (7.7%) |
| 2-Person Households | 353 (35.0%) | 23 (2.3%) |
| 3-Person Households | 138 (13.7%) | 5 (0.5%) |
| 4-Person Households | 177 (17.6%) | 5 (0.5%) |
| 5-Person Households | 55 (5.5%) | 0 (0.0%) |
| 6-Person Households | 136 (13.5%) | 0 (0.0%) |
| 7+ Person Households | 38 (3.8%) | 0 (0.0%) |
| Total | 897 (89.0%) | 111 (11.0%) |
Female Fertility in Puhi
Fertility by Age in Puhi
Average fertility rate in Puhi is 71.0 births per 1,000 women. Women in the age bracket of 20 to 34 years have the highest fertility rate with 119.0 births per 1,000 women. Women in the age bracket of 20 to 34 years acount for 88.7% of all women with births.
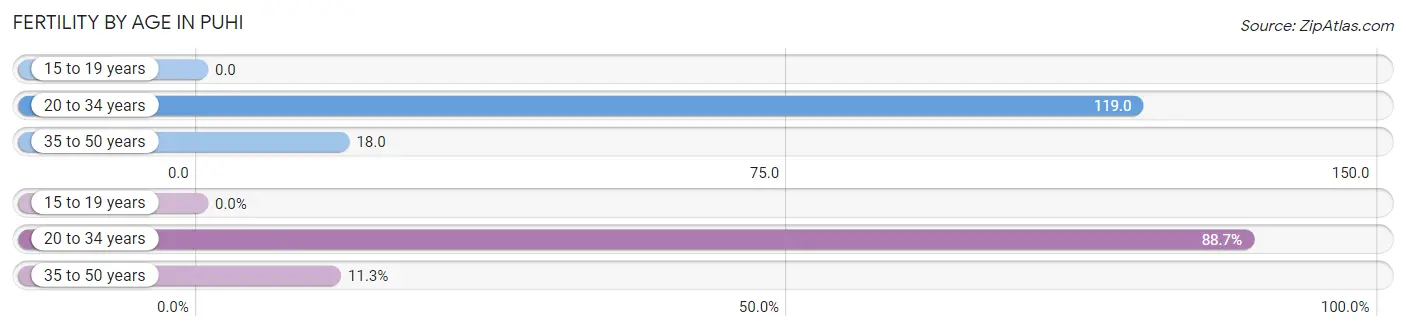
| Age Bracket | Women with Births | Births / 1,000 Women |
| 15 to 19 years | 0 (0.0%) | 0.0 |
| 20 to 34 years | 55 (88.7%) | 119.0 |
| 35 to 50 years | 7 (11.3%) | 18.0 |
| Total | 62 (100.0%) | 71.0 |
Fertility by Age by Marriage Status in Puhi
38.7% of women with births (62) in Puhi are married. The highest percentage of unmarried women with births falls into 20 to 34 years age bracket with 63.6% of them unmarried at the time of birth, while the lowest percentage of unmarried women with births belong to 35 to 50 years age bracket with 42.9% of them unmarried.
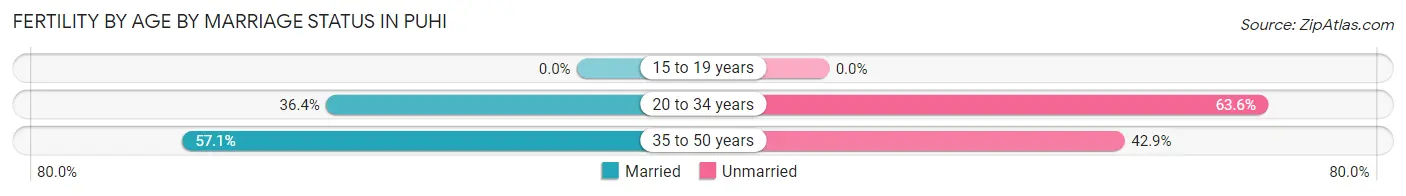
| Age Bracket | Married | Unmarried |
| 15 to 19 years | 0 (0.0%) | 0 (0.0%) |
| 20 to 34 years | 20 (36.4%) | 35 (63.6%) |
| 35 to 50 years | 4 (57.1%) | 3 (42.9%) |
| Total | 24 (38.7%) | 38 (61.3%) |
Fertility by Education in Puhi
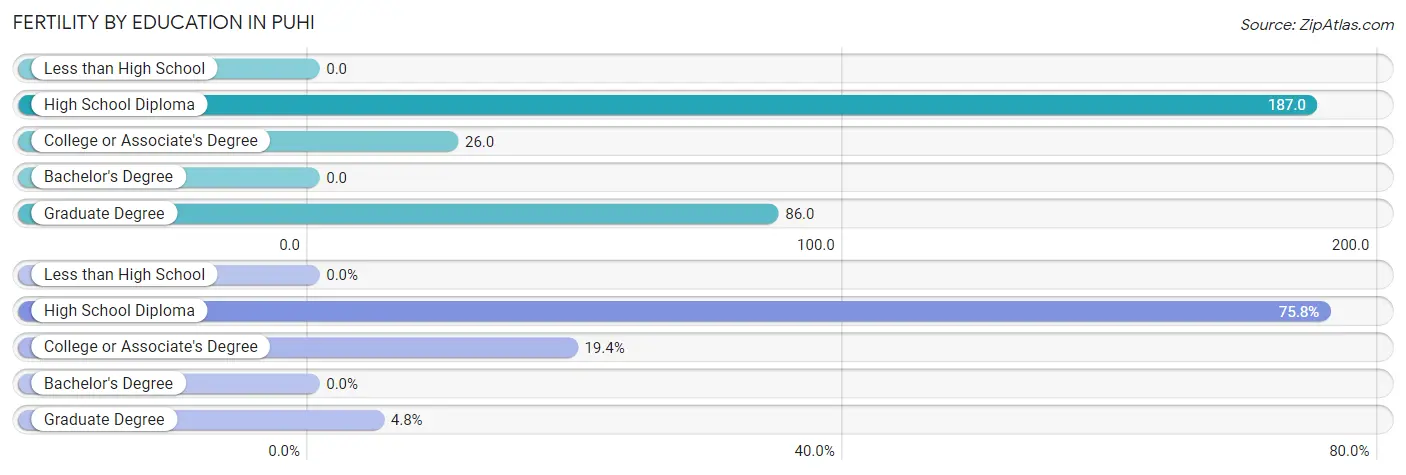
| Educational Attainment | Women with Births | Births / 1,000 Women |
| Less than High School | 0 (0.0%) | 0.0 |
| High School Diploma | 47 (75.8%) | 187.0 |
| College or Associate's Degree | 12 (19.4%) | 26.0 |
| Bachelor's Degree | 0 (0.0%) | 0.0 |
| Graduate Degree | 3 (4.8%) | 86.0 |
| Total | 62 (100.0%) | 71.0 |
Fertility by Education by Marriage Status in Puhi
61.3% of women with births in Puhi are unmarried. Women with the educational attainment of college or associate's degree are most likely to be married with 100.0% of them married at childbirth, while women with the educational attainment of graduate degree are least likely to be married with 100.0% of them unmarried at childbirth.
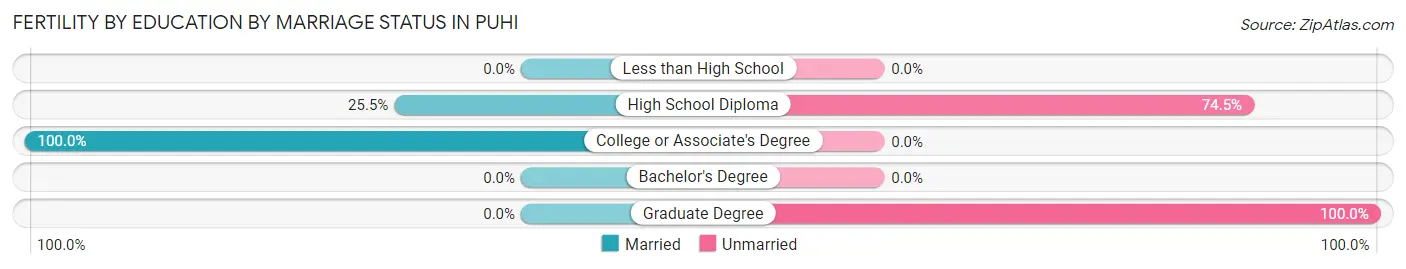
| Educational Attainment | Married | Unmarried |
| Less than High School | 0 (0.0%) | 0 (0.0%) |
| High School Diploma | 12 (25.5%) | 35 (74.5%) |
| College or Associate's Degree | 12 (100.0%) | 0 (0.0%) |
| Bachelor's Degree | 0 (0.0%) | 0 (0.0%) |
| Graduate Degree | 0 (0.0%) | 3 (100.0%) |
| Total | 24 (38.7%) | 38 (61.3%) |
Employment Characteristics in Puhi
Employment by Class of Employer in Puhi
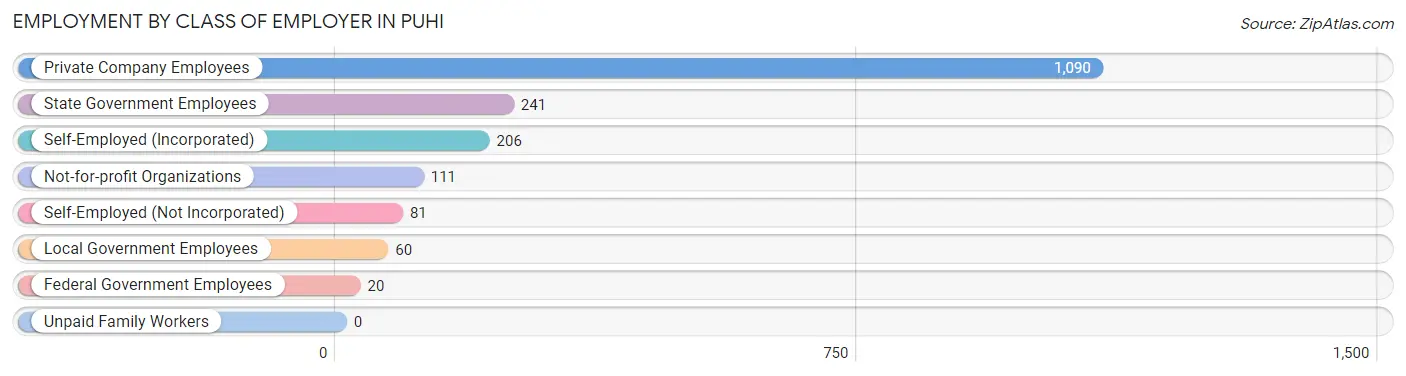
Among the 1,809 employed individuals in Puhi, private company employees (1,090 | 60.3%), state government employees (241 | 13.3%), and self-employed (incorporated) (206 | 11.4%) make up the most common classes of employment.
| Employer Class | # Employees | % Employees |
| Private Company Employees | 1,090 | 60.3% |
| Self-Employed (Incorporated) | 206 | 11.4% |
| Self-Employed (Not Incorporated) | 81 | 4.5% |
| Not-for-profit Organizations | 111 | 6.1% |
| Local Government Employees | 60 | 3.3% |
| State Government Employees | 241 | 13.3% |
| Federal Government Employees | 20 | 1.1% |
| Unpaid Family Workers | 0 | 0.0% |
| Total | 1,809 | 100.0% |
Employment Status by Age in Puhi
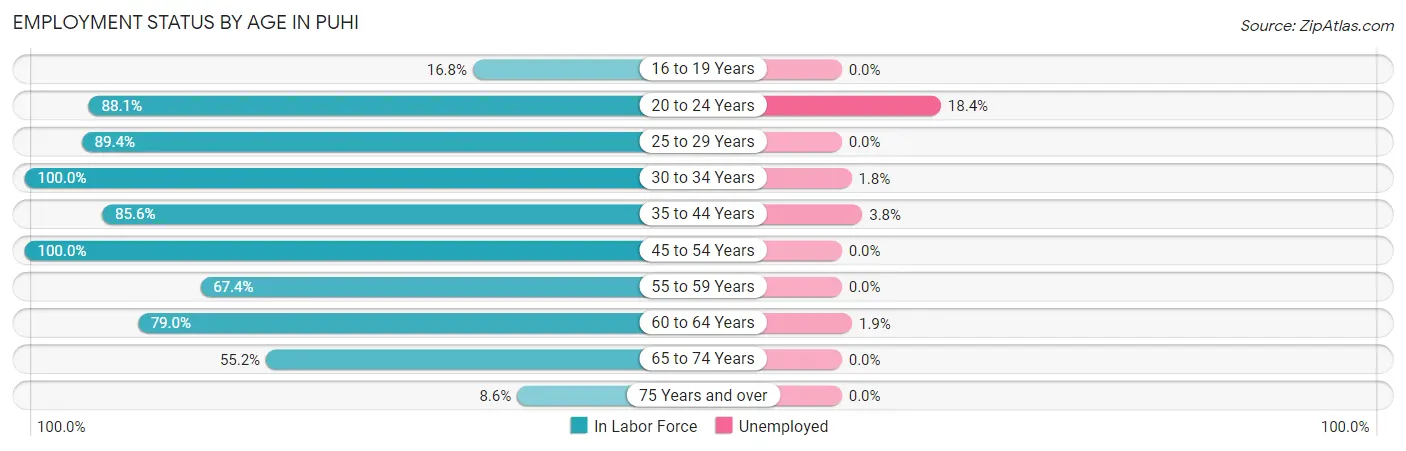
According to the labor force statistics for Puhi, out of the total population over 16 years of age (3,195), 75.2% or 2,403 individuals are in the labor force, with 2.8% or 67 of them unemployed. The age group with the highest labor force participation rate is 30 to 34 years, with 100.0% or 278 individuals in the labor force. Within the labor force, the 20 to 24 years age range has the highest percentage of unemployed individuals, with 18.4% or 45 of them being unemployed.
| Age Bracket | In Labor Force | Unemployed |
| 16 to 19 Years | 17 (16.8%) | 0 (0.0%) |
| 20 to 24 Years | 245 (88.1%) | 45 (18.4%) |
| 25 to 29 Years | 379 (89.4%) | 0 (0.0%) |
| 30 to 34 Years | 278 (100.0%) | 5 (1.8%) |
| 35 to 44 Years | 315 (85.6%) | 12 (3.8%) |
| 45 to 54 Years | 599 (100.0%) | 0 (0.0%) |
| 55 to 59 Years | 180 (67.4%) | 0 (0.0%) |
| 60 to 64 Years | 207 (79.0%) | 4 (1.9%) |
| 65 to 74 Years | 155 (55.2%) | 0 (0.0%) |
| 75 Years and over | 29 (8.6%) | 0 (0.0%) |
| Total | 2,403 (75.2%) | 67 (2.8%) |
Employment Status by Educational Attainment in Puhi
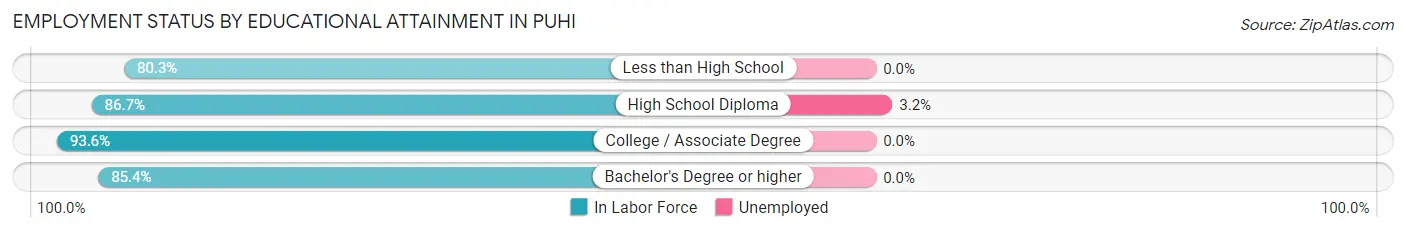
According to labor force statistics for Puhi, 89.1% of individuals (1,958) out of the total population between 25 and 64 years of age (2,198) are in the labor force, with 1.1% or 22 of them being unemployed. The group with the highest labor force participation rate are those with the educational attainment of college / associate degree, with 93.6% or 851 individuals in the labor force. Within the labor force, individuals with high school diploma education have the highest percentage of unemployment, with 3.2% or 21 of them being unemployed.
| Educational Attainment | In Labor Force | Unemployed |
| Less than High School | 57 (80.3%) | 0 (0.0%) |
| High School Diploma | 648 (86.7%) | 24 (3.2%) |
| College / Associate Degree | 851 (93.6%) | 0 (0.0%) |
| Bachelor's Degree or higher | 402 (85.4%) | 0 (0.0%) |
| Total | 1,958 (89.1%) | 24 (1.1%) |
Employment Occupations by Sex in Puhi
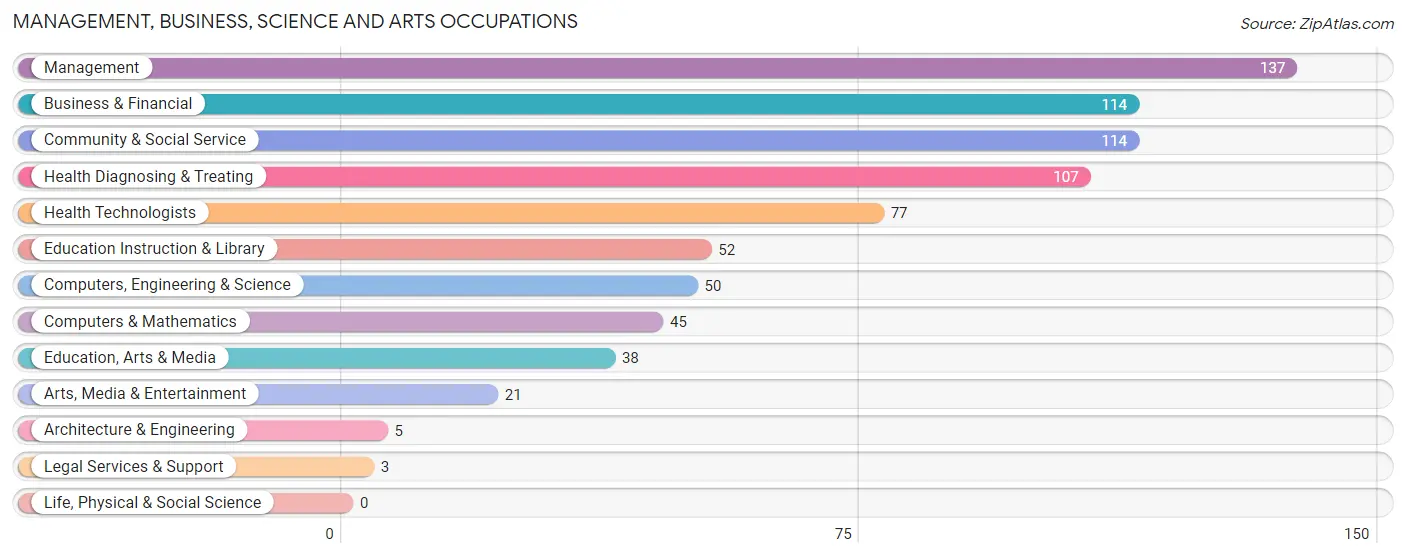
Management, Business, Science and Arts Occupations
The most common Management, Business, Science and Arts occupations in Puhi are Management (137 | 5.9%), Business & Financial (114 | 4.9%), Community & Social Service (114 | 4.9%), Health Diagnosing & Treating (107 | 4.6%), and Health Technologists (77 | 3.3%).
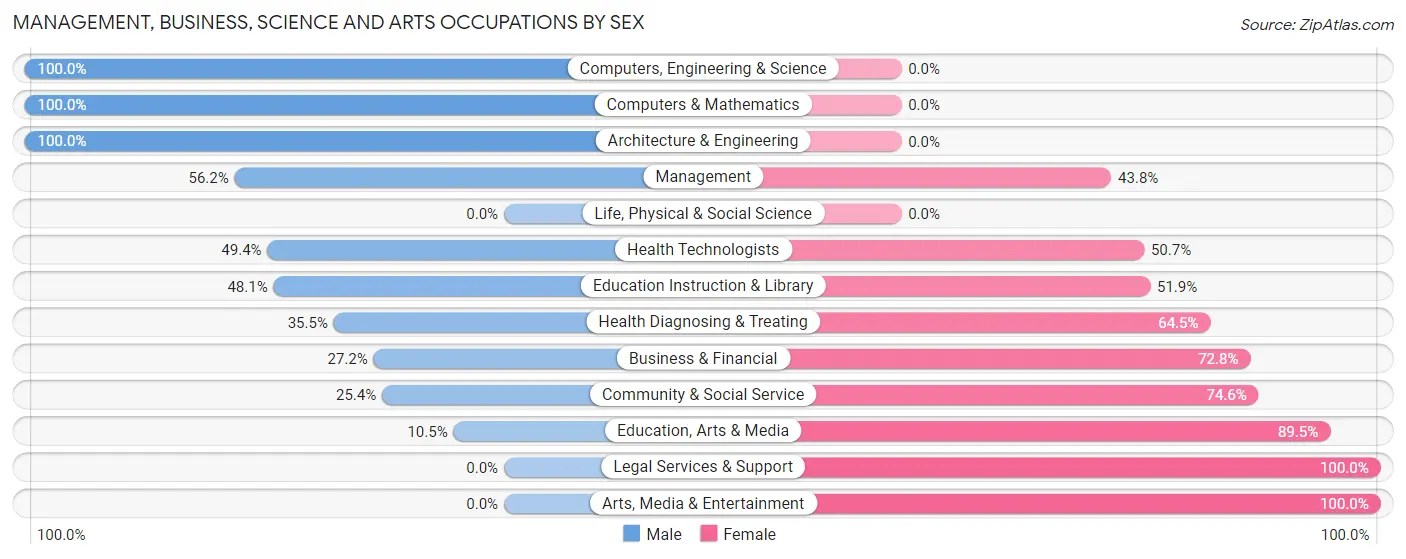
Management, Business, Science and Arts Occupations by Sex
Within the Management, Business, Science and Arts occupations in Puhi, the most male-oriented occupations are Computers, Engineering & Science (100.0%), Computers & Mathematics (100.0%), and Architecture & Engineering (100.0%), while the most female-oriented occupations are Legal Services & Support (100.0%), Arts, Media & Entertainment (100.0%), and Education, Arts & Media (89.5%).
| Occupation | Male | Female |
| Management | 77 (56.2%) | 60 (43.8%) |
| Business & Financial | 31 (27.2%) | 83 (72.8%) |
| Computers, Engineering & Science | 50 (100.0%) | 0 (0.0%) |
| Computers & Mathematics | 45 (100.0%) | 0 (0.0%) |
| Architecture & Engineering | 5 (100.0%) | 0 (0.0%) |
| Life, Physical & Social Science | 0 (0.0%) | 0 (0.0%) |
| Community & Social Service | 29 (25.4%) | 85 (74.6%) |
| Education, Arts & Media | 4 (10.5%) | 34 (89.5%) |
| Legal Services & Support | 0 (0.0%) | 3 (100.0%) |
| Education Instruction & Library | 25 (48.1%) | 27 (51.9%) |
| Arts, Media & Entertainment | 0 (0.0%) | 21 (100.0%) |
| Health Diagnosing & Treating | 38 (35.5%) | 69 (64.5%) |
| Health Technologists | 38 (49.3%) | 39 (50.6%) |
| Total (Category) | 225 (43.1%) | 297 (56.9%) |
| Total (Overall) | 1,174 (50.4%) | 1,157 (49.6%) |
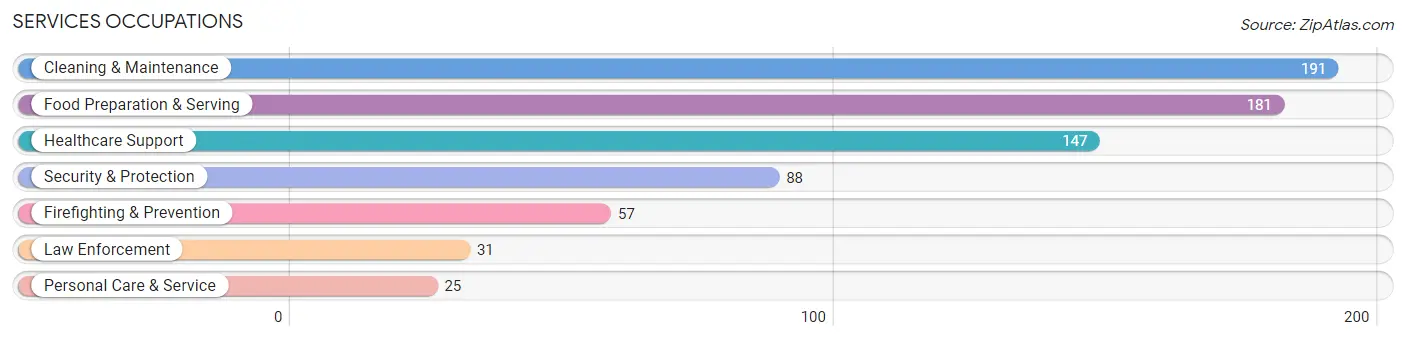
Services Occupations
The most common Services occupations in Puhi are Cleaning & Maintenance (191 | 8.2%), Food Preparation & Serving (181 | 7.8%), Healthcare Support (147 | 6.3%), Security & Protection (88 | 3.8%), and Firefighting & Prevention (57 | 2.5%).
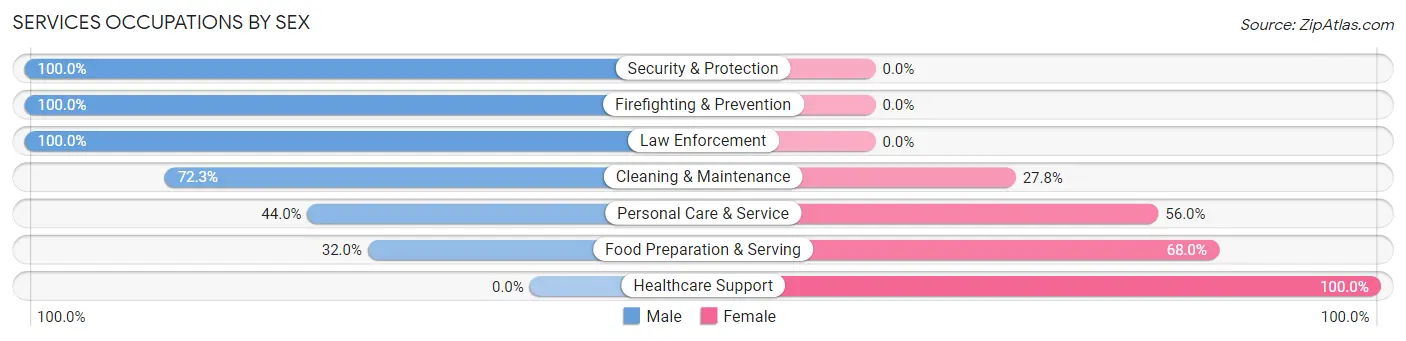
Services Occupations by Sex
Within the Services occupations in Puhi, the most male-oriented occupations are Security & Protection (100.0%), Firefighting & Prevention (100.0%), and Law Enforcement (100.0%), while the most female-oriented occupations are Healthcare Support (100.0%), Food Preparation & Serving (68.0%), and Personal Care & Service (56.0%).
| Occupation | Male | Female |
| Healthcare Support | 0 (0.0%) | 147 (100.0%) |
| Security & Protection | 88 (100.0%) | 0 (0.0%) |
| Firefighting & Prevention | 57 (100.0%) | 0 (0.0%) |
| Law Enforcement | 31 (100.0%) | 0 (0.0%) |
| Food Preparation & Serving | 58 (32.0%) | 123 (68.0%) |
| Cleaning & Maintenance | 138 (72.3%) | 53 (27.8%) |
| Personal Care & Service | 11 (44.0%) | 14 (56.0%) |
| Total (Category) | 295 (46.7%) | 337 (53.3%) |
| Total (Overall) | 1,174 (50.4%) | 1,157 (49.6%) |
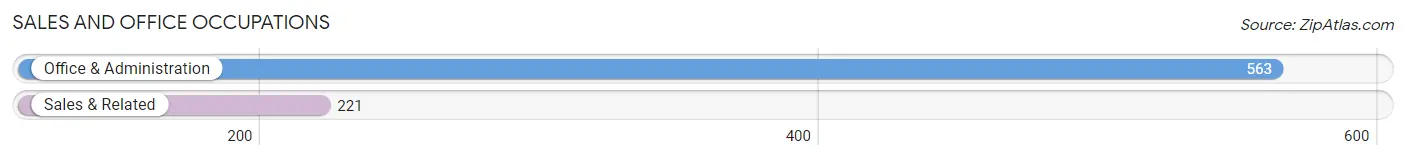
Sales and Office Occupations
The most common Sales and Office occupations in Puhi are Office & Administration (563 | 24.1%), and Sales & Related (221 | 9.5%).
Sales and Office Occupations by Sex
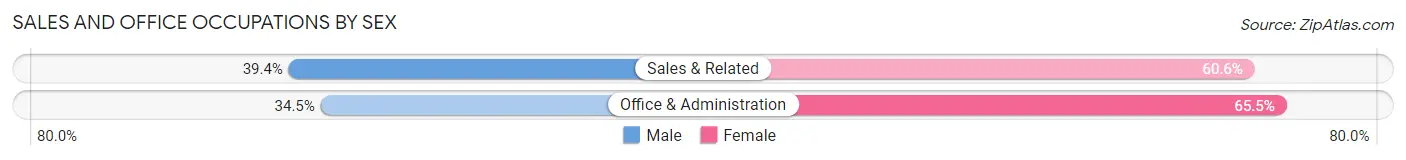
| Occupation | Male | Female |
| Sales & Related | 87 (39.4%) | 134 (60.6%) |
| Office & Administration | 194 (34.5%) | 369 (65.5%) |
| Total (Category) | 281 (35.8%) | 503 (64.2%) |
| Total (Overall) | 1,174 (50.4%) | 1,157 (49.6%) |
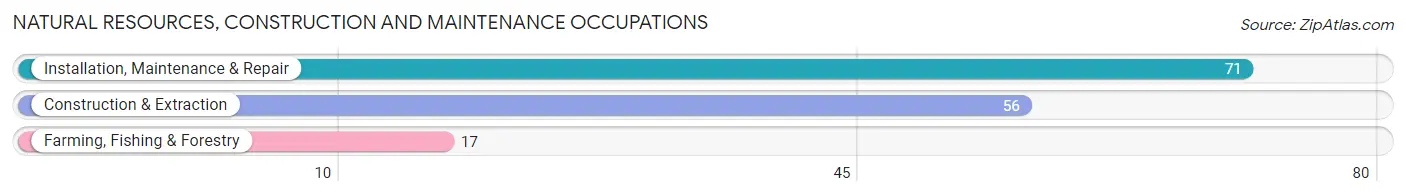
Natural Resources, Construction and Maintenance Occupations
The most common Natural Resources, Construction and Maintenance occupations in Puhi are Installation, Maintenance & Repair (71 | 3.0%), Construction & Extraction (56 | 2.4%), and Farming, Fishing & Forestry (17 | 0.7%).
Natural Resources, Construction and Maintenance Occupations by Sex
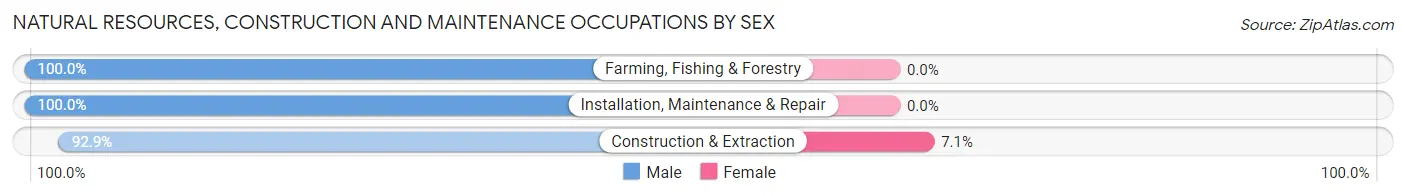
| Occupation | Male | Female |
| Farming, Fishing & Forestry | 17 (100.0%) | 0 (0.0%) |
| Construction & Extraction | 52 (92.9%) | 4 (7.1%) |
| Installation, Maintenance & Repair | 71 (100.0%) | 0 (0.0%) |
| Total (Category) | 140 (97.2%) | 4 (2.8%) |
| Total (Overall) | 1,174 (50.4%) | 1,157 (49.6%) |
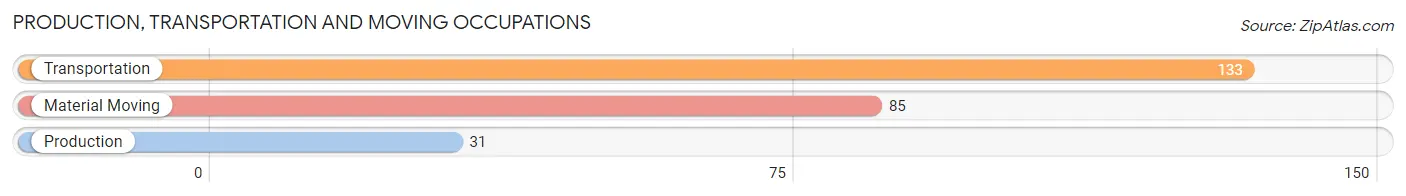
Production, Transportation and Moving Occupations
The most common Production, Transportation and Moving occupations in Puhi are Transportation (133 | 5.7%), Material Moving (85 | 3.6%), and Production (31 | 1.3%).
Production, Transportation and Moving Occupations by Sex
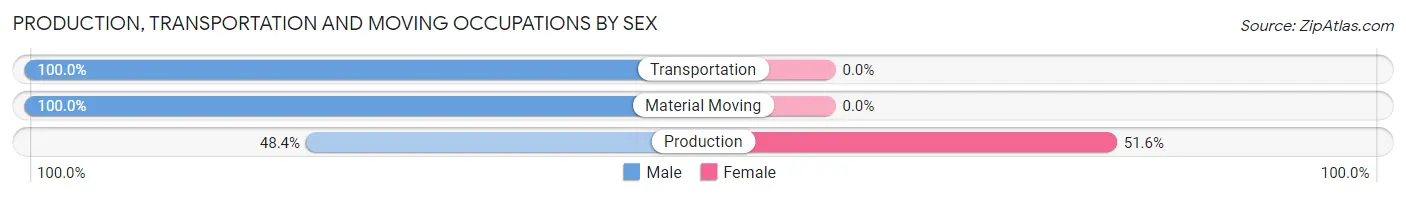
| Occupation | Male | Female |
| Production | 15 (48.4%) | 16 (51.6%) |
| Transportation | 133 (100.0%) | 0 (0.0%) |
| Material Moving | 85 (100.0%) | 0 (0.0%) |
| Total (Category) | 233 (93.6%) | 16 (6.4%) |
| Total (Overall) | 1,174 (50.4%) | 1,157 (49.6%) |
Employment Industries by Sex in Puhi
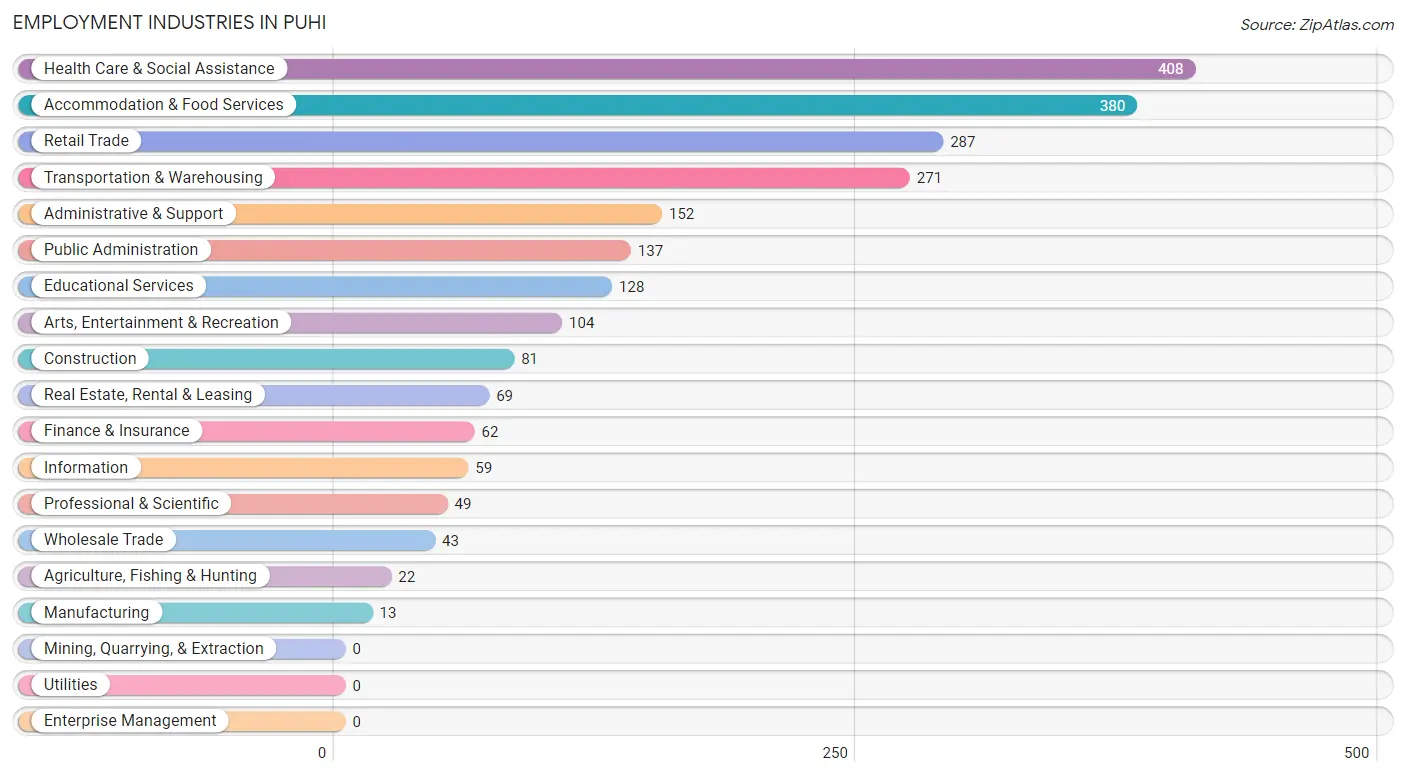
Employment Industries in Puhi
The major employment industries in Puhi include Health Care & Social Assistance (408 | 17.5%), Accommodation & Food Services (380 | 16.3%), Retail Trade (287 | 12.3%), Transportation & Warehousing (271 | 11.6%), and Administrative & Support (152 | 6.5%).
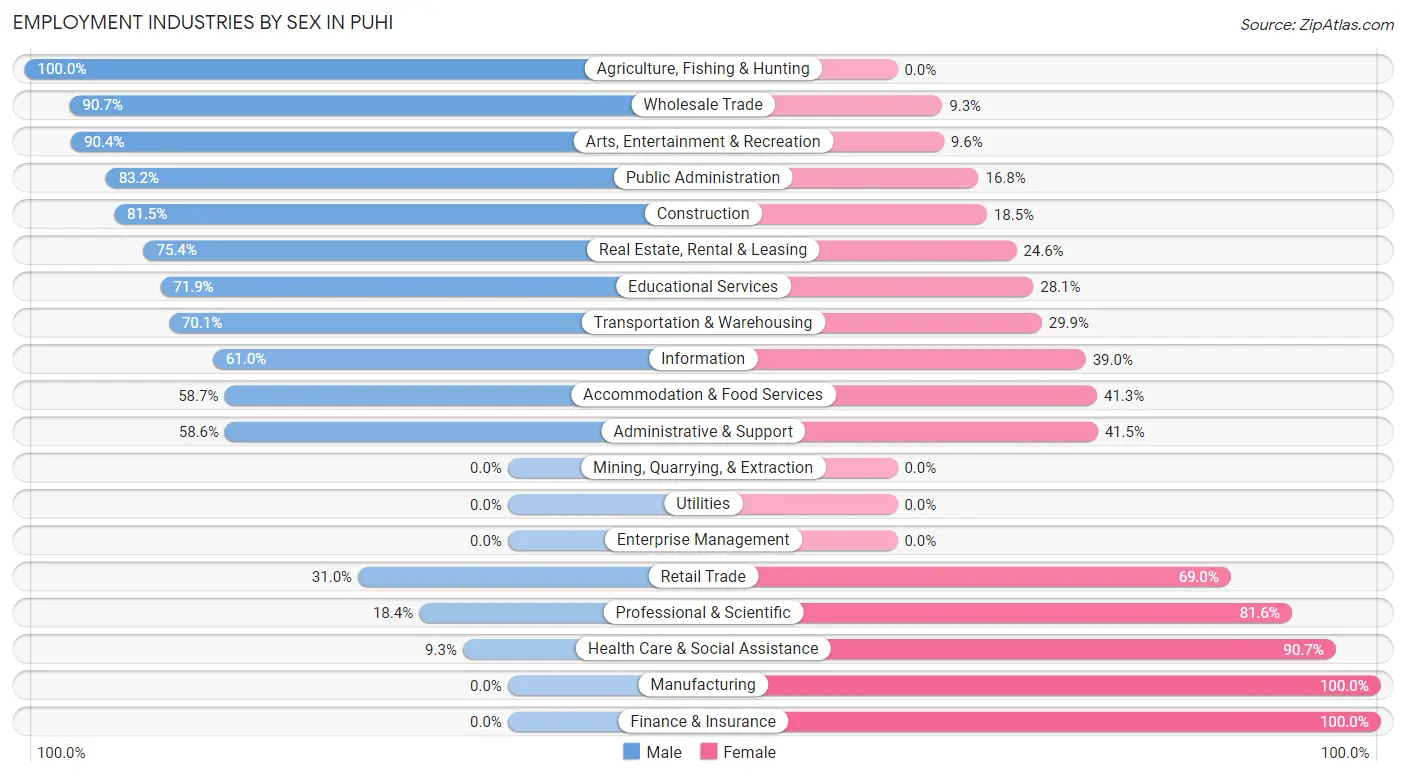
Employment Industries by Sex in Puhi
The Puhi industries that see more men than women are Agriculture, Fishing & Hunting (100.0%), Wholesale Trade (90.7%), and Arts, Entertainment & Recreation (90.4%), whereas the industries that tend to have a higher number of women are Manufacturing (100.0%), Finance & Insurance (100.0%), and Health Care & Social Assistance (90.7%).
| Industry | Male | Female |
| Agriculture, Fishing & Hunting | 22 (100.0%) | 0 (0.0%) |
| Mining, Quarrying, & Extraction | 0 (0.0%) | 0 (0.0%) |
| Construction | 66 (81.5%) | 15 (18.5%) |
| Manufacturing | 0 (0.0%) | 13 (100.0%) |
| Wholesale Trade | 39 (90.7%) | 4 (9.3%) |
| Retail Trade | 89 (31.0%) | 198 (69.0%) |
| Transportation & Warehousing | 190 (70.1%) | 81 (29.9%) |
| Utilities | 0 (0.0%) | 0 (0.0%) |
| Information | 36 (61.0%) | 23 (39.0%) |
| Finance & Insurance | 0 (0.0%) | 62 (100.0%) |
| Real Estate, Rental & Leasing | 52 (75.4%) | 17 (24.6%) |
| Professional & Scientific | 9 (18.4%) | 40 (81.6%) |
| Enterprise Management | 0 (0.0%) | 0 (0.0%) |
| Administrative & Support | 89 (58.6%) | 63 (41.4%) |
| Educational Services | 92 (71.9%) | 36 (28.1%) |
| Health Care & Social Assistance | 38 (9.3%) | 370 (90.7%) |
| Arts, Entertainment & Recreation | 94 (90.4%) | 10 (9.6%) |
| Accommodation & Food Services | 223 (58.7%) | 157 (41.3%) |
| Public Administration | 114 (83.2%) | 23 (16.8%) |
| Total | 1,174 (50.4%) | 1,157 (49.6%) |
Education in Puhi
School Enrollment in Puhi
The most common levels of schooling among the 867 students in Puhi are college / undergraduate (230 | 26.5%), middle school (167 | 19.3%), and high school (144 | 16.6%).
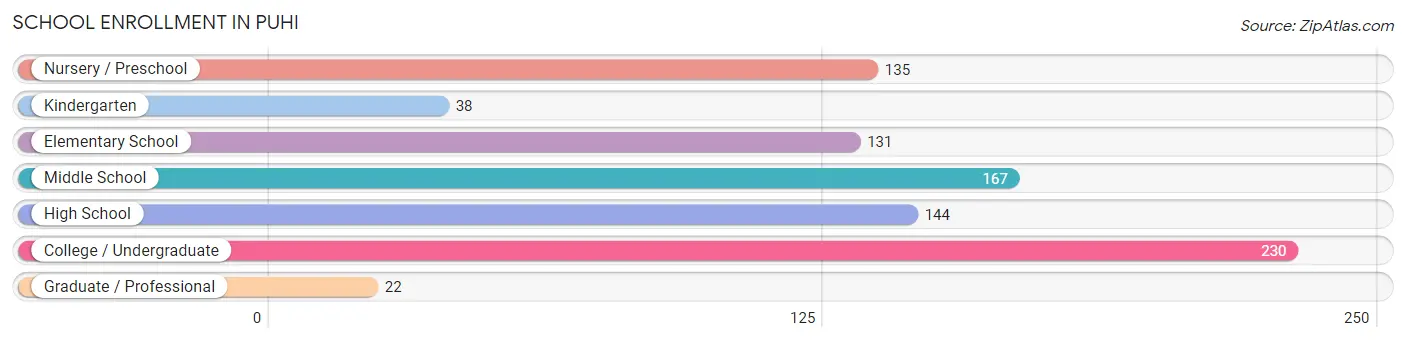
| School Level | # Students | % Students |
| Nursery / Preschool | 135 | 15.6% |
| Kindergarten | 38 | 4.4% |
| Elementary School | 131 | 15.1% |
| Middle School | 167 | 19.3% |
| High School | 144 | 16.6% |
| College / Undergraduate | 230 | 26.5% |
| Graduate / Professional | 22 | 2.5% |
| Total | 867 | 100.0% |
School Enrollment by Age by Funding Source in Puhi
Out of a total of 867 students who are enrolled in schools in Puhi, 148 (17.1%) attend a private institution, while the remaining 719 (82.9%) are enrolled in public schools. The age group of 3 to 4 year olds has the highest likelihood of being enrolled in private schools, with 98 (100.0% in the age bracket) enrolled. Conversely, the age group of 15 to 17 year olds has the lowest likelihood of being enrolled in a private school, with 96 (100.0% in the age bracket) attending a public institution.
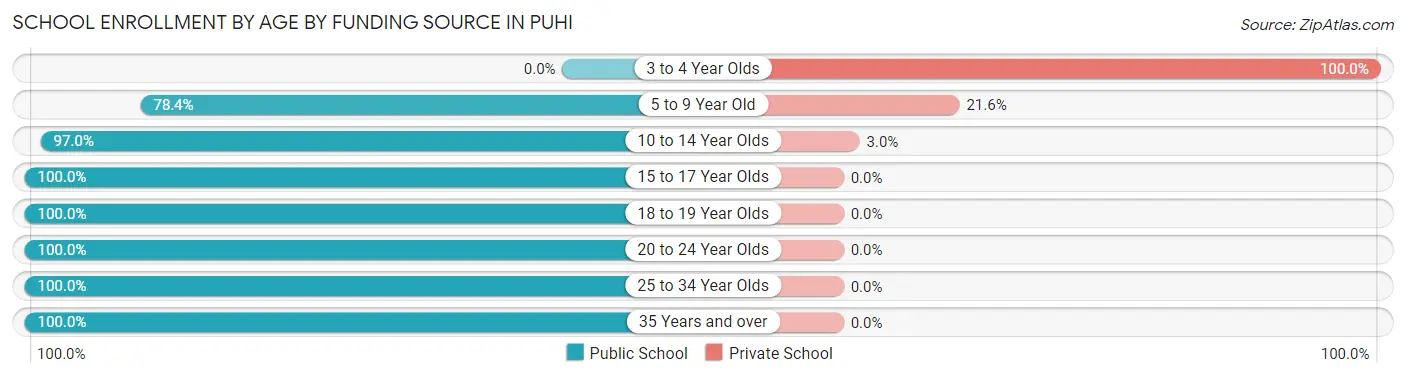
| Age Bracket | Public School | Private School |
| 3 to 4 Year Olds | 0 (0.0%) | 98 (100.0%) |
| 5 to 9 Year Old | 160 (78.4%) | 44 (21.6%) |
| 10 to 14 Year Olds | 196 (97.0%) | 6 (3.0%) |
| 15 to 17 Year Olds | 96 (100.0%) | 0 (0.0%) |
| 18 to 19 Year Olds | 9 (100.0%) | 0 (0.0%) |
| 20 to 24 Year Olds | 37 (100.0%) | 0 (0.0%) |
| 25 to 34 Year Olds | 176 (100.0%) | 0 (0.0%) |
| 35 Years and over | 45 (100.0%) | 0 (0.0%) |
| Total | 719 (82.9%) | 148 (17.1%) |
Educational Attainment by Field of Study in Puhi
Business (124 | 20.4%), science & technology (80 | 13.2%), social sciences (73 | 12.0%), education (58 | 9.5%), and arts & humanities (54 | 8.9%) are the most common fields of study among 608 individuals in Puhi who have obtained a bachelor's degree or higher.
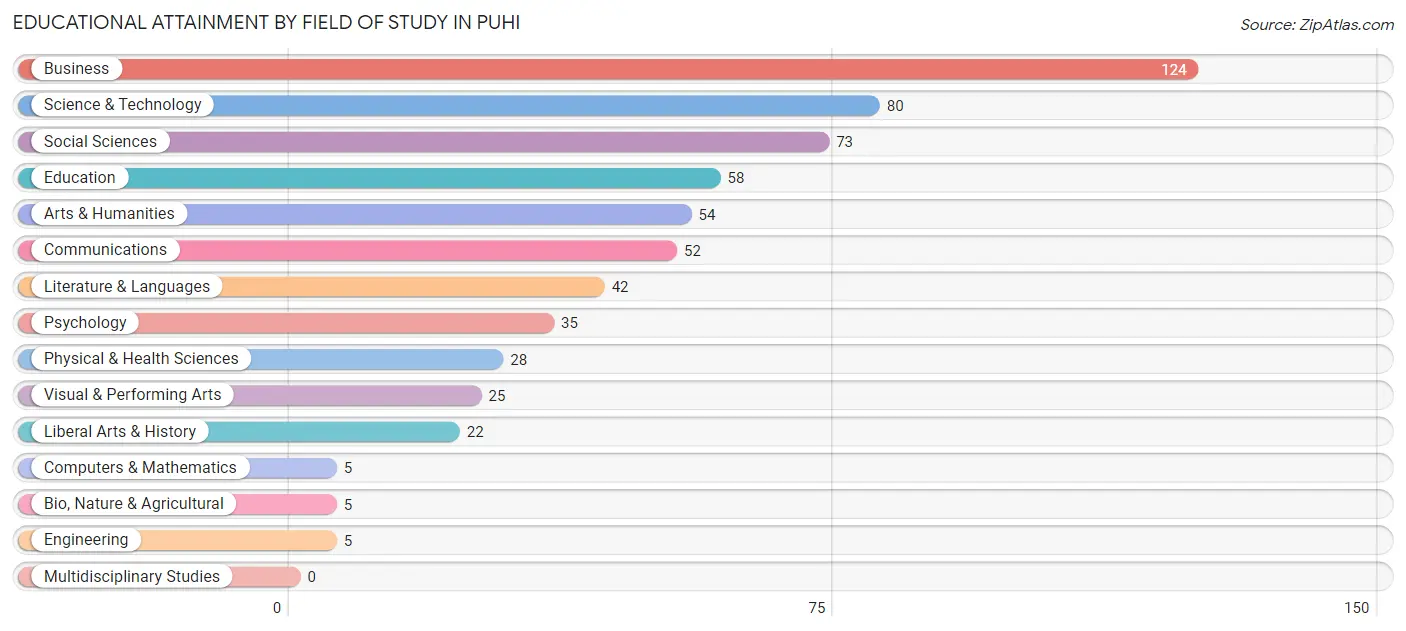
| Field of Study | # Graduates | % Graduates |
| Computers & Mathematics | 5 | 0.8% |
| Bio, Nature & Agricultural | 5 | 0.8% |
| Physical & Health Sciences | 28 | 4.6% |
| Psychology | 35 | 5.8% |
| Social Sciences | 73 | 12.0% |
| Engineering | 5 | 0.8% |
| Multidisciplinary Studies | 0 | 0.0% |
| Science & Technology | 80 | 13.2% |
| Business | 124 | 20.4% |
| Education | 58 | 9.5% |
| Literature & Languages | 42 | 6.9% |
| Liberal Arts & History | 22 | 3.6% |
| Visual & Performing Arts | 25 | 4.1% |
| Communications | 52 | 8.6% |
| Arts & Humanities | 54 | 8.9% |
| Total | 608 | 100.0% |
Transportation & Commute in Puhi
Vehicle Availability by Sex in Puhi
The most prevalent vehicle ownership categories in Puhi are males with 2 vehicles (394, accounting for 42.3%) and females with 2 vehicles (272, making up 44.9%).
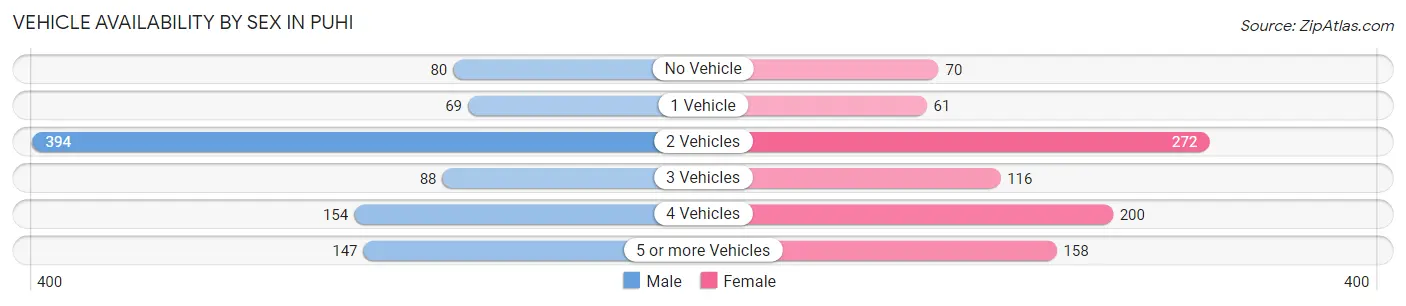
| Vehicles Available | Male | Female |
| No Vehicle | 80 (8.6%) | 70 (8.0%) |
| 1 Vehicle | 69 (7.4%) | 61 (7.0%) |
| 2 Vehicles | 394 (42.3%) | 272 (31.0%) |
| 3 Vehicles | 88 (9.4%) | 116 (13.2%) |
| 4 Vehicles | 154 (16.5%) | 200 (22.8%) |
| 5 or more Vehicles | 147 (15.8%) | 158 (18.0%) |
| Total | 932 (100.0%) | 877 (100.0%) |
Commute Time in Puhi
The most frequently occuring commute durations in Puhi are 5 to 9 minutes (509 commuters, 29.8%), 15 to 19 minutes (384 commuters, 22.5%), and 10 to 14 minutes (314 commuters, 18.4%).
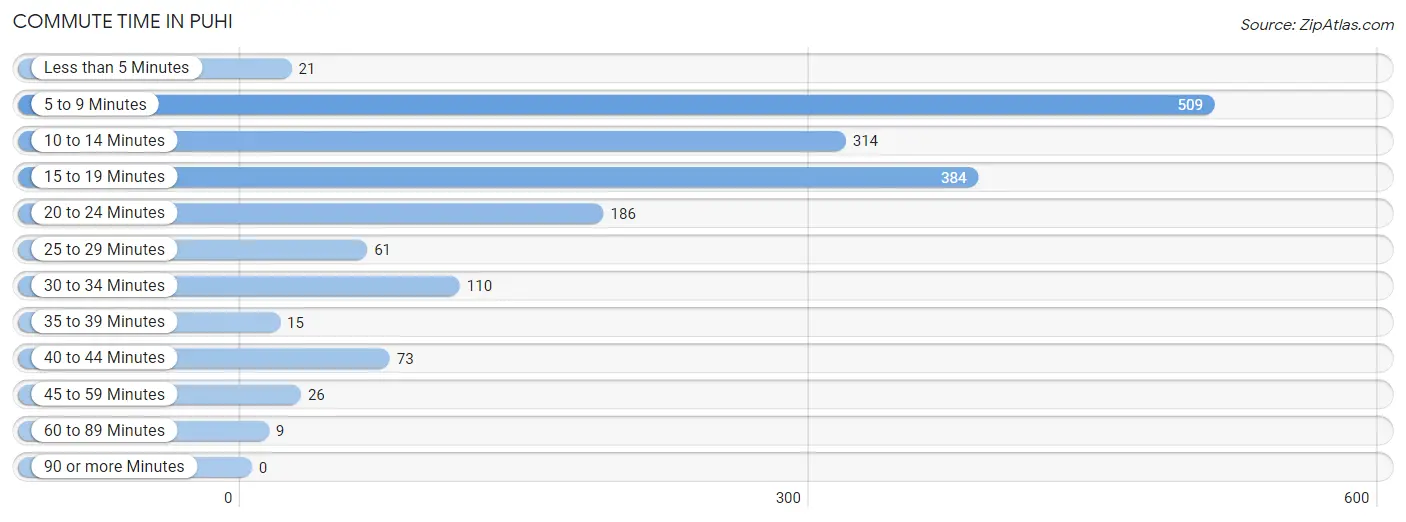
| Commute Time | # Commuters | % Commuters |
| Less than 5 Minutes | 21 | 1.2% |
| 5 to 9 Minutes | 509 | 29.8% |
| 10 to 14 Minutes | 314 | 18.4% |
| 15 to 19 Minutes | 384 | 22.5% |
| 20 to 24 Minutes | 186 | 10.9% |
| 25 to 29 Minutes | 61 | 3.6% |
| 30 to 34 Minutes | 110 | 6.4% |
| 35 to 39 Minutes | 15 | 0.9% |
| 40 to 44 Minutes | 73 | 4.3% |
| 45 to 59 Minutes | 26 | 1.5% |
| 60 to 89 Minutes | 9 | 0.5% |
| 90 or more Minutes | 0 | 0.0% |
Commute Time by Sex in Puhi
The most common commute times in Puhi are 5 to 9 minutes (236 commuters, 26.8%) for males and 5 to 9 minutes (273 commuters, 33.0%) for females.
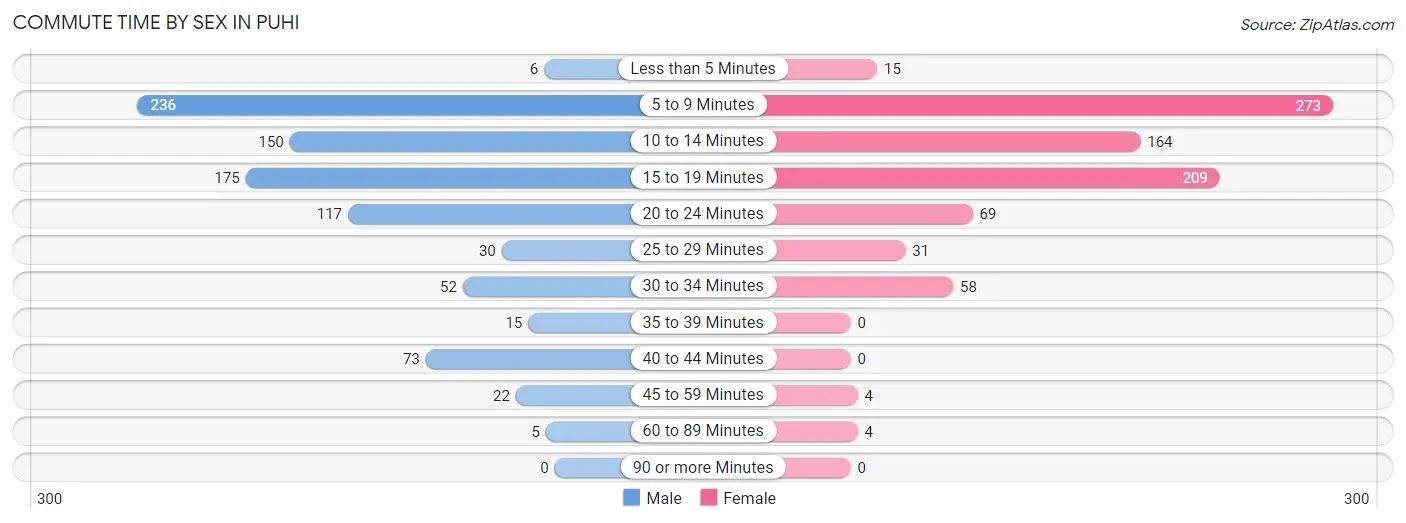
| Commute Time | Male | Female |
| Less than 5 Minutes | 6 (0.7%) | 15 (1.8%) |
| 5 to 9 Minutes | 236 (26.8%) | 273 (33.0%) |
| 10 to 14 Minutes | 150 (17.0%) | 164 (19.8%) |
| 15 to 19 Minutes | 175 (19.9%) | 209 (25.3%) |
| 20 to 24 Minutes | 117 (13.3%) | 69 (8.3%) |
| 25 to 29 Minutes | 30 (3.4%) | 31 (3.7%) |
| 30 to 34 Minutes | 52 (5.9%) | 58 (7.0%) |
| 35 to 39 Minutes | 15 (1.7%) | 0 (0.0%) |
| 40 to 44 Minutes | 73 (8.3%) | 0 (0.0%) |
| 45 to 59 Minutes | 22 (2.5%) | 4 (0.5%) |
| 60 to 89 Minutes | 5 (0.6%) | 4 (0.5%) |
| 90 or more Minutes | 0 (0.0%) | 0 (0.0%) |
Time of Departure to Work by Sex in Puhi
The most frequent times of departure to work in Puhi are 7:30 AM to 7:59 AM (170, 19.3%) for males and 7:30 AM to 7:59 AM (139, 16.8%) for females.
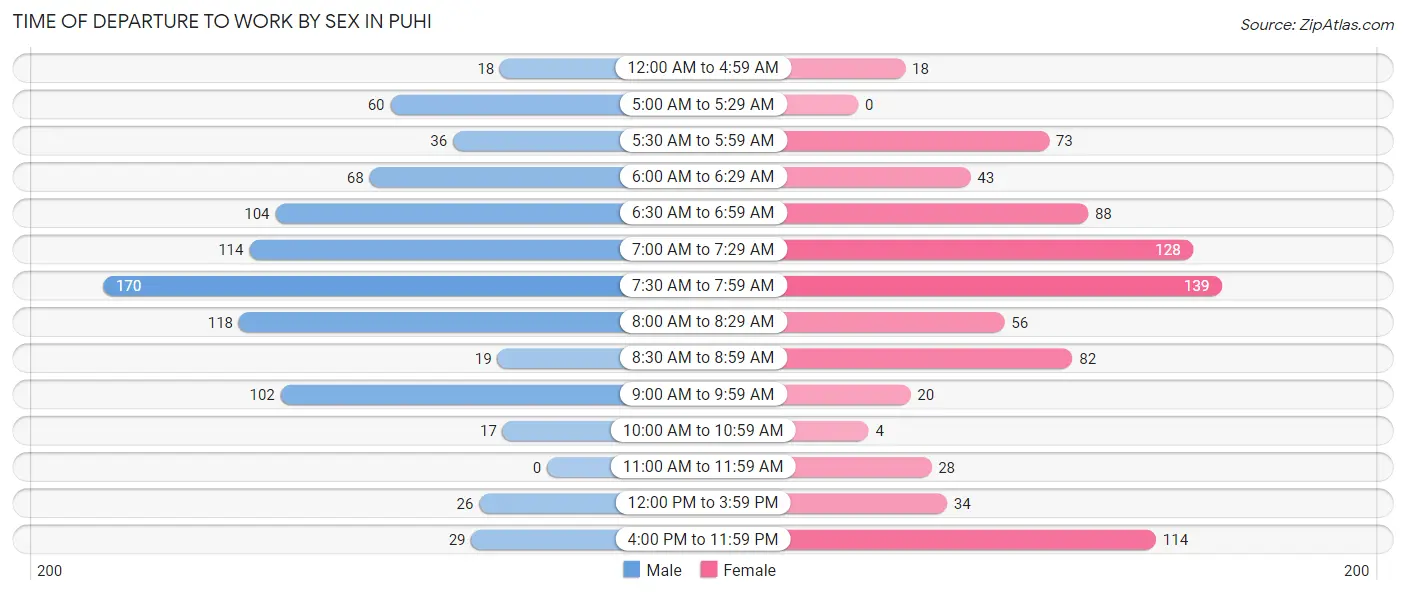
| Time of Departure | Male | Female |
| 12:00 AM to 4:59 AM | 18 (2.0%) | 18 (2.2%) |
| 5:00 AM to 5:29 AM | 60 (6.8%) | 0 (0.0%) |
| 5:30 AM to 5:59 AM | 36 (4.1%) | 73 (8.8%) |
| 6:00 AM to 6:29 AM | 68 (7.7%) | 43 (5.2%) |
| 6:30 AM to 6:59 AM | 104 (11.8%) | 88 (10.6%) |
| 7:00 AM to 7:29 AM | 114 (12.9%) | 128 (15.5%) |
| 7:30 AM to 7:59 AM | 170 (19.3%) | 139 (16.8%) |
| 8:00 AM to 8:29 AM | 118 (13.4%) | 56 (6.8%) |
| 8:30 AM to 8:59 AM | 19 (2.2%) | 82 (9.9%) |
| 9:00 AM to 9:59 AM | 102 (11.6%) | 20 (2.4%) |
| 10:00 AM to 10:59 AM | 17 (1.9%) | 4 (0.5%) |
| 11:00 AM to 11:59 AM | 0 (0.0%) | 28 (3.4%) |
| 12:00 PM to 3:59 PM | 26 (2.9%) | 34 (4.1%) |
| 4:00 PM to 11:59 PM | 29 (3.3%) | 114 (13.8%) |
| Total | 881 (100.0%) | 827 (100.0%) |
Housing Occupancy in Puhi
Occupancy by Ownership in Puhi
Of the total 1,008 dwellings in Puhi, owner-occupied units account for 815 (80.8%), while renter-occupied units make up 193 (19.2%).
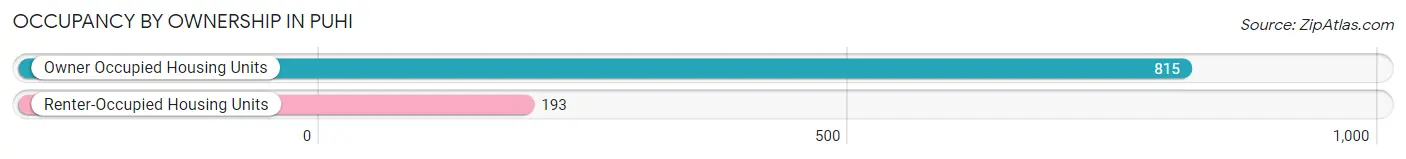
| Occupancy | # Housing Units | % Housing Units |
| Owner Occupied Housing Units | 815 | 80.8% |
| Renter-Occupied Housing Units | 193 | 19.2% |
| Total Occupied Housing Units | 1,008 | 100.0% |
Occupancy by Household Size in Puhi
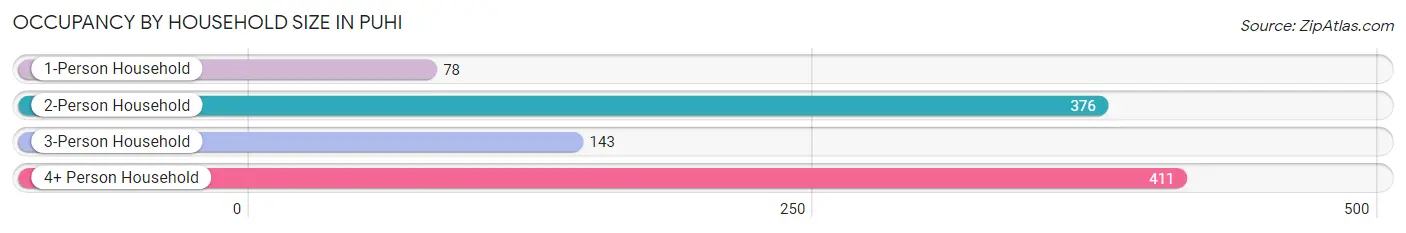
| Household Size | # Housing Units | % Housing Units |
| 1-Person Household | 78 | 7.7% |
| 2-Person Household | 376 | 37.3% |
| 3-Person Household | 143 | 14.2% |
| 4+ Person Household | 411 | 40.8% |
| Total Housing Units | 1,008 | 100.0% |
Occupancy by Ownership by Household Size in Puhi
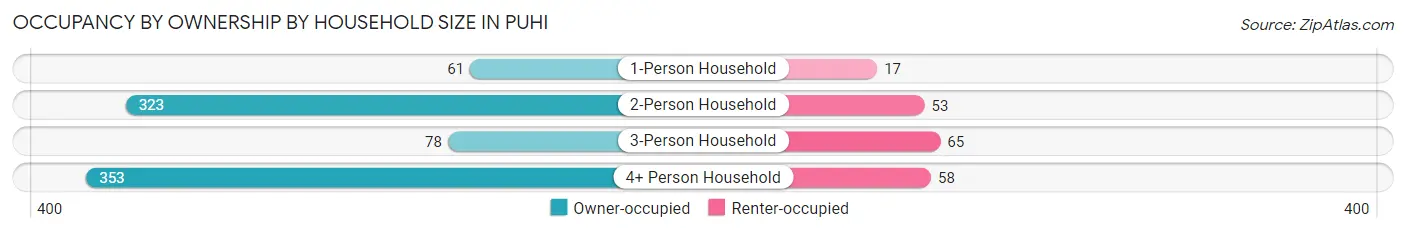
| Household Size | Owner-occupied | Renter-occupied |
| 1-Person Household | 61 (78.2%) | 17 (21.8%) |
| 2-Person Household | 323 (85.9%) | 53 (14.1%) |
| 3-Person Household | 78 (54.5%) | 65 (45.5%) |
| 4+ Person Household | 353 (85.9%) | 58 (14.1%) |
| Total Housing Units | 815 (80.8%) | 193 (19.2%) |
Occupancy by Educational Attainment in Puhi
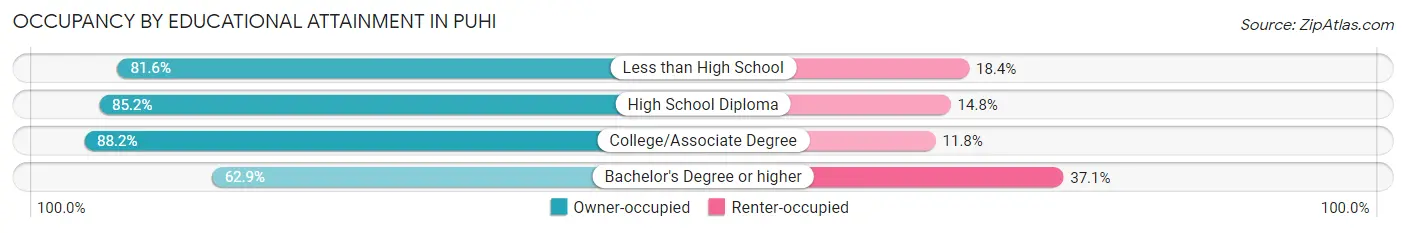
| Household Size | Owner-occupied | Renter-occupied |
| Less than High School | 31 (81.6%) | 7 (18.4%) |
| High School Diploma | 254 (85.2%) | 44 (14.8%) |
| College/Associate Degree | 374 (88.2%) | 50 (11.8%) |
| Bachelor's Degree or higher | 156 (62.9%) | 92 (37.1%) |
Occupancy by Age of Householder in Puhi
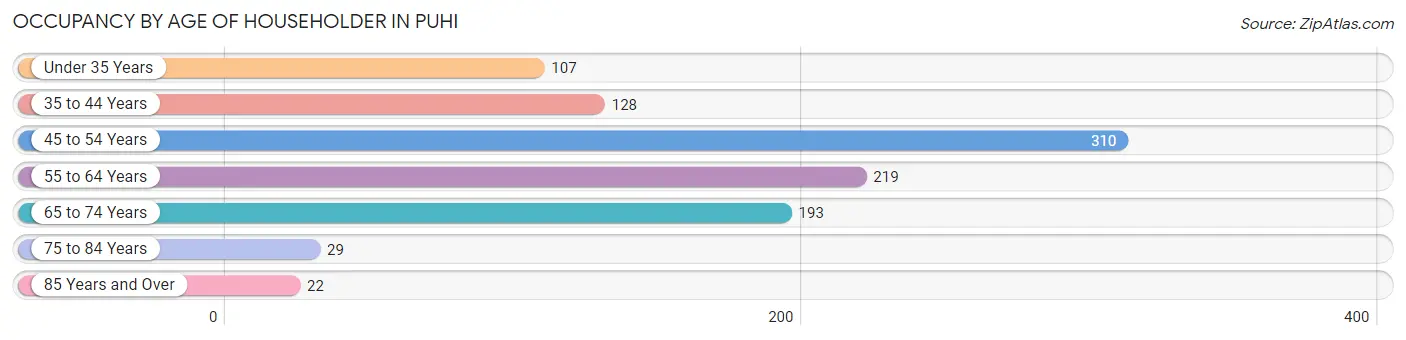
| Age Bracket | # Households | % Households |
| Under 35 Years | 107 | 10.6% |
| 35 to 44 Years | 128 | 12.7% |
| 45 to 54 Years | 310 | 30.7% |
| 55 to 64 Years | 219 | 21.7% |
| 65 to 74 Years | 193 | 19.2% |
| 75 to 84 Years | 29 | 2.9% |
| 85 Years and Over | 22 | 2.2% |
| Total | 1,008 | 100.0% |
Housing Finances in Puhi
Median Income by Occupancy in Puhi
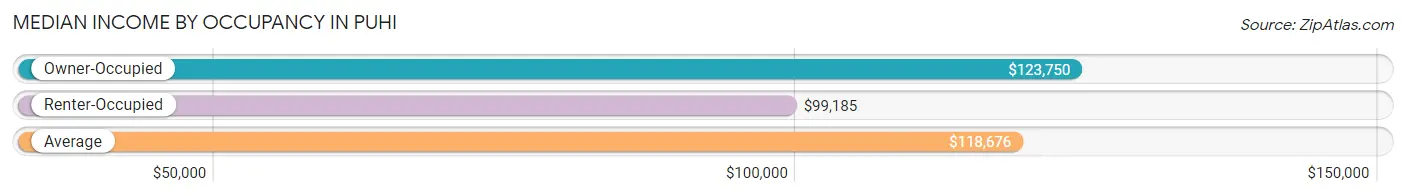
| Occupancy Type | # Households | Median Income |
| Owner-Occupied | 815 (80.8%) | $123,750 |
| Renter-Occupied | 193 (19.2%) | $99,185 |
| Average | 1,008 (100.0%) | $118,676 |
Occupancy by Householder Income Bracket in Puhi
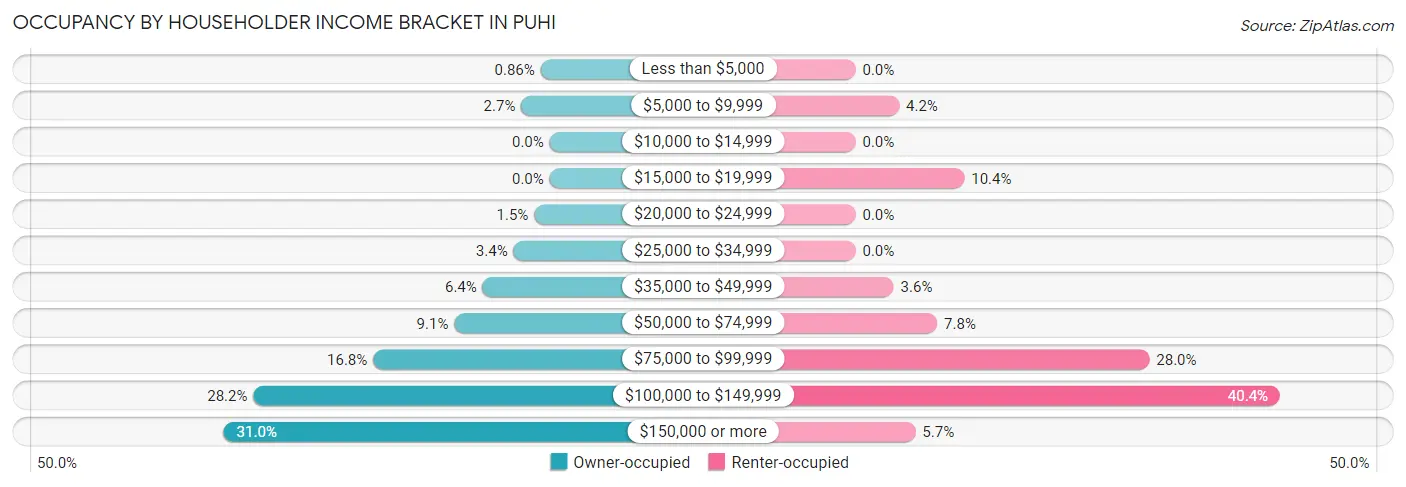
| Income Bracket | Owner-occupied | Renter-occupied |
| Less than $5,000 | 7 (0.9%) | 0 (0.0%) |
| $5,000 to $9,999 | 22 (2.7%) | 8 (4.2%) |
| $10,000 to $14,999 | 0 (0.0%) | 0 (0.0%) |
| $15,000 to $19,999 | 0 (0.0%) | 20 (10.4%) |
| $20,000 to $24,999 | 12 (1.5%) | 0 (0.0%) |
| $25,000 to $34,999 | 28 (3.4%) | 0 (0.0%) |
| $35,000 to $49,999 | 52 (6.4%) | 7 (3.6%) |
| $50,000 to $74,999 | 74 (9.1%) | 15 (7.8%) |
| $75,000 to $99,999 | 137 (16.8%) | 54 (28.0%) |
| $100,000 to $149,999 | 230 (28.2%) | 78 (40.4%) |
| $150,000 or more | 253 (31.0%) | 11 (5.7%) |
| Total | 815 (100.0%) | 193 (100.0%) |
Monthly Housing Cost Tiers in Puhi
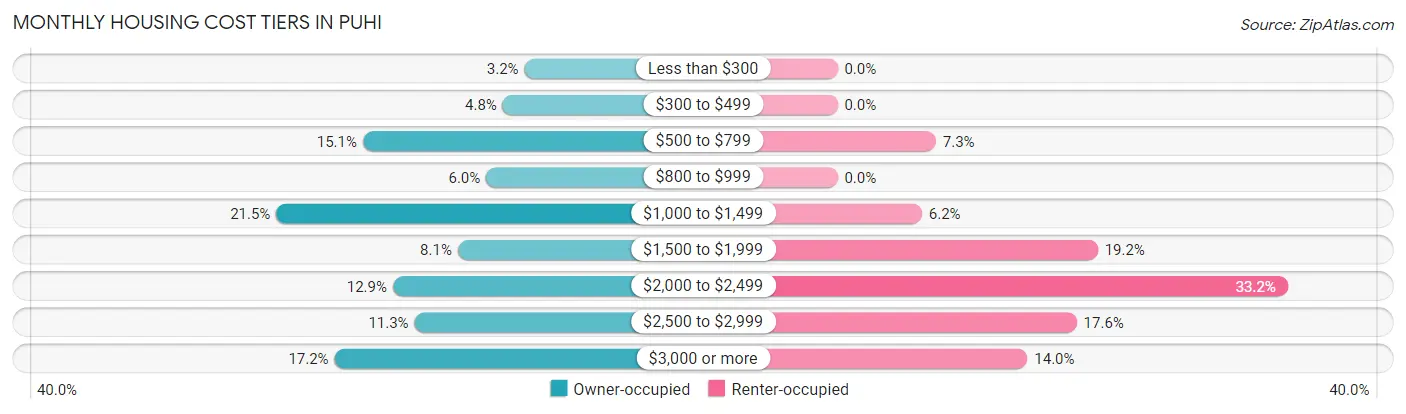
| Monthly Cost | Owner-occupied | Renter-occupied |
| Less than $300 | 26 (3.2%) | 0 (0.0%) |
| $300 to $499 | 39 (4.8%) | 0 (0.0%) |
| $500 to $799 | 123 (15.1%) | 14 (7.2%) |
| $800 to $999 | 49 (6.0%) | 0 (0.0%) |
| $1,000 to $1,499 | 175 (21.5%) | 12 (6.2%) |
| $1,500 to $1,999 | 66 (8.1%) | 37 (19.2%) |
| $2,000 to $2,499 | 105 (12.9%) | 64 (33.2%) |
| $2,500 to $2,999 | 92 (11.3%) | 34 (17.6%) |
| $3,000 or more | 140 (17.2%) | 27 (14.0%) |
| Total | 815 (100.0%) | 193 (100.0%) |
Physical Housing Characteristics in Puhi
Housing Structures in Puhi
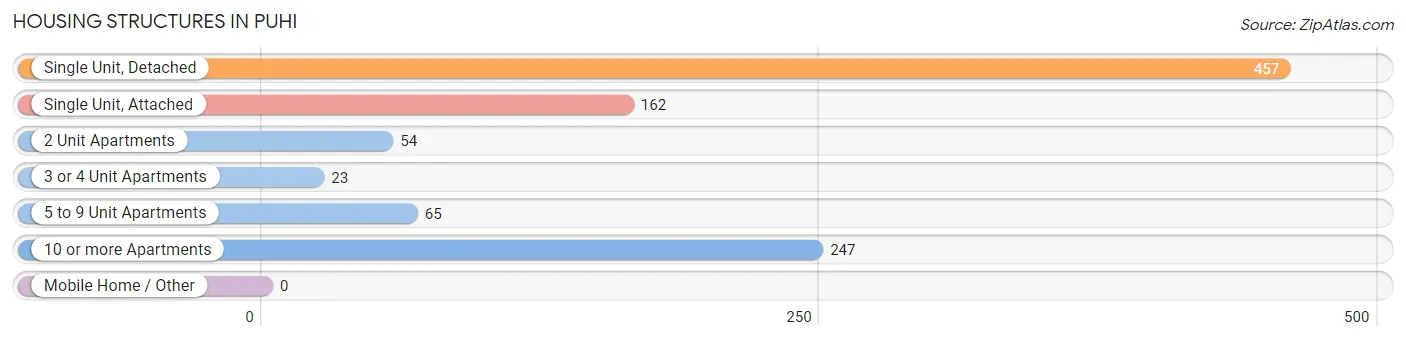
| Structure Type | # Housing Units | % Housing Units |
| Single Unit, Detached | 457 | 45.3% |
| Single Unit, Attached | 162 | 16.1% |
| 2 Unit Apartments | 54 | 5.4% |
| 3 or 4 Unit Apartments | 23 | 2.3% |
| 5 to 9 Unit Apartments | 65 | 6.5% |
| 10 or more Apartments | 247 | 24.5% |
| Mobile Home / Other | 0 | 0.0% |
| Total | 1,008 | 100.0% |
Housing Structures by Occupancy in Puhi
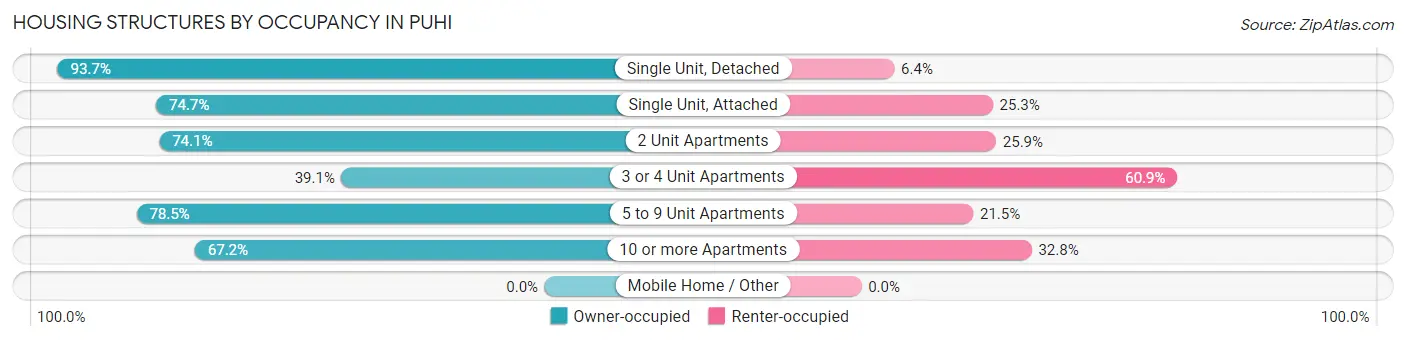
| Structure Type | Owner-occupied | Renter-occupied |
| Single Unit, Detached | 428 (93.6%) | 29 (6.4%) |
| Single Unit, Attached | 121 (74.7%) | 41 (25.3%) |
| 2 Unit Apartments | 40 (74.1%) | 14 (25.9%) |
| 3 or 4 Unit Apartments | 9 (39.1%) | 14 (60.9%) |
| 5 to 9 Unit Apartments | 51 (78.5%) | 14 (21.5%) |
| 10 or more Apartments | 166 (67.2%) | 81 (32.8%) |
| Mobile Home / Other | 0 (0.0%) | 0 (0.0%) |
| Total | 815 (80.8%) | 193 (19.2%) |
Housing Structures by Number of Rooms in Puhi
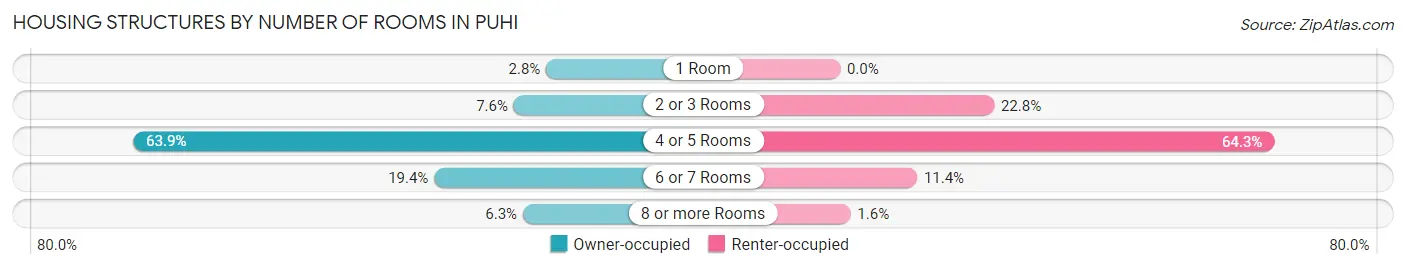
| Number of Rooms | Owner-occupied | Renter-occupied |
| 1 Room | 23 (2.8%) | 0 (0.0%) |
| 2 or 3 Rooms | 62 (7.6%) | 44 (22.8%) |
| 4 or 5 Rooms | 521 (63.9%) | 124 (64.2%) |
| 6 or 7 Rooms | 158 (19.4%) | 22 (11.4%) |
| 8 or more Rooms | 51 (6.3%) | 3 (1.5%) |
| Total | 815 (100.0%) | 193 (100.0%) |
Housing Structure by Heating Type in Puhi
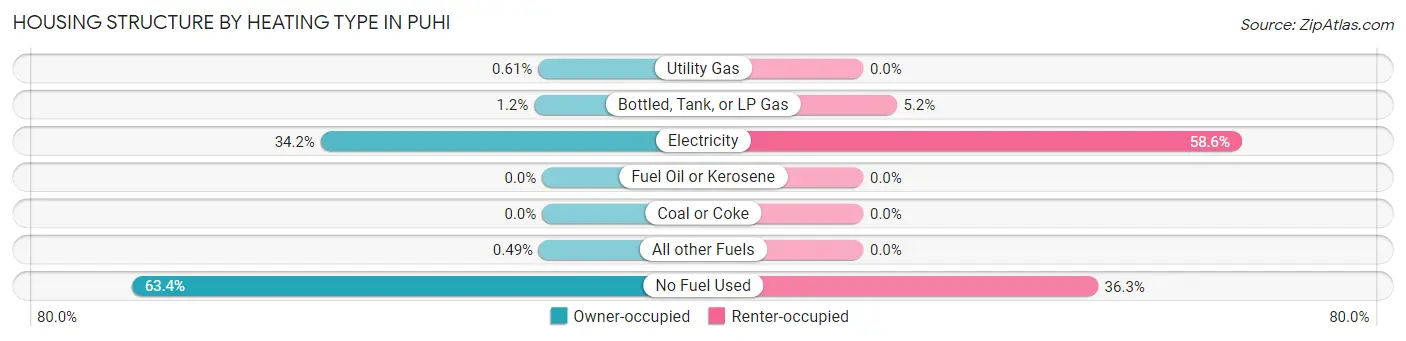
| Heating Type | Owner-occupied | Renter-occupied |
| Utility Gas | 5 (0.6%) | 0 (0.0%) |
| Bottled, Tank, or LP Gas | 10 (1.2%) | 10 (5.2%) |
| Electricity | 279 (34.2%) | 113 (58.6%) |
| Fuel Oil or Kerosene | 0 (0.0%) | 0 (0.0%) |
| Coal or Coke | 0 (0.0%) | 0 (0.0%) |
| All other Fuels | 4 (0.5%) | 0 (0.0%) |
| No Fuel Used | 517 (63.4%) | 70 (36.3%) |
| Total | 815 (100.0%) | 193 (100.0%) |
Household Vehicle Usage in Puhi
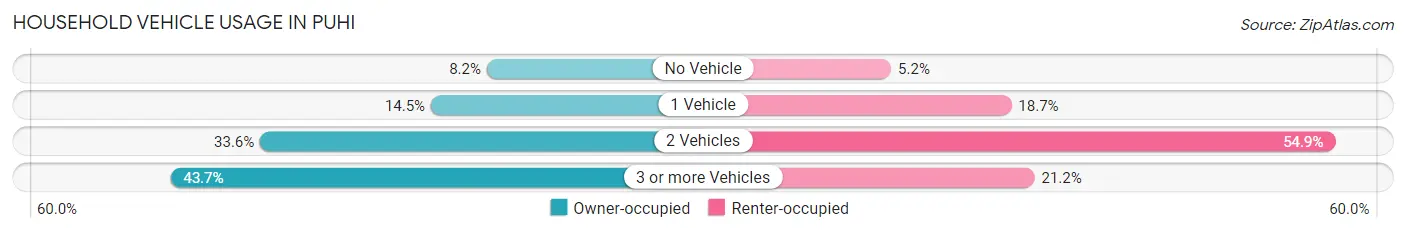
| Vehicles per Household | Owner-occupied | Renter-occupied |
| No Vehicle | 67 (8.2%) | 10 (5.2%) |
| 1 Vehicle | 118 (14.5%) | 36 (18.6%) |
| 2 Vehicles | 274 (33.6%) | 106 (54.9%) |
| 3 or more Vehicles | 356 (43.7%) | 41 (21.2%) |
| Total | 815 (100.0%) | 193 (100.0%) |
Real Estate & Mortgages in Puhi
Real Estate and Mortgage Overview in Puhi
| Characteristic | Without Mortgage | With Mortgage |
| Housing Units | 230 | 585 |
| Median Property Value | $622,400 | $536,300 |
| Median Household Income | $81,196 | $212 |
| Monthly Housing Costs | $639 | $140 |
| Real Estate Taxes | $1,225 | $0 |
Property Value by Mortgage Status in Puhi
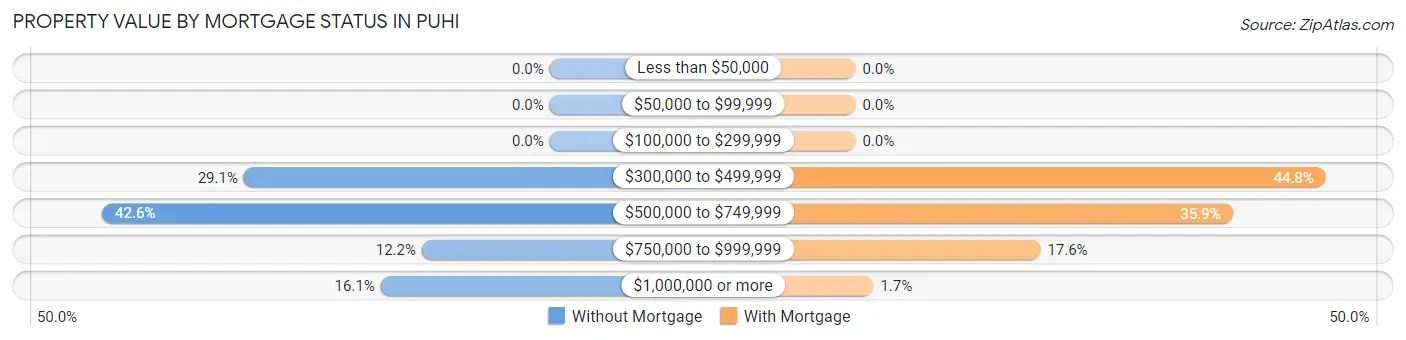
| Property Value | Without Mortgage | With Mortgage |
| Less than $50,000 | 0 (0.0%) | 0 (0.0%) |
| $50,000 to $99,999 | 0 (0.0%) | 0 (0.0%) |
| $100,000 to $299,999 | 0 (0.0%) | 0 (0.0%) |
| $300,000 to $499,999 | 67 (29.1%) | 262 (44.8%) |
| $500,000 to $749,999 | 98 (42.6%) | 210 (35.9%) |
| $750,000 to $999,999 | 28 (12.2%) | 103 (17.6%) |
| $1,000,000 or more | 37 (16.1%) | 10 (1.7%) |
| Total | 230 (100.0%) | 585 (100.0%) |
Household Income by Mortgage Status in Puhi
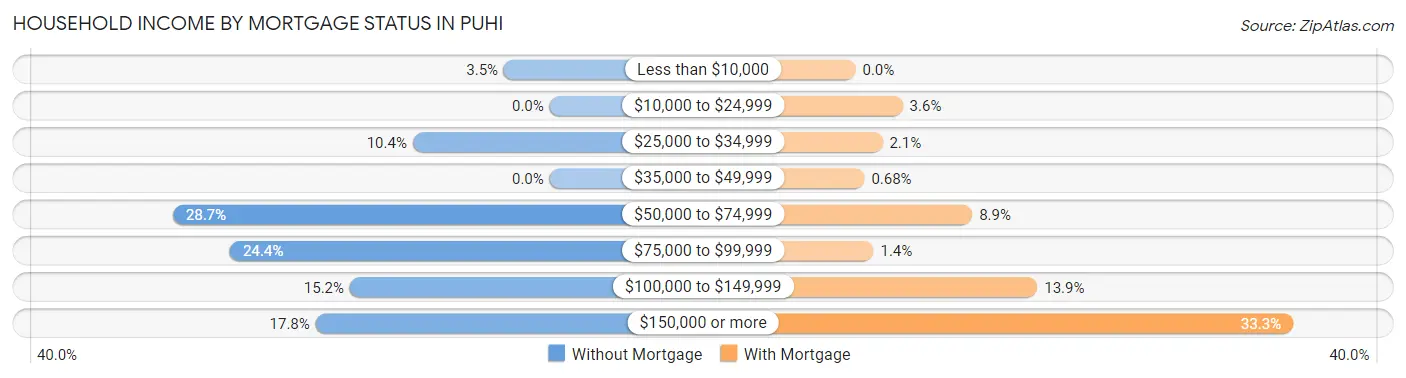
| Household Income | Without Mortgage | With Mortgage |
| Less than $10,000 | 8 (3.5%) | 0 (0.0%) |
| $10,000 to $24,999 | 0 (0.0%) | 21 (3.6%) |
| $25,000 to $34,999 | 24 (10.4%) | 12 (2.1%) |
| $35,000 to $49,999 | 0 (0.0%) | 4 (0.7%) |
| $50,000 to $74,999 | 66 (28.7%) | 52 (8.9%) |
| $75,000 to $99,999 | 56 (24.3%) | 8 (1.4%) |
| $100,000 to $149,999 | 35 (15.2%) | 81 (13.9%) |
| $150,000 or more | 41 (17.8%) | 195 (33.3%) |
| Total | 230 (100.0%) | 585 (100.0%) |
Property Value to Household Income Ratio in Puhi
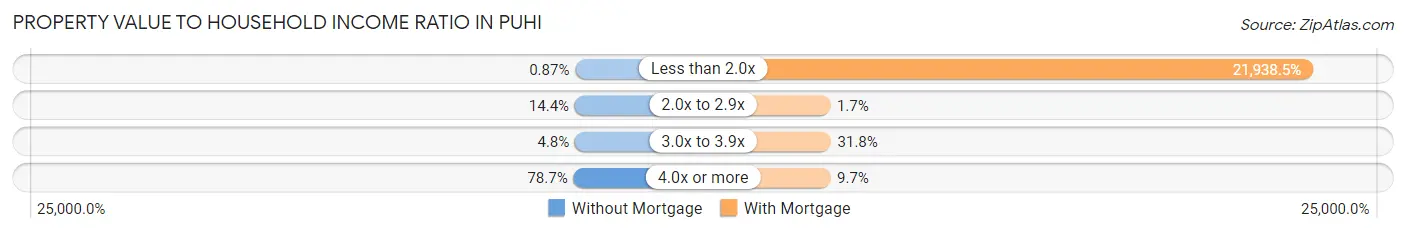
| Value-to-Income Ratio | Without Mortgage | With Mortgage |
| Less than 2.0x | 2 (0.9%) | 128,340 (21,938.5%) |
| 2.0x to 2.9x | 33 (14.3%) | 10 (1.7%) |
| 3.0x to 3.9x | 11 (4.8%) | 186 (31.8%) |
| 4.0x or more | 181 (78.7%) | 57 (9.7%) |
| Total | 230 (100.0%) | 585 (100.0%) |
Real Estate Taxes by Mortgage Status in Puhi
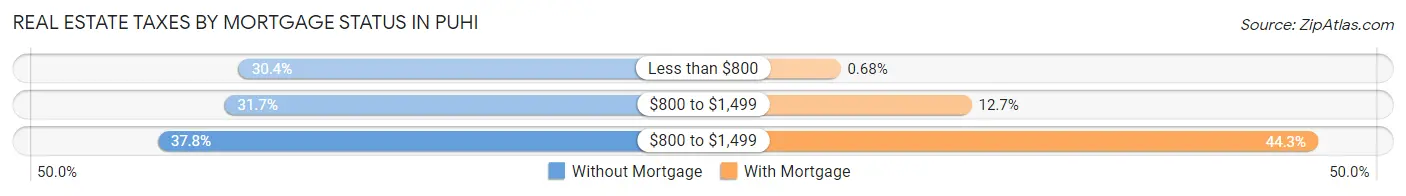
| Property Taxes | Without Mortgage | With Mortgage |
| Less than $800 | 70 (30.4%) | 4 (0.7%) |
| $800 to $1,499 | 73 (31.7%) | 74 (12.7%) |
| $800 to $1,499 | 87 (37.8%) | 259 (44.3%) |
| Total | 230 (100.0%) | 585 (100.0%) |
Health & Disability in Puhi
Health Insurance Coverage by Age in Puhi
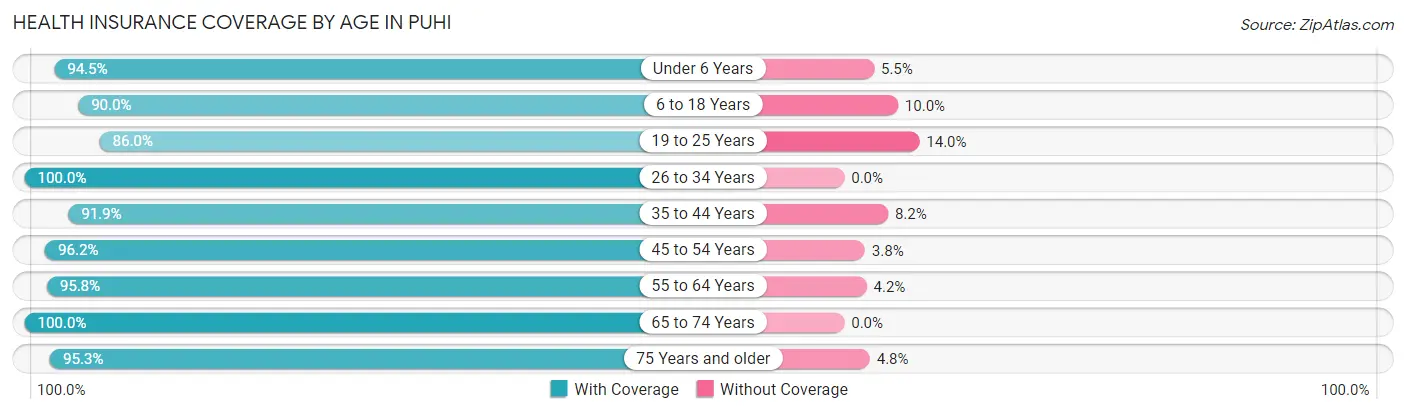
| Age Bracket | With Coverage | Without Coverage |
| Under 6 Years | 324 (94.5%) | 19 (5.5%) |
| 6 to 18 Years | 468 (90.0%) | 52 (10.0%) |
| 19 to 25 Years | 258 (86.0%) | 42 (14.0%) |
| 26 to 34 Years | 677 (100.0%) | 0 (0.0%) |
| 35 to 44 Years | 338 (91.8%) | 30 (8.2%) |
| 45 to 54 Years | 576 (96.2%) | 23 (3.8%) |
| 55 to 64 Years | 507 (95.8%) | 22 (4.2%) |
| 65 to 74 Years | 281 (100.0%) | 0 (0.0%) |
| 75 Years and older | 321 (95.3%) | 16 (4.8%) |
| Total | 3,750 (94.8%) | 204 (5.2%) |
Health Insurance Coverage by Citizenship Status in Puhi
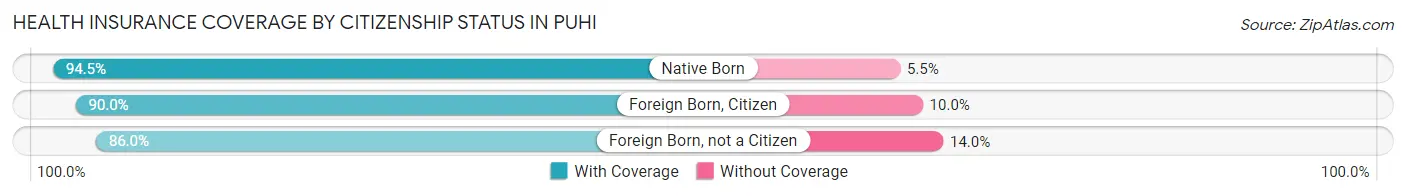
| Citizenship Status | With Coverage | Without Coverage |
| Native Born | 324 (94.5%) | 19 (5.5%) |
| Foreign Born, Citizen | 468 (90.0%) | 52 (10.0%) |
| Foreign Born, not a Citizen | 258 (86.0%) | 42 (14.0%) |
Health Insurance Coverage by Household Income in Puhi
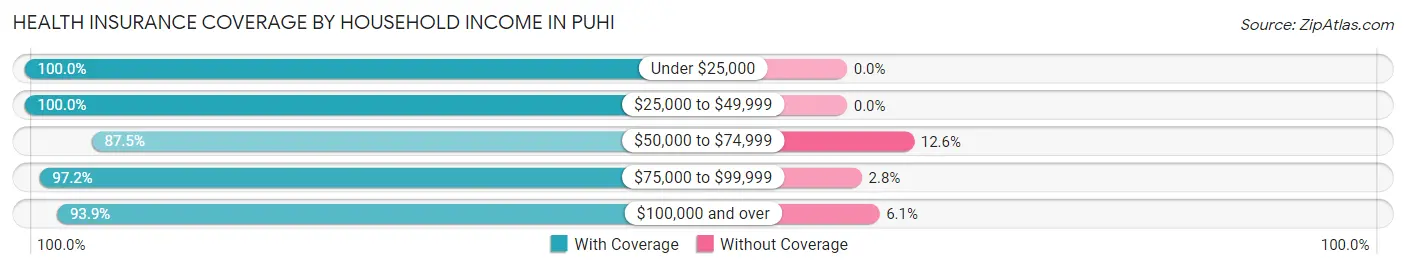
| Household Income | With Coverage | Without Coverage |
| Under $25,000 | 223 (100.0%) | 0 (0.0%) |
| $25,000 to $49,999 | 262 (100.0%) | 0 (0.0%) |
| $50,000 to $74,999 | 216 (87.5%) | 31 (12.6%) |
| $75,000 to $99,999 | 665 (97.2%) | 19 (2.8%) |
| $100,000 and over | 2,384 (93.9%) | 154 (6.1%) |
Public vs Private Health Insurance Coverage by Age in Puhi
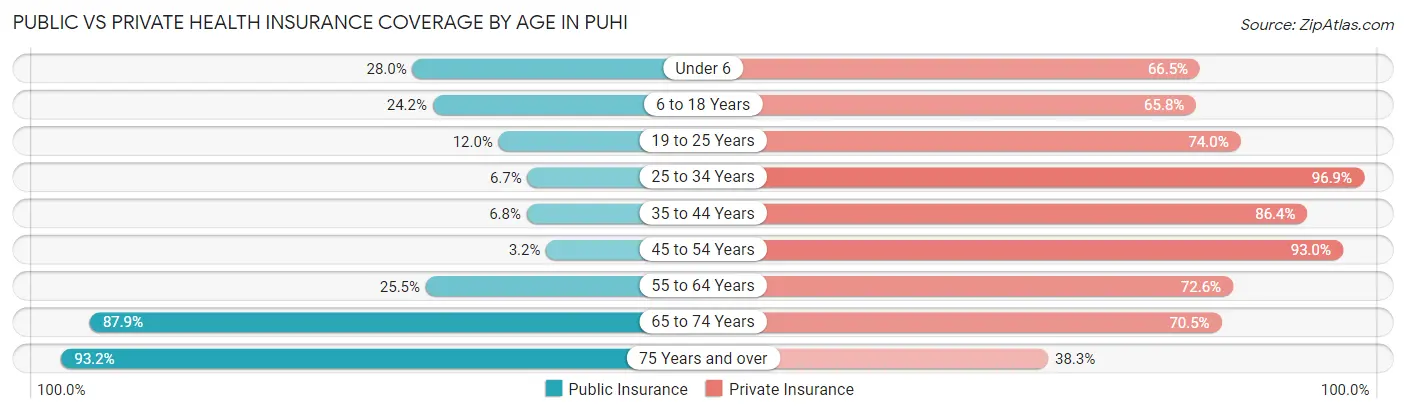
| Age Bracket | Public Insurance | Private Insurance |
| Under 6 | 96 (28.0%) | 228 (66.5%) |
| 6 to 18 Years | 126 (24.2%) | 342 (65.8%) |
| 19 to 25 Years | 36 (12.0%) | 222 (74.0%) |
| 25 to 34 Years | 45 (6.7%) | 656 (96.9%) |
| 35 to 44 Years | 25 (6.8%) | 318 (86.4%) |
| 45 to 54 Years | 19 (3.2%) | 557 (93.0%) |
| 55 to 64 Years | 135 (25.5%) | 384 (72.6%) |
| 65 to 74 Years | 247 (87.9%) | 198 (70.5%) |
| 75 Years and over | 314 (93.2%) | 129 (38.3%) |
| Total | 1,043 (26.4%) | 3,034 (76.7%) |
Disability Status by Sex by Age in Puhi
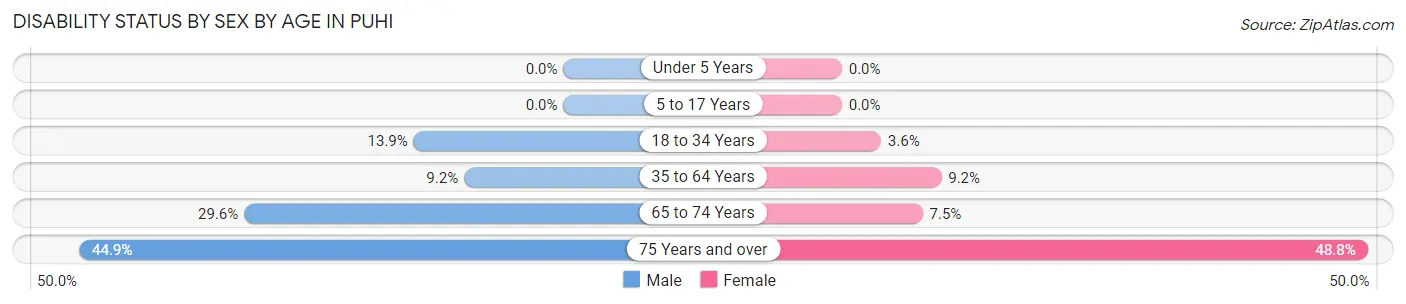
| Age Bracket | Male | Female |
| Under 5 Years | 0 (0.0%) | 0 (0.0%) |
| 5 to 17 Years | 0 (0.0%) | 0 (0.0%) |
| 18 to 34 Years | 72 (13.9%) | 17 (3.6%) |
| 35 to 64 Years | 73 (9.2%) | 65 (9.2%) |
| 65 to 74 Years | 24 (29.6%) | 15 (7.5%) |
| 75 Years and over | 40 (44.9%) | 121 (48.8%) |
Disability Class by Sex by Age in Puhi
Disability Class: Hearing Difficulty
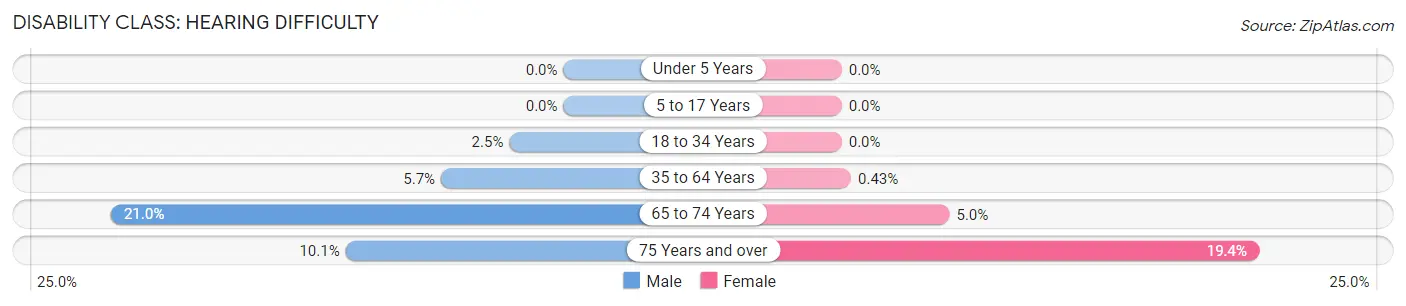
| Age Bracket | Male | Female |
| Under 5 Years | 0 (0.0%) | 0 (0.0%) |
| 5 to 17 Years | 0 (0.0%) | 0 (0.0%) |
| 18 to 34 Years | 13 (2.5%) | 0 (0.0%) |
| 35 to 64 Years | 45 (5.7%) | 3 (0.4%) |
| 65 to 74 Years | 17 (21.0%) | 10 (5.0%) |
| 75 Years and over | 9 (10.1%) | 48 (19.4%) |
Disability Class: Vision Difficulty
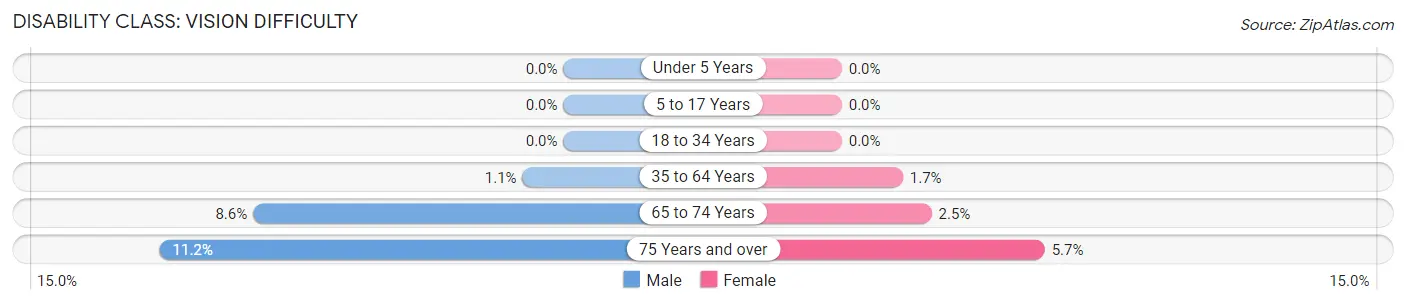
| Age Bracket | Male | Female |
| Under 5 Years | 0 (0.0%) | 0 (0.0%) |
| 5 to 17 Years | 0 (0.0%) | 0 (0.0%) |
| 18 to 34 Years | 0 (0.0%) | 0 (0.0%) |
| 35 to 64 Years | 9 (1.1%) | 12 (1.7%) |
| 65 to 74 Years | 7 (8.6%) | 5 (2.5%) |
| 75 Years and over | 10 (11.2%) | 14 (5.7%) |
Disability Class: Cognitive Difficulty
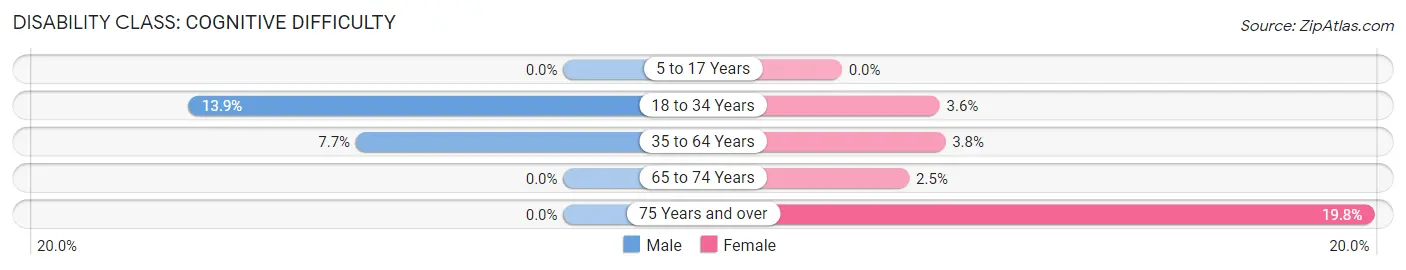
| Age Bracket | Male | Female |
| 5 to 17 Years | 0 (0.0%) | 0 (0.0%) |
| 18 to 34 Years | 72 (13.9%) | 17 (3.6%) |
| 35 to 64 Years | 61 (7.7%) | 27 (3.8%) |
| 65 to 74 Years | 0 (0.0%) | 5 (2.5%) |
| 75 Years and over | 0 (0.0%) | 49 (19.8%) |
Disability Class: Ambulatory Difficulty
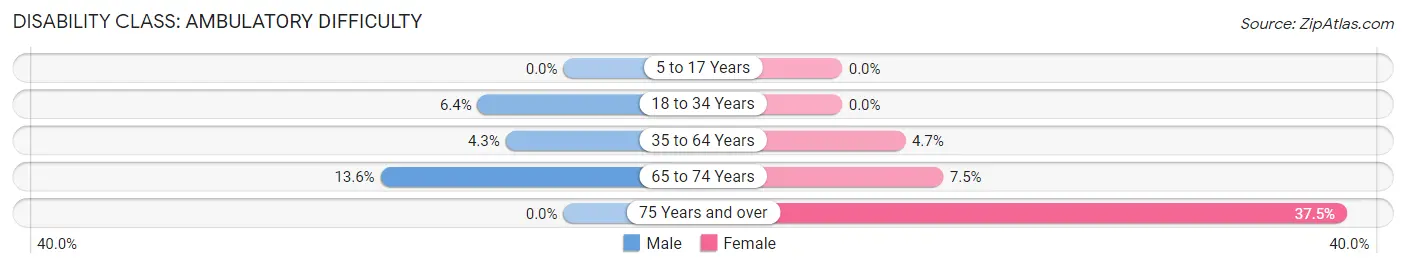
| Age Bracket | Male | Female |
| 5 to 17 Years | 0 (0.0%) | 0 (0.0%) |
| 18 to 34 Years | 33 (6.4%) | 0 (0.0%) |
| 35 to 64 Years | 34 (4.3%) | 33 (4.7%) |
| 65 to 74 Years | 11 (13.6%) | 15 (7.5%) |
| 75 Years and over | 0 (0.0%) | 93 (37.5%) |
Disability Class: Self-Care Difficulty
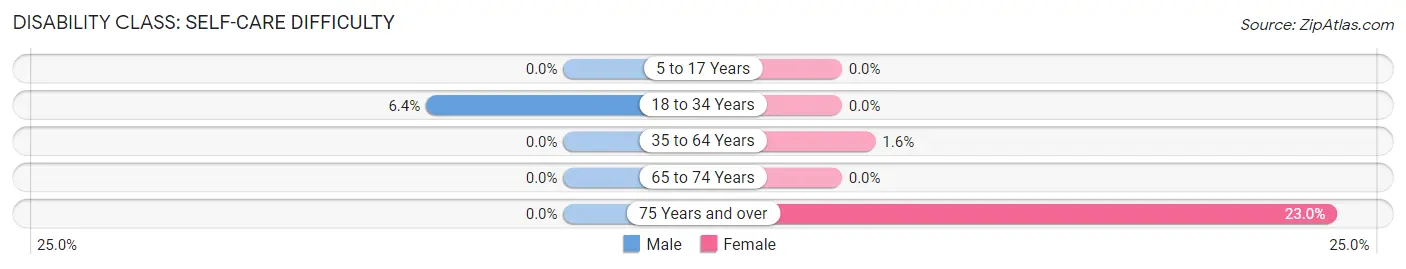
| Age Bracket | Male | Female |
| 5 to 17 Years | 0 (0.0%) | 0 (0.0%) |
| 18 to 34 Years | 33 (6.4%) | 0 (0.0%) |
| 35 to 64 Years | 0 (0.0%) | 11 (1.6%) |
| 65 to 74 Years | 0 (0.0%) | 0 (0.0%) |
| 75 Years and over | 0 (0.0%) | 57 (23.0%) |
Technology Access in Puhi
Computing Device Access in Puhi
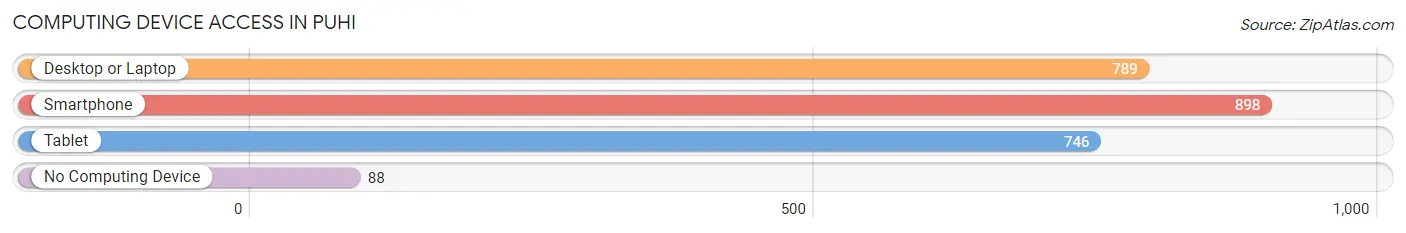
| Device Type | # Households | % Households |
| Desktop or Laptop | 789 | 78.3% |
| Smartphone | 898 | 89.1% |
| Tablet | 746 | 74.0% |
| No Computing Device | 88 | 8.7% |
| Total | 1,008 | 100.0% |
Internet Access in Puhi
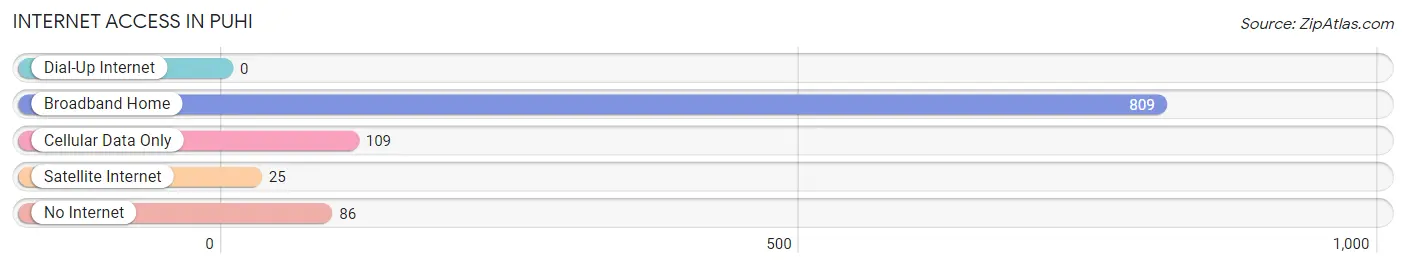
| Internet Type | # Households | % Households |
| Dial-Up Internet | 0 | 0.0% |
| Broadband Home | 809 | 80.3% |
| Cellular Data Only | 109 | 10.8% |
| Satellite Internet | 25 | 2.5% |
| No Internet | 86 | 8.5% |
| Total | 1,008 | 100.0% |
Puhi Summary
Puhi is a small unincorporated community located in Kauai County, Hawaii. It is situated on the eastern side of the island of Kauai, approximately 8 miles north of the county seat of Lihue. Puhi is a rural community with a population of approximately 1,000 people.
Geography
Puhi is located on the eastern side of the island of Kauai, approximately 8 miles north of the county seat of Lihue. The community is situated in a valley surrounded by the Wailua River to the north, the Hanamaulu Stream to the east, and the Puhi Stream to the south. The terrain is mostly flat, with some rolling hills. The climate is tropical, with temperatures ranging from the mid-70s to the mid-80s year-round.
History
Puhi was first settled by Native Hawaiians in the late 1700s. The area was used for farming and fishing, and the community was known for its abundance of taro and sweet potatoes. In the late 1800s, the area was developed for sugarcane production, and the Puhi Sugar Mill was built in 1891. The mill operated until the early 1900s, when it was closed due to a decline in sugar prices.
In the early 1900s, Puhi began to develop as a residential community. The area was served by a post office, a school, and a few stores. In the 1950s, the Puhi Shopping Center was built, providing the community with a grocery store, a drug store, and other retail outlets.
Economy
The economy of Puhi is largely based on tourism and agriculture. The area is home to several resorts and hotels, as well as a number of small farms and ranches. The Puhi Shopping Center provides the community with a grocery store, a drug store, and other retail outlets.
Demographics
As of the 2010 census, the population of Puhi was 1,000. The racial makeup of the community was 79.2% White, 8.2% Native Hawaiian or Pacific Islander, 6.2% Asian, 4.2% from other races, and 2.2% from two or more races. The median household income was $50,000, and the median age was 44.
Conclusion
Puhi is a small unincorporated community located in Kauai County, Hawaii. It is situated on the eastern side of the island of Kauai, approximately 8 miles north of the county seat of Lihue. Puhi is a rural community with a population of approximately 1,000 people. The economy of Puhi is largely based on tourism and agriculture, and the area is home to several resorts and hotels, as well as a number of small farms and ranches. The racial makeup of the community is 79.2% White, 8.2% Native Hawaiian or Pacific Islander, 6.2% Asian, 4.2% from other races, and 2.2% from two or more races. The median household income was $50,000, and the median age was 44.
Common Questions
What is Per Capita Income in Puhi?
Per Capita income in Puhi is $33,064.
What is the Median Family Income in Puhi?
Median Family Income in Puhi is $119,779.
What is the Median Household income in Puhi?
Median Household Income in Puhi is $118,676.
What is Income or Wage Gap in Puhi?
Income or Wage Gap in Puhi is 34.0%.
Women in Puhi earn 66.0 cents for every dollar earned by a man.
What is Inequality or Gini Index in Puhi?
Inequality or Gini Index in Puhi is 0.30.
What is the Total Population of Puhi?
Total Population of Puhi is 3,961.
What is the Total Male Population of Puhi?
Total Male Population of Puhi is 1,999.
What is the Total Female Population of Puhi?
Total Female Population of Puhi is 1,962.
What is the Ratio of Males per 100 Females in Puhi?
There are 101.89 Males per 100 Females in Puhi.
What is the Ratio of Females per 100 Males in Puhi?
There are 98.15 Females per 100 Males in Puhi.
What is the Median Population Age in Puhi?
Median Population Age in Puhi is 38.5 Years.
What is the Average Family Size in Puhi
Average Family Size in Puhi is 4.0 People.
What is the Average Household Size in Puhi
Average Household Size in Puhi is 3.9 People.
How Large is the Labor Force in Puhi?
There are 2,403 People in the Labor Forcein in Puhi.
What is the Percentage of People in the Labor Force in Puhi?
75.2% of People are in the Labor Force in Puhi.
What is the Unemployment Rate in Puhi?
Unemployment Rate in Puhi is 2.8%.