Mokuleia, HI Map & Demographics
Mokuleia Map
Mokuleia Overview
$63,640
PER CAPITA INCOME
$110,625
AVG FAMILY INCOME
$83,688
AVG HOUSEHOLD INCOME
13.1%
WAGE / INCOME GAP [ % ]
86.9¢/ $1
WAGE / INCOME GAP [ $ ]
0.54
INEQUALITY / GINI INDEX
1,782
TOTAL POPULATION
947
MALE POPULATION
835
FEMALE POPULATION
113.41
MALES / 100 FEMALES
88.17
FEMALES / 100 MALES
39.1
MEDIAN AGE
3.1
AVG FAMILY SIZE
2.3
AVG HOUSEHOLD SIZE
1,042
LABOR FORCE [ PEOPLE ]
67.2%
PERCENT IN LABOR FORCE
3.6%
UNEMPLOYMENT RATE
Income in Mokuleia
Income Overview in Mokuleia
Per Capita Income in Mokuleia is $63,640, while median incomes of families and households are $110,625 and $83,688 respectively.
| Characteristic | Number | Measure |
| Per Capita Income | 1,782 | $63,640 |
| Median Family Income | 380 | $110,625 |
| Mean Family Income | 380 | $144,825 |
| Median Household Income | 777 | $83,688 |
| Mean Household Income | 777 | $141,970 |
| Income Deficit | 380 | $0 |
| Wage / Income Gap (%) | 1,782 | 13.07% |
| Wage / Income Gap ($) | 1,782 | 86.93¢ per $1 |
| Gini / Inequality Index | 1,782 | 0.54 |
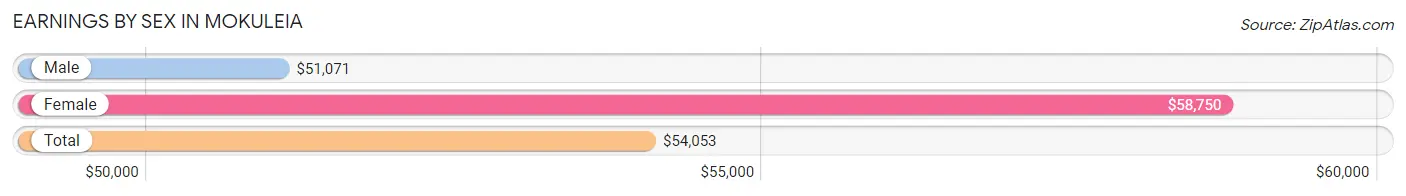
Earnings by Sex in Mokuleia
Average Earnings in Mokuleia are $54,053, $51,071 for men and $58,750 for women, a difference of 13.1%.
| Sex | Number | Average Earnings |
| Male | 648 (60.5%) | $51,071 |
| Female | 423 (39.5%) | $58,750 |
| Total | 1,071 (100.0%) | $54,053 |
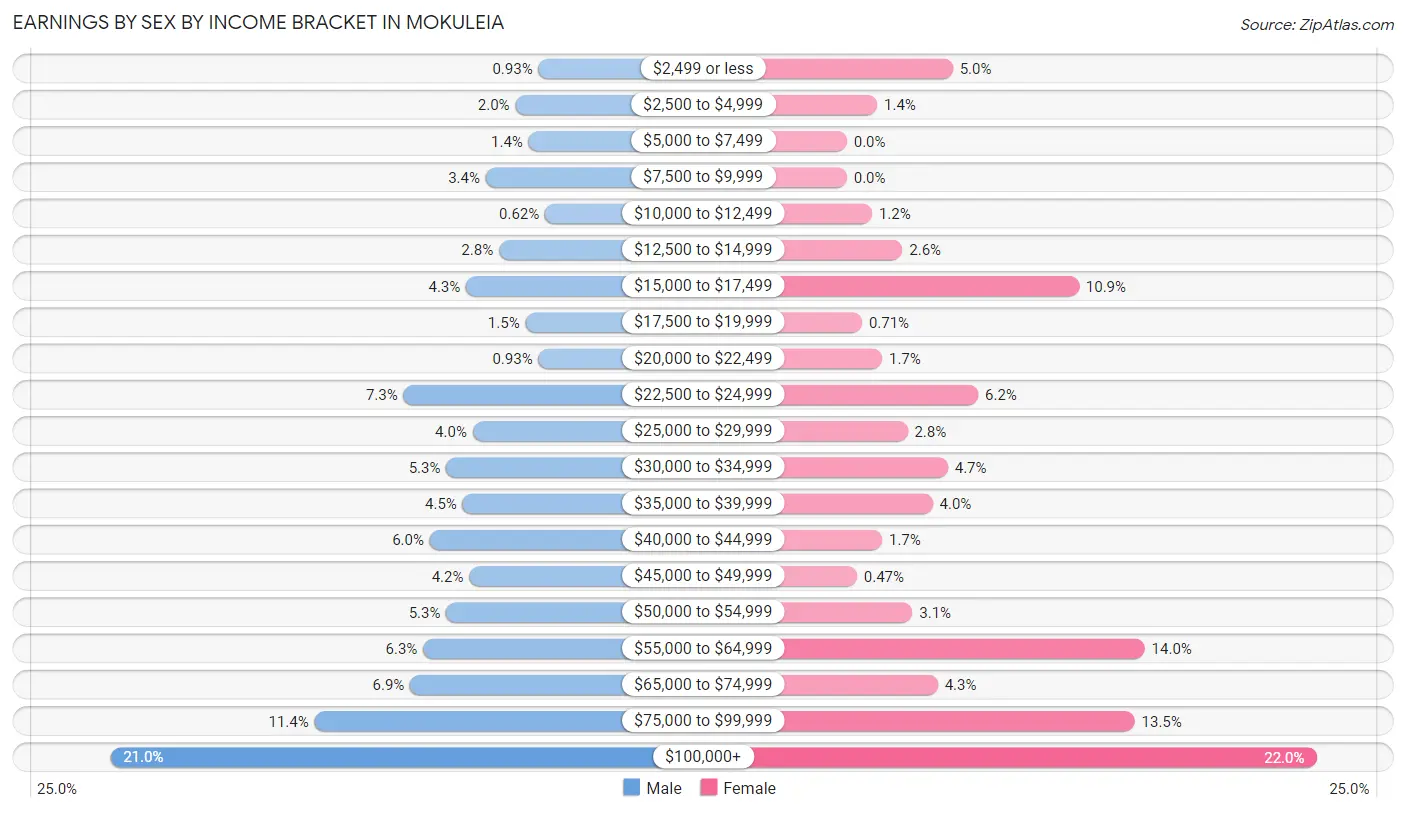
Earnings by Sex by Income Bracket in Mokuleia
The most common earnings brackets in Mokuleia are $100,000+ for men (136 | 21.0%) and $100,000+ for women (93 | 22.0%).
| Income | Male | Female |
| $2,499 or less | 6 (0.9%) | 21 (5.0%) |
| $2,500 to $4,999 | 13 (2.0%) | 6 (1.4%) |
| $5,000 to $7,499 | 9 (1.4%) | 0 (0.0%) |
| $7,500 to $9,999 | 22 (3.4%) | 0 (0.0%) |
| $10,000 to $12,499 | 4 (0.6%) | 5 (1.2%) |
| $12,500 to $14,999 | 18 (2.8%) | 11 (2.6%) |
| $15,000 to $17,499 | 28 (4.3%) | 46 (10.9%) |
| $17,500 to $19,999 | 10 (1.5%) | 3 (0.7%) |
| $20,000 to $22,499 | 6 (0.9%) | 7 (1.7%) |
| $22,500 to $24,999 | 47 (7.2%) | 26 (6.1%) |
| $25,000 to $29,999 | 26 (4.0%) | 12 (2.8%) |
| $30,000 to $34,999 | 34 (5.2%) | 20 (4.7%) |
| $35,000 to $39,999 | 29 (4.5%) | 17 (4.0%) |
| $40,000 to $44,999 | 39 (6.0%) | 7 (1.7%) |
| $45,000 to $49,999 | 27 (4.2%) | 2 (0.5%) |
| $50,000 to $54,999 | 34 (5.2%) | 13 (3.1%) |
| $55,000 to $64,999 | 41 (6.3%) | 59 (14.0%) |
| $65,000 to $74,999 | 45 (6.9%) | 18 (4.3%) |
| $75,000 to $99,999 | 74 (11.4%) | 57 (13.5%) |
| $100,000+ | 136 (21.0%) | 93 (22.0%) |
| Total | 648 (100.0%) | 423 (100.0%) |
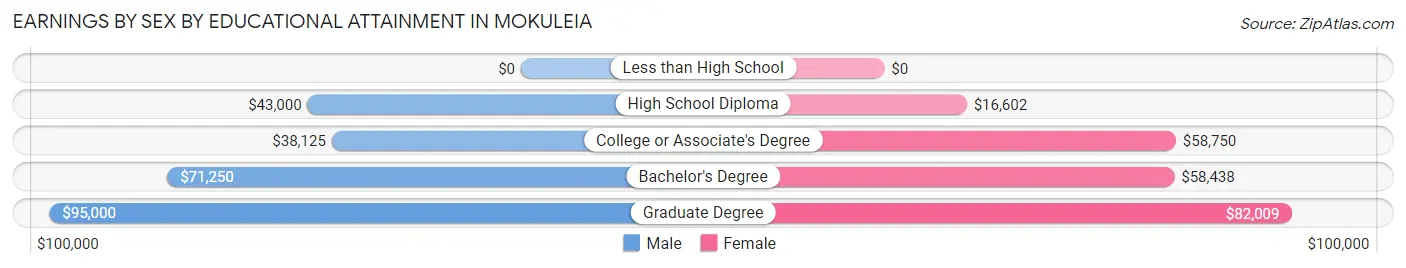
Earnings by Sex by Educational Attainment in Mokuleia
Average earnings in Mokuleia are $59,531 for men and $62,625 for women, a difference of 4.9%. Men with an educational attainment of graduate degree enjoy the highest average annual earnings of $95,000, while those with college or associate's degree education earn the least with $38,125. Women with an educational attainment of graduate degree earn the most with the average annual earnings of $82,009, while those with high school diploma education have the smallest earnings of $16,602.
| Educational Attainment | Male Income | Female Income |
| Less than High School | - | - |
| High School Diploma | $43,000 | $16,602 |
| College or Associate's Degree | $38,125 | $58,750 |
| Bachelor's Degree | $71,250 | $58,438 |
| Graduate Degree | $95,000 | $82,009 |
| Total | $59,531 | $62,625 |
Family Income in Mokuleia
Family Income Brackets in Mokuleia
According to the Mokuleia family income data, there are 89 families falling into the $100,000 to $149,999 income range, which is the most common income bracket and makes up 23.4% of all families. Conversely, the $15,000 to $24,999 income bracket is the least frequent group with only 3 families (0.8%) belonging to this category.
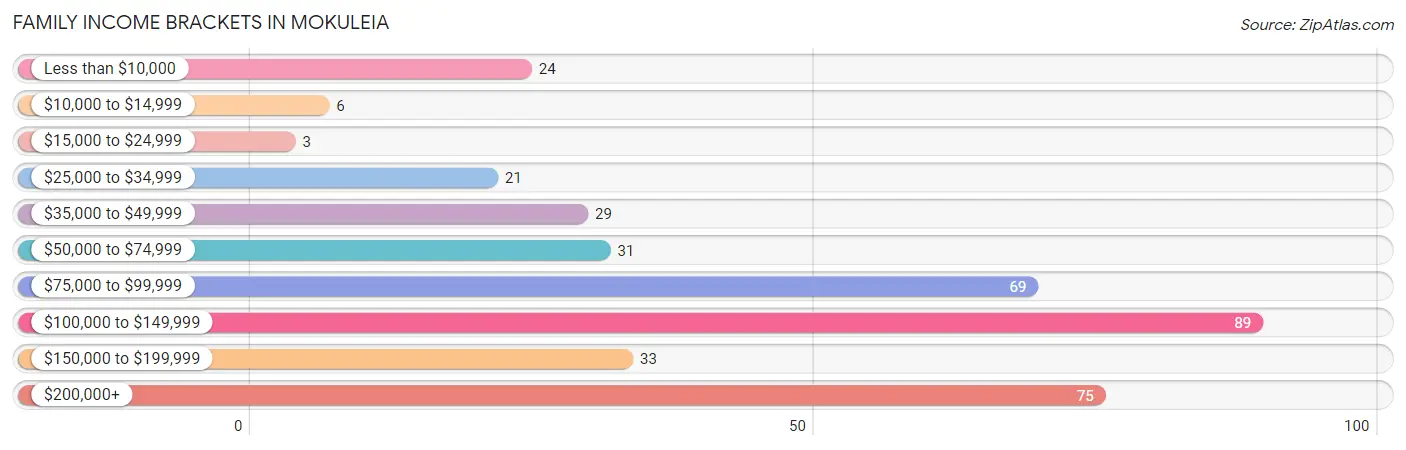
| Income Bracket | # Families | % Families |
| Less than $10,000 | 24 | 6.3% |
| $10,000 to $14,999 | 6 | 1.6% |
| $15,000 to $24,999 | 3 | 0.8% |
| $25,000 to $34,999 | 21 | 5.5% |
| $35,000 to $49,999 | 29 | 7.6% |
| $50,000 to $74,999 | 31 | 8.2% |
| $75,000 to $99,999 | 69 | 18.2% |
| $100,000 to $149,999 | 89 | 23.4% |
| $150,000 to $199,999 | 33 | 8.7% |
| $200,000+ | 75 | 19.7% |
Family Income by Famaliy Size in Mokuleia
4-person families (48 | 12.6%) account for the highest median family income in Mokuleia with $135,227 per family, while 2-person families (195 | 51.3%) have the highest median income of $49,488 per family member.
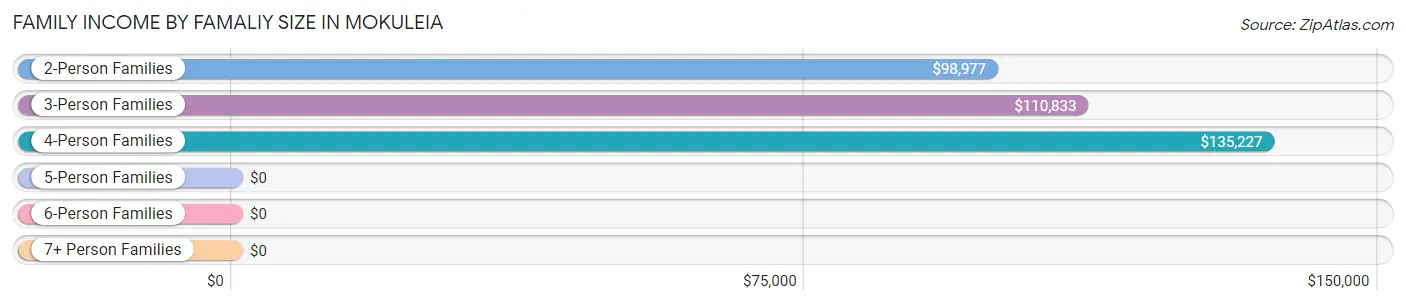
| Income Bracket | # Families | Median Income |
| 2-Person Families | 195 (51.3%) | $98,977 |
| 3-Person Families | 122 (32.1%) | $110,833 |
| 4-Person Families | 48 (12.6%) | $135,227 |
| 5-Person Families | 8 (2.1%) | $0 |
| 6-Person Families | 2 (0.5%) | $0 |
| 7+ Person Families | 5 (1.3%) | $0 |
| Total | 380 (100.0%) | $110,625 |
Family Income by Number of Earners in Mokuleia
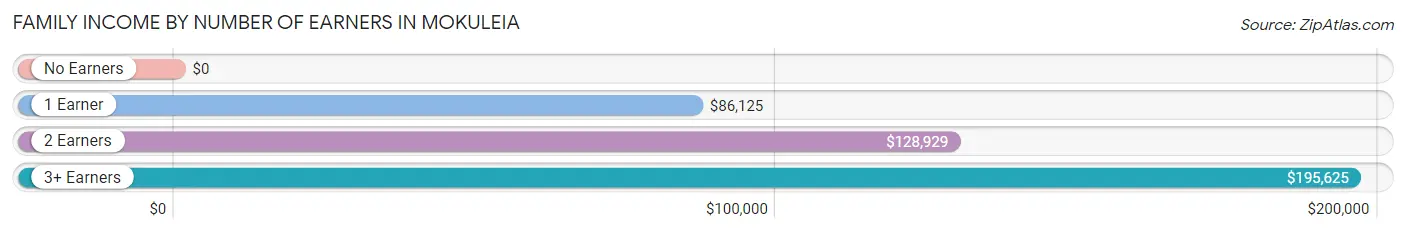
| Number of Earners | # Families | Median Income |
| No Earners | 63 (16.6%) | $0 |
| 1 Earner | 139 (36.6%) | $86,125 |
| 2 Earners | 154 (40.5%) | $128,929 |
| 3+ Earners | 24 (6.3%) | $195,625 |
| Total | 380 (100.0%) | $110,625 |
Household Income in Mokuleia
Household Income Brackets in Mokuleia
With 154 households falling in the category, the $100,000 to $149,999 income range is the most frequent in Mokuleia, accounting for 19.8% of all households. In contrast, only 21 households (2.7%) fall into the $10,000 to $14,999 income bracket, making it the least populous group.
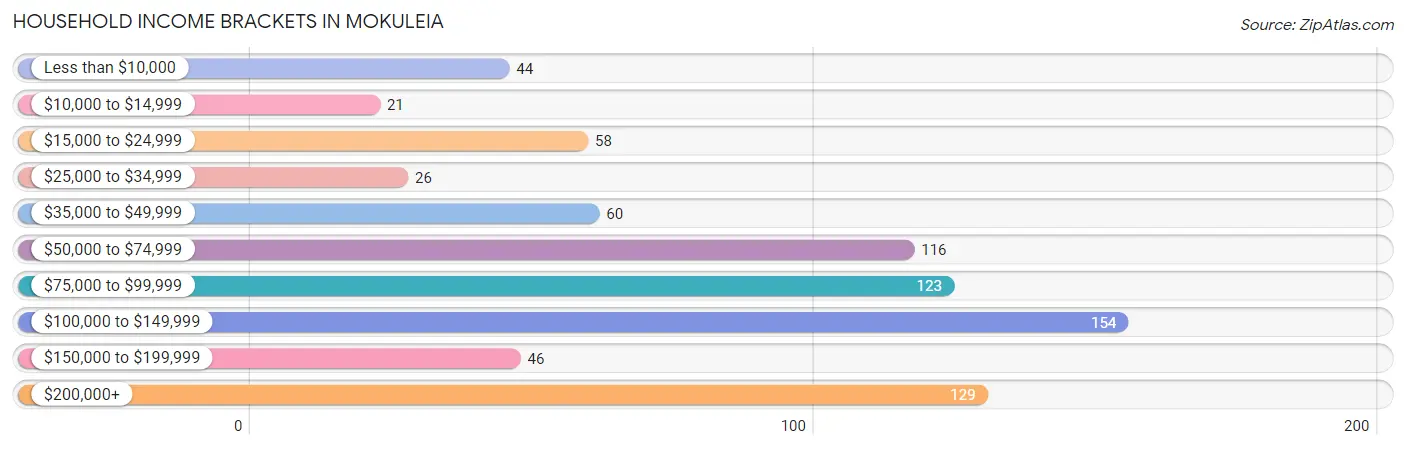
| Income Bracket | # Households | % Households |
| Less than $10,000 | 44 | 5.7% |
| $10,000 to $14,999 | 21 | 2.7% |
| $15,000 to $24,999 | 58 | 7.5% |
| $25,000 to $34,999 | 26 | 3.3% |
| $35,000 to $49,999 | 60 | 7.7% |
| $50,000 to $74,999 | 116 | 14.9% |
| $75,000 to $99,999 | 123 | 15.8% |
| $100,000 to $149,999 | 154 | 19.8% |
| $150,000 to $199,999 | 46 | 5.9% |
| $200,000+ | 129 | 16.6% |
Household Income by Householder Age in Mokuleia
The median household income in Mokuleia is $83,688, with the highest median household income of $93,125 found in the 45 to 64 years age bracket for the primary householder. A total of 223 households (28.7%) fall into this category. Meanwhile, the 65+ years age bracket for the primary householder has the lowest median household income of $70,714, with 228 households (29.3%) in this group.
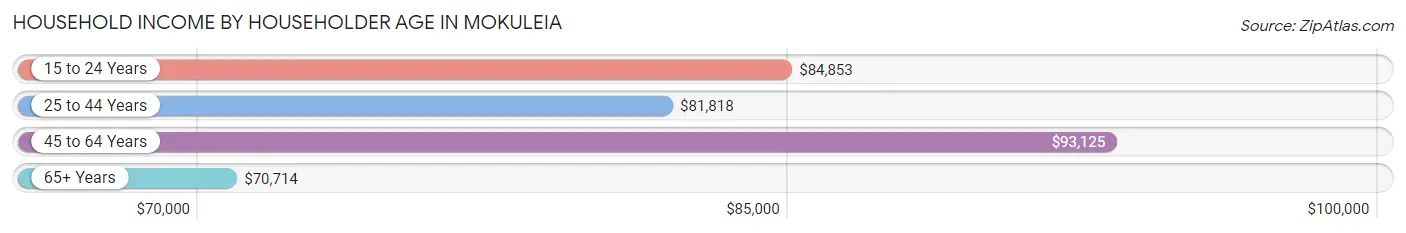
| Income Bracket | # Households | Median Income |
| 15 to 24 Years | 40 (5.1%) | $84,853 |
| 25 to 44 Years | 286 (36.8%) | $81,818 |
| 45 to 64 Years | 223 (28.7%) | $93,125 |
| 65+ Years | 228 (29.3%) | $70,714 |
| Total | 777 (100.0%) | $83,688 |
Poverty in Mokuleia
Income Below Poverty by Sex and Age in Mokuleia
With 13.5% poverty level for males and 15.0% for females among the residents of Mokuleia, 18 to 24 year old males and 45 to 54 year old females are the most vulnerable to poverty, with 62 males (38.8%) and 74 females (45.4%) in their respective age groups living below the poverty level.
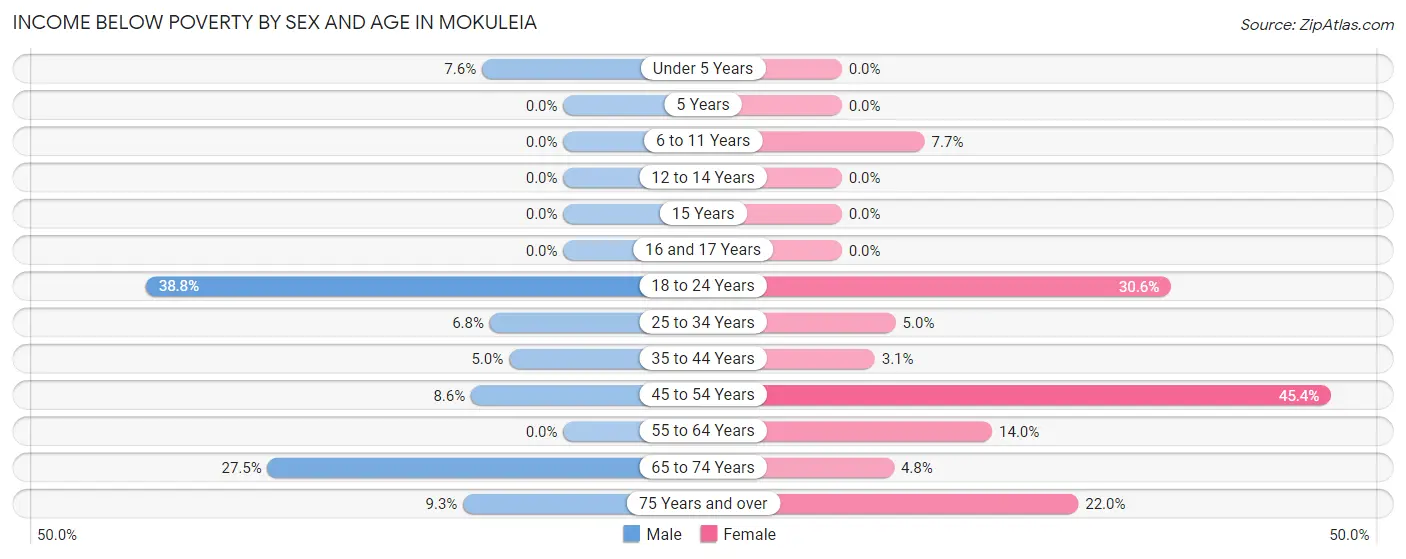
| Age Bracket | Male | Female |
| Under 5 Years | 4 (7.5%) | 0 (0.0%) |
| 5 Years | 0 (0.0%) | 0 (0.0%) |
| 6 to 11 Years | 0 (0.0%) | 3 (7.7%) |
| 12 to 14 Years | 0 (0.0%) | 0 (0.0%) |
| 15 Years | 0 (0.0%) | 0 (0.0%) |
| 16 and 17 Years | 0 (0.0%) | 0 (0.0%) |
| 18 to 24 Years | 62 (38.8%) | 11 (30.6%) |
| 25 to 34 Years | 14 (6.8%) | 7 (5.0%) |
| 35 to 44 Years | 7 (5.0%) | 3 (3.1%) |
| 45 to 54 Years | 9 (8.6%) | 74 (45.4%) |
| 55 to 64 Years | 0 (0.0%) | 12 (14.0%) |
| 65 to 74 Years | 28 (27.5%) | 6 (4.8%) |
| 75 Years and over | 4 (9.3%) | 9 (22.0%) |
| Total | 128 (13.5%) | 125 (15.0%) |
Income Above Poverty by Sex and Age in Mokuleia
According to the poverty statistics in Mokuleia, males aged 5 years and females aged under 5 years are the age groups that are most secure financially, with 100.0% of males and 100.0% of females in these age groups living above the poverty line.
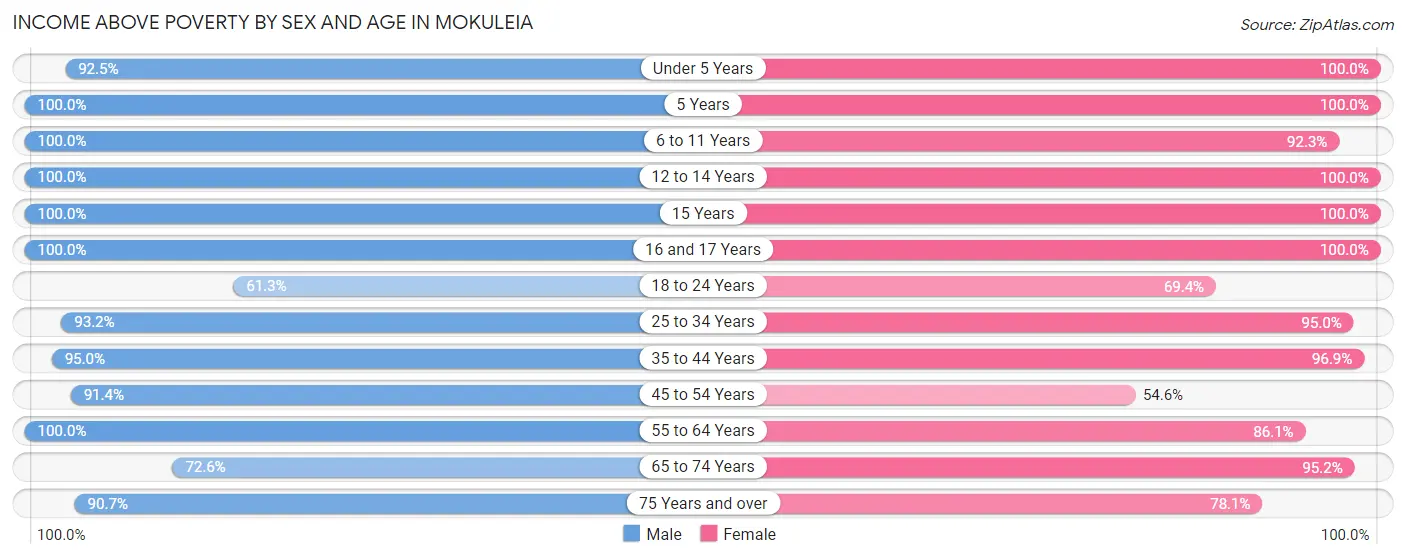
| Age Bracket | Male | Female |
| Under 5 Years | 49 (92.4%) | 34 (100.0%) |
| 5 Years | 3 (100.0%) | 28 (100.0%) |
| 6 to 11 Years | 16 (100.0%) | 36 (92.3%) |
| 12 to 14 Years | 15 (100.0%) | 27 (100.0%) |
| 15 Years | 5 (100.0%) | 11 (100.0%) |
| 16 and 17 Years | 3 (100.0%) | 8 (100.0%) |
| 18 to 24 Years | 98 (61.3%) | 25 (69.4%) |
| 25 to 34 Years | 191 (93.2%) | 133 (95.0%) |
| 35 to 44 Years | 132 (95.0%) | 95 (96.9%) |
| 45 to 54 Years | 96 (91.4%) | 89 (54.6%) |
| 55 to 64 Years | 98 (100.0%) | 74 (86.1%) |
| 65 to 74 Years | 74 (72.6%) | 118 (95.2%) |
| 75 Years and over | 39 (90.7%) | 32 (78.0%) |
| Total | 819 (86.5%) | 710 (85.0%) |
Income Below Poverty Among Married-Couple Families in Mokuleia
The poverty statistics for married-couple families in Mokuleia show that 8.0% or 26 of the total 325 families live below the poverty line. Families with no children have the highest poverty rate of 12.2%, comprising of 26 families. On the other hand, families with 1 or 2 children have the lowest poverty rate of 0.0%, which includes 0 families.
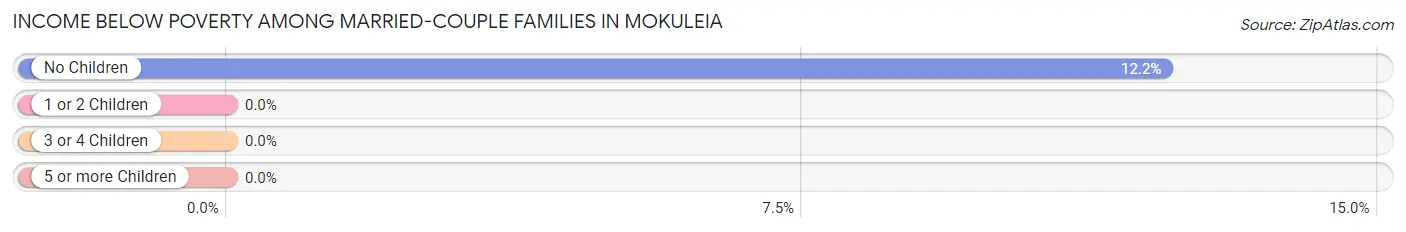
| Children | Above Poverty | Below Poverty |
| No Children | 187 (87.8%) | 26 (12.2%) |
| 1 or 2 Children | 110 (100.0%) | 0 (0.0%) |
| 3 or 4 Children | 2 (100.0%) | 0 (0.0%) |
| 5 or more Children | 0 (0.0%) | 0 (0.0%) |
| Total | 299 (92.0%) | 26 (8.0%) |
Income Below Poverty Among Single-Parent Households in Mokuleia
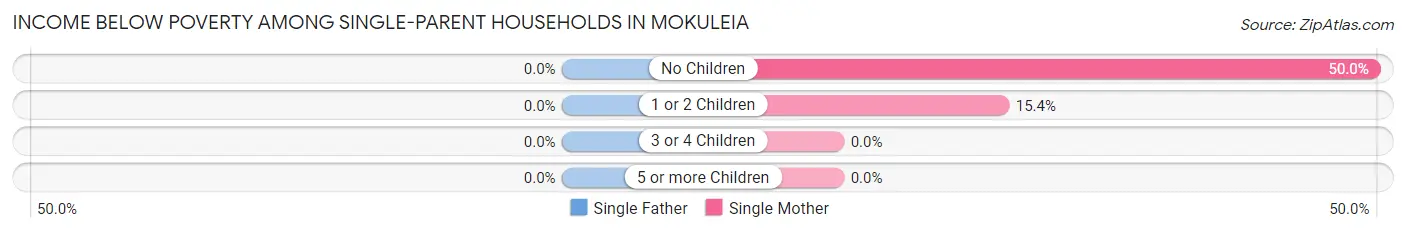
| Children | Single Father | Single Mother |
| No Children | 0 (0.0%) | 3 (50.0%) |
| 1 or 2 Children | 0 (0.0%) | 4 (15.4%) |
| 3 or 4 Children | 0 (0.0%) | 0 (0.0%) |
| 5 or more Children | 0 (0.0%) | 0 (0.0%) |
| Total | 0 (0.0%) | 7 (21.9%) |
Income Below Poverty Among Married-Couple vs Single-Parent Households in Mokuleia
The poverty data for Mokuleia shows that 26 of the married-couple family households (8.0%) and 7 of the single-parent households (12.7%) are living below the poverty level. Within the married-couple family households, those with no children have the highest poverty rate, with 26 households (12.2%) falling below the poverty line. Among the single-parent households, those with no children have the highest poverty rate, with 3 household (50.0%) living below poverty.
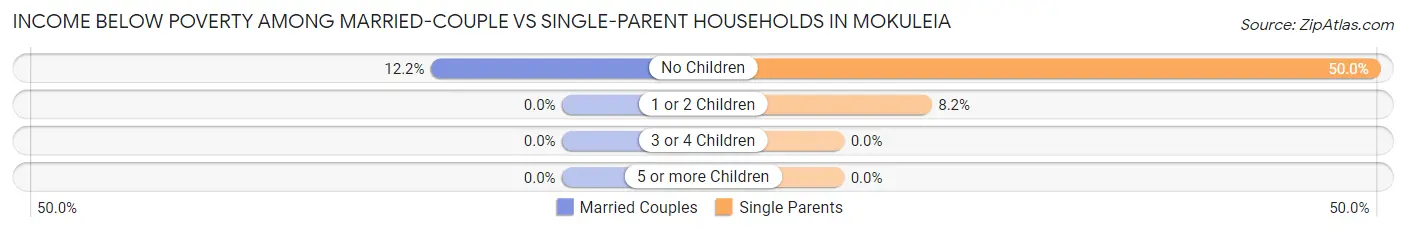
| Children | Married-Couple Families | Single-Parent Households |
| No Children | 26 (12.2%) | 3 (50.0%) |
| 1 or 2 Children | 0 (0.0%) | 4 (8.2%) |
| 3 or 4 Children | 0 (0.0%) | 0 (0.0%) |
| 5 or more Children | 0 (0.0%) | 0 (0.0%) |
| Total | 26 (8.0%) | 7 (12.7%) |
Race in Mokuleia
The most populous races in Mokuleia are White / Caucasian (1,237 | 69.4%), Two or more Races (342 | 19.2%), and Asian (119 | 6.7%).
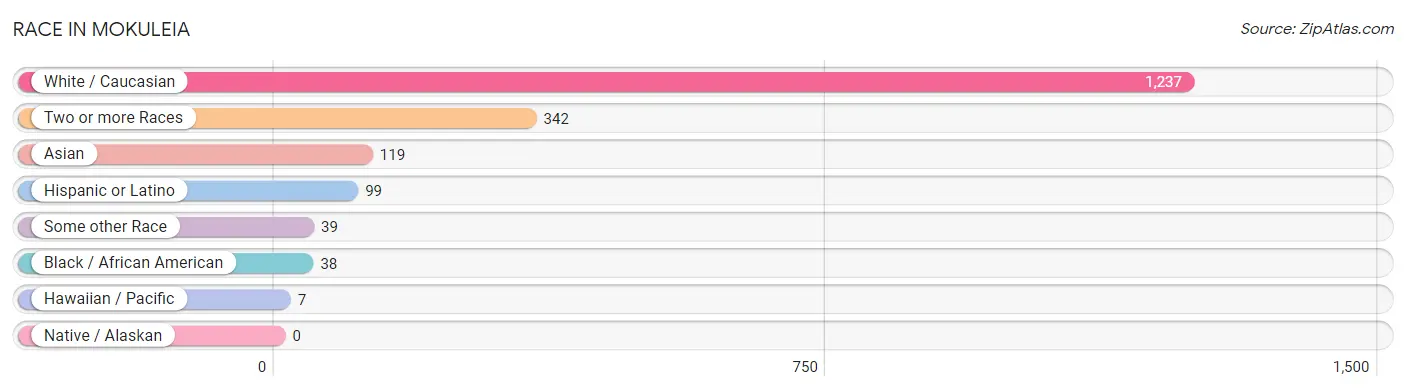
| Race | # Population | % Population |
| Asian | 119 | 6.7% |
| Black / African American | 38 | 2.1% |
| Hawaiian / Pacific | 7 | 0.4% |
| Hispanic or Latino | 99 | 5.6% |
| Native / Alaskan | 0 | 0.0% |
| White / Caucasian | 1,237 | 69.4% |
| Two or more Races | 342 | 19.2% |
| Some other Race | 39 | 2.2% |
| Total | 1,782 | 100.0% |
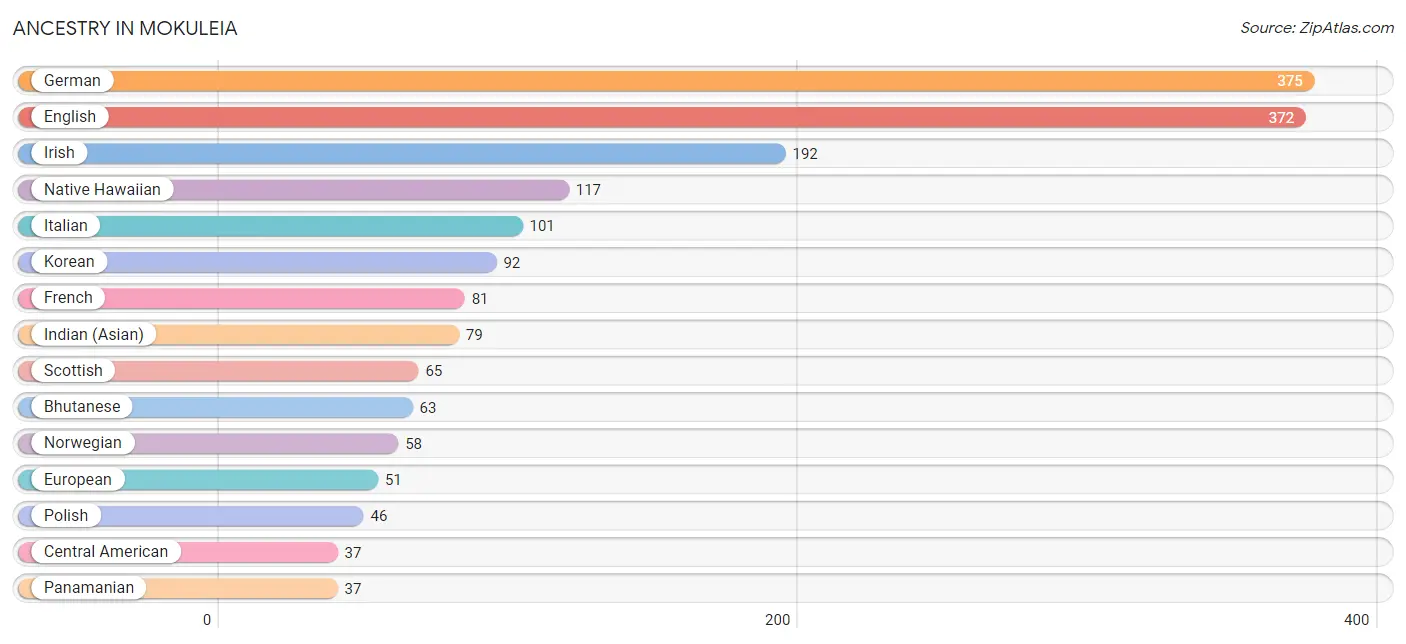
Ancestry in Mokuleia
The most populous ancestries reported in Mokuleia are German (375 | 21.0%), English (372 | 20.9%), Irish (192 | 10.8%), Native Hawaiian (117 | 6.6%), and Italian (101 | 5.7%), together accounting for 64.9% of all Mokuleia residents.
| Ancestry | # Population | % Population |
| American | 24 | 1.3% |
| Australian | 16 | 0.9% |
| Austrian | 5 | 0.3% |
| Belgian | 11 | 0.6% |
| Bhutanese | 63 | 3.5% |
| Blackfeet | 15 | 0.8% |
| Brazilian | 14 | 0.8% |
| Burmese | 27 | 1.5% |
| Central American | 37 | 2.1% |
| Central American Indian | 7 | 0.4% |
| Cherokee | 8 | 0.4% |
| Croatian | 9 | 0.5% |
| Cuban | 9 | 0.5% |
| Czech | 4 | 0.2% |
| Danish | 3 | 0.2% |
| Dominican | 11 | 0.6% |
| Dutch | 12 | 0.7% |
| English | 372 | 20.9% |
| European | 51 | 2.9% |
| French | 81 | 4.5% |
| German | 375 | 21.0% |
| Greek | 23 | 1.3% |
| Indian (Asian) | 79 | 4.4% |
| Irish | 192 | 10.8% |
| Italian | 101 | 5.7% |
| Japanese | 26 | 1.5% |
| Korean | 92 | 5.2% |
| Laotian | 3 | 0.2% |
| Macedonian | 8 | 0.4% |
| Mexican | 21 | 1.2% |
| Native Hawaiian | 117 | 6.6% |
| Northern European | 6 | 0.3% |
| Norwegian | 58 | 3.3% |
| Pakistani | 3 | 0.2% |
| Panamanian | 37 | 2.1% |
| Polish | 46 | 2.6% |
| Portuguese | 30 | 1.7% |
| Puerto Rican | 14 | 0.8% |
| Scotch-Irish | 13 | 0.7% |
| Scottish | 65 | 3.6% |
| Serbian | 2 | 0.1% |
| Slovene | 8 | 0.4% |
| South African | 31 | 1.7% |
| South American | 3 | 0.2% |
| Spaniard | 2 | 0.1% |
| Spanish | 2 | 0.1% |
| Sri Lankan | 15 | 0.8% |
| Subsaharan African | 31 | 1.7% |
| Swedish | 19 | 1.1% |
| Swiss | 3 | 0.2% |
| Thai | 3 | 0.2% |
| Ukrainian | 12 | 0.7% |
| Venezuelan | 3 | 0.2% |
| Welsh | 24 | 1.3% | View All 54 Rows |
Immigrants in Mokuleia
The most numerous immigrant groups reported in Mokuleia came from Asia (44 | 2.5%), Latin America (35 | 2.0%), Africa (34 | 1.9%), South Africa (34 | 1.9%), and Europe (32 | 1.8%), together accounting for 10.0% of all Mokuleia residents.
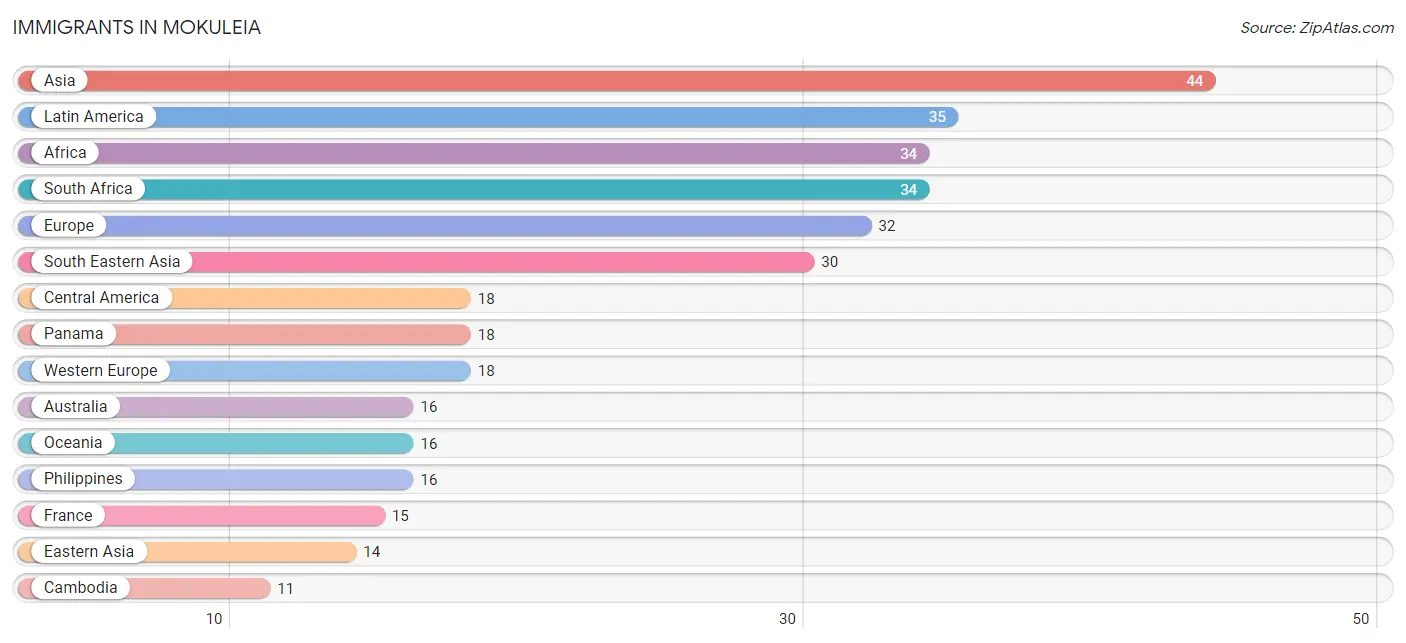
| Immigration Origin | # Population | % Population |
| Africa | 34 | 1.9% |
| Asia | 44 | 2.5% |
| Australia | 16 | 0.9% |
| Brazil | 10 | 0.6% |
| Cambodia | 11 | 0.6% |
| Canada | 6 | 0.3% |
| Caribbean | 7 | 0.4% |
| Central America | 18 | 1.0% |
| China | 8 | 0.4% |
| Dominican Republic | 7 | 0.4% |
| Eastern Asia | 14 | 0.8% |
| Eastern Europe | 9 | 0.5% |
| Europe | 32 | 1.8% |
| France | 15 | 0.8% |
| Germany | 3 | 0.2% |
| Korea | 6 | 0.3% |
| Latin America | 35 | 2.0% |
| Northern Europe | 5 | 0.3% |
| Oceania | 16 | 0.9% |
| Panama | 18 | 1.0% |
| Philippines | 16 | 0.9% |
| South Africa | 34 | 1.9% |
| South America | 10 | 0.6% |
| South Eastern Asia | 30 | 1.7% |
| Taiwan | 8 | 0.4% |
| Thailand | 3 | 0.2% |
| Ukraine | 9 | 0.5% |
| Western Europe | 18 | 1.0% | View All 28 Rows |
Sex and Age in Mokuleia
Sex and Age in Mokuleia
The most populous age groups in Mokuleia are 30 to 34 Years (137 | 14.5%) for men and 50 to 54 Years (111 | 13.3%) for women.
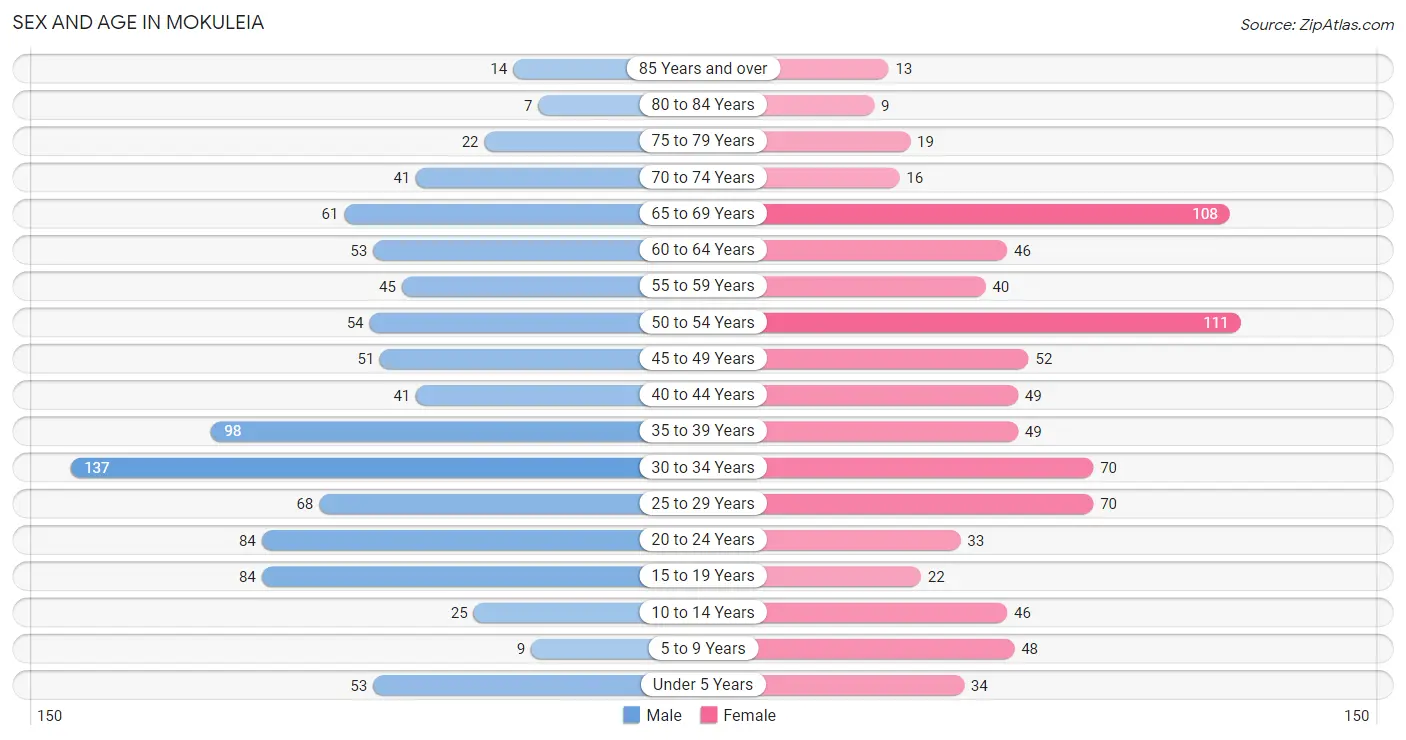
| Age Bracket | Male | Female |
| Under 5 Years | 53 (5.6%) | 34 (4.1%) |
| 5 to 9 Years | 9 (0.9%) | 48 (5.8%) |
| 10 to 14 Years | 25 (2.6%) | 46 (5.5%) |
| 15 to 19 Years | 84 (8.9%) | 22 (2.6%) |
| 20 to 24 Years | 84 (8.9%) | 33 (4.0%) |
| 25 to 29 Years | 68 (7.2%) | 70 (8.4%) |
| 30 to 34 Years | 137 (14.5%) | 70 (8.4%) |
| 35 to 39 Years | 98 (10.3%) | 49 (5.9%) |
| 40 to 44 Years | 41 (4.3%) | 49 (5.9%) |
| 45 to 49 Years | 51 (5.4%) | 52 (6.2%) |
| 50 to 54 Years | 54 (5.7%) | 111 (13.3%) |
| 55 to 59 Years | 45 (4.8%) | 40 (4.8%) |
| 60 to 64 Years | 53 (5.6%) | 46 (5.5%) |
| 65 to 69 Years | 61 (6.4%) | 108 (12.9%) |
| 70 to 74 Years | 41 (4.3%) | 16 (1.9%) |
| 75 to 79 Years | 22 (2.3%) | 19 (2.3%) |
| 80 to 84 Years | 7 (0.7%) | 9 (1.1%) |
| 85 Years and over | 14 (1.5%) | 13 (1.6%) |
| Total | 947 (100.0%) | 835 (100.0%) |
Families and Households in Mokuleia
Median Family Size in Mokuleia
The median family size in Mokuleia is 3.13 persons per family, with married-couple families (325 | 85.5%) accounting for the largest median family size of 3.2 persons per family. On the other hand, single female/mother families (32 | 8.4%) represent the smallest median family size with 2.66 persons per family.
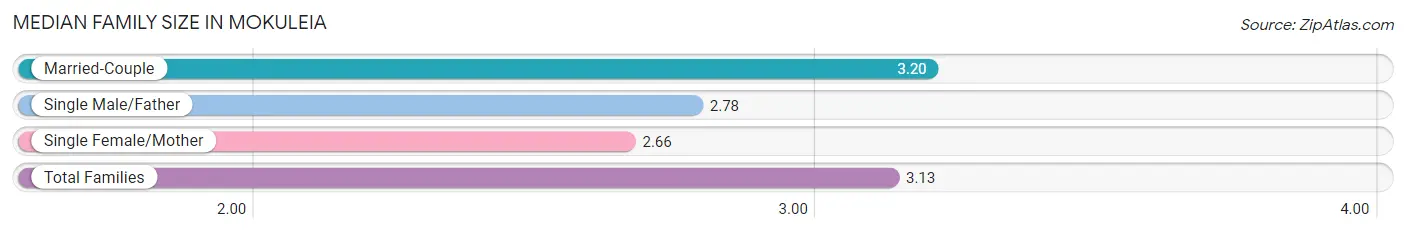
| Family Type | # Families | Family Size |
| Married-Couple | 325 (85.5%) | 3.20 |
| Single Male/Father | 23 (6.0%) | 2.78 |
| Single Female/Mother | 32 (8.4%) | 2.66 |
| Total Families | 380 (100.0%) | 3.13 |
Median Household Size in Mokuleia
The median household size in Mokuleia is 2.29 persons per household, with married-couple households (325 | 41.8%) accounting for the largest median household size of 3.42 persons per household. non-family households (397 | 51.1%) represent the smallest median household size with 1.29 persons per household.
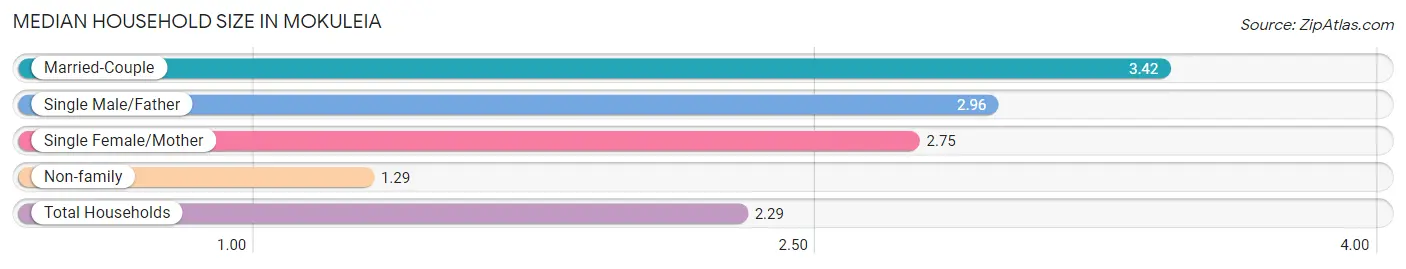
| Household Type | # Households | Household Size |
| Married-Couple | 325 (41.8%) | 3.42 |
| Single Male/Father | 23 (3.0%) | 2.96 |
| Single Female/Mother | 32 (4.1%) | 2.75 |
| Non-family | 397 (51.1%) | 1.29 |
| Total Households | 777 (100.0%) | 2.29 |
Household Size by Marriage Status in Mokuleia
Out of a total of 777 households in Mokuleia, 380 (48.9%) are family households, while 397 (51.1%) are nonfamily households. The most numerous type of family households are 2-person households, comprising 180, and the most common type of nonfamily households are 1-person households, comprising 326.
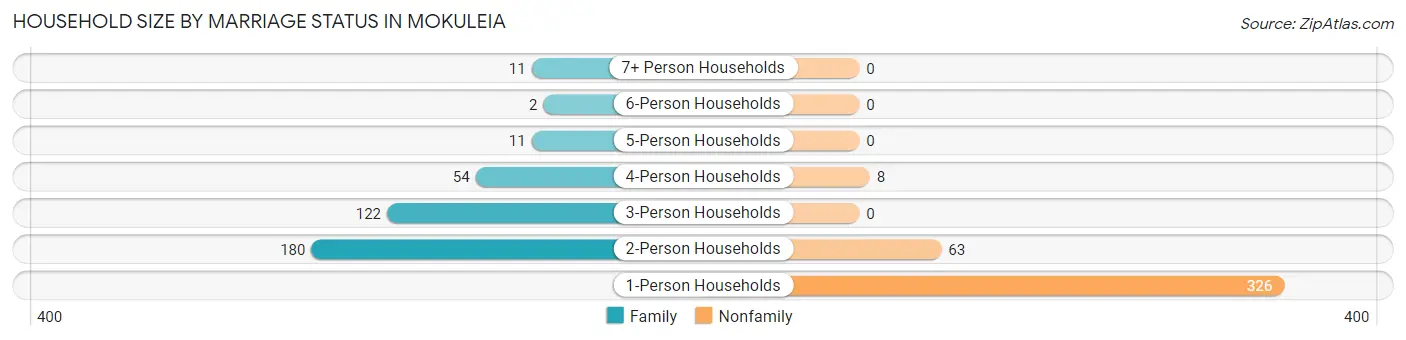
| Household Size | Family Households | Nonfamily Households |
| 1-Person Households | - | 326 (42.0%) |
| 2-Person Households | 180 (23.2%) | 63 (8.1%) |
| 3-Person Households | 122 (15.7%) | 0 (0.0%) |
| 4-Person Households | 54 (7.0%) | 8 (1.0%) |
| 5-Person Households | 11 (1.4%) | 0 (0.0%) |
| 6-Person Households | 2 (0.3%) | 0 (0.0%) |
| 7+ Person Households | 11 (1.4%) | 0 (0.0%) |
| Total | 380 (48.9%) | 397 (51.1%) |
Female Fertility in Mokuleia
Fertility by Age in Mokuleia
Average fertility rate in Mokuleia is 55.0 births per 1,000 women. Women in the age bracket of 35 to 50 years have the highest fertility rate with 100.0 births per 1,000 women. Women in the age bracket of 35 to 50 years acount for 78.9% of all women with births.
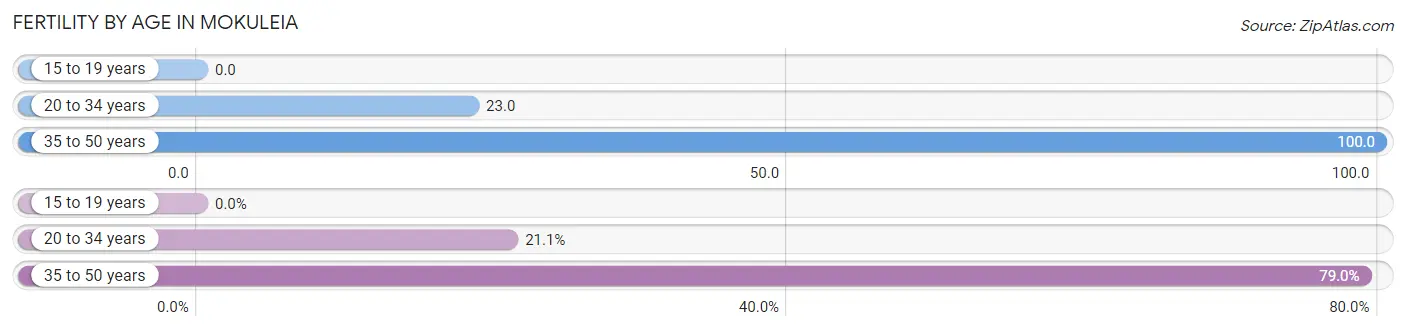
| Age Bracket | Women with Births | Births / 1,000 Women |
| 15 to 19 years | 0 (0.0%) | 0.0 |
| 20 to 34 years | 4 (21.0%) | 23.0 |
| 35 to 50 years | 15 (78.9%) | 100.0 |
| Total | 19 (100.0%) | 55.0 |
Fertility by Age by Marriage Status in Mokuleia
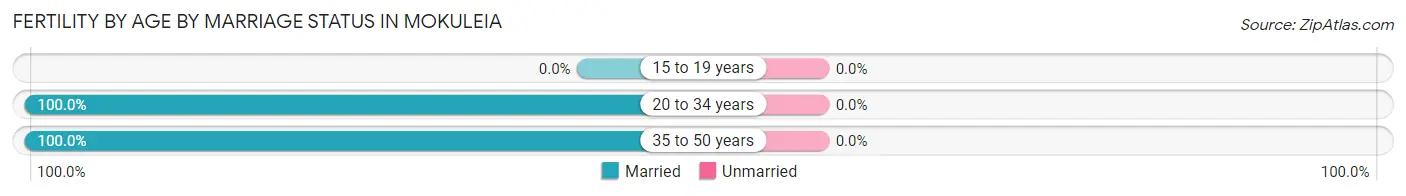
| Age Bracket | Married | Unmarried |
| 15 to 19 years | 0 (0.0%) | 0 (0.0%) |
| 20 to 34 years | 4 (100.0%) | 0 (0.0%) |
| 35 to 50 years | 15 (100.0%) | 0 (0.0%) |
| Total | 19 (100.0%) | 0 (0.0%) |
Fertility by Education in Mokuleia
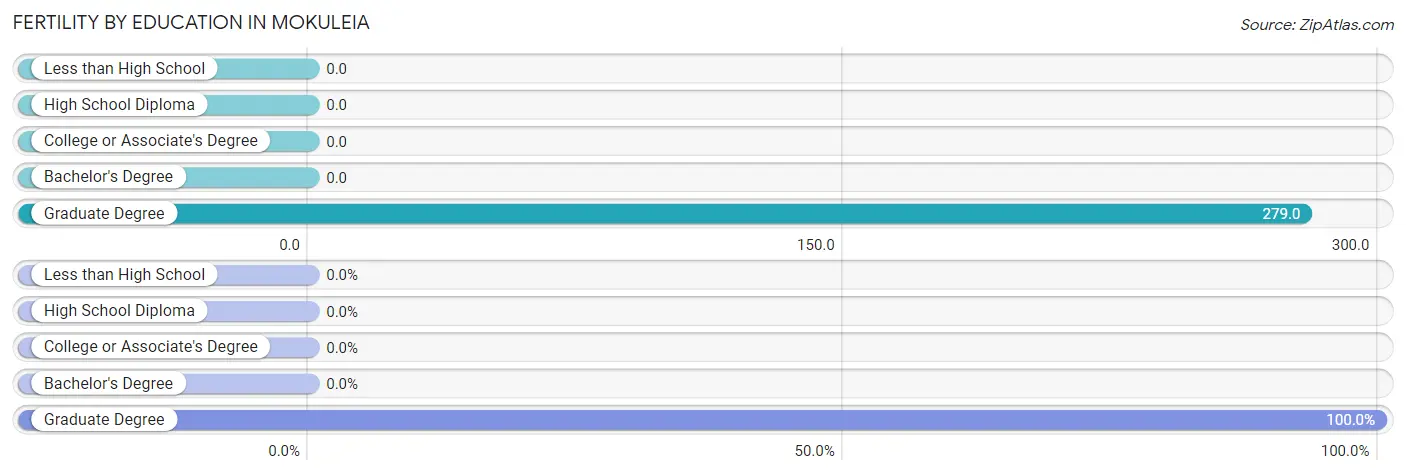
| Educational Attainment | Women with Births | Births / 1,000 Women |
| Less than High School | 0 (0.0%) | 0.0 |
| High School Diploma | 0 (0.0%) | 0.0 |
| College or Associate's Degree | 0 (0.0%) | 0.0 |
| Bachelor's Degree | 0 (0.0%) | 0.0 |
| Graduate Degree | 19 (100.0%) | 279.0 |
| Total | 19 (100.0%) | 55.0 |
Fertility by Education by Marriage Status in Mokuleia
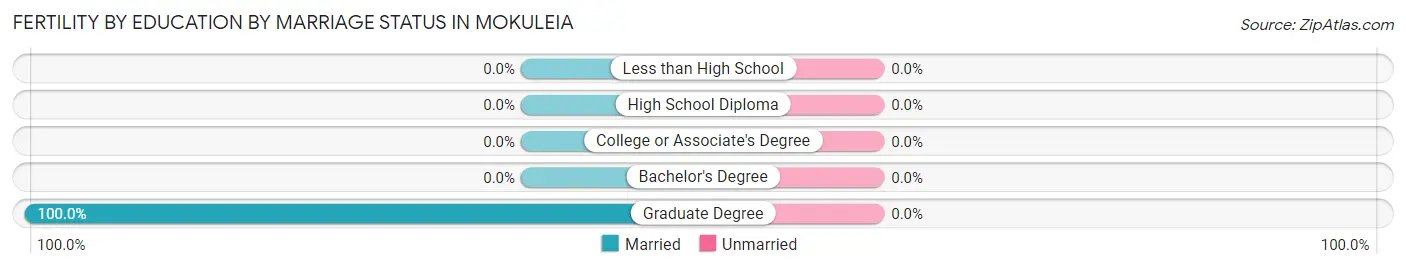
| Educational Attainment | Married | Unmarried |
| Less than High School | 0 (0.0%) | 0 (0.0%) |
| High School Diploma | 0 (0.0%) | 0 (0.0%) |
| College or Associate's Degree | 0 (0.0%) | 0 (0.0%) |
| Bachelor's Degree | 0 (0.0%) | 0 (0.0%) |
| Graduate Degree | 19 (100.0%) | 0 (0.0%) |
| Total | 19 (100.0%) | 0 (0.0%) |
Employment Characteristics in Mokuleia
Employment by Class of Employer in Mokuleia
Among the 990 employed individuals in Mokuleia, private company employees (365 | 36.9%), federal government employees (188 | 19.0%), and self-employed (incorporated) (129 | 13.0%) make up the most common classes of employment.
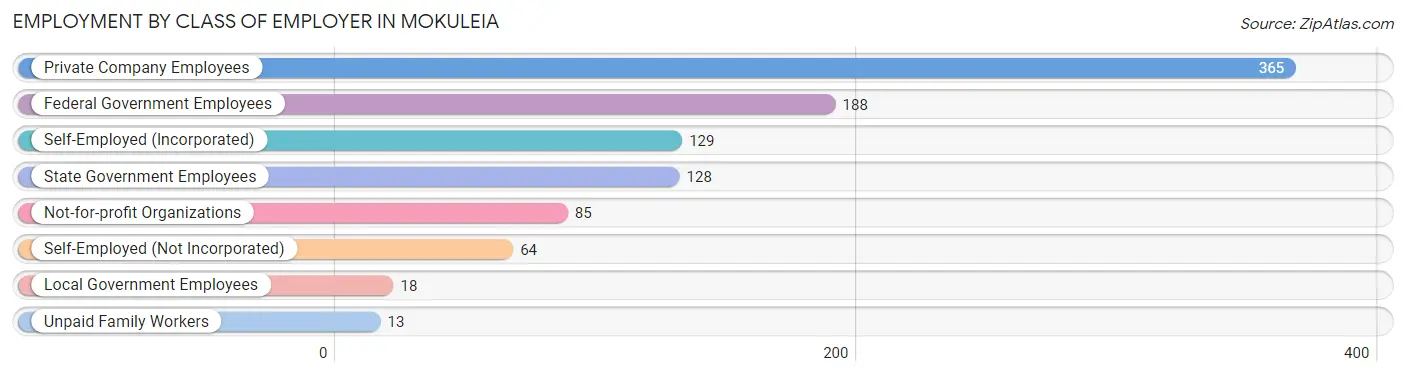
| Employer Class | # Employees | % Employees |
| Private Company Employees | 365 | 36.9% |
| Self-Employed (Incorporated) | 129 | 13.0% |
| Self-Employed (Not Incorporated) | 64 | 6.5% |
| Not-for-profit Organizations | 85 | 8.6% |
| Local Government Employees | 18 | 1.8% |
| State Government Employees | 128 | 12.9% |
| Federal Government Employees | 188 | 19.0% |
| Unpaid Family Workers | 13 | 1.3% |
| Total | 990 | 100.0% |
Employment Status by Age in Mokuleia
According to the labor force statistics for Mokuleia, out of the total population over 16 years of age (1,551), 67.2% or 1,042 individuals are in the labor force, with 3.6% or 38 of them unemployed. The age group with the highest labor force participation rate is 20 to 24 years, with 94.0% or 110 individuals in the labor force. Within the labor force, the 20 to 24 years age range has the highest percentage of unemployed individuals, with 12.3% or 14 of them being unemployed.
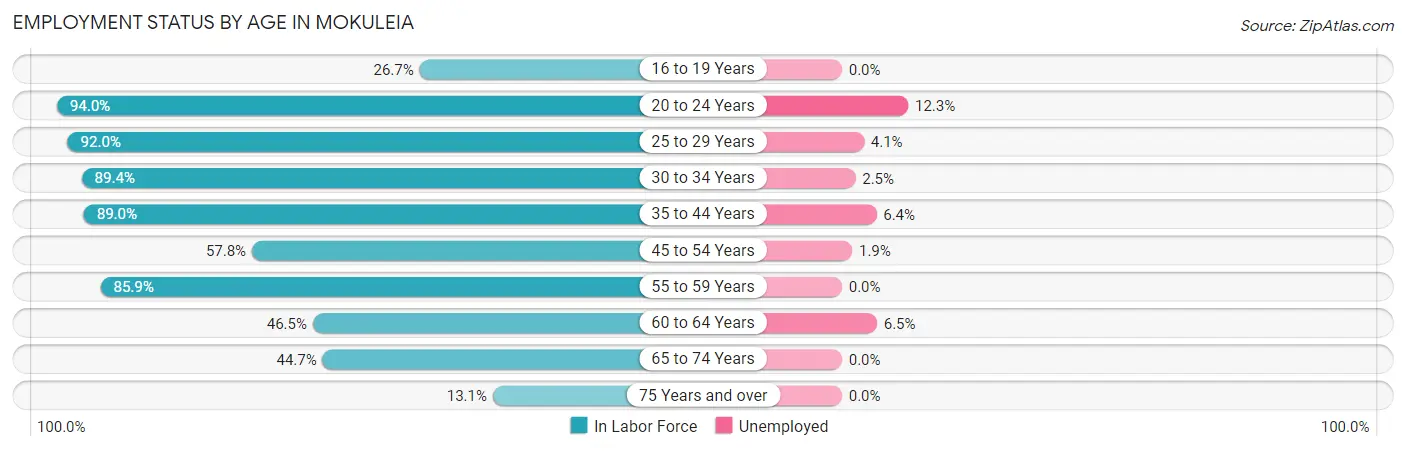
| Age Bracket | In Labor Force | Unemployed |
| 16 to 19 Years | 24 (26.7%) | 0 (0.0%) |
| 20 to 24 Years | 110 (94.0%) | 14 (12.3%) |
| 25 to 29 Years | 127 (92.0%) | 5 (4.1%) |
| 30 to 34 Years | 185 (89.4%) | 5 (2.5%) |
| 35 to 44 Years | 211 (89.0%) | 14 (6.4%) |
| 45 to 54 Years | 155 (57.8%) | 3 (1.9%) |
| 55 to 59 Years | 73 (85.9%) | 0 (0.0%) |
| 60 to 64 Years | 46 (46.5%) | 3 (6.5%) |
| 65 to 74 Years | 101 (44.7%) | 0 (0.0%) |
| 75 Years and over | 11 (13.1%) | 0 (0.0%) |
| Total | 1,042 (67.2%) | 38 (3.6%) |
Employment Status by Educational Attainment in Mokuleia
According to labor force statistics for Mokuleia, 77.1% of individuals (797) out of the total population between 25 and 64 years of age (1,034) are in the labor force, with 3.6% or 29 of them being unemployed. The group with the highest labor force participation rate are those with the educational attainment of less than high school, with 100.0% or 3 individuals in the labor force. Within the labor force, individuals with high school diploma education have the highest percentage of unemployment, with 7.6% or 6 of them being unemployed.
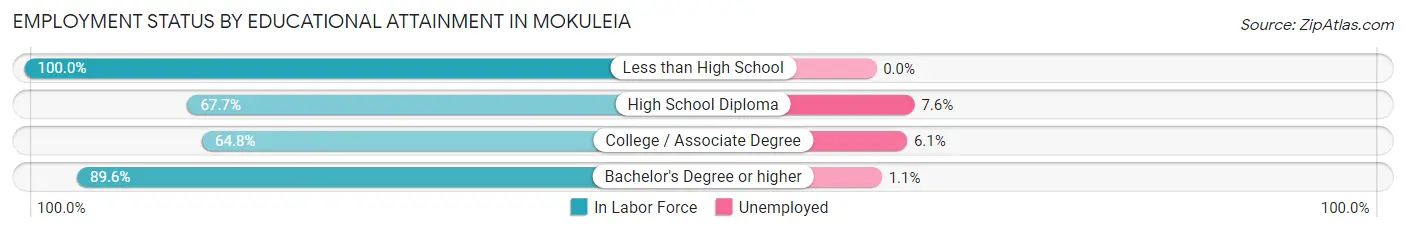
| Educational Attainment | In Labor Force | Unemployed |
| Less than High School | 3 (100.0%) | 0 (0.0%) |
| High School Diploma | 84 (67.7%) | 9 (7.6%) |
| College / Associate Degree | 269 (64.8%) | 25 (6.1%) |
| Bachelor's Degree or higher | 441 (89.6%) | 5 (1.1%) |
| Total | 797 (77.1%) | 37 (3.6%) |
Employment Occupations by Sex in Mokuleia
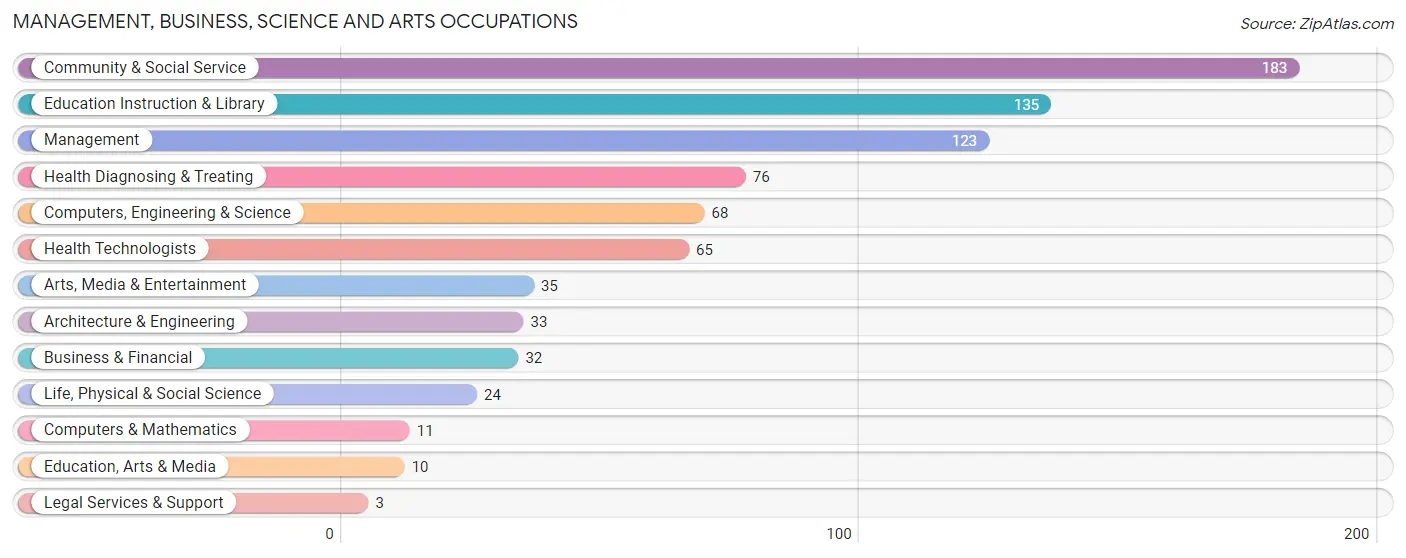
Management, Business, Science and Arts Occupations
The most common Management, Business, Science and Arts occupations in Mokuleia are Community & Social Service (183 | 21.2%), Education Instruction & Library (135 | 15.6%), Management (123 | 14.2%), Health Diagnosing & Treating (76 | 8.8%), and Computers, Engineering & Science (68 | 7.9%).
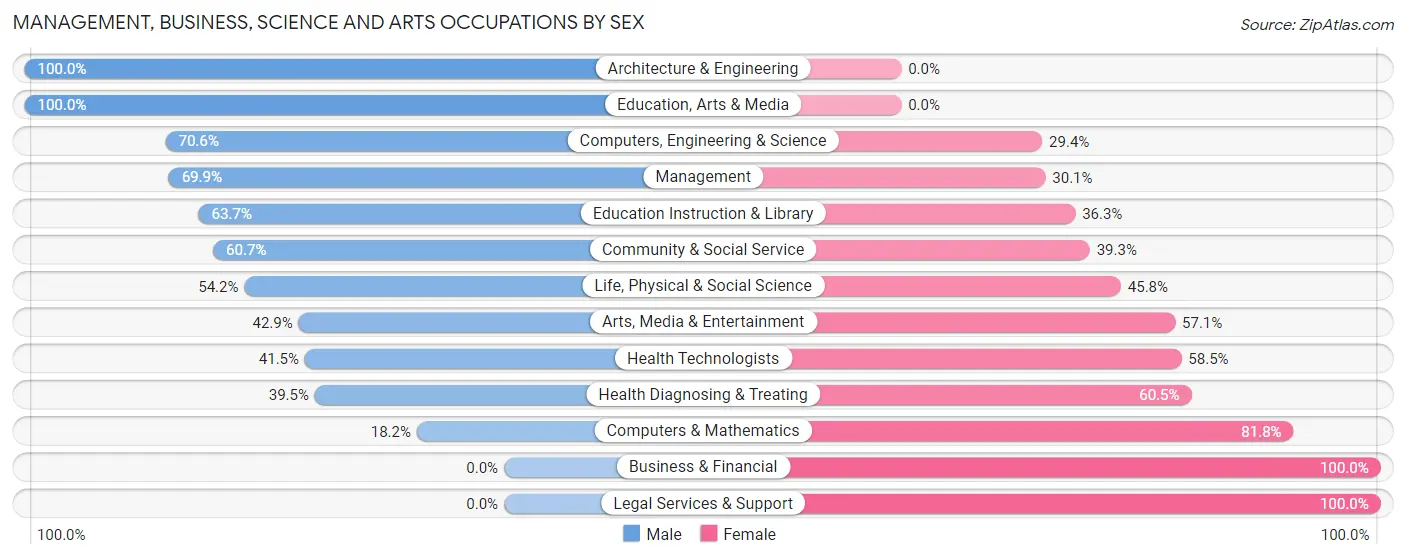
Management, Business, Science and Arts Occupations by Sex
Within the Management, Business, Science and Arts occupations in Mokuleia, the most male-oriented occupations are Architecture & Engineering (100.0%), Education, Arts & Media (100.0%), and Computers, Engineering & Science (70.6%), while the most female-oriented occupations are Business & Financial (100.0%), Legal Services & Support (100.0%), and Computers & Mathematics (81.8%).
| Occupation | Male | Female |
| Management | 86 (69.9%) | 37 (30.1%) |
| Business & Financial | 0 (0.0%) | 32 (100.0%) |
| Computers, Engineering & Science | 48 (70.6%) | 20 (29.4%) |
| Computers & Mathematics | 2 (18.2%) | 9 (81.8%) |
| Architecture & Engineering | 33 (100.0%) | 0 (0.0%) |
| Life, Physical & Social Science | 13 (54.2%) | 11 (45.8%) |
| Community & Social Service | 111 (60.7%) | 72 (39.3%) |
| Education, Arts & Media | 10 (100.0%) | 0 (0.0%) |
| Legal Services & Support | 0 (0.0%) | 3 (100.0%) |
| Education Instruction & Library | 86 (63.7%) | 49 (36.3%) |
| Arts, Media & Entertainment | 15 (42.9%) | 20 (57.1%) |
| Health Diagnosing & Treating | 30 (39.5%) | 46 (60.5%) |
| Health Technologists | 27 (41.5%) | 38 (58.5%) |
| Total (Category) | 275 (57.1%) | 207 (42.9%) |
| Total (Overall) | 492 (57.0%) | 371 (43.0%) |
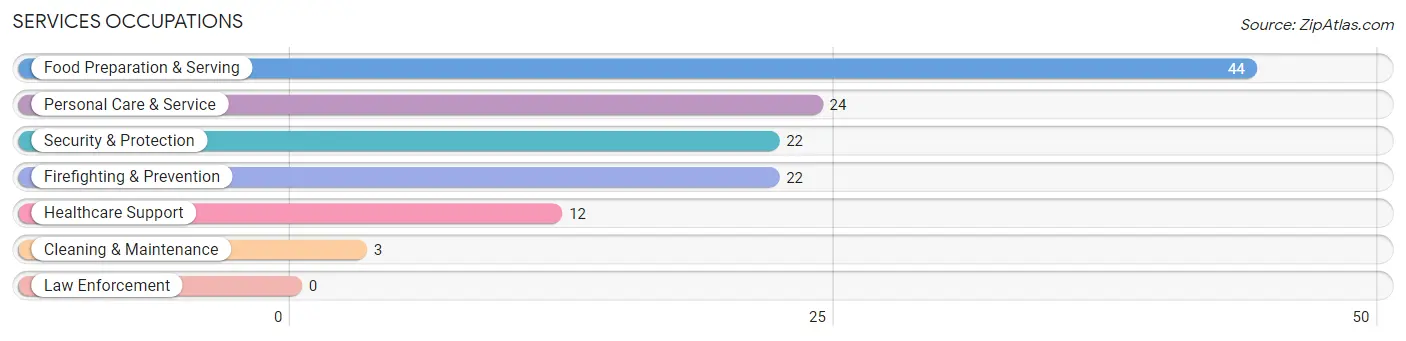
Services Occupations
The most common Services occupations in Mokuleia are Food Preparation & Serving (44 | 5.1%), Personal Care & Service (24 | 2.8%), Security & Protection (22 | 2.5%), Firefighting & Prevention (22 | 2.5%), and Healthcare Support (12 | 1.4%).
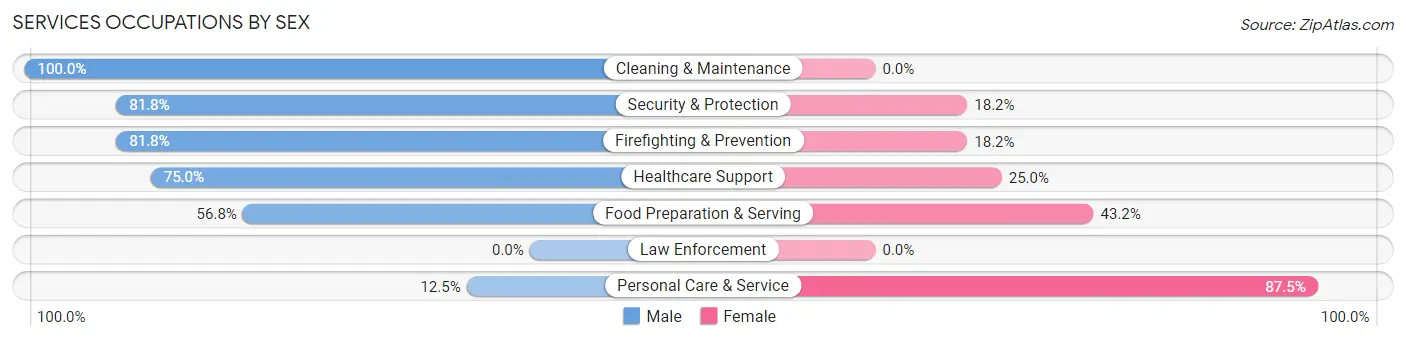
Services Occupations by Sex
Within the Services occupations in Mokuleia, the most male-oriented occupations are Cleaning & Maintenance (100.0%), Security & Protection (81.8%), and Firefighting & Prevention (81.8%), while the most female-oriented occupations are Personal Care & Service (87.5%), Food Preparation & Serving (43.2%), and Healthcare Support (25.0%).
| Occupation | Male | Female |
| Healthcare Support | 9 (75.0%) | 3 (25.0%) |
| Security & Protection | 18 (81.8%) | 4 (18.2%) |
| Firefighting & Prevention | 18 (81.8%) | 4 (18.2%) |
| Law Enforcement | 0 (0.0%) | 0 (0.0%) |
| Food Preparation & Serving | 25 (56.8%) | 19 (43.2%) |
| Cleaning & Maintenance | 3 (100.0%) | 0 (0.0%) |
| Personal Care & Service | 3 (12.5%) | 21 (87.5%) |
| Total (Category) | 58 (55.2%) | 47 (44.8%) |
| Total (Overall) | 492 (57.0%) | 371 (43.0%) |
Sales and Office Occupations
The most common Sales and Office occupations in Mokuleia are Office & Administration (69 | 8.0%), and Sales & Related (68 | 7.9%).
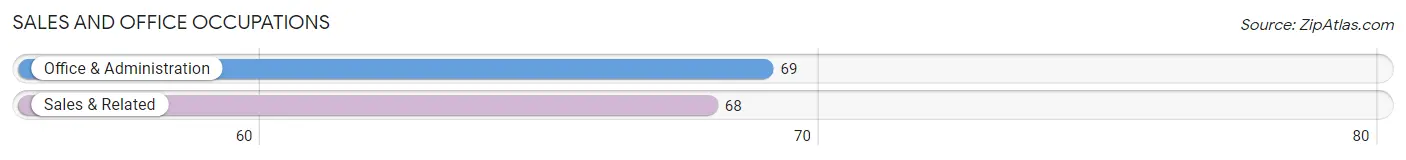
Sales and Office Occupations by Sex
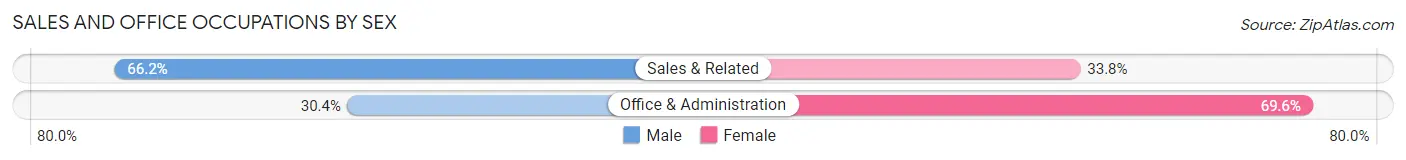
| Occupation | Male | Female |
| Sales & Related | 45 (66.2%) | 23 (33.8%) |
| Office & Administration | 21 (30.4%) | 48 (69.6%) |
| Total (Category) | 66 (48.2%) | 71 (51.8%) |
| Total (Overall) | 492 (57.0%) | 371 (43.0%) |
Natural Resources, Construction and Maintenance Occupations
The most common Natural Resources, Construction and Maintenance occupations in Mokuleia are Construction & Extraction (23 | 2.7%), Installation, Maintenance & Repair (18 | 2.1%), and Farming, Fishing & Forestry (10 | 1.2%).
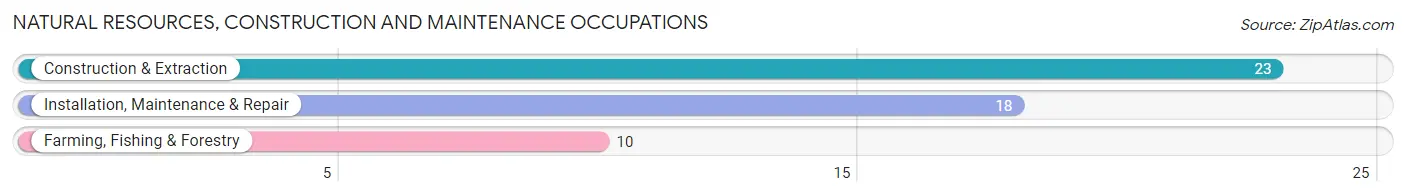
Natural Resources, Construction and Maintenance Occupations by Sex
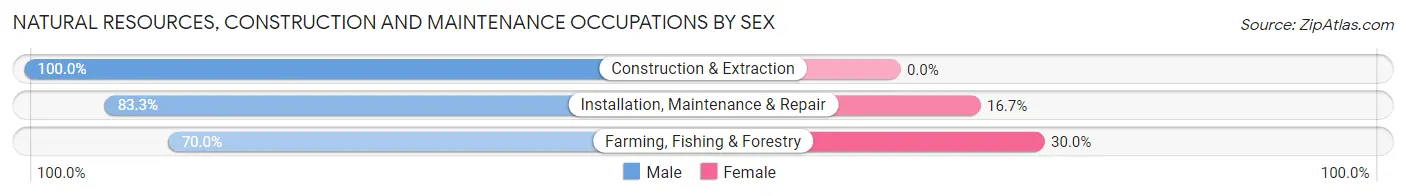
| Occupation | Male | Female |
| Farming, Fishing & Forestry | 7 (70.0%) | 3 (30.0%) |
| Construction & Extraction | 23 (100.0%) | 0 (0.0%) |
| Installation, Maintenance & Repair | 15 (83.3%) | 3 (16.7%) |
| Total (Category) | 45 (88.2%) | 6 (11.8%) |
| Total (Overall) | 492 (57.0%) | 371 (43.0%) |
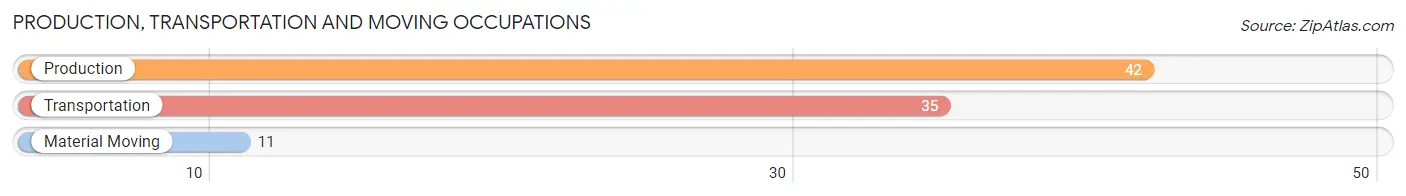
Production, Transportation and Moving Occupations
The most common Production, Transportation and Moving occupations in Mokuleia are Production (42 | 4.9%), Transportation (35 | 4.1%), and Material Moving (11 | 1.3%).
Production, Transportation and Moving Occupations by Sex
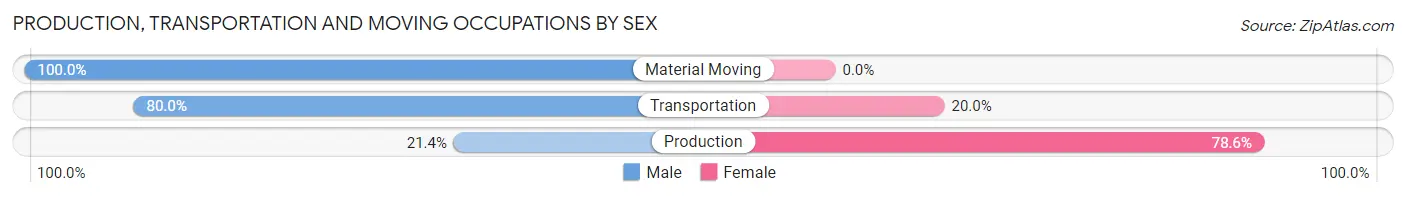
| Occupation | Male | Female |
| Production | 9 (21.4%) | 33 (78.6%) |
| Transportation | 28 (80.0%) | 7 (20.0%) |
| Material Moving | 11 (100.0%) | 0 (0.0%) |
| Total (Category) | 48 (54.5%) | 40 (45.5%) |
| Total (Overall) | 492 (57.0%) | 371 (43.0%) |
Employment Industries by Sex in Mokuleia
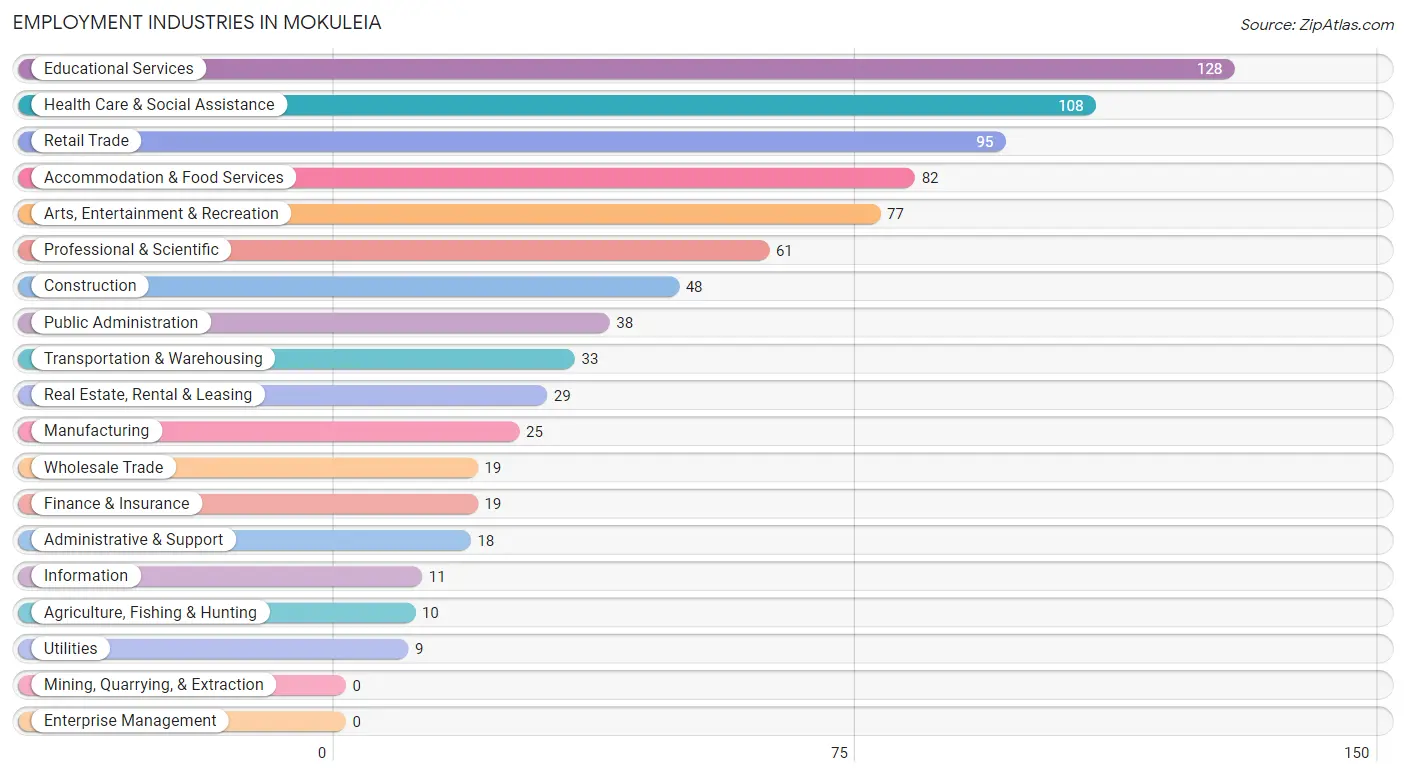
Employment Industries in Mokuleia
The major employment industries in Mokuleia include Educational Services (128 | 14.8%), Health Care & Social Assistance (108 | 12.5%), Retail Trade (95 | 11.0%), Accommodation & Food Services (82 | 9.5%), and Arts, Entertainment & Recreation (77 | 8.9%).
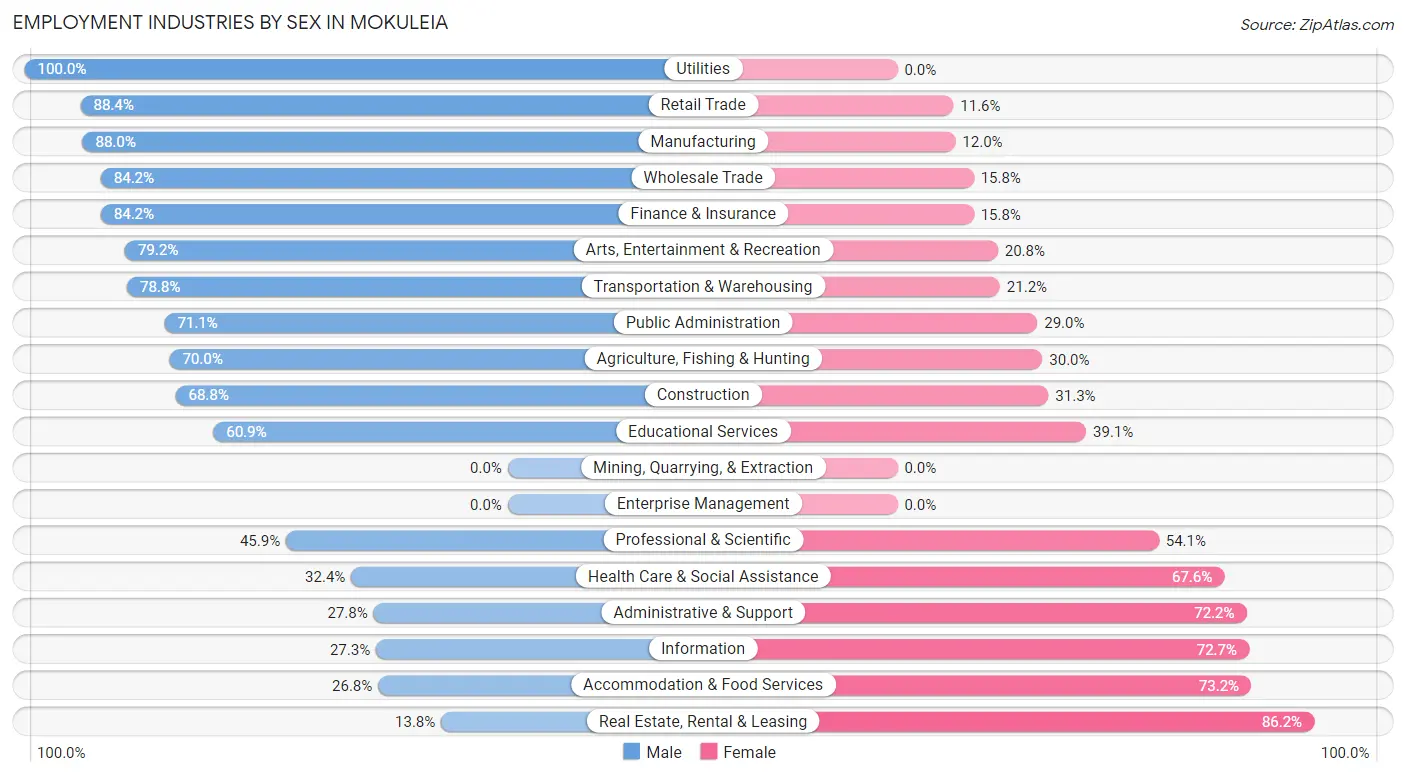
Employment Industries by Sex in Mokuleia
The Mokuleia industries that see more men than women are Utilities (100.0%), Retail Trade (88.4%), and Manufacturing (88.0%), whereas the industries that tend to have a higher number of women are Real Estate, Rental & Leasing (86.2%), Accommodation & Food Services (73.2%), and Information (72.7%).
| Industry | Male | Female |
| Agriculture, Fishing & Hunting | 7 (70.0%) | 3 (30.0%) |
| Mining, Quarrying, & Extraction | 0 (0.0%) | 0 (0.0%) |
| Construction | 33 (68.8%) | 15 (31.2%) |
| Manufacturing | 22 (88.0%) | 3 (12.0%) |
| Wholesale Trade | 16 (84.2%) | 3 (15.8%) |
| Retail Trade | 84 (88.4%) | 11 (11.6%) |
| Transportation & Warehousing | 26 (78.8%) | 7 (21.2%) |
| Utilities | 9 (100.0%) | 0 (0.0%) |
| Information | 3 (27.3%) | 8 (72.7%) |
| Finance & Insurance | 16 (84.2%) | 3 (15.8%) |
| Real Estate, Rental & Leasing | 4 (13.8%) | 25 (86.2%) |
| Professional & Scientific | 28 (45.9%) | 33 (54.1%) |
| Enterprise Management | 0 (0.0%) | 0 (0.0%) |
| Administrative & Support | 5 (27.8%) | 13 (72.2%) |
| Educational Services | 78 (60.9%) | 50 (39.1%) |
| Health Care & Social Assistance | 35 (32.4%) | 73 (67.6%) |
| Arts, Entertainment & Recreation | 61 (79.2%) | 16 (20.8%) |
| Accommodation & Food Services | 22 (26.8%) | 60 (73.2%) |
| Public Administration | 27 (71.1%) | 11 (28.9%) |
| Total | 492 (57.0%) | 371 (43.0%) |
Education in Mokuleia
School Enrollment in Mokuleia
The most common levels of schooling among the 299 students in Mokuleia are high school (92 | 30.8%), middle school (61 | 20.4%), and college / undergraduate (57 | 19.1%).
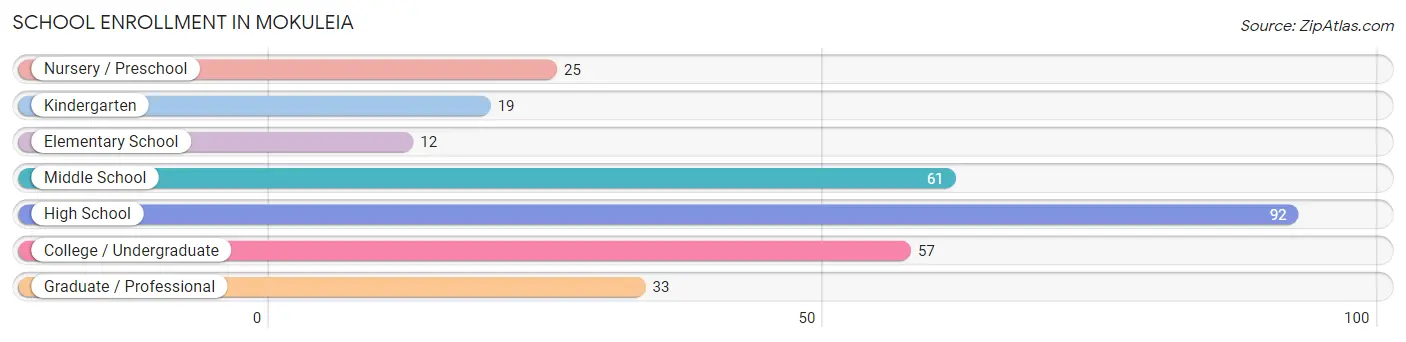
| School Level | # Students | % Students |
| Nursery / Preschool | 25 | 8.4% |
| Kindergarten | 19 | 6.4% |
| Elementary School | 12 | 4.0% |
| Middle School | 61 | 20.4% |
| High School | 92 | 30.8% |
| College / Undergraduate | 57 | 19.1% |
| Graduate / Professional | 33 | 11.0% |
| Total | 299 | 100.0% |
School Enrollment by Age by Funding Source in Mokuleia
Out of a total of 299 students who are enrolled in schools in Mokuleia, 114 (38.1%) attend a private institution, while the remaining 185 (61.9%) are enrolled in public schools. The age group of 18 to 19 year olds has the highest likelihood of being enrolled in private schools, with 62 (95.4% in the age bracket) enrolled. Conversely, the age group of 10 to 14 year olds has the lowest likelihood of being enrolled in a private school, with 71 (100.0% in the age bracket) attending a public institution.
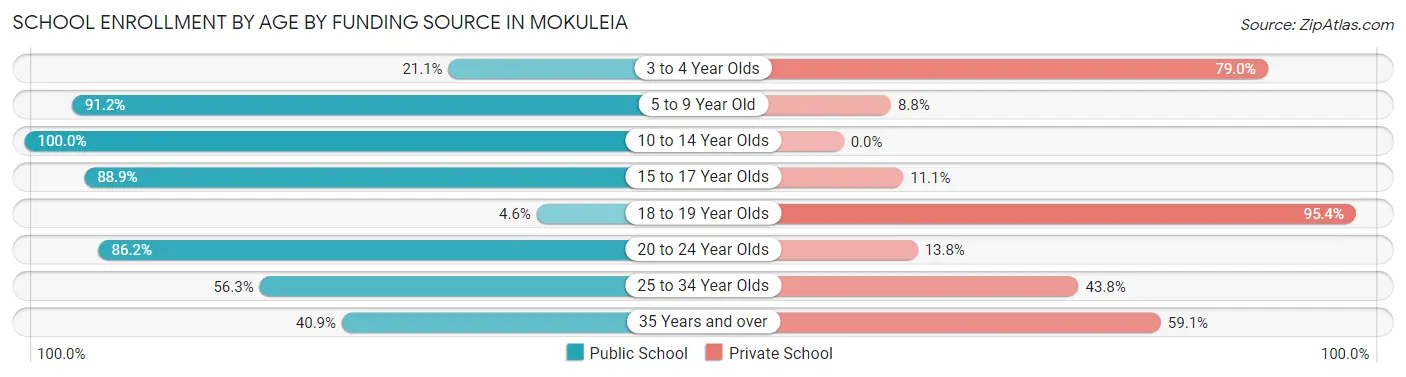
| Age Bracket | Public School | Private School |
| 3 to 4 Year Olds | 4 (21.0%) | 15 (78.9%) |
| 5 to 9 Year Old | 31 (91.2%) | 3 (8.8%) |
| 10 to 14 Year Olds | 71 (100.0%) | 0 (0.0%) |
| 15 to 17 Year Olds | 24 (88.9%) | 3 (11.1%) |
| 18 to 19 Year Olds | 3 (4.6%) | 62 (95.4%) |
| 20 to 24 Year Olds | 25 (86.2%) | 4 (13.8%) |
| 25 to 34 Year Olds | 18 (56.2%) | 14 (43.8%) |
| 35 Years and over | 9 (40.9%) | 13 (59.1%) |
| Total | 185 (61.9%) | 114 (38.1%) |
Educational Attainment by Field of Study in Mokuleia
Science & technology (103 | 13.7%), business (93 | 12.4%), arts & humanities (85 | 11.3%), bio, nature & agricultural (72 | 9.6%), and engineering (67 | 8.9%) are the most common fields of study among 750 individuals in Mokuleia who have obtained a bachelor's degree or higher.
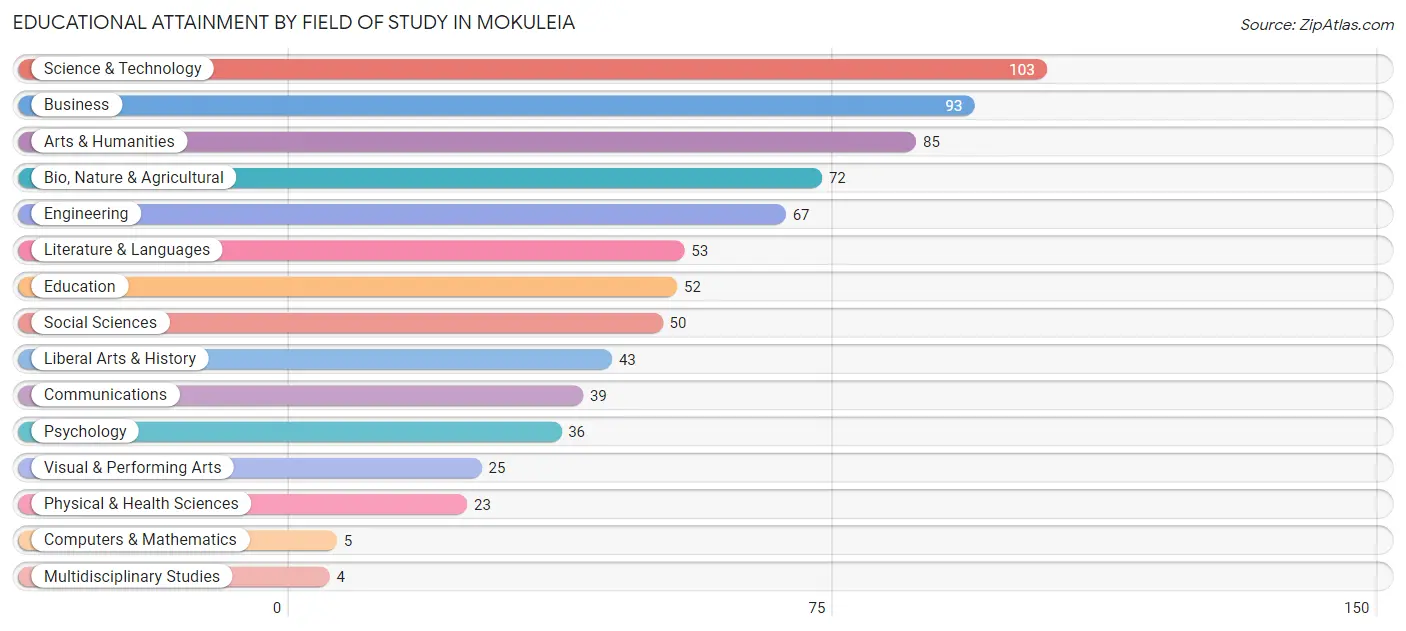
| Field of Study | # Graduates | % Graduates |
| Computers & Mathematics | 5 | 0.7% |
| Bio, Nature & Agricultural | 72 | 9.6% |
| Physical & Health Sciences | 23 | 3.1% |
| Psychology | 36 | 4.8% |
| Social Sciences | 50 | 6.7% |
| Engineering | 67 | 8.9% |
| Multidisciplinary Studies | 4 | 0.5% |
| Science & Technology | 103 | 13.7% |
| Business | 93 | 12.4% |
| Education | 52 | 6.9% |
| Literature & Languages | 53 | 7.1% |
| Liberal Arts & History | 43 | 5.7% |
| Visual & Performing Arts | 25 | 3.3% |
| Communications | 39 | 5.2% |
| Arts & Humanities | 85 | 11.3% |
| Total | 750 | 100.0% |
Transportation & Commute in Mokuleia
Vehicle Availability by Sex in Mokuleia
The most prevalent vehicle ownership categories in Mokuleia are males with 2 vehicles (317, accounting for 51.5%) and females with 2 vehicles (148, making up 85.4%).
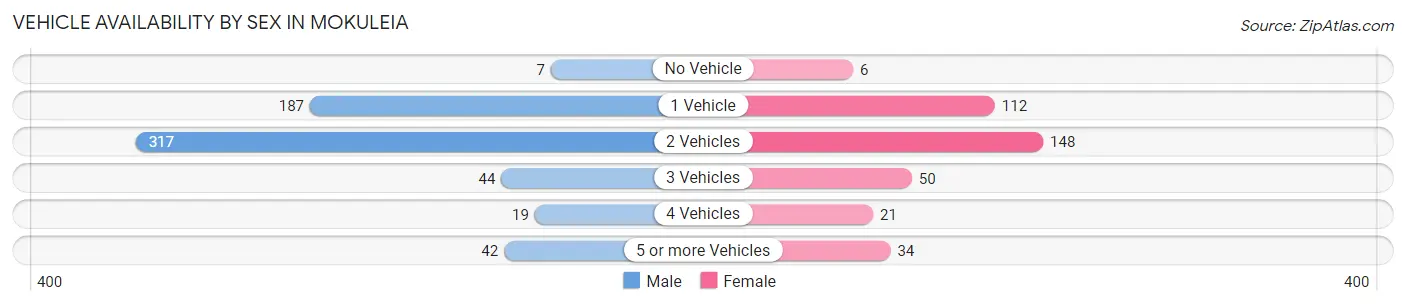
| Vehicles Available | Male | Female |
| No Vehicle | 7 (1.1%) | 6 (1.6%) |
| 1 Vehicle | 187 (30.4%) | 112 (30.2%) |
| 2 Vehicles | 317 (51.5%) | 148 (39.9%) |
| 3 Vehicles | 44 (7.1%) | 50 (13.5%) |
| 4 Vehicles | 19 (3.1%) | 21 (5.7%) |
| 5 or more Vehicles | 42 (6.8%) | 34 (9.2%) |
| Total | 616 (100.0%) | 371 (100.0%) |
Commute Time in Mokuleia
The most frequently occuring commute durations in Mokuleia are 45 to 59 minutes (159 commuters, 19.3%), 20 to 24 minutes (131 commuters, 15.9%), and 10 to 14 minutes (124 commuters, 15.0%).
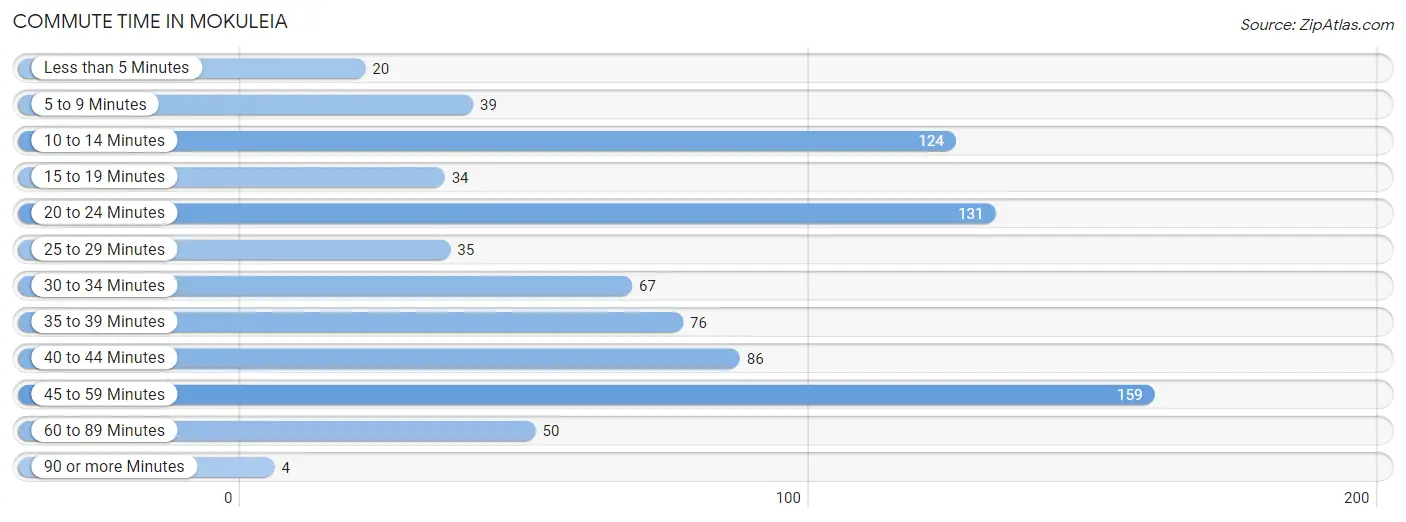
| Commute Time | # Commuters | % Commuters |
| Less than 5 Minutes | 20 | 2.4% |
| 5 to 9 Minutes | 39 | 4.7% |
| 10 to 14 Minutes | 124 | 15.0% |
| 15 to 19 Minutes | 34 | 4.1% |
| 20 to 24 Minutes | 131 | 15.9% |
| 25 to 29 Minutes | 35 | 4.2% |
| 30 to 34 Minutes | 67 | 8.1% |
| 35 to 39 Minutes | 76 | 9.2% |
| 40 to 44 Minutes | 86 | 10.4% |
| 45 to 59 Minutes | 159 | 19.3% |
| 60 to 89 Minutes | 50 | 6.1% |
| 90 or more Minutes | 4 | 0.5% |
Commute Time by Sex in Mokuleia
The most common commute times in Mokuleia are 45 to 59 minutes (127 commuters, 23.6%) for males and 10 to 14 minutes (53 commuters, 18.4%) for females.
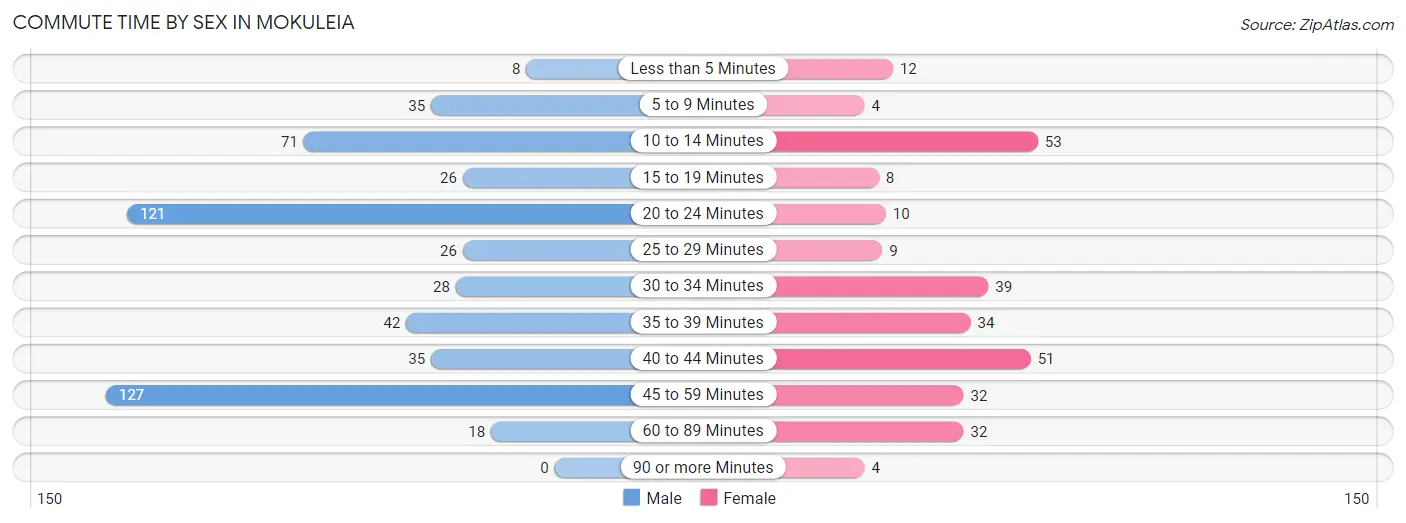
| Commute Time | Male | Female |
| Less than 5 Minutes | 8 (1.5%) | 12 (4.2%) |
| 5 to 9 Minutes | 35 (6.5%) | 4 (1.4%) |
| 10 to 14 Minutes | 71 (13.2%) | 53 (18.4%) |
| 15 to 19 Minutes | 26 (4.8%) | 8 (2.8%) |
| 20 to 24 Minutes | 121 (22.5%) | 10 (3.5%) |
| 25 to 29 Minutes | 26 (4.8%) | 9 (3.1%) |
| 30 to 34 Minutes | 28 (5.2%) | 39 (13.5%) |
| 35 to 39 Minutes | 42 (7.8%) | 34 (11.8%) |
| 40 to 44 Minutes | 35 (6.5%) | 51 (17.7%) |
| 45 to 59 Minutes | 127 (23.6%) | 32 (11.1%) |
| 60 to 89 Minutes | 18 (3.4%) | 32 (11.1%) |
| 90 or more Minutes | 0 (0.0%) | 4 (1.4%) |
Time of Departure to Work by Sex in Mokuleia
The most frequent times of departure to work in Mokuleia are 5:00 AM to 5:29 AM (92, 17.1%) for males and 7:30 AM to 7:59 AM (53, 18.4%) for females.
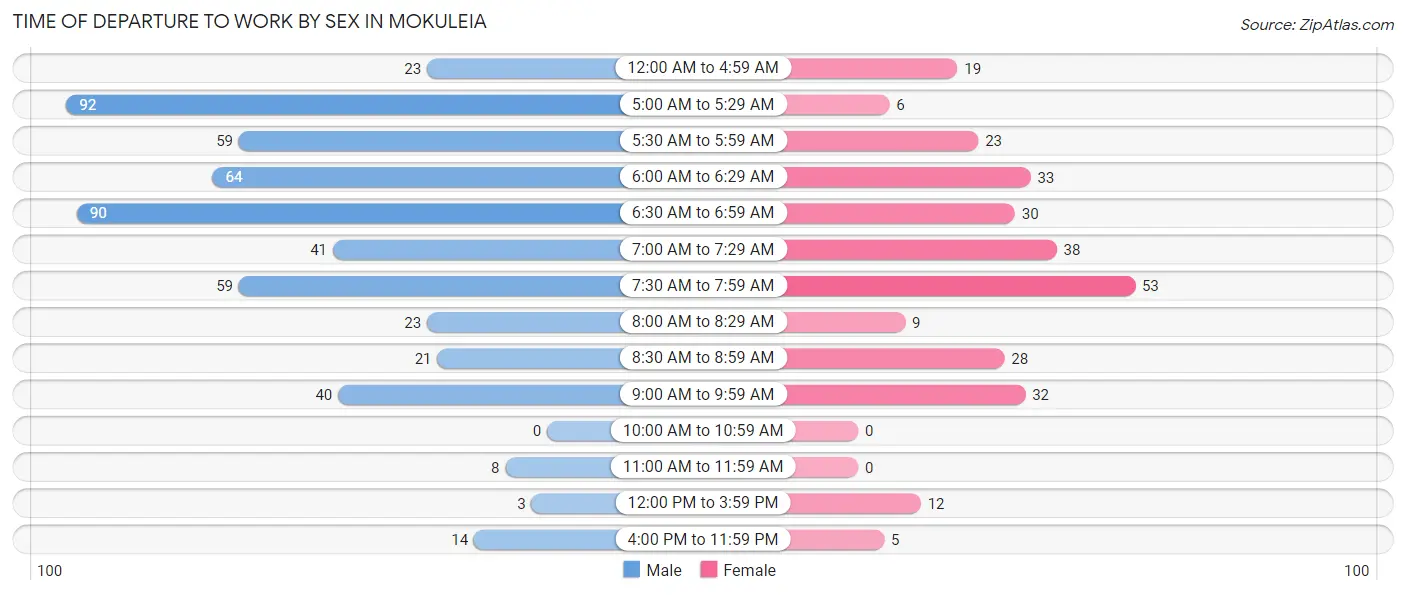
| Time of Departure | Male | Female |
| 12:00 AM to 4:59 AM | 23 (4.3%) | 19 (6.6%) |
| 5:00 AM to 5:29 AM | 92 (17.1%) | 6 (2.1%) |
| 5:30 AM to 5:59 AM | 59 (11.0%) | 23 (8.0%) |
| 6:00 AM to 6:29 AM | 64 (11.9%) | 33 (11.5%) |
| 6:30 AM to 6:59 AM | 90 (16.8%) | 30 (10.4%) |
| 7:00 AM to 7:29 AM | 41 (7.6%) | 38 (13.2%) |
| 7:30 AM to 7:59 AM | 59 (11.0%) | 53 (18.4%) |
| 8:00 AM to 8:29 AM | 23 (4.3%) | 9 (3.1%) |
| 8:30 AM to 8:59 AM | 21 (3.9%) | 28 (9.7%) |
| 9:00 AM to 9:59 AM | 40 (7.4%) | 32 (11.1%) |
| 10:00 AM to 10:59 AM | 0 (0.0%) | 0 (0.0%) |
| 11:00 AM to 11:59 AM | 8 (1.5%) | 0 (0.0%) |
| 12:00 PM to 3:59 PM | 3 (0.6%) | 12 (4.2%) |
| 4:00 PM to 11:59 PM | 14 (2.6%) | 5 (1.7%) |
| Total | 537 (100.0%) | 288 (100.0%) |
Housing Occupancy in Mokuleia
Occupancy by Ownership in Mokuleia
Of the total 777 dwellings in Mokuleia, owner-occupied units account for 414 (53.3%), while renter-occupied units make up 363 (46.7%).
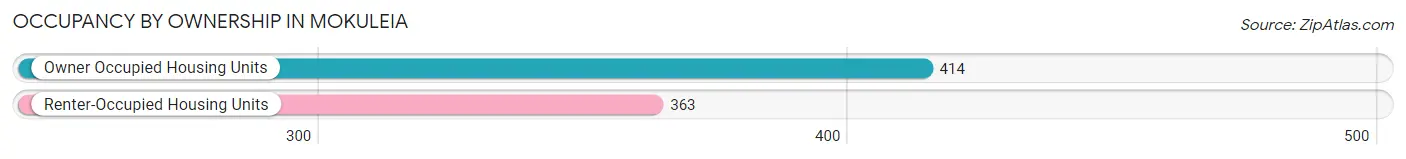
| Occupancy | # Housing Units | % Housing Units |
| Owner Occupied Housing Units | 414 | 53.3% |
| Renter-Occupied Housing Units | 363 | 46.7% |
| Total Occupied Housing Units | 777 | 100.0% |
Occupancy by Household Size in Mokuleia
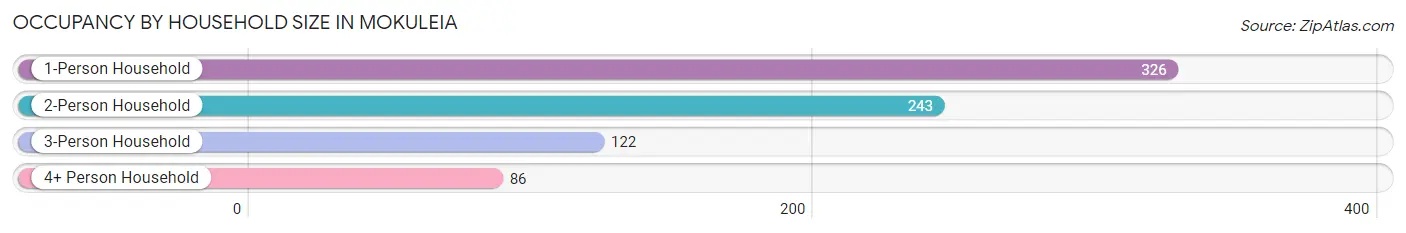
| Household Size | # Housing Units | % Housing Units |
| 1-Person Household | 326 | 42.0% |
| 2-Person Household | 243 | 31.3% |
| 3-Person Household | 122 | 15.7% |
| 4+ Person Household | 86 | 11.1% |
| Total Housing Units | 777 | 100.0% |
Occupancy by Ownership by Household Size in Mokuleia
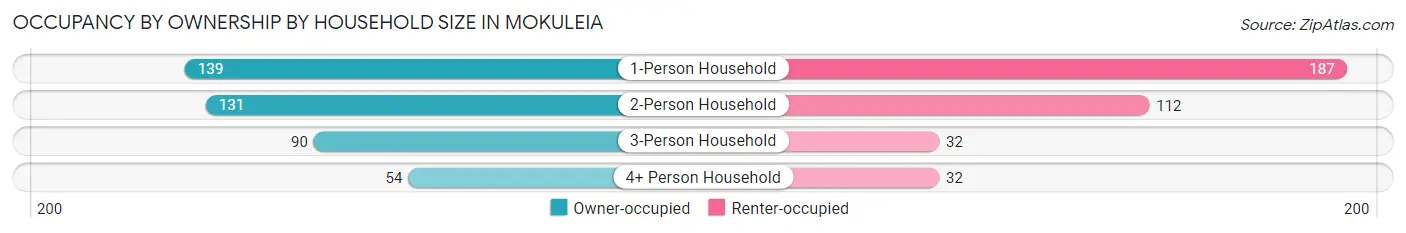
| Household Size | Owner-occupied | Renter-occupied |
| 1-Person Household | 139 (42.6%) | 187 (57.4%) |
| 2-Person Household | 131 (53.9%) | 112 (46.1%) |
| 3-Person Household | 90 (73.8%) | 32 (26.2%) |
| 4+ Person Household | 54 (62.8%) | 32 (37.2%) |
| Total Housing Units | 414 (53.3%) | 363 (46.7%) |
Occupancy by Educational Attainment in Mokuleia
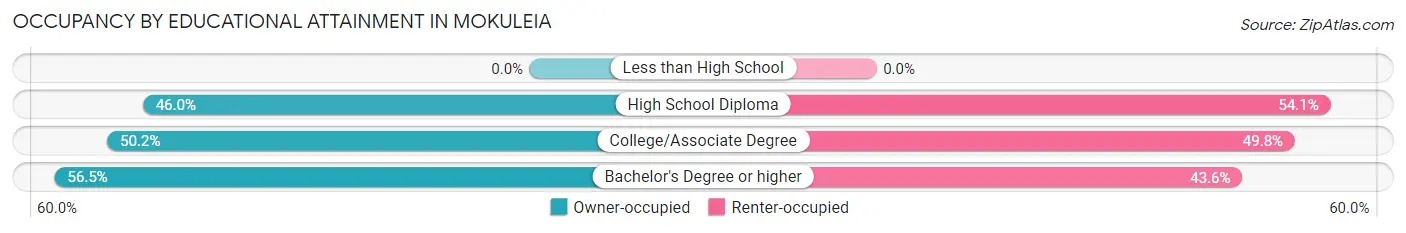
| Household Size | Owner-occupied | Renter-occupied |
| Less than High School | 0 (0.0%) | 0 (0.0%) |
| High School Diploma | 34 (46.0%) | 40 (54.0%) |
| College/Associate Degree | 135 (50.2%) | 134 (49.8%) |
| Bachelor's Degree or higher | 245 (56.5%) | 189 (43.5%) |
Occupancy by Age of Householder in Mokuleia
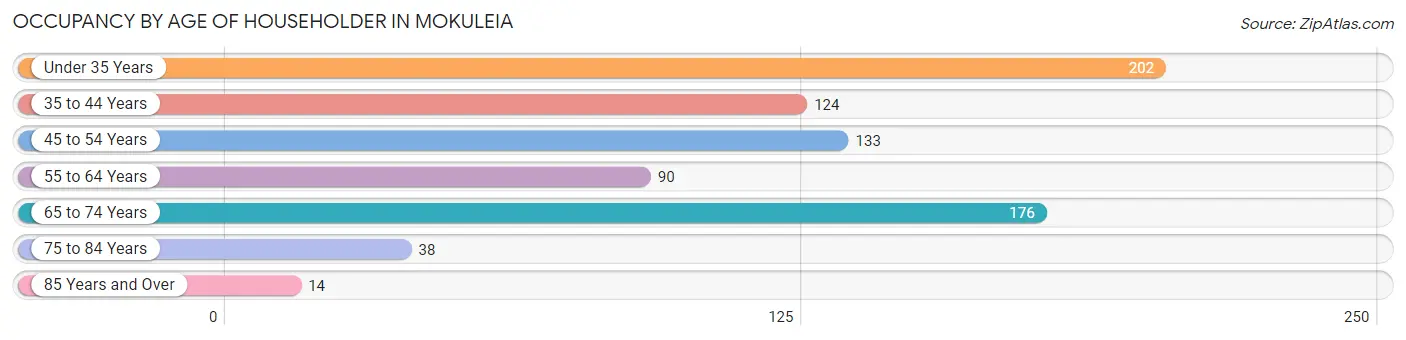
| Age Bracket | # Households | % Households |
| Under 35 Years | 202 | 26.0% |
| 35 to 44 Years | 124 | 16.0% |
| 45 to 54 Years | 133 | 17.1% |
| 55 to 64 Years | 90 | 11.6% |
| 65 to 74 Years | 176 | 22.7% |
| 75 to 84 Years | 38 | 4.9% |
| 85 Years and Over | 14 | 1.8% |
| Total | 777 | 100.0% |
Housing Finances in Mokuleia
Median Income by Occupancy in Mokuleia
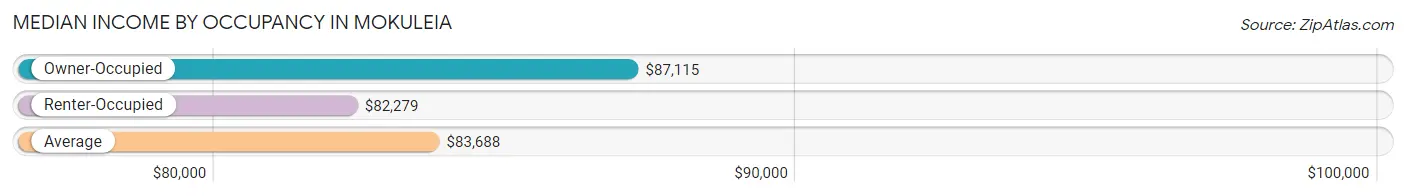
| Occupancy Type | # Households | Median Income |
| Owner-Occupied | 414 (53.3%) | $87,115 |
| Renter-Occupied | 363 (46.7%) | $82,279 |
| Average | 777 (100.0%) | $83,688 |
Occupancy by Householder Income Bracket in Mokuleia
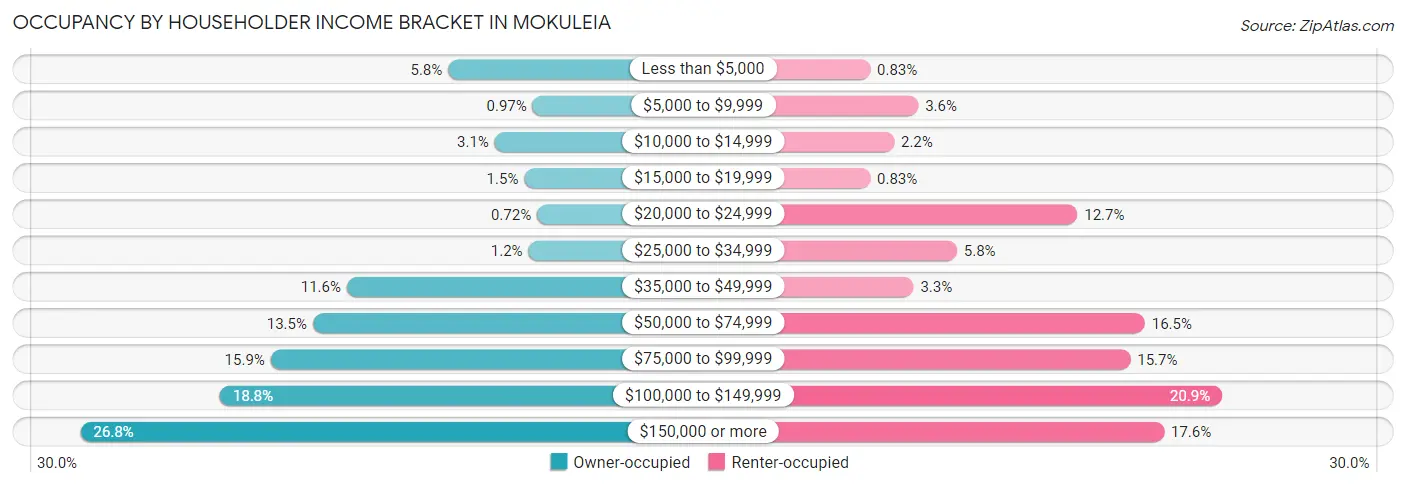
| Income Bracket | Owner-occupied | Renter-occupied |
| Less than $5,000 | 24 (5.8%) | 3 (0.8%) |
| $5,000 to $9,999 | 4 (1.0%) | 13 (3.6%) |
| $10,000 to $14,999 | 13 (3.1%) | 8 (2.2%) |
| $15,000 to $19,999 | 6 (1.5%) | 3 (0.8%) |
| $20,000 to $24,999 | 3 (0.7%) | 46 (12.7%) |
| $25,000 to $34,999 | 5 (1.2%) | 21 (5.8%) |
| $35,000 to $49,999 | 48 (11.6%) | 12 (3.3%) |
| $50,000 to $74,999 | 56 (13.5%) | 60 (16.5%) |
| $75,000 to $99,999 | 66 (15.9%) | 57 (15.7%) |
| $100,000 to $149,999 | 78 (18.8%) | 76 (20.9%) |
| $150,000 or more | 111 (26.8%) | 64 (17.6%) |
| Total | 414 (100.0%) | 363 (100.0%) |
Monthly Housing Cost Tiers in Mokuleia
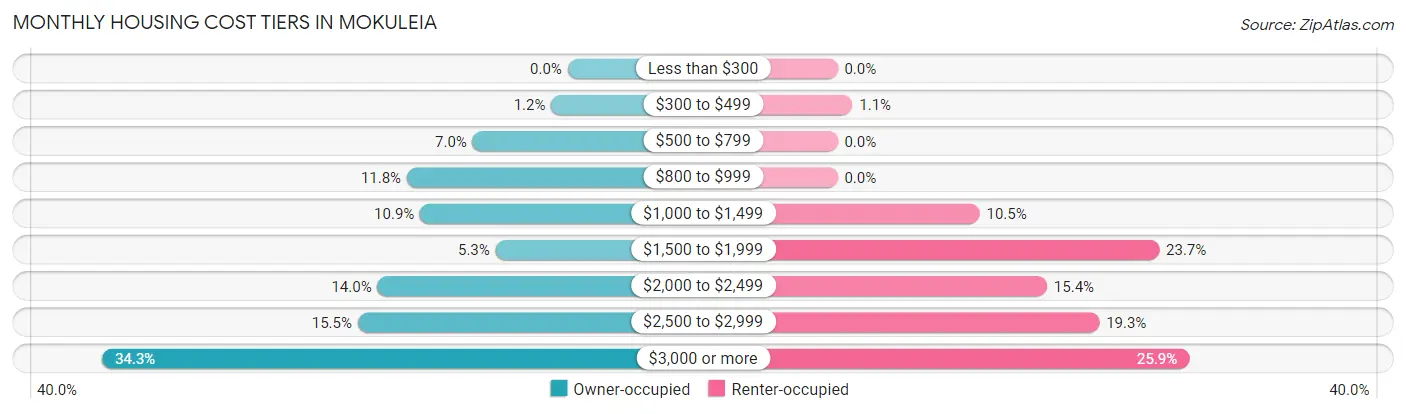
| Monthly Cost | Owner-occupied | Renter-occupied |
| Less than $300 | 0 (0.0%) | 0 (0.0%) |
| $300 to $499 | 5 (1.2%) | 4 (1.1%) |
| $500 to $799 | 29 (7.0%) | 0 (0.0%) |
| $800 to $999 | 49 (11.8%) | 0 (0.0%) |
| $1,000 to $1,499 | 45 (10.9%) | 38 (10.5%) |
| $1,500 to $1,999 | 22 (5.3%) | 86 (23.7%) |
| $2,000 to $2,499 | 58 (14.0%) | 56 (15.4%) |
| $2,500 to $2,999 | 64 (15.5%) | 70 (19.3%) |
| $3,000 or more | 142 (34.3%) | 94 (25.9%) |
| Total | 414 (100.0%) | 363 (100.0%) |
Physical Housing Characteristics in Mokuleia
Housing Structures in Mokuleia
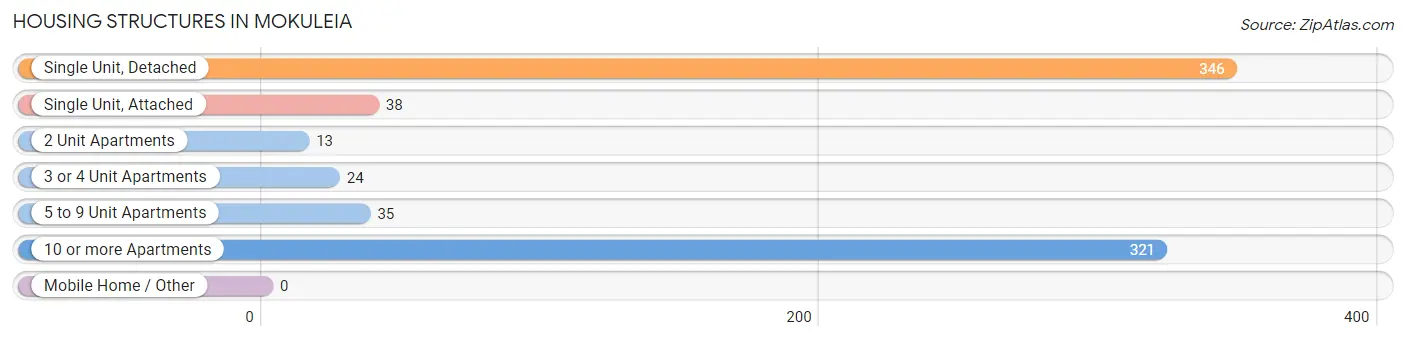
| Structure Type | # Housing Units | % Housing Units |
| Single Unit, Detached | 346 | 44.5% |
| Single Unit, Attached | 38 | 4.9% |
| 2 Unit Apartments | 13 | 1.7% |
| 3 or 4 Unit Apartments | 24 | 3.1% |
| 5 to 9 Unit Apartments | 35 | 4.5% |
| 10 or more Apartments | 321 | 41.3% |
| Mobile Home / Other | 0 | 0.0% |
| Total | 777 | 100.0% |
Housing Structures by Occupancy in Mokuleia
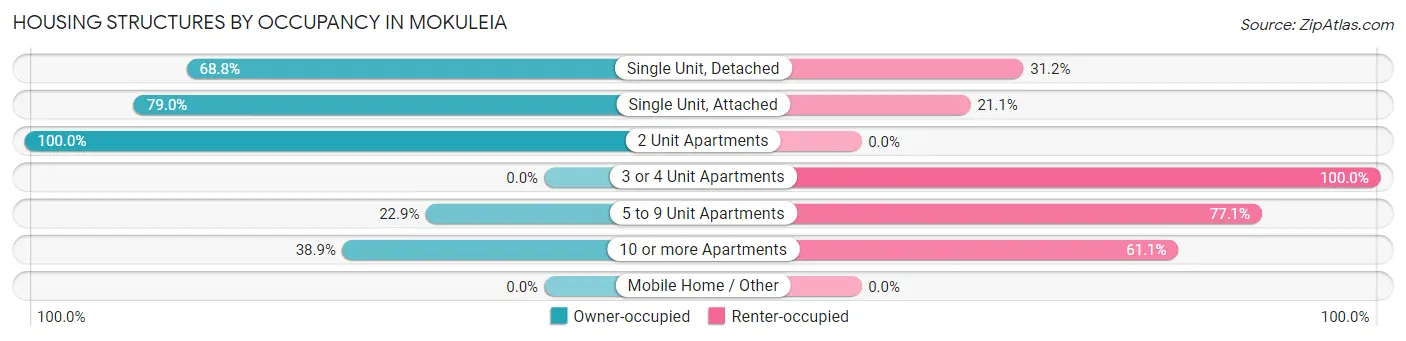
| Structure Type | Owner-occupied | Renter-occupied |
| Single Unit, Detached | 238 (68.8%) | 108 (31.2%) |
| Single Unit, Attached | 30 (78.9%) | 8 (21.0%) |
| 2 Unit Apartments | 13 (100.0%) | 0 (0.0%) |
| 3 or 4 Unit Apartments | 0 (0.0%) | 24 (100.0%) |
| 5 to 9 Unit Apartments | 8 (22.9%) | 27 (77.1%) |
| 10 or more Apartments | 125 (38.9%) | 196 (61.1%) |
| Mobile Home / Other | 0 (0.0%) | 0 (0.0%) |
| Total | 414 (53.3%) | 363 (46.7%) |
Housing Structures by Number of Rooms in Mokuleia
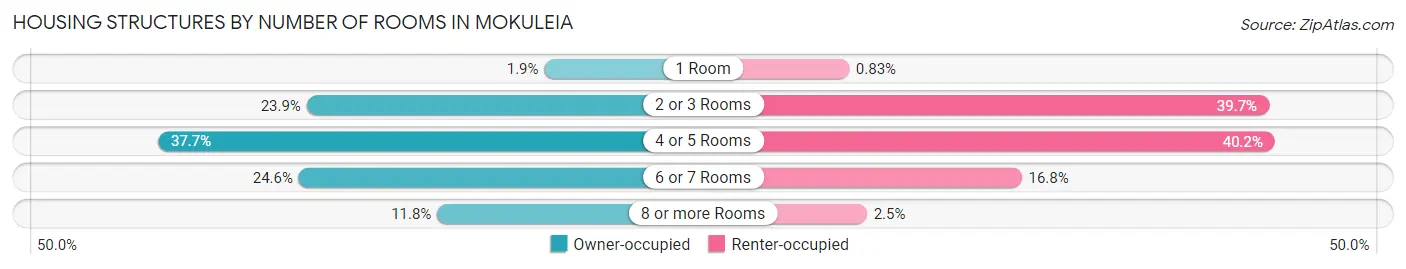
| Number of Rooms | Owner-occupied | Renter-occupied |
| 1 Room | 8 (1.9%) | 3 (0.8%) |
| 2 or 3 Rooms | 99 (23.9%) | 144 (39.7%) |
| 4 or 5 Rooms | 156 (37.7%) | 146 (40.2%) |
| 6 or 7 Rooms | 102 (24.6%) | 61 (16.8%) |
| 8 or more Rooms | 49 (11.8%) | 9 (2.5%) |
| Total | 414 (100.0%) | 363 (100.0%) |
Housing Structure by Heating Type in Mokuleia
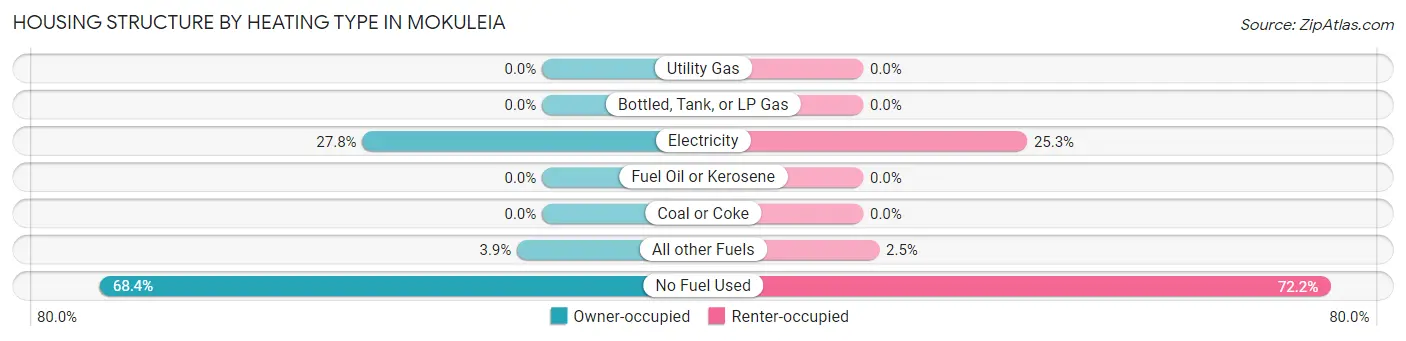
| Heating Type | Owner-occupied | Renter-occupied |
| Utility Gas | 0 (0.0%) | 0 (0.0%) |
| Bottled, Tank, or LP Gas | 0 (0.0%) | 0 (0.0%) |
| Electricity | 115 (27.8%) | 92 (25.3%) |
| Fuel Oil or Kerosene | 0 (0.0%) | 0 (0.0%) |
| Coal or Coke | 0 (0.0%) | 0 (0.0%) |
| All other Fuels | 16 (3.9%) | 9 (2.5%) |
| No Fuel Used | 283 (68.4%) | 262 (72.2%) |
| Total | 414 (100.0%) | 363 (100.0%) |
Household Vehicle Usage in Mokuleia
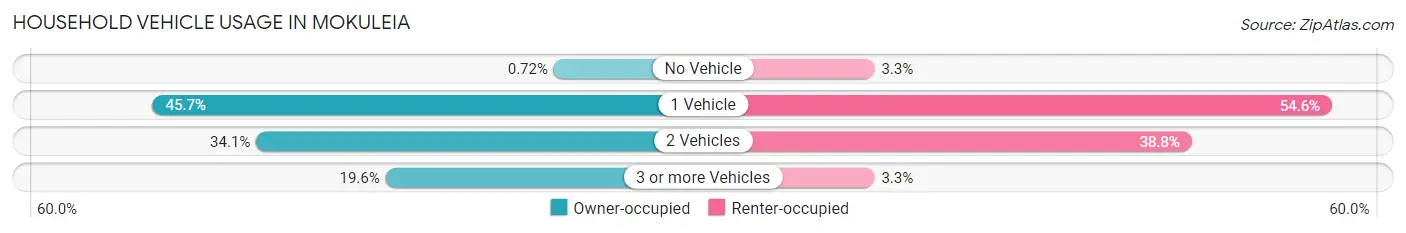
| Vehicles per Household | Owner-occupied | Renter-occupied |
| No Vehicle | 3 (0.7%) | 12 (3.3%) |
| 1 Vehicle | 189 (45.7%) | 198 (54.5%) |
| 2 Vehicles | 141 (34.1%) | 141 (38.8%) |
| 3 or more Vehicles | 81 (19.6%) | 12 (3.3%) |
| Total | 414 (100.0%) | 363 (100.0%) |
Real Estate & Mortgages in Mokuleia
Real Estate and Mortgage Overview in Mokuleia
| Characteristic | Without Mortgage | With Mortgage |
| Housing Units | 110 | 304 |
| Median Property Value | $1,158,300 | $833,300 |
| Median Household Income | $66,071 | $78 |
| Monthly Housing Costs | $884 | $142 |
| Real Estate Taxes | $4,095 | $11 |
Property Value by Mortgage Status in Mokuleia
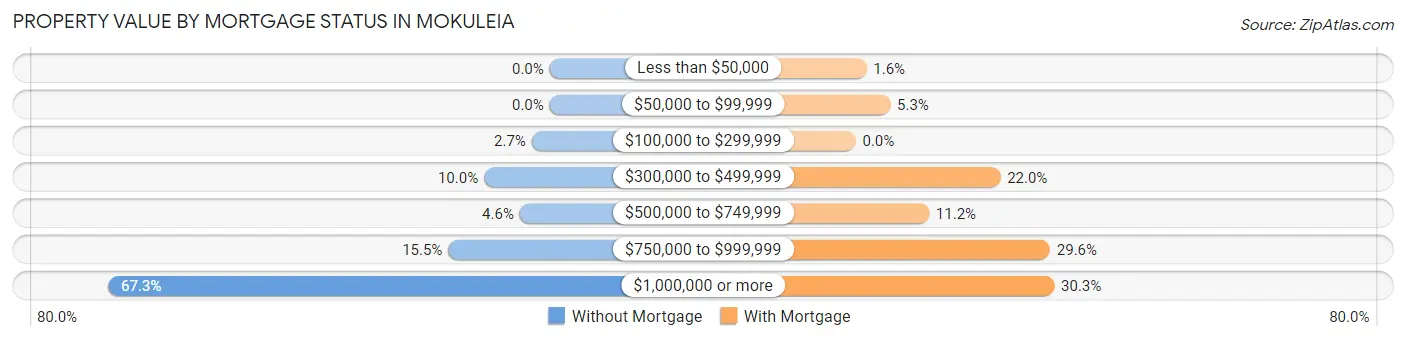
| Property Value | Without Mortgage | With Mortgage |
| Less than $50,000 | 0 (0.0%) | 5 (1.6%) |
| $50,000 to $99,999 | 0 (0.0%) | 16 (5.3%) |
| $100,000 to $299,999 | 3 (2.7%) | 0 (0.0%) |
| $300,000 to $499,999 | 11 (10.0%) | 67 (22.0%) |
| $500,000 to $749,999 | 5 (4.5%) | 34 (11.2%) |
| $750,000 to $999,999 | 17 (15.4%) | 90 (29.6%) |
| $1,000,000 or more | 74 (67.3%) | 92 (30.3%) |
| Total | 110 (100.0%) | 304 (100.0%) |
Household Income by Mortgage Status in Mokuleia
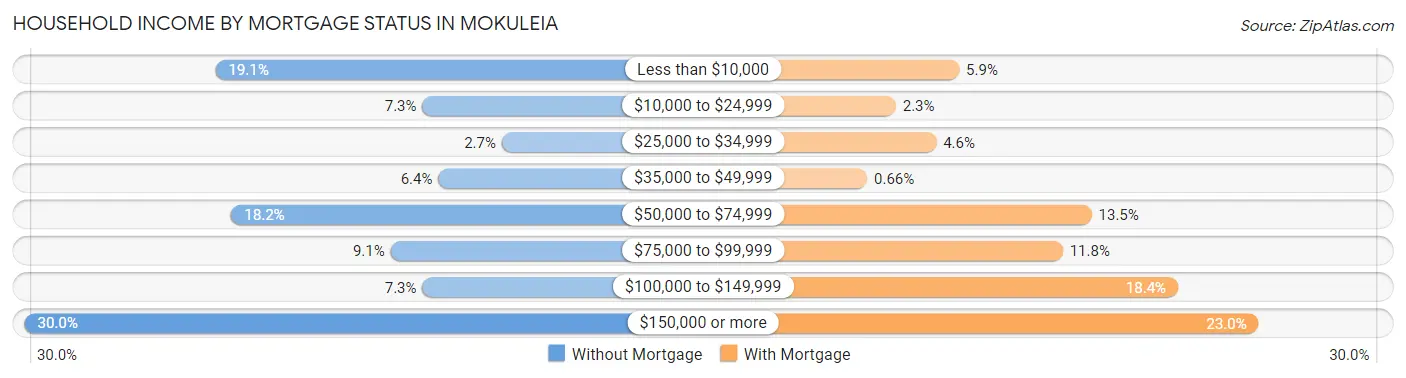
| Household Income | Without Mortgage | With Mortgage |
| Less than $10,000 | 21 (19.1%) | 18 (5.9%) |
| $10,000 to $24,999 | 8 (7.3%) | 7 (2.3%) |
| $25,000 to $34,999 | 3 (2.7%) | 14 (4.6%) |
| $35,000 to $49,999 | 7 (6.4%) | 2 (0.7%) |
| $50,000 to $74,999 | 20 (18.2%) | 41 (13.5%) |
| $75,000 to $99,999 | 10 (9.1%) | 36 (11.8%) |
| $100,000 to $149,999 | 8 (7.3%) | 56 (18.4%) |
| $150,000 or more | 33 (30.0%) | 70 (23.0%) |
| Total | 110 (100.0%) | 304 (100.0%) |
Property Value to Household Income Ratio in Mokuleia
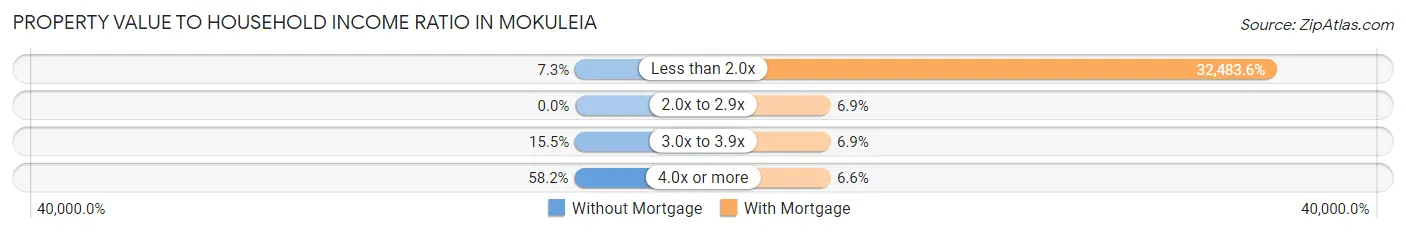
| Value-to-Income Ratio | Without Mortgage | With Mortgage |
| Less than 2.0x | 8 (7.3%) | 98,750 (32,483.6%) |
| 2.0x to 2.9x | 0 (0.0%) | 21 (6.9%) |
| 3.0x to 3.9x | 17 (15.4%) | 21 (6.9%) |
| 4.0x or more | 64 (58.2%) | 20 (6.6%) |
| Total | 110 (100.0%) | 304 (100.0%) |
Real Estate Taxes by Mortgage Status in Mokuleia
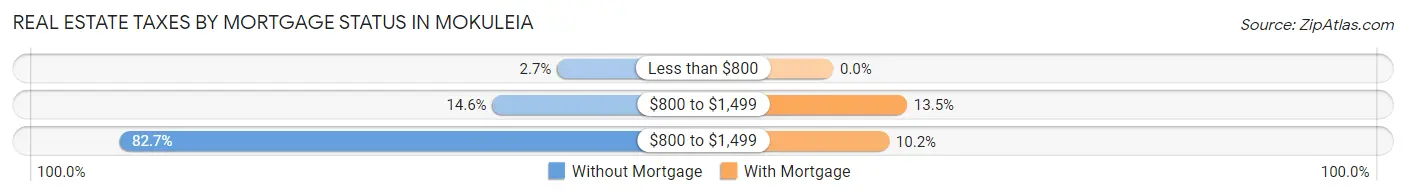
| Property Taxes | Without Mortgage | With Mortgage |
| Less than $800 | 3 (2.7%) | 0 (0.0%) |
| $800 to $1,499 | 16 (14.5%) | 41 (13.5%) |
| $800 to $1,499 | 91 (82.7%) | 31 (10.2%) |
| Total | 110 (100.0%) | 304 (100.0%) |
Health & Disability in Mokuleia
Health Insurance Coverage by Age in Mokuleia
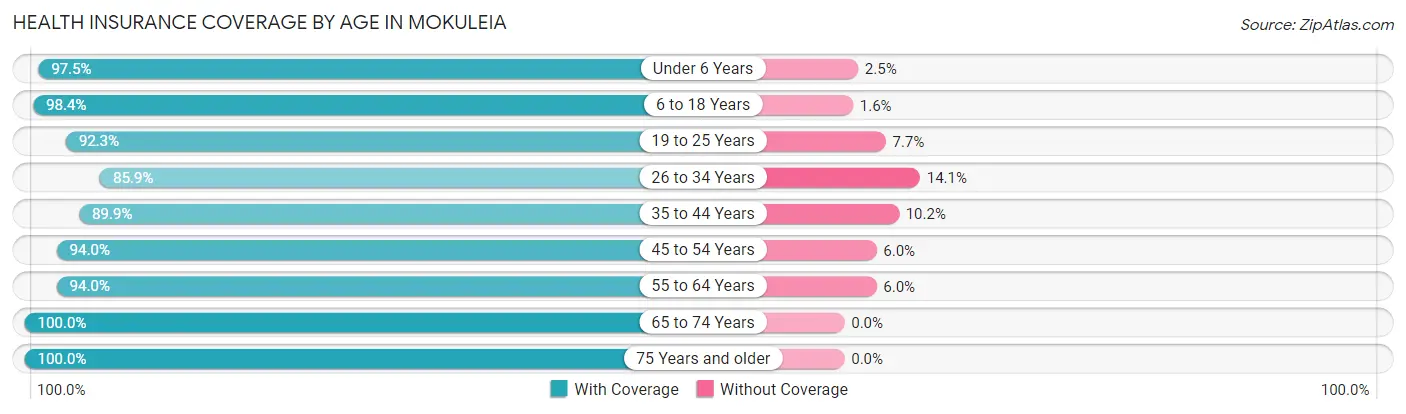
| Age Bracket | With Coverage | Without Coverage |
| Under 6 Years | 115 (97.5%) | 3 (2.5%) |
| 6 to 18 Years | 186 (98.4%) | 3 (1.6%) |
| 19 to 25 Years | 84 (92.3%) | 7 (7.7%) |
| 26 to 34 Years | 238 (85.9%) | 39 (14.1%) |
| 35 to 44 Years | 177 (89.8%) | 20 (10.2%) |
| 45 to 54 Years | 252 (94.0%) | 16 (6.0%) |
| 55 to 64 Years | 173 (94.0%) | 11 (6.0%) |
| 65 to 74 Years | 226 (100.0%) | 0 (0.0%) |
| 75 Years and older | 84 (100.0%) | 0 (0.0%) |
| Total | 1,535 (93.9%) | 99 (6.1%) |
Health Insurance Coverage by Citizenship Status in Mokuleia
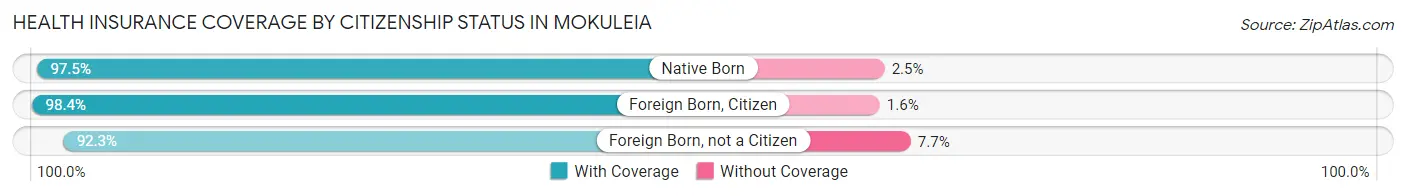
| Citizenship Status | With Coverage | Without Coverage |
| Native Born | 115 (97.5%) | 3 (2.5%) |
| Foreign Born, Citizen | 186 (98.4%) | 3 (1.6%) |
| Foreign Born, not a Citizen | 84 (92.3%) | 7 (7.7%) |
Health Insurance Coverage by Household Income in Mokuleia
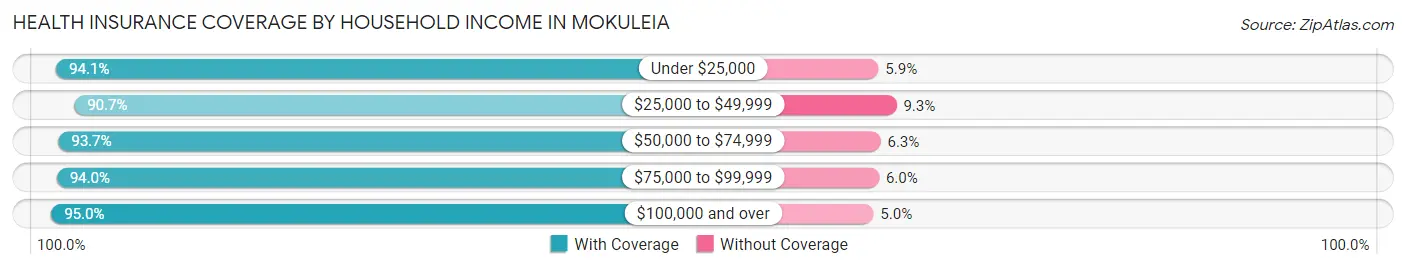
| Household Income | With Coverage | Without Coverage |
| Under $25,000 | 270 (94.1%) | 17 (5.9%) |
| $25,000 to $49,999 | 156 (90.7%) | 16 (9.3%) |
| $50,000 to $74,999 | 163 (93.7%) | 11 (6.3%) |
| $75,000 to $99,999 | 203 (94.0%) | 13 (6.0%) |
| $100,000 and over | 743 (95.0%) | 39 (5.0%) |
Public vs Private Health Insurance Coverage by Age in Mokuleia
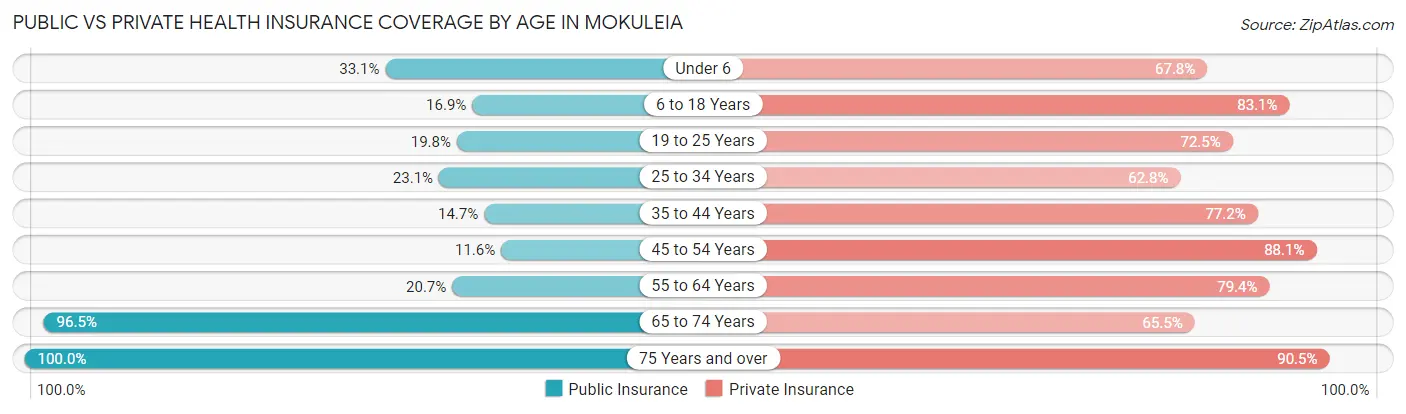
| Age Bracket | Public Insurance | Private Insurance |
| Under 6 | 39 (33.1%) | 80 (67.8%) |
| 6 to 18 Years | 32 (16.9%) | 157 (83.1%) |
| 19 to 25 Years | 18 (19.8%) | 66 (72.5%) |
| 25 to 34 Years | 64 (23.1%) | 174 (62.8%) |
| 35 to 44 Years | 29 (14.7%) | 152 (77.2%) |
| 45 to 54 Years | 31 (11.6%) | 236 (88.1%) |
| 55 to 64 Years | 38 (20.6%) | 146 (79.3%) |
| 65 to 74 Years | 218 (96.5%) | 148 (65.5%) |
| 75 Years and over | 84 (100.0%) | 76 (90.5%) |
| Total | 553 (33.8%) | 1,235 (75.6%) |
Disability Status by Sex by Age in Mokuleia
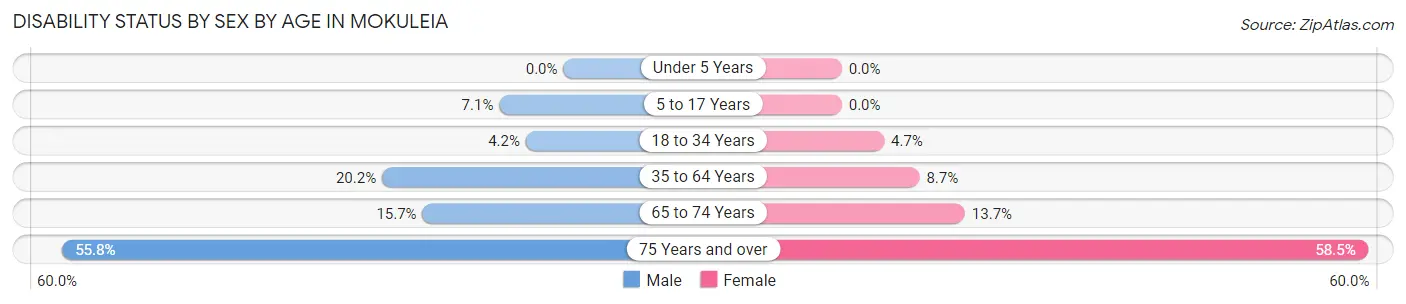
| Age Bracket | Male | Female |
| Under 5 Years | 0 (0.0%) | 0 (0.0%) |
| 5 to 17 Years | 3 (7.1%) | 0 (0.0%) |
| 18 to 34 Years | 11 (4.2%) | 8 (4.7%) |
| 35 to 64 Years | 61 (20.2%) | 30 (8.6%) |
| 65 to 74 Years | 16 (15.7%) | 17 (13.7%) |
| 75 Years and over | 24 (55.8%) | 24 (58.5%) |
Disability Class by Sex by Age in Mokuleia
Disability Class: Hearing Difficulty
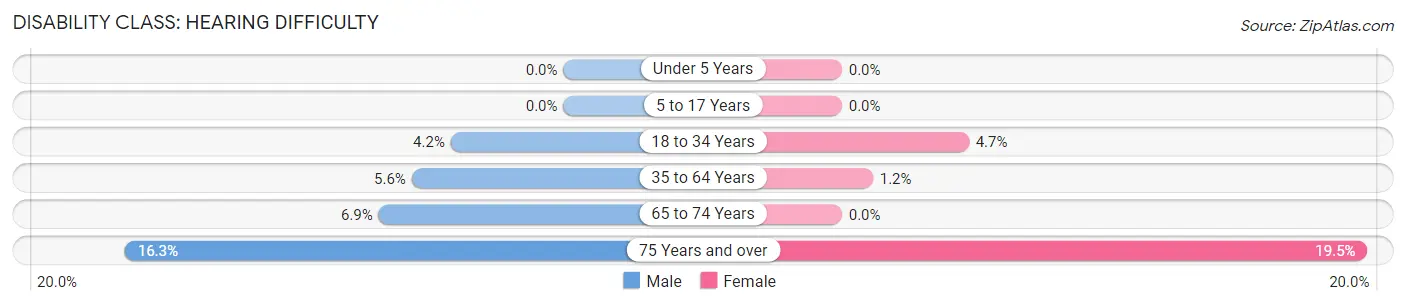
| Age Bracket | Male | Female |
| Under 5 Years | 0 (0.0%) | 0 (0.0%) |
| 5 to 17 Years | 0 (0.0%) | 0 (0.0%) |
| 18 to 34 Years | 11 (4.2%) | 8 (4.7%) |
| 35 to 64 Years | 17 (5.6%) | 4 (1.1%) |
| 65 to 74 Years | 7 (6.9%) | 0 (0.0%) |
| 75 Years and over | 7 (16.3%) | 8 (19.5%) |
Disability Class: Vision Difficulty
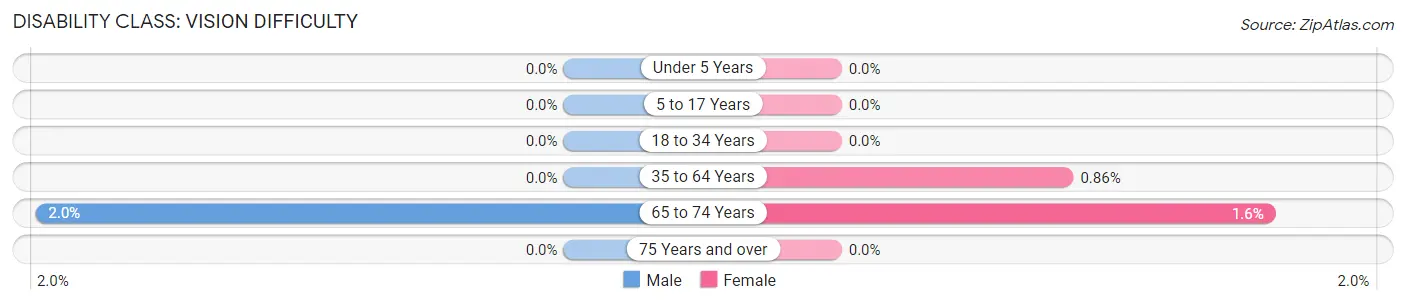
| Age Bracket | Male | Female |
| Under 5 Years | 0 (0.0%) | 0 (0.0%) |
| 5 to 17 Years | 0 (0.0%) | 0 (0.0%) |
| 18 to 34 Years | 0 (0.0%) | 0 (0.0%) |
| 35 to 64 Years | 0 (0.0%) | 3 (0.9%) |
| 65 to 74 Years | 2 (2.0%) | 2 (1.6%) |
| 75 Years and over | 0 (0.0%) | 0 (0.0%) |
Disability Class: Cognitive Difficulty
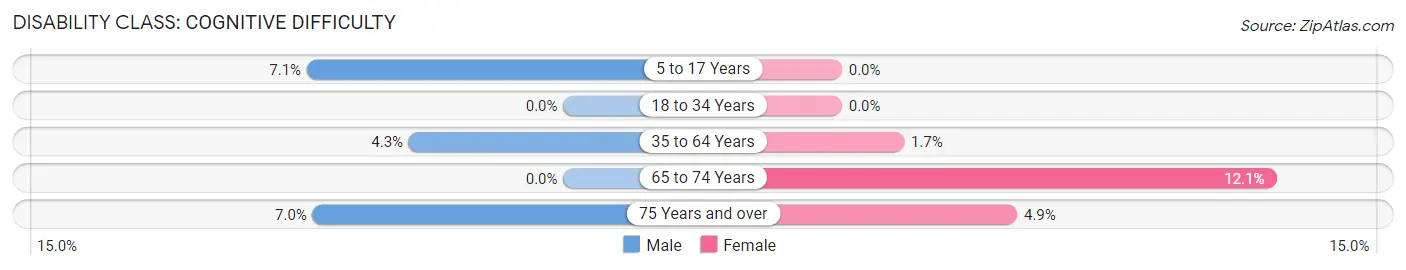
| Age Bracket | Male | Female |
| 5 to 17 Years | 3 (7.1%) | 0 (0.0%) |
| 18 to 34 Years | 0 (0.0%) | 0 (0.0%) |
| 35 to 64 Years | 13 (4.3%) | 6 (1.7%) |
| 65 to 74 Years | 0 (0.0%) | 15 (12.1%) |
| 75 Years and over | 3 (7.0%) | 2 (4.9%) |
Disability Class: Ambulatory Difficulty
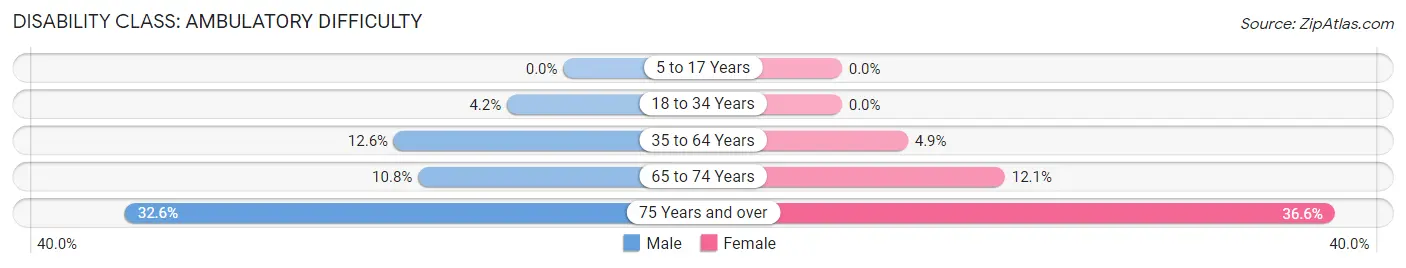
| Age Bracket | Male | Female |
| 5 to 17 Years | 0 (0.0%) | 0 (0.0%) |
| 18 to 34 Years | 11 (4.2%) | 0 (0.0%) |
| 35 to 64 Years | 38 (12.6%) | 17 (4.9%) |
| 65 to 74 Years | 11 (10.8%) | 15 (12.1%) |
| 75 Years and over | 14 (32.6%) | 15 (36.6%) |
Disability Class: Self-Care Difficulty
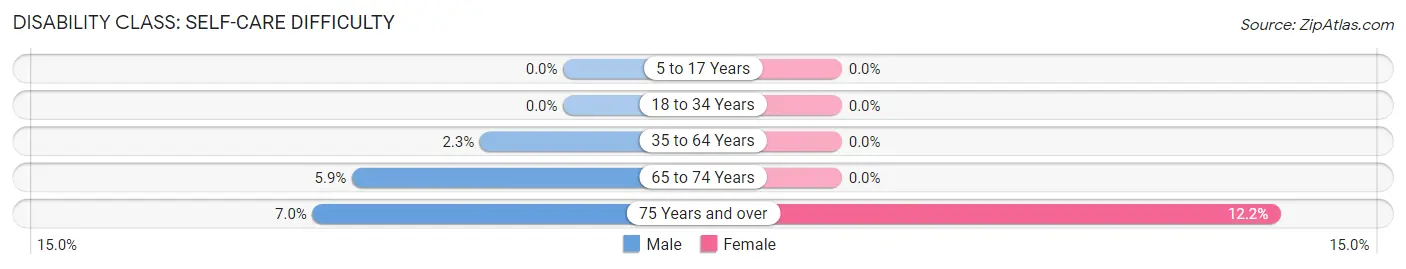
| Age Bracket | Male | Female |
| 5 to 17 Years | 0 (0.0%) | 0 (0.0%) |
| 18 to 34 Years | 0 (0.0%) | 0 (0.0%) |
| 35 to 64 Years | 7 (2.3%) | 0 (0.0%) |
| 65 to 74 Years | 6 (5.9%) | 0 (0.0%) |
| 75 Years and over | 3 (7.0%) | 5 (12.2%) |
Technology Access in Mokuleia
Computing Device Access in Mokuleia
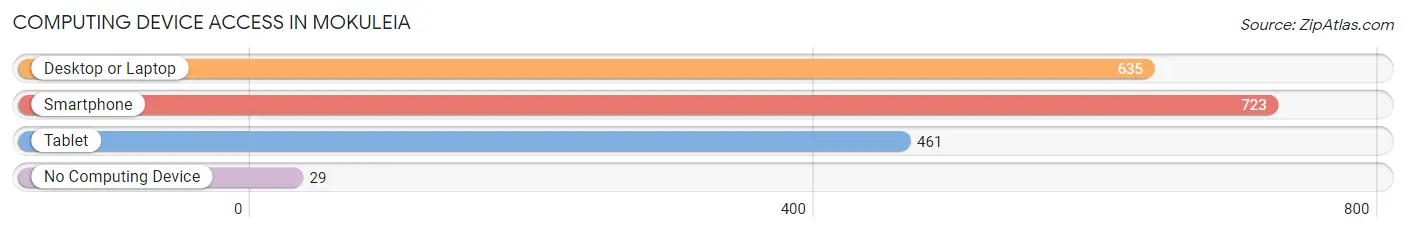
| Device Type | # Households | % Households |
| Desktop or Laptop | 635 | 81.7% |
| Smartphone | 723 | 93.0% |
| Tablet | 461 | 59.3% |
| No Computing Device | 29 | 3.7% |
| Total | 777 | 100.0% |
Internet Access in Mokuleia
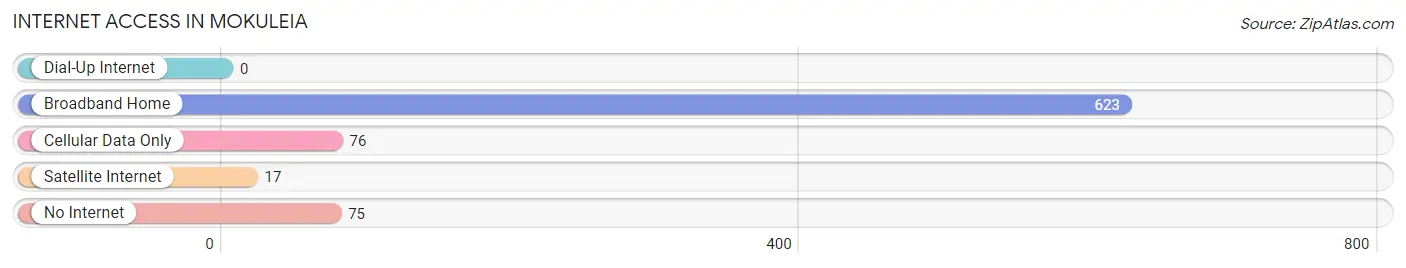
| Internet Type | # Households | % Households |
| Dial-Up Internet | 0 | 0.0% |
| Broadband Home | 623 | 80.2% |
| Cellular Data Only | 76 | 9.8% |
| Satellite Internet | 17 | 2.2% |
| No Internet | 75 | 9.7% |
| Total | 777 | 100.0% |
Mokuleia Summary
Mokuleia is a small unincorporated community located on the North Shore of Oahu, Hawaii. It is located in the Waialua District of the island and is bordered by Waialua Bay to the east and the Waianae Mountains to the west. The population of Mokuleia was estimated to be around 1,000 people in 2000.
History
Mokuleia has a long and rich history that dates back to the early 1800s. The area was originally inhabited by the Mokuleia people, a Native Hawaiian tribe. The Mokuleia people were known for their fishing and farming skills and were also known for their strong spiritual beliefs.
In the late 1800s, Mokuleia was a popular destination for whalers and traders. The area was also home to a number of sugar plantations, which provided employment for many of the local residents.
In the early 1900s, Mokuleia became a popular destination for tourists. The area was known for its beautiful beaches and its close proximity to Honolulu.
In the 1950s, Mokuleia was the site of a U.S. Navy base. The base was used for training and research purposes and was eventually closed in the 1970s.
Geography
Mokuleia is located on the North Shore of Oahu, Hawaii. It is bordered by Waialua Bay to the east and the Waianae Mountains to the west. The area is known for its beautiful beaches and its close proximity to Honolulu.
The climate in Mokuleia is tropical and humid. The average temperature is around 75 degrees Fahrenheit and the average rainfall is around 25 inches per year.
Economy
Mokuleia is primarily a residential community. The area is home to a number of small businesses, including restaurants, shops, and services. The area is also home to a number of tourist attractions, including the Mokuleia Beach Park and the Mokuleia Marine Life Conservation District.
Demographics
In 2000, the population of Mokuleia was estimated to be around 1,000 people. The majority of the population is of Native Hawaiian descent. The median household income in Mokuleia is around $50,000 per year. The median age of the population is around 40 years old.
Common Questions
What is Per Capita Income in Mokuleia?
Per Capita income in Mokuleia is $63,640.
What is the Median Family Income in Mokuleia?
Median Family Income in Mokuleia is $110,625.
What is the Median Household income in Mokuleia?
Median Household Income in Mokuleia is $83,688.
What is Income or Wage Gap in Mokuleia?
Income or Wage Gap in Mokuleia is 13.1%.
Women in Mokuleia earn 86.9 cents for every dollar earned by a man.
What is Inequality or Gini Index in Mokuleia?
Inequality or Gini Index in Mokuleia is 0.54.
What is the Total Population of Mokuleia?
Total Population of Mokuleia is 1,782.
What is the Total Male Population of Mokuleia?
Total Male Population of Mokuleia is 947.
What is the Total Female Population of Mokuleia?
Total Female Population of Mokuleia is 835.
What is the Ratio of Males per 100 Females in Mokuleia?
There are 113.41 Males per 100 Females in Mokuleia.
What is the Ratio of Females per 100 Males in Mokuleia?
There are 88.17 Females per 100 Males in Mokuleia.
What is the Median Population Age in Mokuleia?
Median Population Age in Mokuleia is 39.1 Years.
What is the Average Family Size in Mokuleia
Average Family Size in Mokuleia is 3.1 People.
What is the Average Household Size in Mokuleia
Average Household Size in Mokuleia is 2.3 People.
How Large is the Labor Force in Mokuleia?
There are 1,042 People in the Labor Forcein in Mokuleia.
What is the Percentage of People in the Labor Force in Mokuleia?
67.2% of People are in the Labor Force in Mokuleia.
What is the Unemployment Rate in Mokuleia?
Unemployment Rate in Mokuleia is 3.6%.