Iroquois Point, HI Map & Demographics
Iroquois Point Map
Iroquois Point Overview
$32,204
PER CAPITA INCOME
$100,121
AVG FAMILY INCOME
$100,794
AVG HOUSEHOLD INCOME
52.5%
WAGE / INCOME GAP [ % ]
47.5¢/ $1
WAGE / INCOME GAP [ $ ]
0.31
INEQUALITY / GINI INDEX
5,921
TOTAL POPULATION
2,903
MALE POPULATION
3,018
FEMALE POPULATION
96.19
MALES / 100 FEMALES
103.96
FEMALES / 100 MALES
25.2
MEDIAN AGE
4.3
AVG FAMILY SIZE
3.9
AVG HOUSEHOLD SIZE
2,747
LABOR FORCE [ PEOPLE ]
74.6%
PERCENT IN LABOR FORCE
9.0%
UNEMPLOYMENT RATE
Income in Iroquois Point
Income Overview in Iroquois Point
Per Capita Income in Iroquois Point is $32,204, while median incomes of families and households are $100,121 and $100,794 respectively.
| Characteristic | Number | Measure |
| Per Capita Income | 5,921 | $32,204 |
| Median Family Income | 1,197 | $100,121 |
| Mean Family Income | 1,197 | $114,661 |
| Median Household Income | 1,511 | $100,794 |
| Mean Household Income | 1,511 | $119,705 |
| Income Deficit | 1,197 | $0 |
| Wage / Income Gap (%) | 5,921 | 52.49% |
| Wage / Income Gap ($) | 5,921 | 47.51¢ per $1 |
| Gini / Inequality Index | 5,921 | 0.31 |
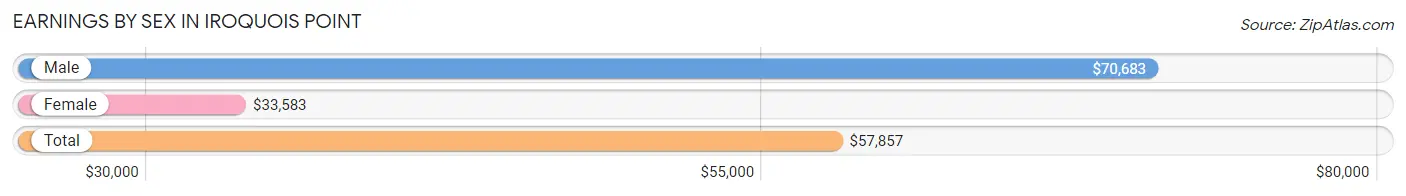
Earnings by Sex in Iroquois Point
Average Earnings in Iroquois Point are $57,857, $70,683 for men and $33,583 for women, a difference of 52.5%.
| Sex | Number | Average Earnings |
| Male | 1,629 (60.6%) | $70,683 |
| Female | 1,059 (39.4%) | $33,583 |
| Total | 2,688 (100.0%) | $57,857 |
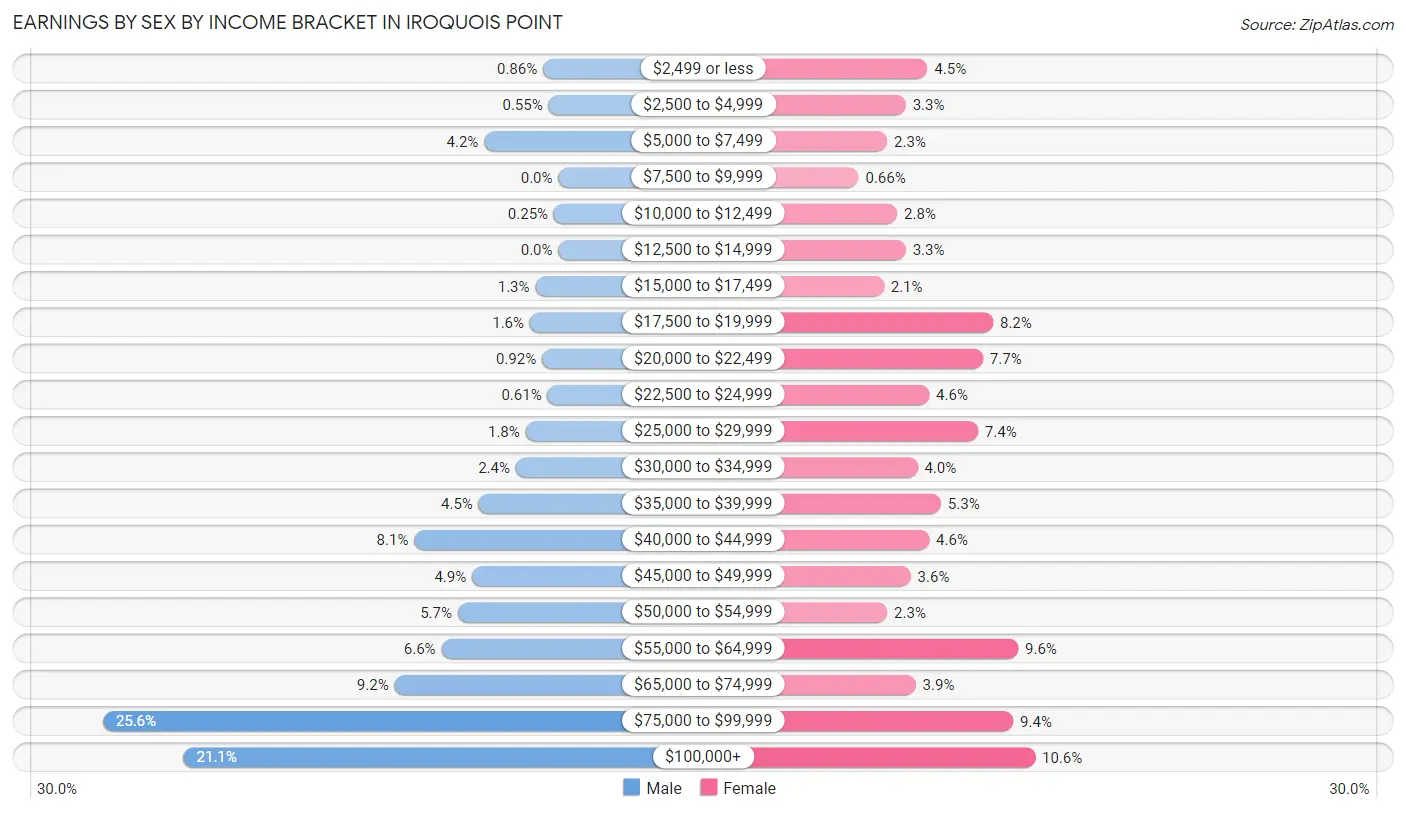
Earnings by Sex by Income Bracket in Iroquois Point
The most common earnings brackets in Iroquois Point are $75,000 to $99,999 for men (417 | 25.6%) and $100,000+ for women (112 | 10.6%).
| Income | Male | Female |
| $2,499 or less | 14 (0.9%) | 48 (4.5%) |
| $2,500 to $4,999 | 9 (0.5%) | 35 (3.3%) |
| $5,000 to $7,499 | 68 (4.2%) | 24 (2.3%) |
| $7,500 to $9,999 | 0 (0.0%) | 7 (0.7%) |
| $10,000 to $12,499 | 4 (0.3%) | 30 (2.8%) |
| $12,500 to $14,999 | 0 (0.0%) | 35 (3.3%) |
| $15,000 to $17,499 | 21 (1.3%) | 22 (2.1%) |
| $17,500 to $19,999 | 26 (1.6%) | 87 (8.2%) |
| $20,000 to $22,499 | 15 (0.9%) | 81 (7.6%) |
| $22,500 to $24,999 | 10 (0.6%) | 49 (4.6%) |
| $25,000 to $29,999 | 30 (1.8%) | 78 (7.4%) |
| $30,000 to $34,999 | 39 (2.4%) | 42 (4.0%) |
| $35,000 to $39,999 | 73 (4.5%) | 56 (5.3%) |
| $40,000 to $44,999 | 132 (8.1%) | 49 (4.6%) |
| $45,000 to $49,999 | 79 (4.9%) | 38 (3.6%) |
| $50,000 to $54,999 | 92 (5.7%) | 24 (2.3%) |
| $55,000 to $64,999 | 107 (6.6%) | 102 (9.6%) |
| $65,000 to $74,999 | 150 (9.2%) | 41 (3.9%) |
| $75,000 to $99,999 | 417 (25.6%) | 99 (9.3%) |
| $100,000+ | 343 (21.1%) | 112 (10.6%) |
| Total | 1,629 (100.0%) | 1,059 (100.0%) |
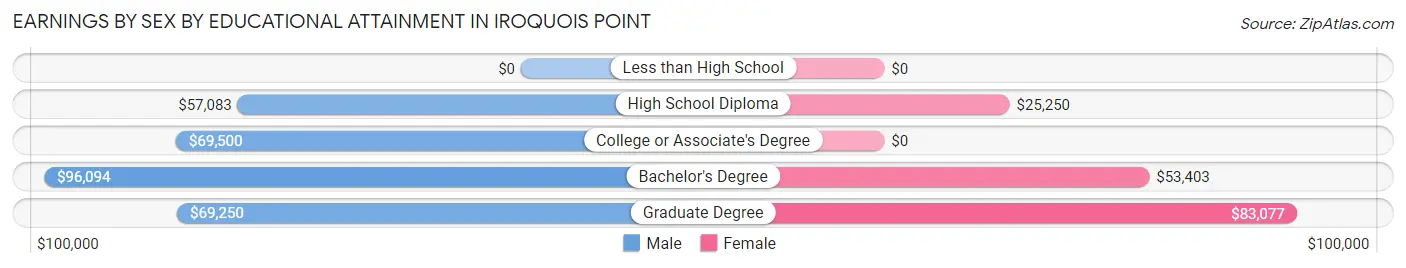
Earnings by Sex by Educational Attainment in Iroquois Point
Average earnings in Iroquois Point are $70,938 for men and $40,765 for women, a difference of 42.5%. Men with an educational attainment of bachelor's degree enjoy the highest average annual earnings of $96,094, while those with high school diploma education earn the least with $57,083. Women with an educational attainment of graduate degree earn the most with the average annual earnings of $83,077, while those with high school diploma education have the smallest earnings of $25,250.
| Educational Attainment | Male Income | Female Income |
| Less than High School | - | - |
| High School Diploma | $57,083 | $25,250 |
| College or Associate's Degree | $69,500 | $0 |
| Bachelor's Degree | $96,094 | $53,403 |
| Graduate Degree | $69,250 | $83,077 |
| Total | $70,938 | $40,765 |
Family Income in Iroquois Point
Family Income Brackets in Iroquois Point
According to the Iroquois Point family income data, there are 278 families falling into the $75,000 to $99,999 income range, which is the most common income bracket and makes up 23.2% of all families.
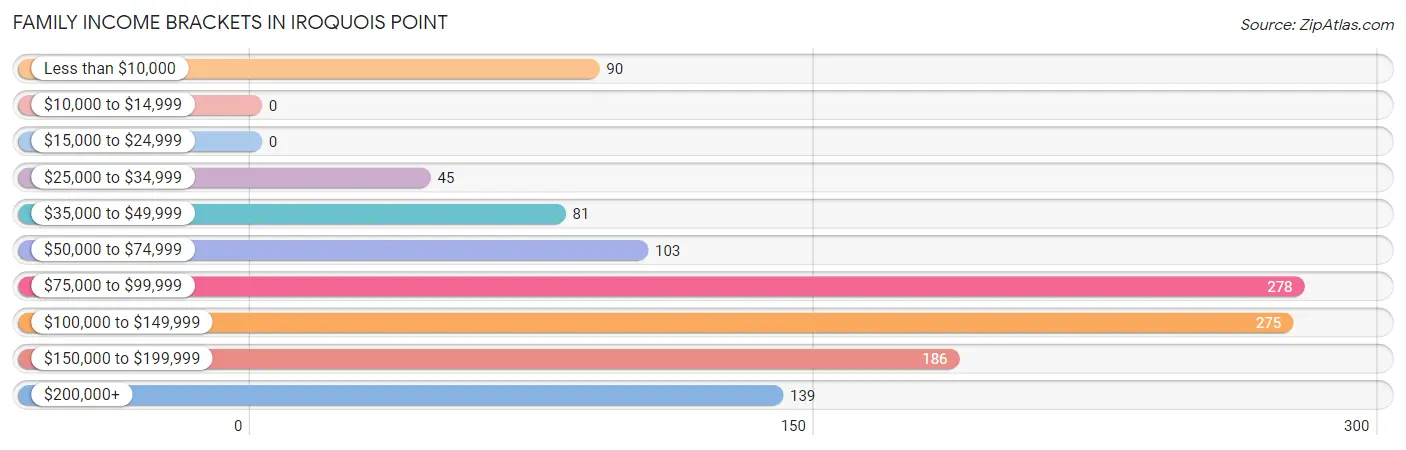
| Income Bracket | # Families | % Families |
| Less than $10,000 | 90 | 7.5% |
| $10,000 to $14,999 | 0 | 0.0% |
| $15,000 to $24,999 | 0 | 0.0% |
| $25,000 to $34,999 | 45 | 3.8% |
| $35,000 to $49,999 | 81 | 6.8% |
| $50,000 to $74,999 | 103 | 8.6% |
| $75,000 to $99,999 | 278 | 23.2% |
| $100,000 to $149,999 | 275 | 23.0% |
| $150,000 to $199,999 | 186 | 15.5% |
| $200,000+ | 139 | 11.6% |
Family Income by Famaliy Size in Iroquois Point
7+ person families (110 | 9.2%) account for the highest median family income in Iroquois Point with $208,952 per family, while 2-person families (285 | 23.8%) have the highest median income of $55,142 per family member.
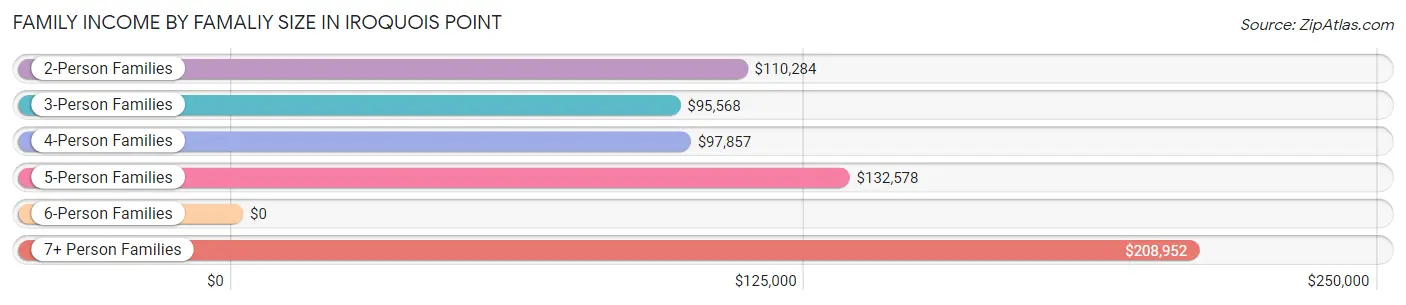
| Income Bracket | # Families | Median Income |
| 2-Person Families | 285 (23.8%) | $110,284 |
| 3-Person Families | 210 (17.5%) | $95,568 |
| 4-Person Families | 336 (28.1%) | $97,857 |
| 5-Person Families | 199 (16.6%) | $132,578 |
| 6-Person Families | 57 (4.8%) | $0 |
| 7+ Person Families | 110 (9.2%) | $208,952 |
| Total | 1,197 (100.0%) | $100,121 |
Family Income by Number of Earners in Iroquois Point
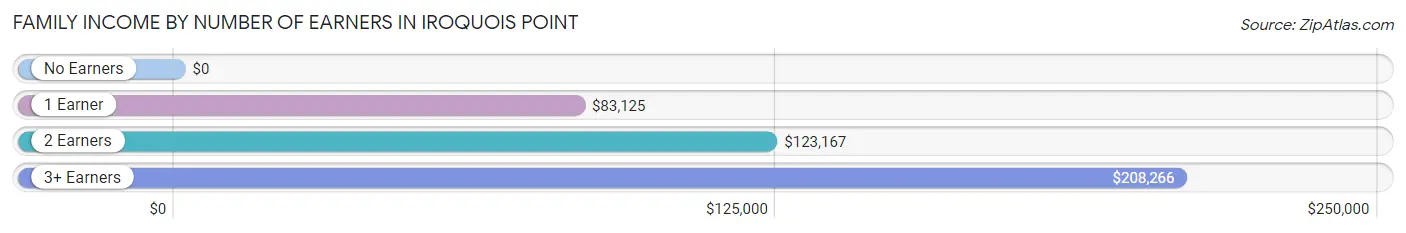
| Number of Earners | # Families | Median Income |
| No Earners | 120 (10.0%) | $0 |
| 1 Earner | 470 (39.3%) | $83,125 |
| 2 Earners | 488 (40.8%) | $123,167 |
| 3+ Earners | 119 (9.9%) | $208,266 |
| Total | 1,197 (100.0%) | $100,121 |
Household Income in Iroquois Point
Household Income Brackets in Iroquois Point
With 402 households falling in the category, the $75,000 to $99,999 income range is the most frequent in Iroquois Point, accounting for 26.6% of all households.
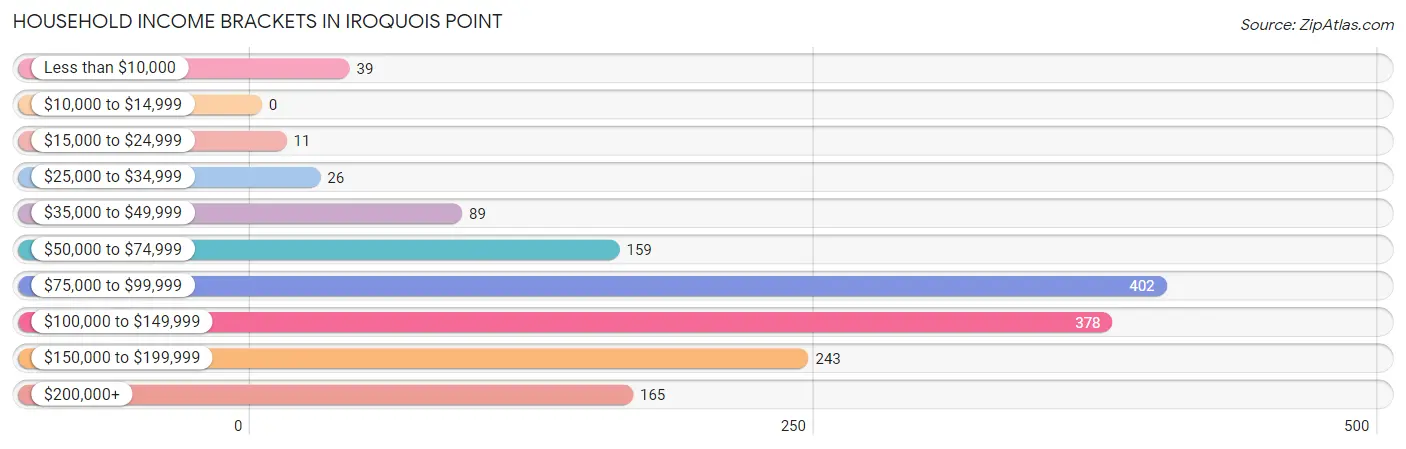
| Income Bracket | # Households | % Households |
| Less than $10,000 | 39 | 2.6% |
| $10,000 to $14,999 | 0 | 0.0% |
| $15,000 to $24,999 | 11 | 0.7% |
| $25,000 to $34,999 | 26 | 1.7% |
| $35,000 to $49,999 | 89 | 5.9% |
| $50,000 to $74,999 | 159 | 10.5% |
| $75,000 to $99,999 | 402 | 26.6% |
| $100,000 to $149,999 | 378 | 25.0% |
| $150,000 to $199,999 | 243 | 16.1% |
| $200,000+ | 165 | 10.9% |
Household Income by Householder Age in Iroquois Point
The median household income in Iroquois Point is $100,794, with the highest median household income of $155,119 found in the 45 to 64 years age bracket for the primary householder. A total of 352 households (23.3%) fall into this category. Meanwhile, the 65+ years age bracket for the primary householder has the lowest median household income of $0, with 93 households (6.1%) in this group.
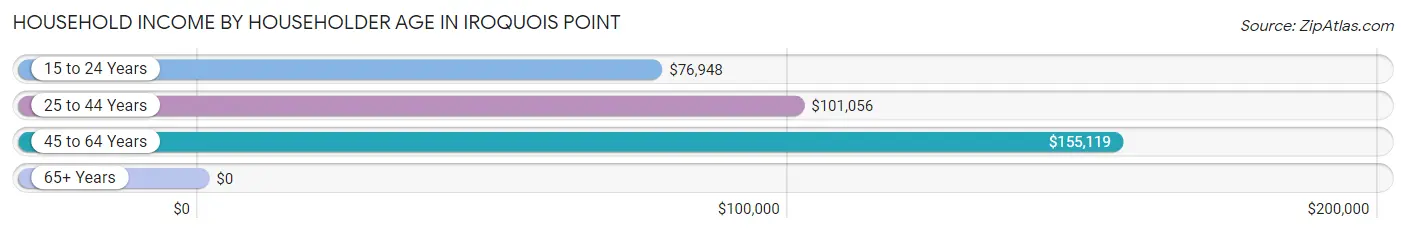
| Income Bracket | # Households | Median Income |
| 15 to 24 Years | 150 (9.9%) | $76,948 |
| 25 to 44 Years | 916 (60.6%) | $101,056 |
| 45 to 64 Years | 352 (23.3%) | $155,119 |
| 65+ Years | 93 (6.1%) | $0 |
| Total | 1,511 (100.0%) | $100,794 |
Poverty in Iroquois Point
Income Below Poverty by Sex and Age in Iroquois Point
With 11.1% poverty level for males and 18.7% for females among the residents of Iroquois Point, 12 to 14 year old males and 16 and 17 year old females are the most vulnerable to poverty, with 105 males (47.5%) and 41 females (55.4%) in their respective age groups living below the poverty level.
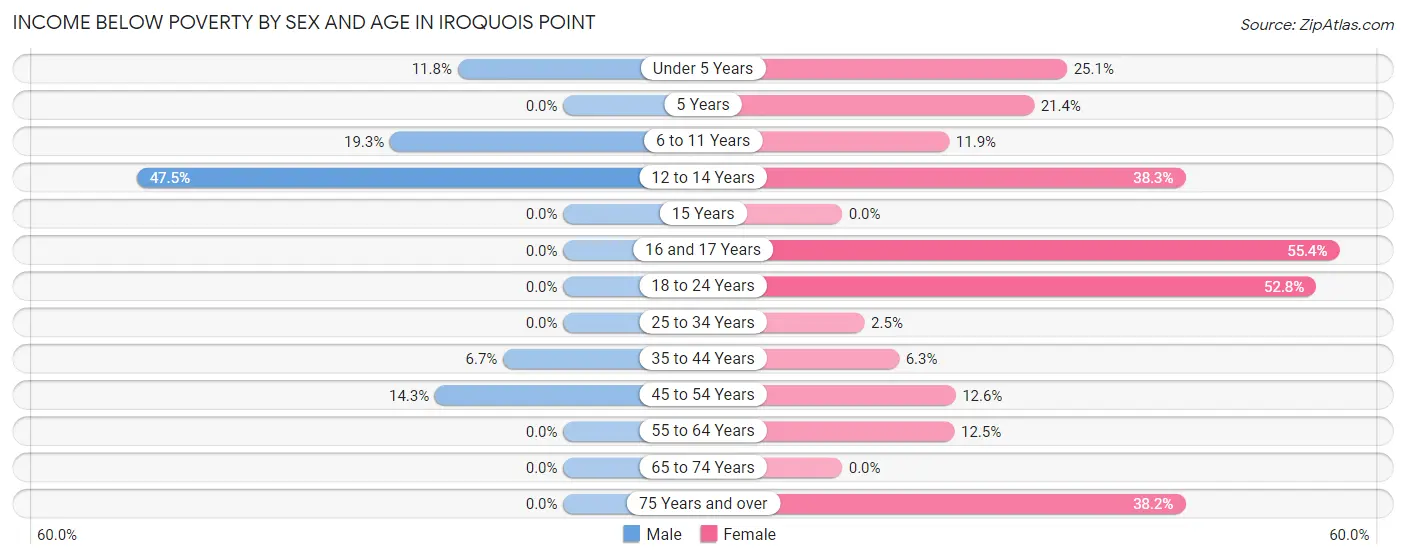
| Age Bracket | Male | Female |
| Under 5 Years | 18 (11.8%) | 114 (25.1%) |
| 5 Years | 0 (0.0%) | 25 (21.4%) |
| 6 to 11 Years | 99 (19.3%) | 50 (11.9%) |
| 12 to 14 Years | 105 (47.5%) | 88 (38.3%) |
| 15 Years | 0 (0.0%) | 0 (0.0%) |
| 16 and 17 Years | 0 (0.0%) | 41 (55.4%) |
| 18 to 24 Years | 0 (0.0%) | 131 (52.8%) |
| 25 to 34 Years | 0 (0.0%) | 12 (2.5%) |
| 35 to 44 Years | 47 (6.7%) | 32 (6.3%) |
| 45 to 54 Years | 53 (14.3%) | 24 (12.6%) |
| 55 to 64 Years | 0 (0.0%) | 17 (12.5%) |
| 65 to 74 Years | 0 (0.0%) | 0 (0.0%) |
| 75 Years and over | 0 (0.0%) | 26 (38.2%) |
| Total | 322 (11.1%) | 560 (18.7%) |
Income Above Poverty by Sex and Age in Iroquois Point
According to the poverty statistics in Iroquois Point, males aged 5 years and females aged 65 to 74 years are the age groups that are most secure financially, with 100.0% of males and 100.0% of females in these age groups living above the poverty line.
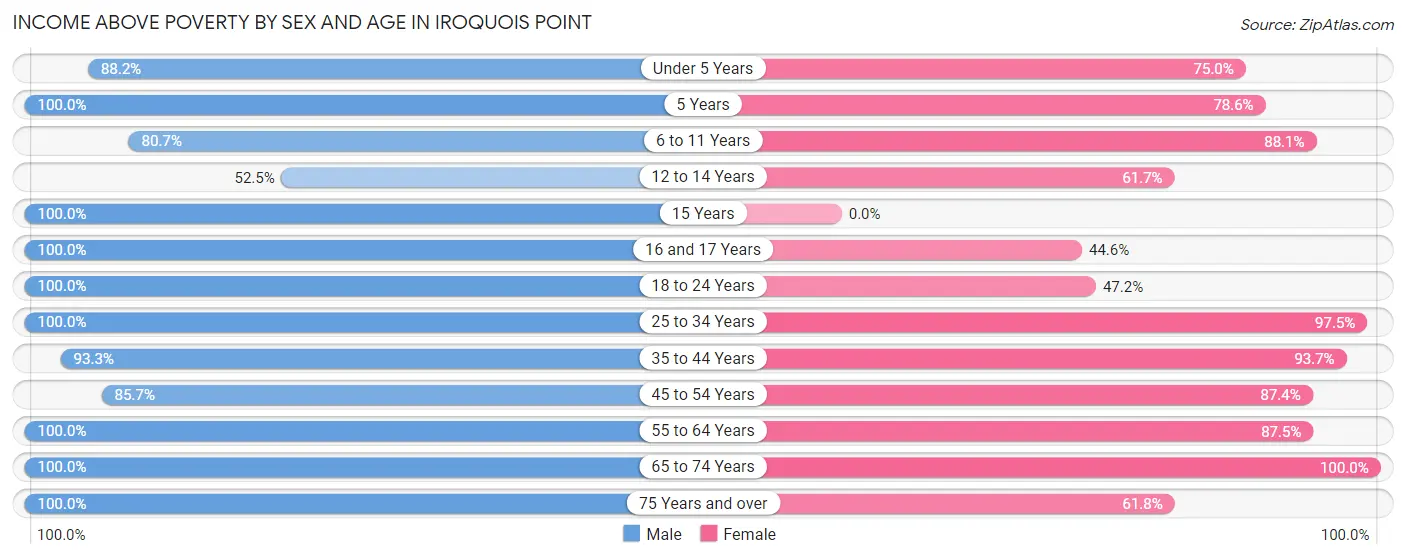
| Age Bracket | Male | Female |
| Under 5 Years | 135 (88.2%) | 341 (75.0%) |
| 5 Years | 83 (100.0%) | 92 (78.6%) |
| 6 to 11 Years | 414 (80.7%) | 369 (88.1%) |
| 12 to 14 Years | 116 (52.5%) | 142 (61.7%) |
| 15 Years | 27 (100.0%) | 0 (0.0%) |
| 16 and 17 Years | 72 (100.0%) | 33 (44.6%) |
| 18 to 24 Years | 312 (100.0%) | 117 (47.2%) |
| 25 to 34 Years | 346 (100.0%) | 469 (97.5%) |
| 35 to 44 Years | 654 (93.3%) | 473 (93.7%) |
| 45 to 54 Years | 318 (85.7%) | 166 (87.4%) |
| 55 to 64 Years | 37 (100.0%) | 119 (87.5%) |
| 65 to 74 Years | 47 (100.0%) | 74 (100.0%) |
| 75 Years and over | 18 (100.0%) | 42 (61.8%) |
| Total | 2,579 (88.9%) | 2,437 (81.3%) |
Income Below Poverty Among Married-Couple Families in Iroquois Point
The poverty statistics for married-couple families in Iroquois Point show that 3.6% or 32 of the total 900 families live below the poverty line. Families with 5 or more children have the highest poverty rate of 32.2%, comprising of 19 families. On the other hand, families with no children have the lowest poverty rate of 0.0%, which includes 0 families.
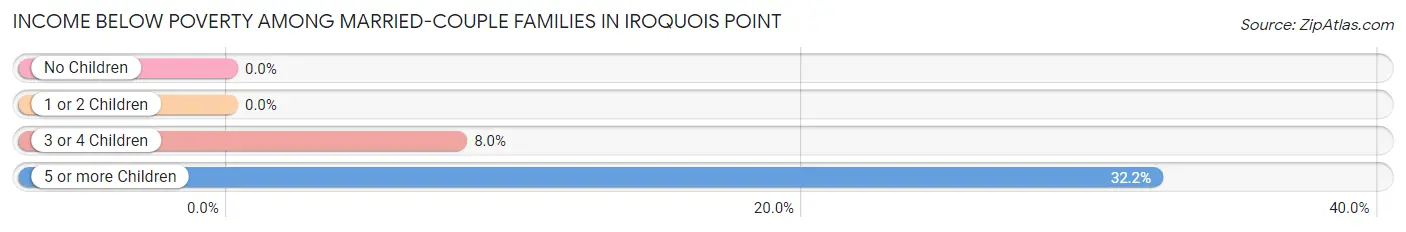
| Children | Above Poverty | Below Poverty |
| No Children | 242 (100.0%) | 0 (0.0%) |
| 1 or 2 Children | 436 (100.0%) | 0 (0.0%) |
| 3 or 4 Children | 150 (92.0%) | 13 (8.0%) |
| 5 or more Children | 40 (67.8%) | 19 (32.2%) |
| Total | 868 (96.4%) | 32 (3.6%) |
Income Below Poverty Among Single-Parent Households in Iroquois Point
According to the poverty data in Iroquois Point, 14.0% or 19 single-father households and 47.8% or 77 single-mother households are living below the poverty line. Among single-father households, those with 1 or 2 children have the highest poverty rate, with 19 households (21.1%) experiencing poverty. Likewise, among single-mother households, those with 3 or 4 children have the highest poverty rate, with 77 households (100.0%) falling below the poverty line.
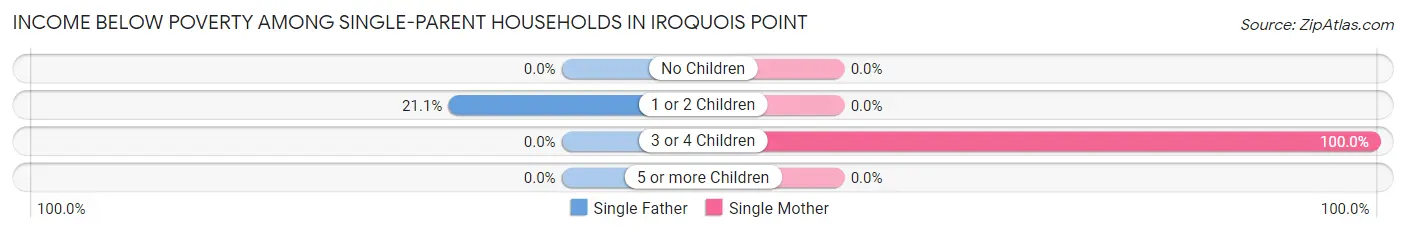
| Children | Single Father | Single Mother |
| No Children | 0 (0.0%) | 0 (0.0%) |
| 1 or 2 Children | 19 (21.1%) | 0 (0.0%) |
| 3 or 4 Children | 0 (0.0%) | 77 (100.0%) |
| 5 or more Children | 0 (0.0%) | 0 (0.0%) |
| Total | 19 (14.0%) | 77 (47.8%) |
Income Below Poverty Among Married-Couple vs Single-Parent Households in Iroquois Point
The poverty data for Iroquois Point shows that 32 of the married-couple family households (3.6%) and 96 of the single-parent households (32.3%) are living below the poverty level. Within the married-couple family households, those with 5 or more children have the highest poverty rate, with 19 households (32.2%) falling below the poverty line. Among the single-parent households, those with 3 or 4 children have the highest poverty rate, with 77 household (68.1%) living below poverty.
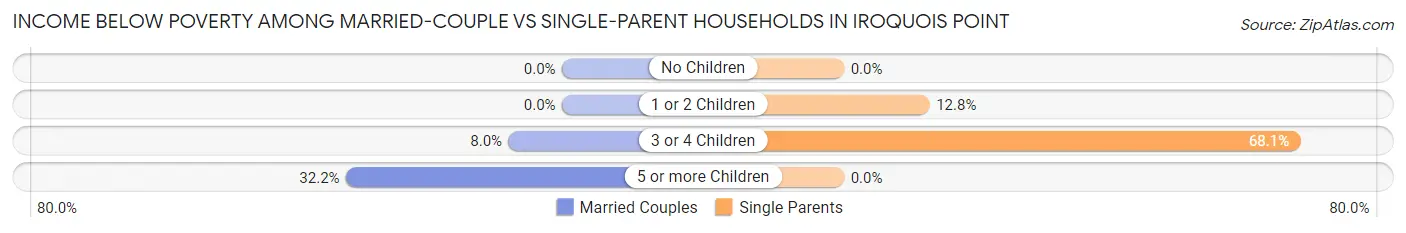
| Children | Married-Couple Families | Single-Parent Households |
| No Children | 0 (0.0%) | 0 (0.0%) |
| 1 or 2 Children | 0 (0.0%) | 19 (12.8%) |
| 3 or 4 Children | 13 (8.0%) | 77 (68.1%) |
| 5 or more Children | 19 (32.2%) | 0 (0.0%) |
| Total | 32 (3.6%) | 96 (32.3%) |
Race in Iroquois Point
The most populous races in Iroquois Point are White / Caucasian (2,132 | 36.0%), Two or more Races (1,658 | 28.0%), and Hispanic or Latino (1,096 | 18.5%).
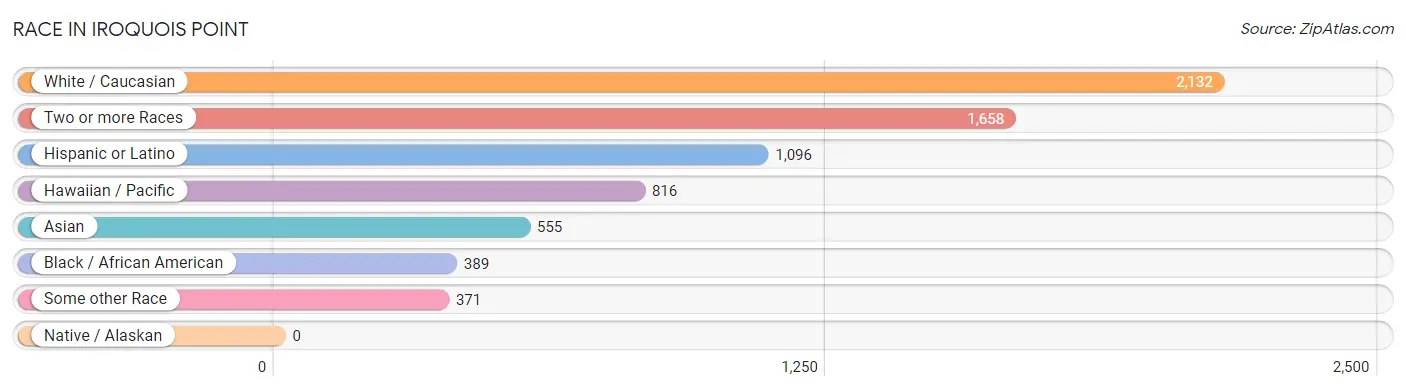
| Race | # Population | % Population |
| Asian | 555 | 9.4% |
| Black / African American | 389 | 6.6% |
| Hawaiian / Pacific | 816 | 13.8% |
| Hispanic or Latino | 1,096 | 18.5% |
| Native / Alaskan | 0 | 0.0% |
| White / Caucasian | 2,132 | 36.0% |
| Two or more Races | 1,658 | 28.0% |
| Some other Race | 371 | 6.3% |
| Total | 5,921 | 100.0% |
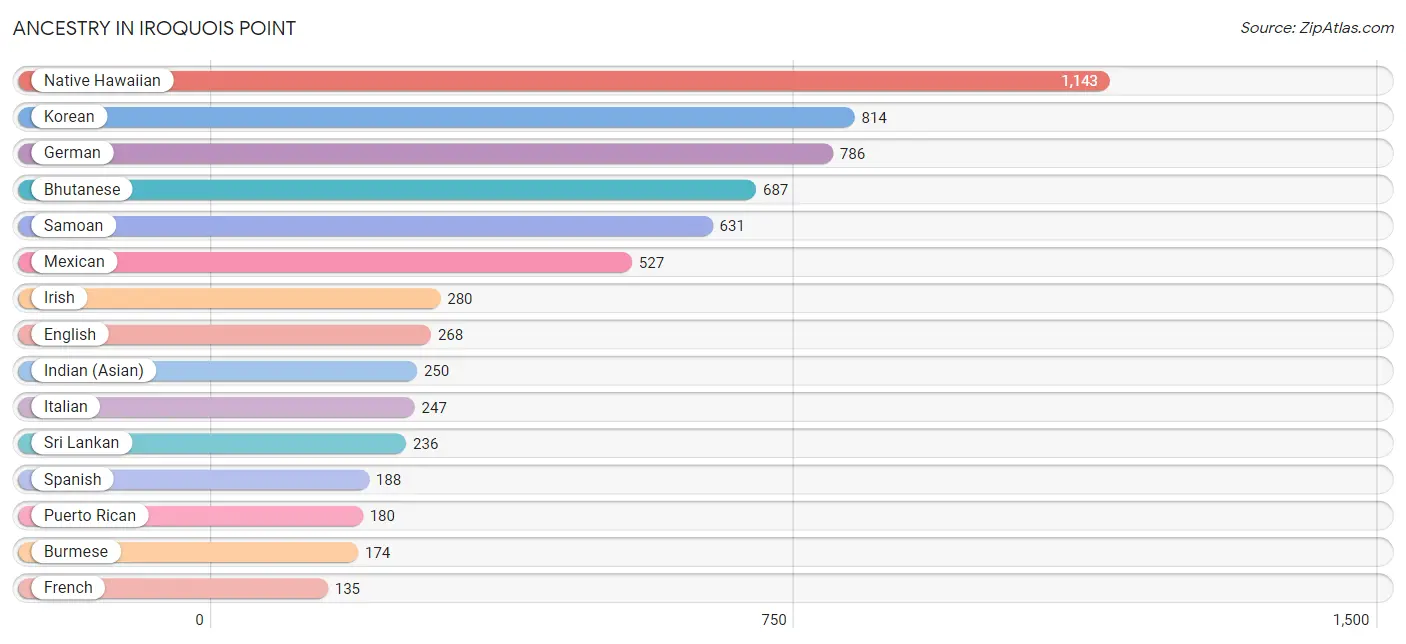
Ancestry in Iroquois Point
The most populous ancestries reported in Iroquois Point are Native Hawaiian (1,143 | 19.3%), Korean (814 | 13.8%), German (786 | 13.3%), Bhutanese (687 | 11.6%), and Samoan (631 | 10.7%), together accounting for 68.6% of all Iroquois Point residents.
| Ancestry | # Population | % Population |
| African | 29 | 0.5% |
| Albanian | 31 | 0.5% |
| American | 126 | 2.1% |
| Apache | 35 | 0.6% |
| Arab | 84 | 1.4% |
| Austrian | 6 | 0.1% |
| Bhutanese | 687 | 11.6% |
| Burmese | 174 | 2.9% |
| Central American | 72 | 1.2% |
| Central American Indian | 56 | 0.9% |
| Cherokee | 98 | 1.7% |
| Choctaw | 24 | 0.4% |
| Colombian | 67 | 1.1% |
| Cuban | 11 | 0.2% |
| Czech | 23 | 0.4% |
| Dominican | 24 | 0.4% |
| Dutch | 72 | 1.2% |
| Egyptian | 84 | 1.4% |
| English | 268 | 4.5% |
| European | 51 | 0.9% |
| Finnish | 12 | 0.2% |
| French | 135 | 2.3% |
| French American Indian | 12 | 0.2% |
| French Canadian | 35 | 0.6% |
| German | 786 | 13.3% |
| Greek | 11 | 0.2% |
| Guamanian / Chamorro | 104 | 1.8% |
| Guatemalan | 25 | 0.4% |
| Indian (Asian) | 250 | 4.2% |
| Irish | 280 | 4.7% |
| Italian | 247 | 4.2% |
| Jamaican | 10 | 0.2% |
| Korean | 814 | 13.8% |
| Marshallese | 113 | 1.9% |
| Mexican | 527 | 8.9% |
| Native Hawaiian | 1,143 | 19.3% |
| Nigerian | 17 | 0.3% |
| Norwegian | 23 | 0.4% |
| Paiute | 32 | 0.5% |
| Pakistani | 5 | 0.1% |
| Panamanian | 47 | 0.8% |
| Peruvian | 27 | 0.5% |
| Polish | 16 | 0.3% |
| Portuguese | 17 | 0.3% |
| Puerto Rican | 180 | 3.0% |
| Russian | 5 | 0.1% |
| Samoan | 631 | 10.7% |
| Scotch-Irish | 28 | 0.5% |
| Scottish | 70 | 1.2% |
| Sioux | 41 | 0.7% |
| South American | 94 | 1.6% |
| Spanish | 188 | 3.2% |
| Sri Lankan | 236 | 4.0% |
| Subsaharan African | 46 | 0.8% |
| Swedish | 46 | 0.8% |
| Thai | 106 | 1.8% |
| Welsh | 6 | 0.1% | View All 57 Rows |
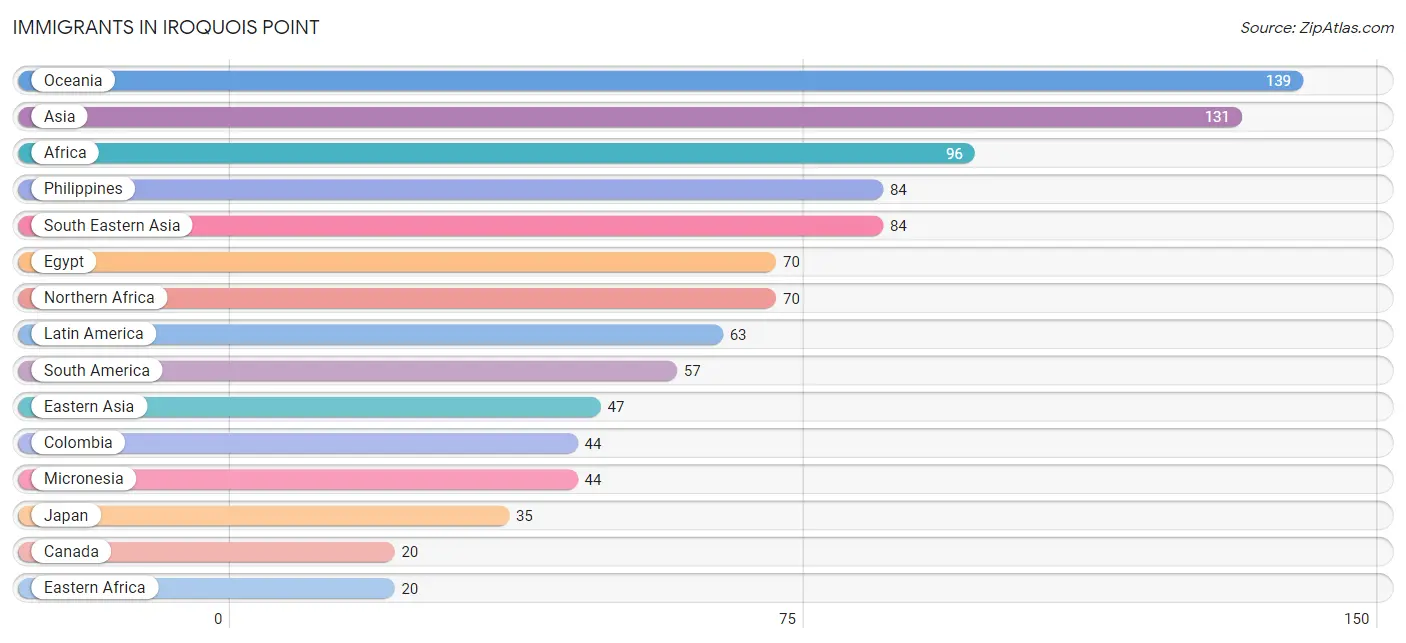
Immigrants in Iroquois Point
The most numerous immigrant groups reported in Iroquois Point came from Oceania (139 | 2.4%), Asia (131 | 2.2%), Africa (96 | 1.6%), Philippines (84 | 1.4%), and South Eastern Asia (84 | 1.4%), together accounting for 9.0% of all Iroquois Point residents.
| Immigration Origin | # Population | % Population |
| Africa | 96 | 1.6% |
| Asia | 131 | 2.2% |
| Bolivia | 13 | 0.2% |
| Canada | 20 | 0.3% |
| Caribbean | 6 | 0.1% |
| China | 12 | 0.2% |
| Colombia | 44 | 0.7% |
| Eastern Africa | 20 | 0.3% |
| Eastern Asia | 47 | 0.8% |
| Eastern Europe | 9 | 0.2% |
| Egypt | 70 | 1.2% |
| Europe | 16 | 0.3% |
| Germany | 7 | 0.1% |
| Jamaica | 6 | 0.1% |
| Japan | 35 | 0.6% |
| Kenya | 10 | 0.2% |
| Latin America | 63 | 1.1% |
| Micronesia | 44 | 0.7% |
| Northern Africa | 70 | 1.2% |
| Oceania | 139 | 2.4% |
| Philippines | 84 | 1.4% |
| Sierra Leone | 6 | 0.1% |
| South America | 57 | 1.0% |
| South Eastern Asia | 84 | 1.4% |
| Western Africa | 6 | 0.1% |
| Western Europe | 7 | 0.1% |
| Zimbabwe | 10 | 0.2% | View All 27 Rows |
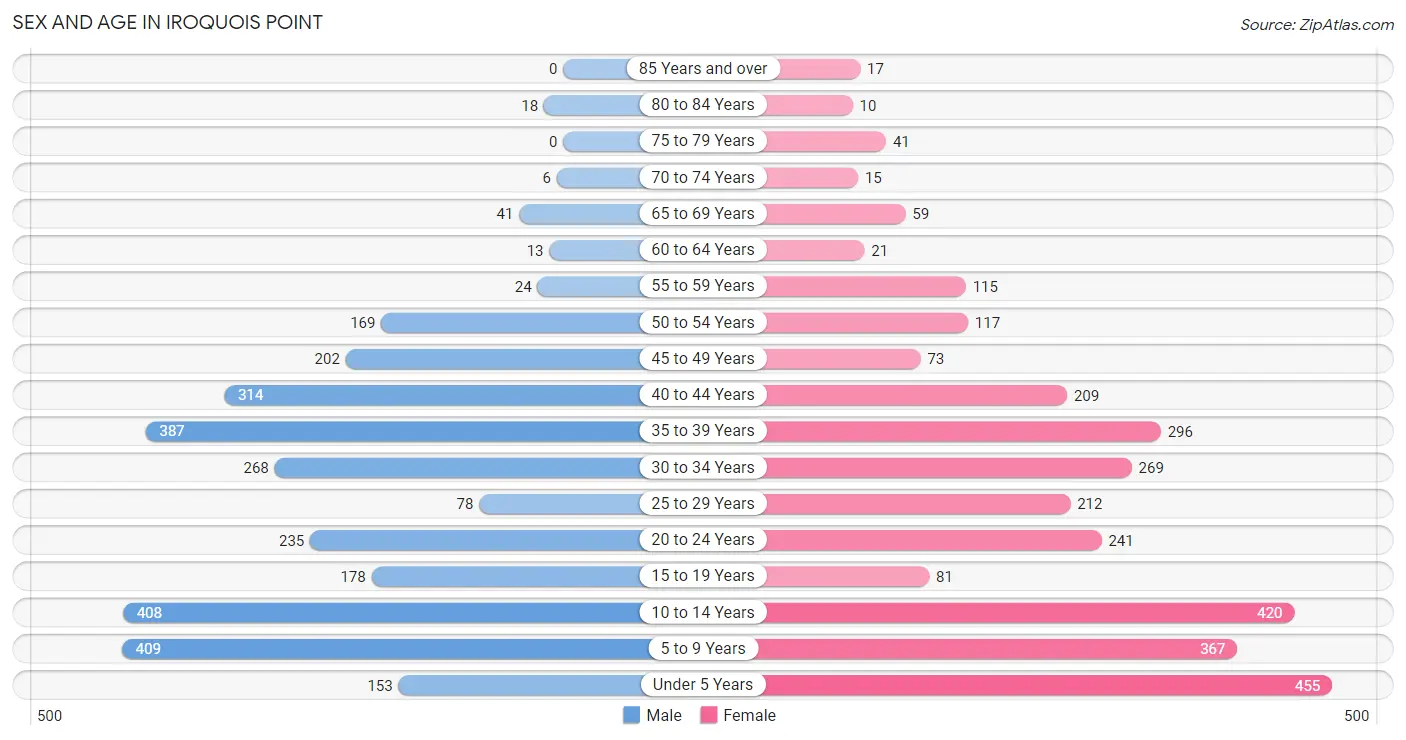
Sex and Age in Iroquois Point
Sex and Age in Iroquois Point
The most populous age groups in Iroquois Point are 5 to 9 Years (409 | 14.1%) for men and Under 5 Years (455 | 15.1%) for women.
| Age Bracket | Male | Female |
| Under 5 Years | 153 (5.3%) | 455 (15.1%) |
| 5 to 9 Years | 409 (14.1%) | 367 (12.2%) |
| 10 to 14 Years | 408 (14.1%) | 420 (13.9%) |
| 15 to 19 Years | 178 (6.1%) | 81 (2.7%) |
| 20 to 24 Years | 235 (8.1%) | 241 (8.0%) |
| 25 to 29 Years | 78 (2.7%) | 212 (7.0%) |
| 30 to 34 Years | 268 (9.2%) | 269 (8.9%) |
| 35 to 39 Years | 387 (13.3%) | 296 (9.8%) |
| 40 to 44 Years | 314 (10.8%) | 209 (6.9%) |
| 45 to 49 Years | 202 (7.0%) | 73 (2.4%) |
| 50 to 54 Years | 169 (5.8%) | 117 (3.9%) |
| 55 to 59 Years | 24 (0.8%) | 115 (3.8%) |
| 60 to 64 Years | 13 (0.4%) | 21 (0.7%) |
| 65 to 69 Years | 41 (1.4%) | 59 (1.9%) |
| 70 to 74 Years | 6 (0.2%) | 15 (0.5%) |
| 75 to 79 Years | 0 (0.0%) | 41 (1.4%) |
| 80 to 84 Years | 18 (0.6%) | 10 (0.3%) |
| 85 Years and over | 0 (0.0%) | 17 (0.6%) |
| Total | 2,903 (100.0%) | 3,018 (100.0%) |
Families and Households in Iroquois Point
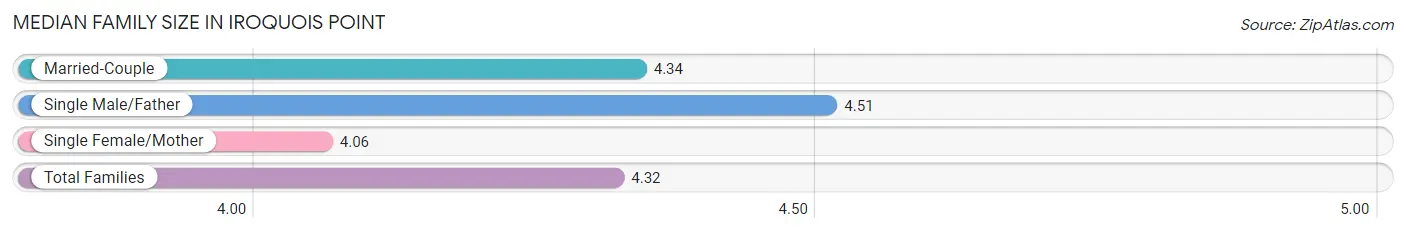
Median Family Size in Iroquois Point
The median family size in Iroquois Point is 4.32 persons per family, with single male/father families (136 | 11.4%) accounting for the largest median family size of 4.51 persons per family. On the other hand, single female/mother families (161 | 13.5%) represent the smallest median family size with 4.06 persons per family.
| Family Type | # Families | Family Size |
| Married-Couple | 900 (75.2%) | 4.34 |
| Single Male/Father | 136 (11.4%) | 4.51 |
| Single Female/Mother | 161 (13.5%) | 4.06 |
| Total Families | 1,197 (100.0%) | 4.32 |
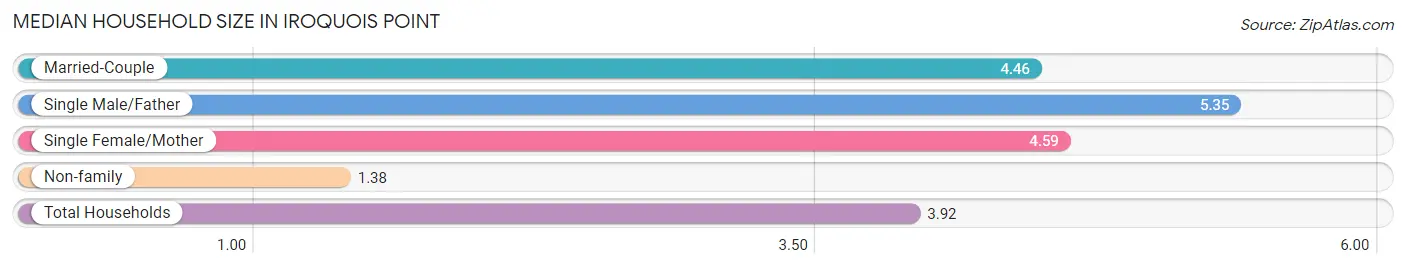
Median Household Size in Iroquois Point
The median household size in Iroquois Point is 3.92 persons per household, with single male/father households (136 | 9.0%) accounting for the largest median household size of 5.35 persons per household. non-family households (314 | 20.8%) represent the smallest median household size with 1.38 persons per household.
| Household Type | # Households | Household Size |
| Married-Couple | 900 (59.6%) | 4.46 |
| Single Male/Father | 136 (9.0%) | 5.35 |
| Single Female/Mother | 161 (10.7%) | 4.59 |
| Non-family | 314 (20.8%) | 1.38 |
| Total Households | 1,511 (100.0%) | 3.92 |
Household Size by Marriage Status in Iroquois Point
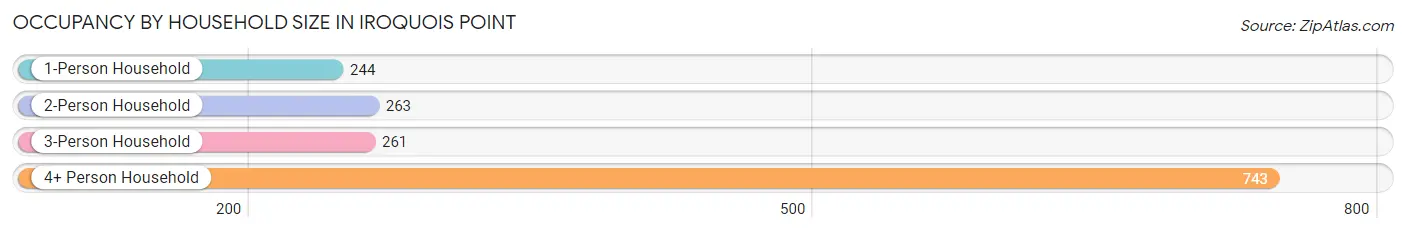
Out of a total of 1,511 households in Iroquois Point, 1,197 (79.2%) are family households, while 314 (20.8%) are nonfamily households. The most numerous type of family households are 4-person households, comprising 294, and the most common type of nonfamily households are 1-person households, comprising 244.
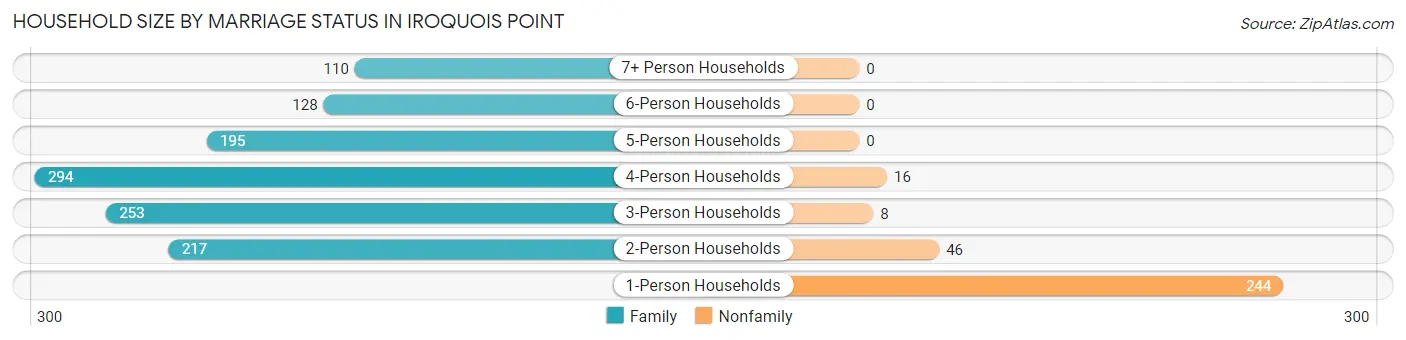
| Household Size | Family Households | Nonfamily Households |
| 1-Person Households | - | 244 (16.2%) |
| 2-Person Households | 217 (14.4%) | 46 (3.0%) |
| 3-Person Households | 253 (16.7%) | 8 (0.5%) |
| 4-Person Households | 294 (19.5%) | 16 (1.1%) |
| 5-Person Households | 195 (12.9%) | 0 (0.0%) |
| 6-Person Households | 128 (8.5%) | 0 (0.0%) |
| 7+ Person Households | 110 (7.3%) | 0 (0.0%) |
| Total | 1,197 (79.2%) | 314 (20.8%) |
Female Fertility in Iroquois Point
Fertility by Age in Iroquois Point
Average fertility rate in Iroquois Point is 92.0 births per 1,000 women. Women in the age bracket of 20 to 34 years have the highest fertility rate with 155.0 births per 1,000 women. Women in the age bracket of 20 to 34 years acount for 86.8% of all women with births.
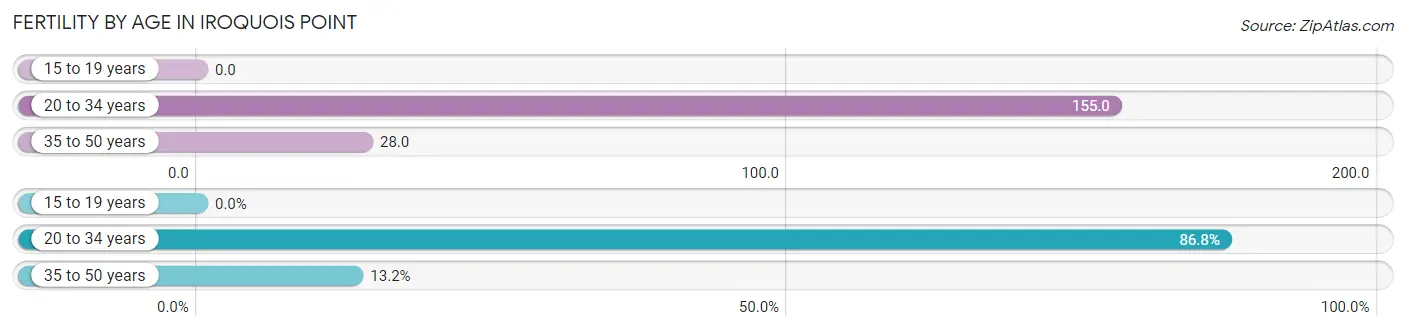
| Age Bracket | Women with Births | Births / 1,000 Women |
| 15 to 19 years | 0 (0.0%) | 0.0 |
| 20 to 34 years | 112 (86.8%) | 155.0 |
| 35 to 50 years | 17 (13.2%) | 28.0 |
| Total | 129 (100.0%) | 92.0 |
Fertility by Age by Marriage Status in Iroquois Point
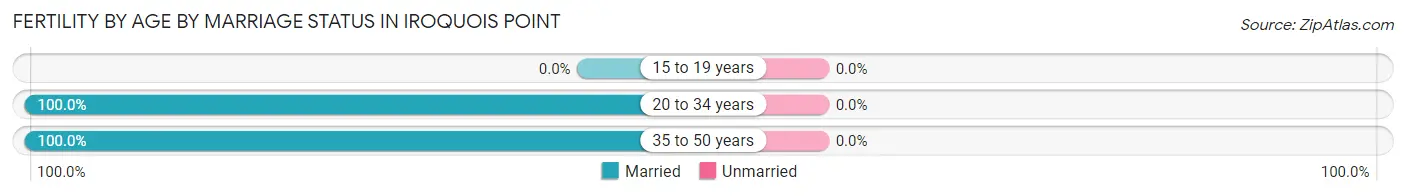
| Age Bracket | Married | Unmarried |
| 15 to 19 years | 0 (0.0%) | 0 (0.0%) |
| 20 to 34 years | 112 (100.0%) | 0 (0.0%) |
| 35 to 50 years | 17 (100.0%) | 0 (0.0%) |
| Total | 129 (100.0%) | 0 (0.0%) |
Fertility by Education in Iroquois Point
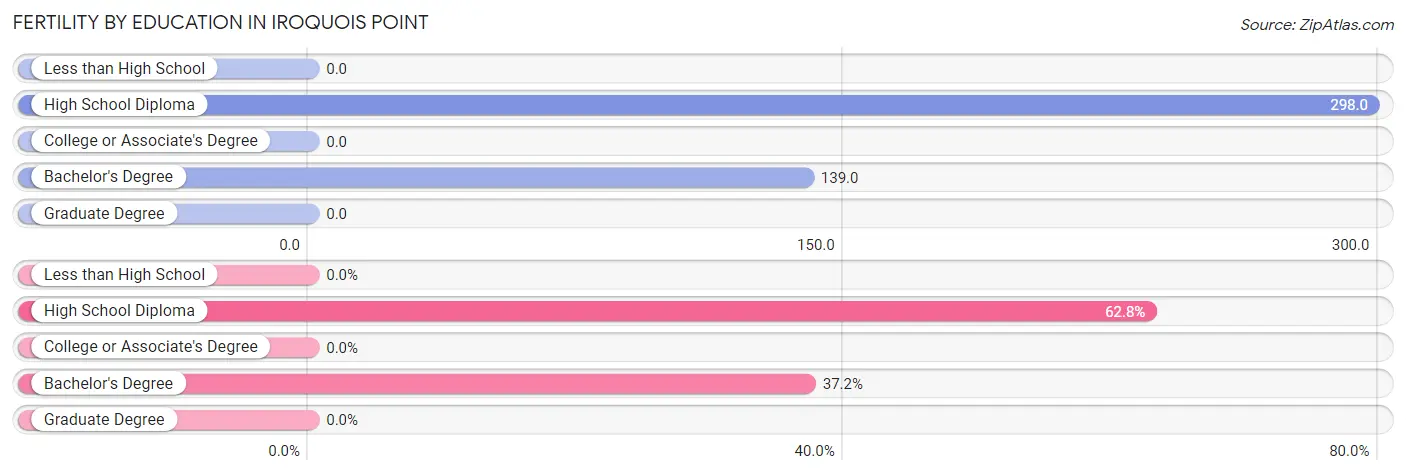
| Educational Attainment | Women with Births | Births / 1,000 Women |
| Less than High School | 0 (0.0%) | 0.0 |
| High School Diploma | 81 (62.8%) | 298.0 |
| College or Associate's Degree | 0 (0.0%) | 0.0 |
| Bachelor's Degree | 48 (37.2%) | 139.0 |
| Graduate Degree | 0 (0.0%) | 0.0 |
| Total | 129 (100.0%) | 92.0 |
Fertility by Education by Marriage Status in Iroquois Point
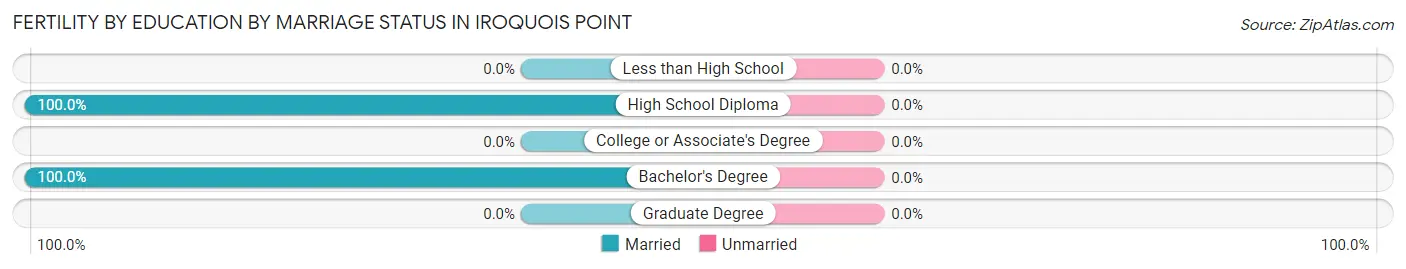
| Educational Attainment | Married | Unmarried |
| Less than High School | 0 (0.0%) | 0 (0.0%) |
| High School Diploma | 81 (100.0%) | 0 (0.0%) |
| College or Associate's Degree | 0 (0.0%) | 0 (0.0%) |
| Bachelor's Degree | 48 (100.0%) | 0 (0.0%) |
| Graduate Degree | 0 (0.0%) | 0 (0.0%) |
| Total | 129 (100.0%) | 0 (0.0%) |
Employment Characteristics in Iroquois Point
Employment by Class of Employer in Iroquois Point
Among the 2,433 employed individuals in Iroquois Point, private company employees (1,208 | 49.6%), federal government employees (822 | 33.8%), and not-for-profit organizations (129 | 5.3%) make up the most common classes of employment.
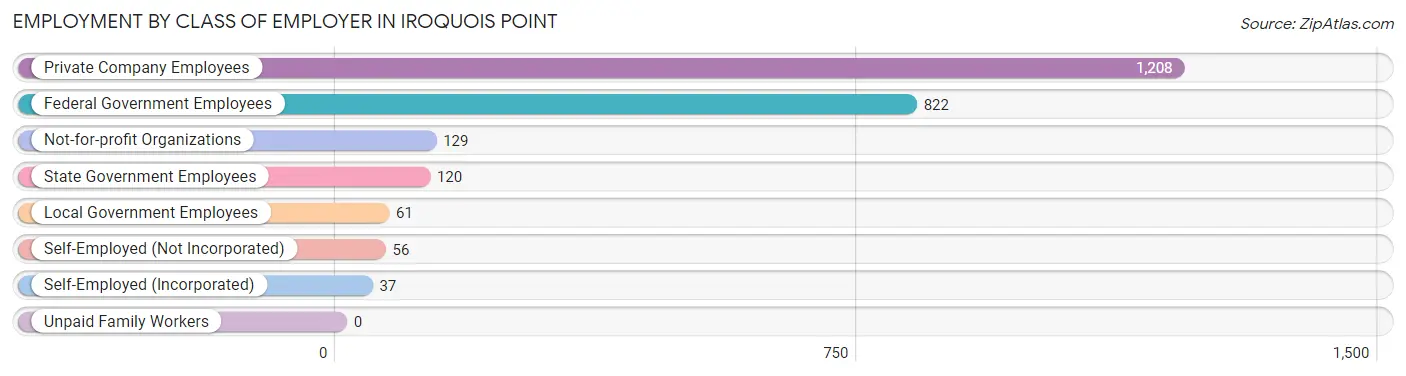
| Employer Class | # Employees | % Employees |
| Private Company Employees | 1,208 | 49.6% |
| Self-Employed (Incorporated) | 37 | 1.5% |
| Self-Employed (Not Incorporated) | 56 | 2.3% |
| Not-for-profit Organizations | 129 | 5.3% |
| Local Government Employees | 61 | 2.5% |
| State Government Employees | 120 | 4.9% |
| Federal Government Employees | 822 | 33.8% |
| Unpaid Family Workers | 0 | 0.0% |
| Total | 2,433 | 100.0% |
Employment Status by Age in Iroquois Point
According to the labor force statistics for Iroquois Point, out of the total population over 16 years of age (3,682), 74.6% or 2,747 individuals are in the labor force, with 9.0% or 247 of them unemployed. The age group with the highest labor force participation rate is 60 to 64 years, with 100.0% or 34 individuals in the labor force. Within the labor force, the 65 to 74 years age range has the highest percentage of unemployed individuals, with 41.4% or 12 of them being unemployed.
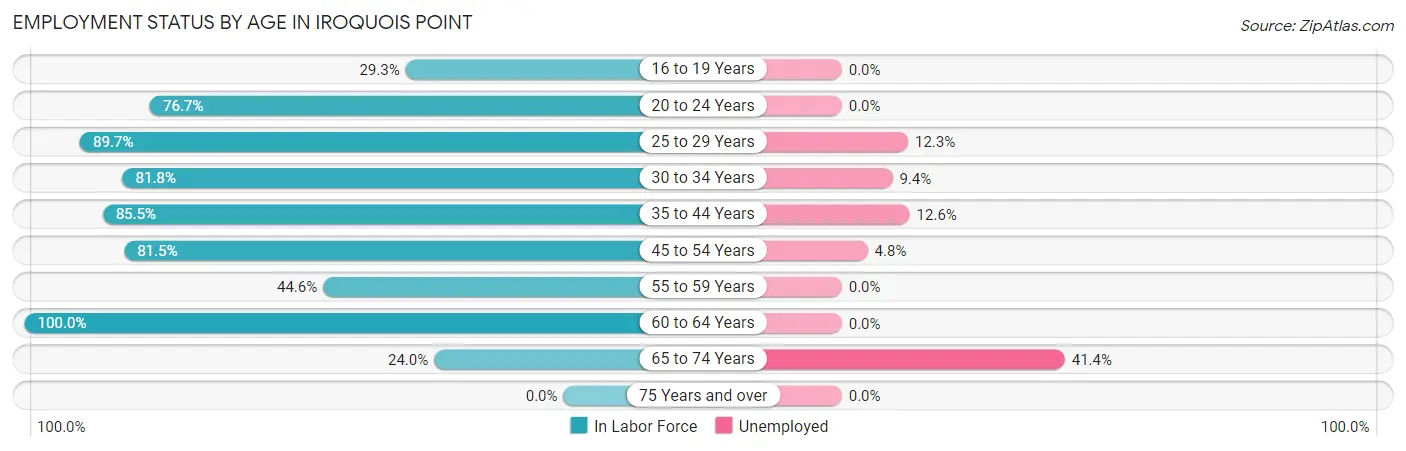
| Age Bracket | In Labor Force | Unemployed |
| 16 to 19 Years | 68 (29.3%) | 0 (0.0%) |
| 20 to 24 Years | 365 (76.7%) | 0 (0.0%) |
| 25 to 29 Years | 260 (89.7%) | 32 (12.3%) |
| 30 to 34 Years | 439 (81.8%) | 41 (9.4%) |
| 35 to 44 Years | 1,031 (85.5%) | 130 (12.6%) |
| 45 to 54 Years | 457 (81.5%) | 22 (4.8%) |
| 55 to 59 Years | 62 (44.6%) | 0 (0.0%) |
| 60 to 64 Years | 34 (100.0%) | 0 (0.0%) |
| 65 to 74 Years | 29 (24.0%) | 12 (41.4%) |
| 75 Years and over | 0 (0.0%) | 0 (0.0%) |
| Total | 2,747 (74.6%) | 247 (9.0%) |
Employment Status by Educational Attainment in Iroquois Point
According to labor force statistics for Iroquois Point, 82.5% of individuals (2,283) out of the total population between 25 and 64 years of age (2,767) are in the labor force, with 9.8% or 224 of them being unemployed. The group with the highest labor force participation rate are those with the educational attainment of bachelor's degree or higher, with 89.3% or 926 individuals in the labor force. Within the labor force, individuals with less than high school education have the highest percentage of unemployment, with 13.8% or 9 of them being unemployed.
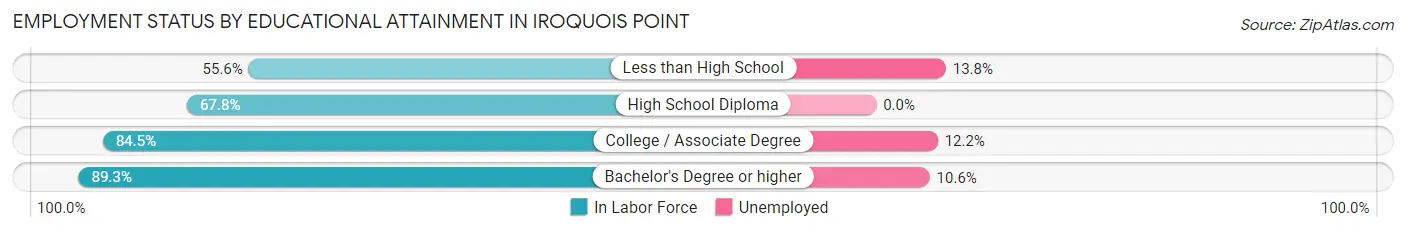
| Educational Attainment | In Labor Force | Unemployed |
| Less than High School | 65 (55.6%) | 16 (13.8%) |
| High School Diploma | 291 (67.8%) | 0 (0.0%) |
| College / Associate Degree | 1,000 (84.5%) | 144 (12.2%) |
| Bachelor's Degree or higher | 926 (89.3%) | 110 (10.6%) |
| Total | 2,283 (82.5%) | 271 (9.8%) |
Employment Occupations by Sex in Iroquois Point
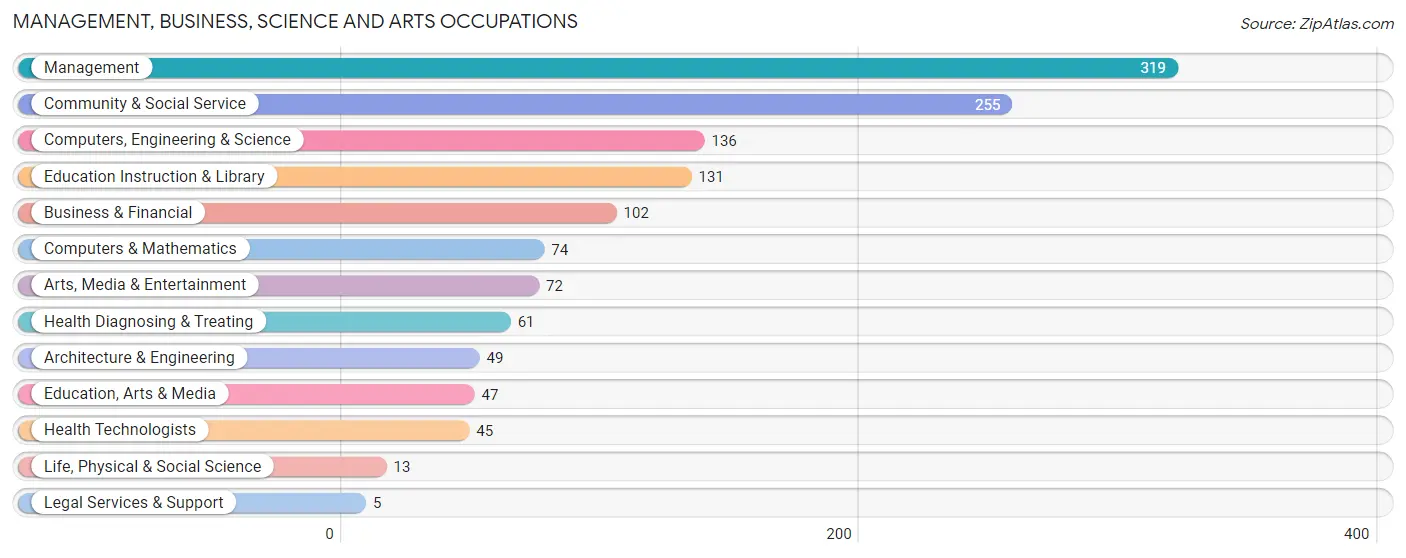
Management, Business, Science and Arts Occupations
The most common Management, Business, Science and Arts occupations in Iroquois Point are Management (319 | 15.5%), Community & Social Service (255 | 12.4%), Computers, Engineering & Science (136 | 6.6%), Education Instruction & Library (131 | 6.4%), and Business & Financial (102 | 5.0%).
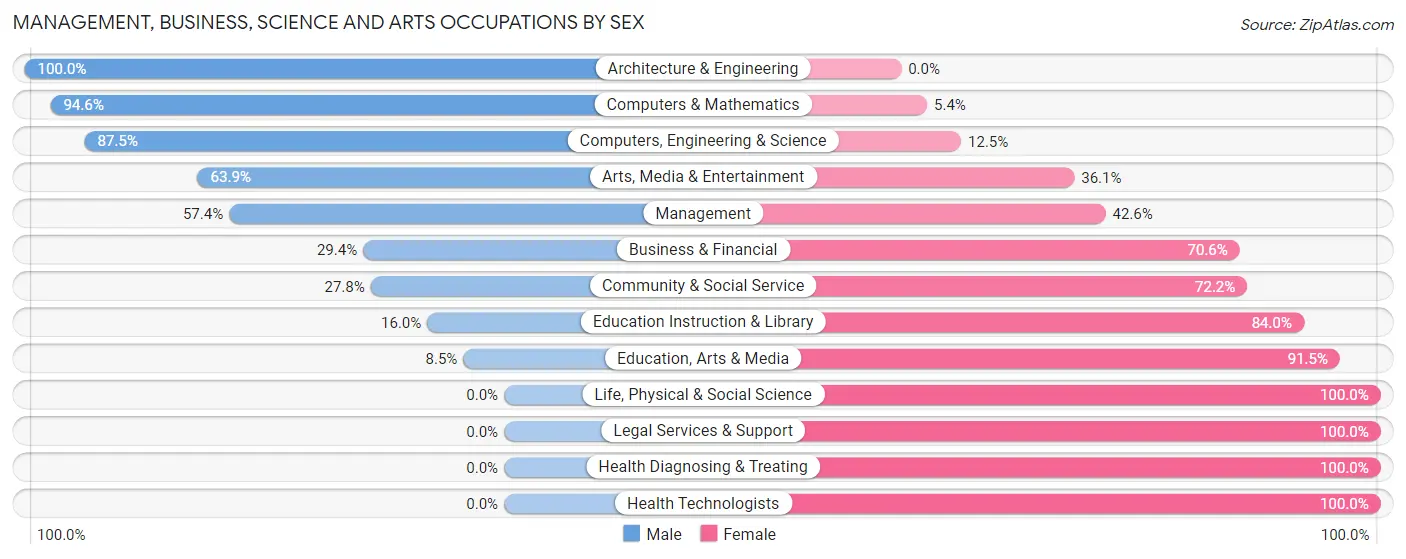
Management, Business, Science and Arts Occupations by Sex
Within the Management, Business, Science and Arts occupations in Iroquois Point, the most male-oriented occupations are Architecture & Engineering (100.0%), Computers & Mathematics (94.6%), and Computers, Engineering & Science (87.5%), while the most female-oriented occupations are Life, Physical & Social Science (100.0%), Legal Services & Support (100.0%), and Health Diagnosing & Treating (100.0%).
| Occupation | Male | Female |
| Management | 183 (57.4%) | 136 (42.6%) |
| Business & Financial | 30 (29.4%) | 72 (70.6%) |
| Computers, Engineering & Science | 119 (87.5%) | 17 (12.5%) |
| Computers & Mathematics | 70 (94.6%) | 4 (5.4%) |
| Architecture & Engineering | 49 (100.0%) | 0 (0.0%) |
| Life, Physical & Social Science | 0 (0.0%) | 13 (100.0%) |
| Community & Social Service | 71 (27.8%) | 184 (72.2%) |
| Education, Arts & Media | 4 (8.5%) | 43 (91.5%) |
| Legal Services & Support | 0 (0.0%) | 5 (100.0%) |
| Education Instruction & Library | 21 (16.0%) | 110 (84.0%) |
| Arts, Media & Entertainment | 46 (63.9%) | 26 (36.1%) |
| Health Diagnosing & Treating | 0 (0.0%) | 61 (100.0%) |
| Health Technologists | 0 (0.0%) | 45 (100.0%) |
| Total (Category) | 403 (46.2%) | 470 (53.8%) |
| Total (Overall) | 1,135 (55.3%) | 919 (44.7%) |
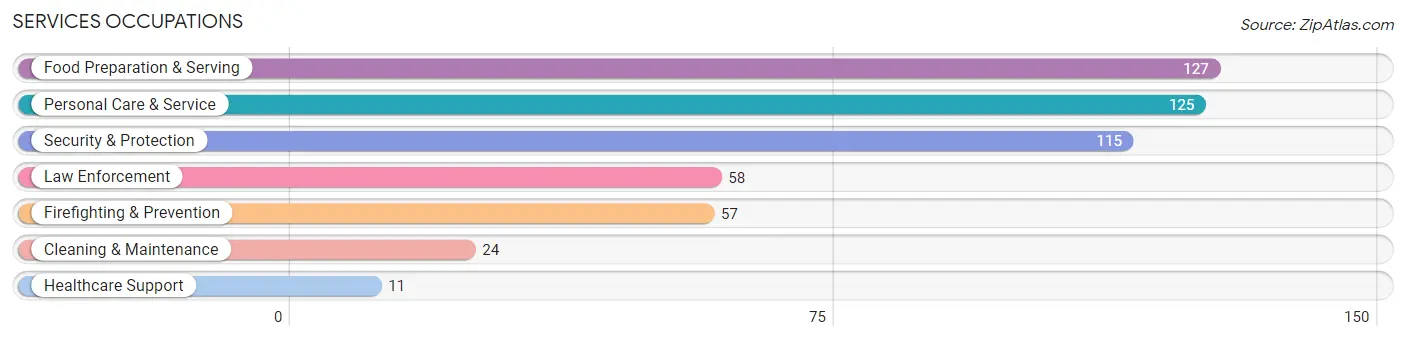
Services Occupations
The most common Services occupations in Iroquois Point are Food Preparation & Serving (127 | 6.2%), Personal Care & Service (125 | 6.1%), Security & Protection (115 | 5.6%), Law Enforcement (58 | 2.8%), and Firefighting & Prevention (57 | 2.8%).
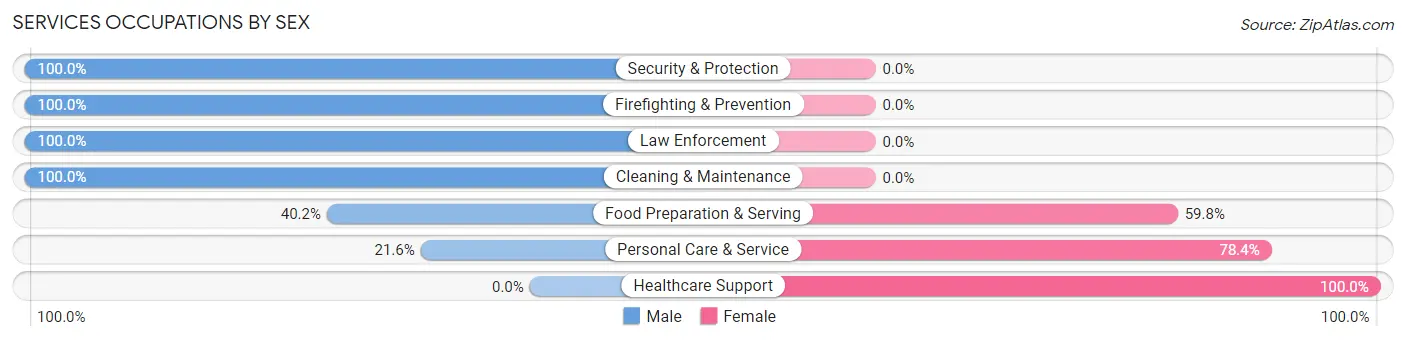
Services Occupations by Sex
Within the Services occupations in Iroquois Point, the most male-oriented occupations are Security & Protection (100.0%), Firefighting & Prevention (100.0%), and Law Enforcement (100.0%), while the most female-oriented occupations are Healthcare Support (100.0%), Personal Care & Service (78.4%), and Food Preparation & Serving (59.8%).
| Occupation | Male | Female |
| Healthcare Support | 0 (0.0%) | 11 (100.0%) |
| Security & Protection | 115 (100.0%) | 0 (0.0%) |
| Firefighting & Prevention | 57 (100.0%) | 0 (0.0%) |
| Law Enforcement | 58 (100.0%) | 0 (0.0%) |
| Food Preparation & Serving | 51 (40.2%) | 76 (59.8%) |
| Cleaning & Maintenance | 24 (100.0%) | 0 (0.0%) |
| Personal Care & Service | 27 (21.6%) | 98 (78.4%) |
| Total (Category) | 217 (54.0%) | 185 (46.0%) |
| Total (Overall) | 1,135 (55.3%) | 919 (44.7%) |
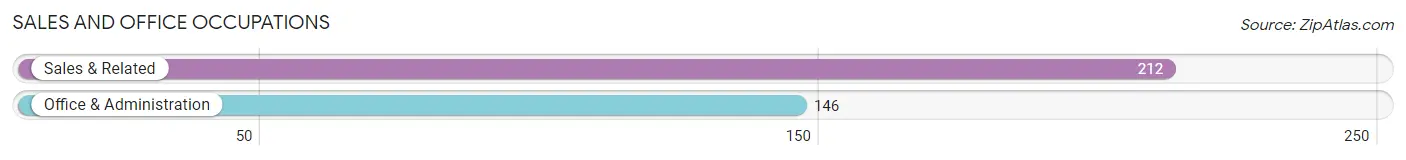
Sales and Office Occupations
The most common Sales and Office occupations in Iroquois Point are Sales & Related (212 | 10.3%), and Office & Administration (146 | 7.1%).
Sales and Office Occupations by Sex
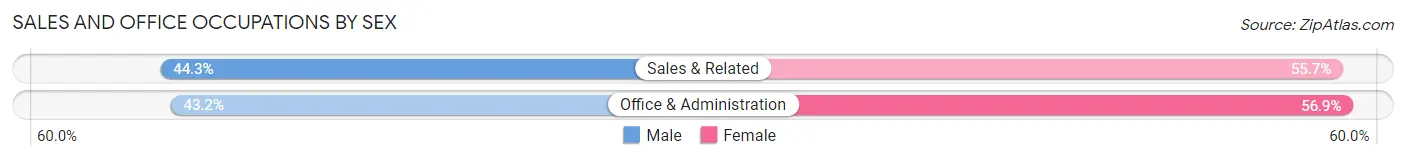
| Occupation | Male | Female |
| Sales & Related | 94 (44.3%) | 118 (55.7%) |
| Office & Administration | 63 (43.1%) | 83 (56.9%) |
| Total (Category) | 157 (43.9%) | 201 (56.1%) |
| Total (Overall) | 1,135 (55.3%) | 919 (44.7%) |
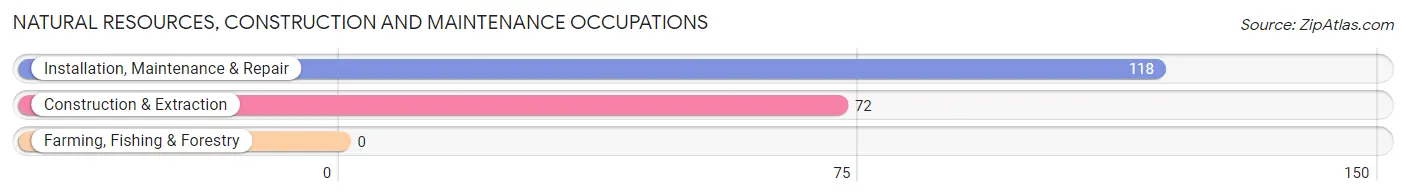
Natural Resources, Construction and Maintenance Occupations
The most common Natural Resources, Construction and Maintenance occupations in Iroquois Point are Installation, Maintenance & Repair (118 | 5.7%), and Construction & Extraction (72 | 3.5%).
Natural Resources, Construction and Maintenance Occupations by Sex
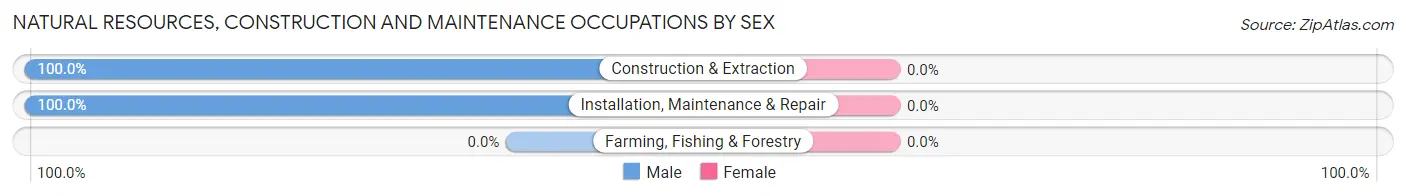
| Occupation | Male | Female |
| Farming, Fishing & Forestry | 0 (0.0%) | 0 (0.0%) |
| Construction & Extraction | 72 (100.0%) | 0 (0.0%) |
| Installation, Maintenance & Repair | 118 (100.0%) | 0 (0.0%) |
| Total (Category) | 190 (100.0%) | 0 (0.0%) |
| Total (Overall) | 1,135 (55.3%) | 919 (44.7%) |
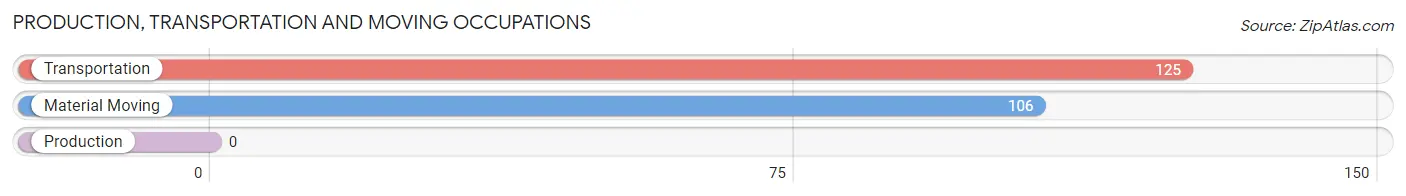
Production, Transportation and Moving Occupations
The most common Production, Transportation and Moving occupations in Iroquois Point are Transportation (125 | 6.1%), and Material Moving (106 | 5.2%).
Production, Transportation and Moving Occupations by Sex
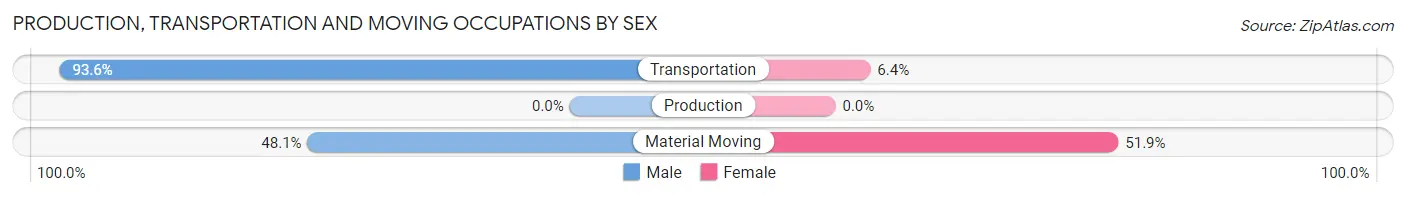
| Occupation | Male | Female |
| Production | 0 (0.0%) | 0 (0.0%) |
| Transportation | 117 (93.6%) | 8 (6.4%) |
| Material Moving | 51 (48.1%) | 55 (51.9%) |
| Total (Category) | 168 (72.7%) | 63 (27.3%) |
| Total (Overall) | 1,135 (55.3%) | 919 (44.7%) |
Employment Industries by Sex in Iroquois Point
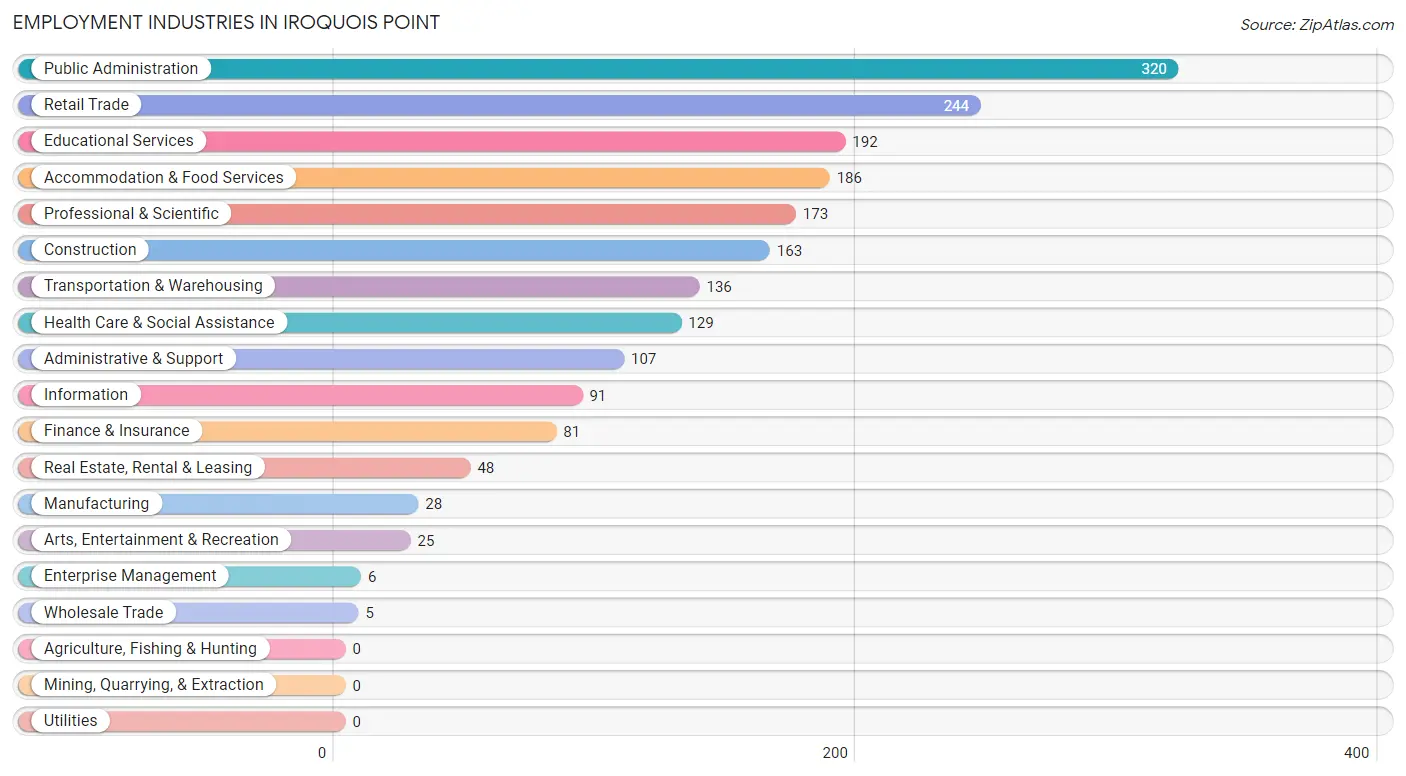
Employment Industries in Iroquois Point
The major employment industries in Iroquois Point include Public Administration (320 | 15.6%), Retail Trade (244 | 11.9%), Educational Services (192 | 9.3%), Accommodation & Food Services (186 | 9.1%), and Professional & Scientific (173 | 8.4%).
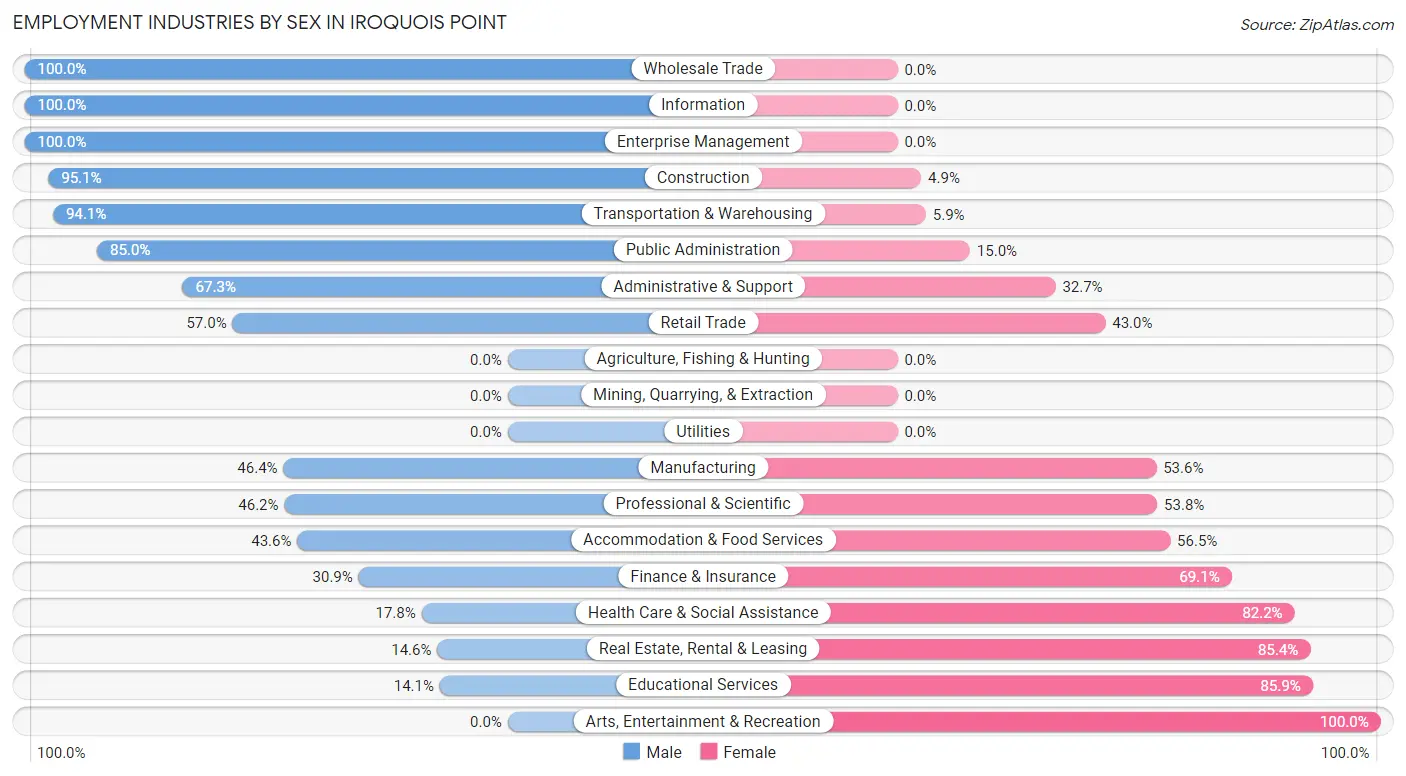
Employment Industries by Sex in Iroquois Point
The Iroquois Point industries that see more men than women are Wholesale Trade (100.0%), Information (100.0%), and Enterprise Management (100.0%), whereas the industries that tend to have a higher number of women are Arts, Entertainment & Recreation (100.0%), Educational Services (85.9%), and Real Estate, Rental & Leasing (85.4%).
| Industry | Male | Female |
| Agriculture, Fishing & Hunting | 0 (0.0%) | 0 (0.0%) |
| Mining, Quarrying, & Extraction | 0 (0.0%) | 0 (0.0%) |
| Construction | 155 (95.1%) | 8 (4.9%) |
| Manufacturing | 13 (46.4%) | 15 (53.6%) |
| Wholesale Trade | 5 (100.0%) | 0 (0.0%) |
| Retail Trade | 139 (57.0%) | 105 (43.0%) |
| Transportation & Warehousing | 128 (94.1%) | 8 (5.9%) |
| Utilities | 0 (0.0%) | 0 (0.0%) |
| Information | 91 (100.0%) | 0 (0.0%) |
| Finance & Insurance | 25 (30.9%) | 56 (69.1%) |
| Real Estate, Rental & Leasing | 7 (14.6%) | 41 (85.4%) |
| Professional & Scientific | 80 (46.2%) | 93 (53.8%) |
| Enterprise Management | 6 (100.0%) | 0 (0.0%) |
| Administrative & Support | 72 (67.3%) | 35 (32.7%) |
| Educational Services | 27 (14.1%) | 165 (85.9%) |
| Health Care & Social Assistance | 23 (17.8%) | 106 (82.2%) |
| Arts, Entertainment & Recreation | 0 (0.0%) | 25 (100.0%) |
| Accommodation & Food Services | 81 (43.5%) | 105 (56.5%) |
| Public Administration | 272 (85.0%) | 48 (15.0%) |
| Total | 1,135 (55.3%) | 919 (44.7%) |
Education in Iroquois Point
School Enrollment in Iroquois Point
The most common levels of schooling among the 2,204 students in Iroquois Point are middle school (688 | 31.2%), elementary school (599 | 27.2%), and college / undergraduate (267 | 12.1%).
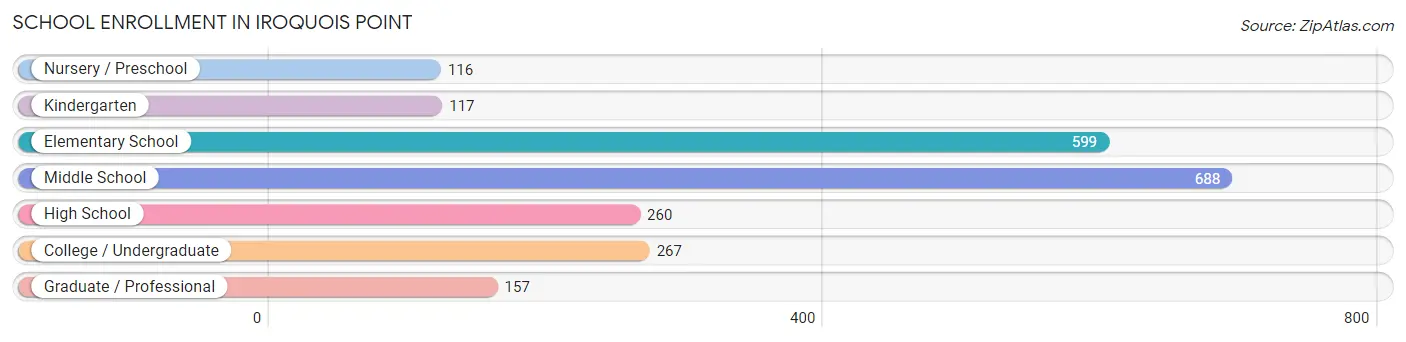
| School Level | # Students | % Students |
| Nursery / Preschool | 116 | 5.3% |
| Kindergarten | 117 | 5.3% |
| Elementary School | 599 | 27.2% |
| Middle School | 688 | 31.2% |
| High School | 260 | 11.8% |
| College / Undergraduate | 267 | 12.1% |
| Graduate / Professional | 157 | 7.1% |
| Total | 2,204 | 100.0% |
School Enrollment by Age by Funding Source in Iroquois Point
Out of a total of 2,204 students who are enrolled in schools in Iroquois Point, 390 (17.7%) attend a private institution, while the remaining 1,814 (82.3%) are enrolled in public schools. The age group of 20 to 24 year olds has the highest likelihood of being enrolled in private schools, with 67 (54.0% in the age bracket) enrolled. Conversely, the age group of 18 to 19 year olds has the lowest likelihood of being enrolled in a private school, with 7 (100.0% in the age bracket) attending a public institution.
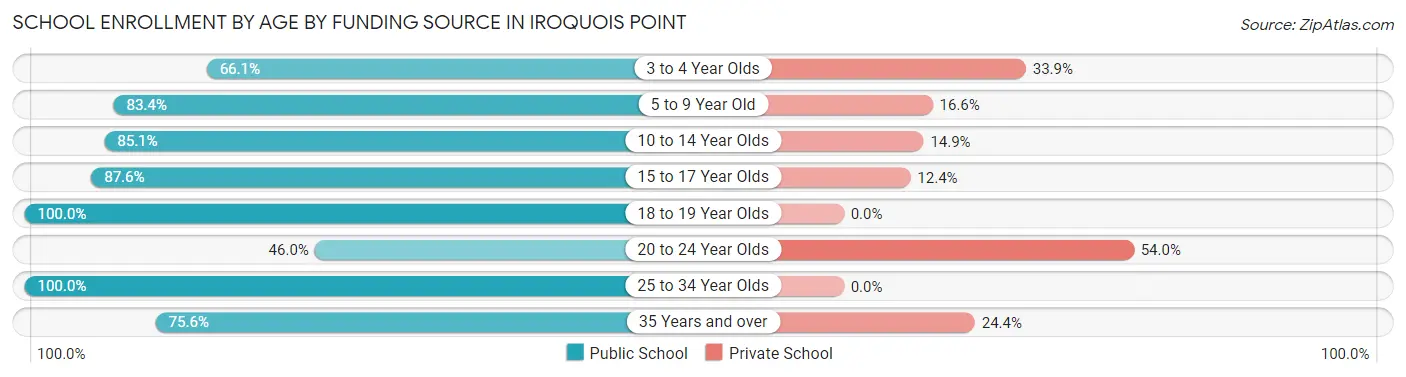
| Age Bracket | Public School | Private School |
| 3 to 4 Year Olds | 37 (66.1%) | 19 (33.9%) |
| 5 to 9 Year Old | 594 (83.4%) | 118 (16.6%) |
| 10 to 14 Year Olds | 705 (85.1%) | 123 (14.9%) |
| 15 to 17 Year Olds | 148 (87.6%) | 21 (12.4%) |
| 18 to 19 Year Olds | 7 (100.0%) | 0 (0.0%) |
| 20 to 24 Year Olds | 57 (46.0%) | 67 (54.0%) |
| 25 to 34 Year Olds | 136 (100.0%) | 0 (0.0%) |
| 35 Years and over | 130 (75.6%) | 42 (24.4%) |
| Total | 1,814 (82.3%) | 390 (17.7%) |
Educational Attainment by Field of Study in Iroquois Point
Business (262 | 23.4%), science & technology (177 | 15.8%), social sciences (125 | 11.1%), arts & humanities (109 | 9.7%), and education (63 | 5.6%) are the most common fields of study among 1,122 individuals in Iroquois Point who have obtained a bachelor's degree or higher.
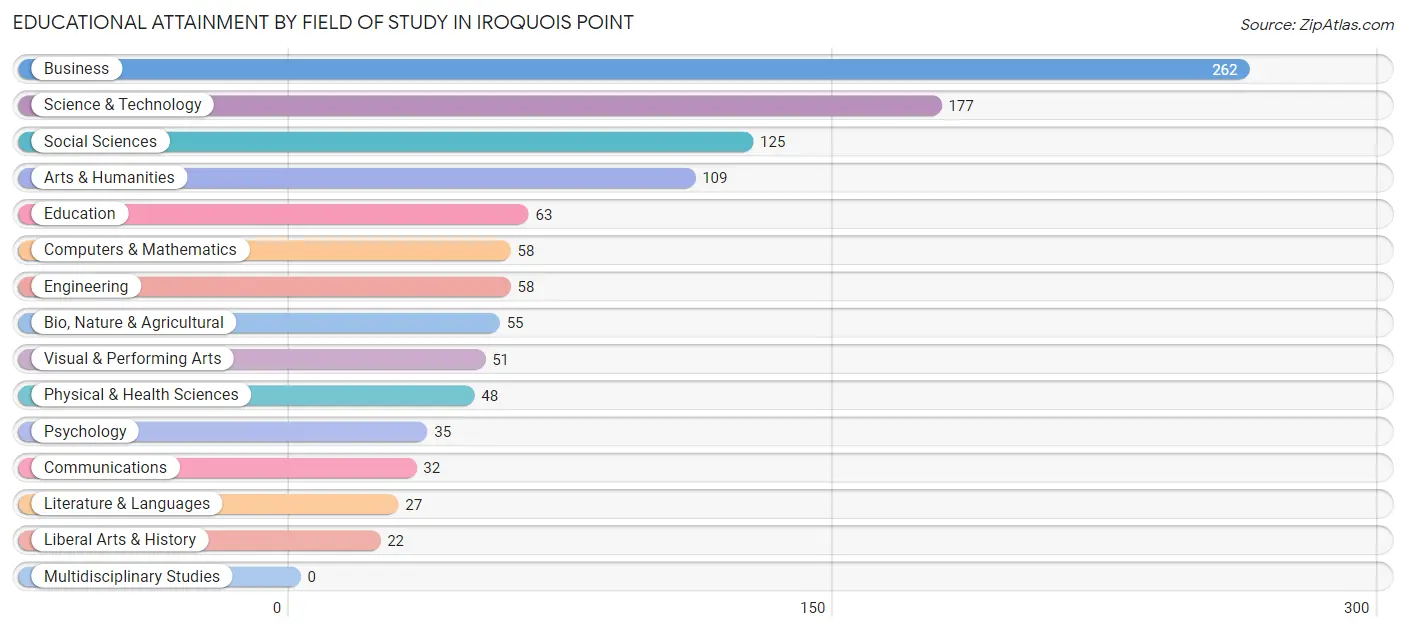
| Field of Study | # Graduates | % Graduates |
| Computers & Mathematics | 58 | 5.2% |
| Bio, Nature & Agricultural | 55 | 4.9% |
| Physical & Health Sciences | 48 | 4.3% |
| Psychology | 35 | 3.1% |
| Social Sciences | 125 | 11.1% |
| Engineering | 58 | 5.2% |
| Multidisciplinary Studies | 0 | 0.0% |
| Science & Technology | 177 | 15.8% |
| Business | 262 | 23.4% |
| Education | 63 | 5.6% |
| Literature & Languages | 27 | 2.4% |
| Liberal Arts & History | 22 | 2.0% |
| Visual & Performing Arts | 51 | 4.5% |
| Communications | 32 | 2.9% |
| Arts & Humanities | 109 | 9.7% |
| Total | 1,122 | 100.0% |
Transportation & Commute in Iroquois Point
Vehicle Availability by Sex in Iroquois Point
The most prevalent vehicle ownership categories in Iroquois Point are males with 2 vehicles (813, accounting for 52.5%) and females with 2 vehicles (477, making up 92.0%).
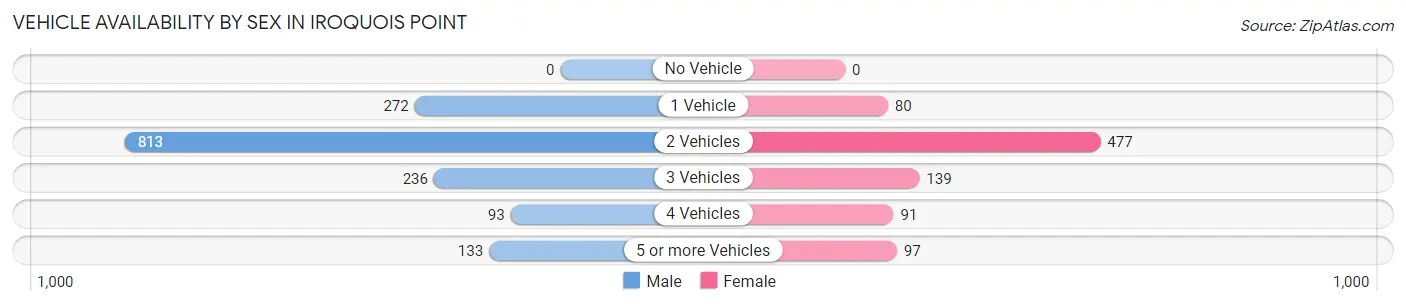
| Vehicles Available | Male | Female |
| No Vehicle | 0 (0.0%) | 0 (0.0%) |
| 1 Vehicle | 272 (17.6%) | 80 (9.0%) |
| 2 Vehicles | 813 (52.5%) | 477 (54.0%) |
| 3 Vehicles | 236 (15.3%) | 139 (15.7%) |
| 4 Vehicles | 93 (6.0%) | 91 (10.3%) |
| 5 or more Vehicles | 133 (8.6%) | 97 (11.0%) |
| Total | 1,547 (100.0%) | 884 (100.0%) |
Commute Time in Iroquois Point
The most frequently occuring commute durations in Iroquois Point are 30 to 34 minutes (627 commuters, 27.4%), 60 to 89 minutes (398 commuters, 17.4%), and 45 to 59 minutes (291 commuters, 12.7%).
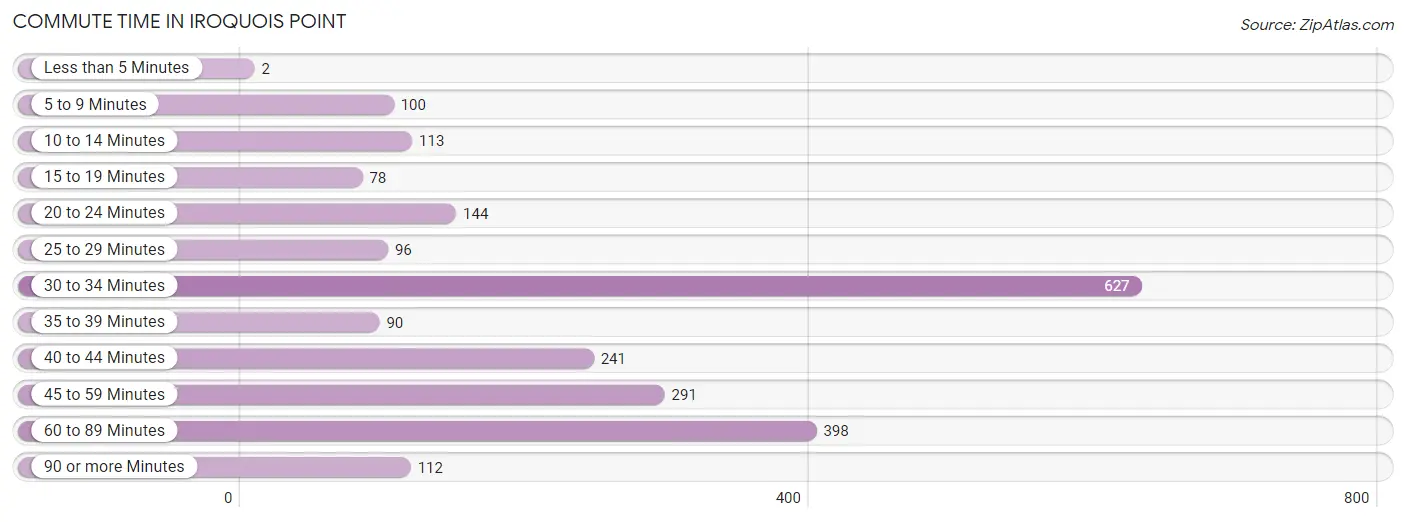
| Commute Time | # Commuters | % Commuters |
| Less than 5 Minutes | 2 | 0.1% |
| 5 to 9 Minutes | 100 | 4.4% |
| 10 to 14 Minutes | 113 | 4.9% |
| 15 to 19 Minutes | 78 | 3.4% |
| 20 to 24 Minutes | 144 | 6.3% |
| 25 to 29 Minutes | 96 | 4.2% |
| 30 to 34 Minutes | 627 | 27.4% |
| 35 to 39 Minutes | 90 | 3.9% |
| 40 to 44 Minutes | 241 | 10.5% |
| 45 to 59 Minutes | 291 | 12.7% |
| 60 to 89 Minutes | 398 | 17.4% |
| 90 or more Minutes | 112 | 4.9% |
Commute Time by Sex in Iroquois Point
The most common commute times in Iroquois Point are 30 to 34 minutes (520 commuters, 35.9%) for males and 60 to 89 minutes (216 commuters, 25.6%) for females.
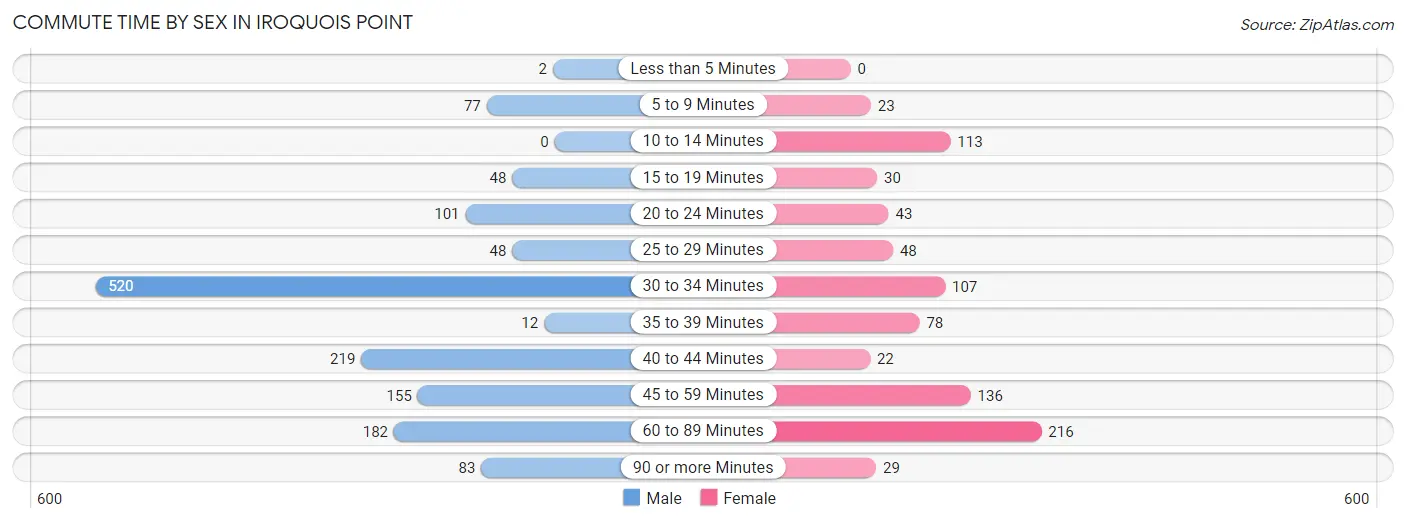
| Commute Time | Male | Female |
| Less than 5 Minutes | 2 (0.1%) | 0 (0.0%) |
| 5 to 9 Minutes | 77 (5.3%) | 23 (2.7%) |
| 10 to 14 Minutes | 0 (0.0%) | 113 (13.4%) |
| 15 to 19 Minutes | 48 (3.3%) | 30 (3.5%) |
| 20 to 24 Minutes | 101 (7.0%) | 43 (5.1%) |
| 25 to 29 Minutes | 48 (3.3%) | 48 (5.7%) |
| 30 to 34 Minutes | 520 (35.9%) | 107 (12.7%) |
| 35 to 39 Minutes | 12 (0.8%) | 78 (9.2%) |
| 40 to 44 Minutes | 219 (15.1%) | 22 (2.6%) |
| 45 to 59 Minutes | 155 (10.7%) | 136 (16.1%) |
| 60 to 89 Minutes | 182 (12.6%) | 216 (25.6%) |
| 90 or more Minutes | 83 (5.7%) | 29 (3.4%) |
Time of Departure to Work by Sex in Iroquois Point
The most frequent times of departure to work in Iroquois Point are 4:00 PM to 11:59 PM (245, 16.9%) for males and 7:00 AM to 7:29 AM (150, 17.7%) for females.
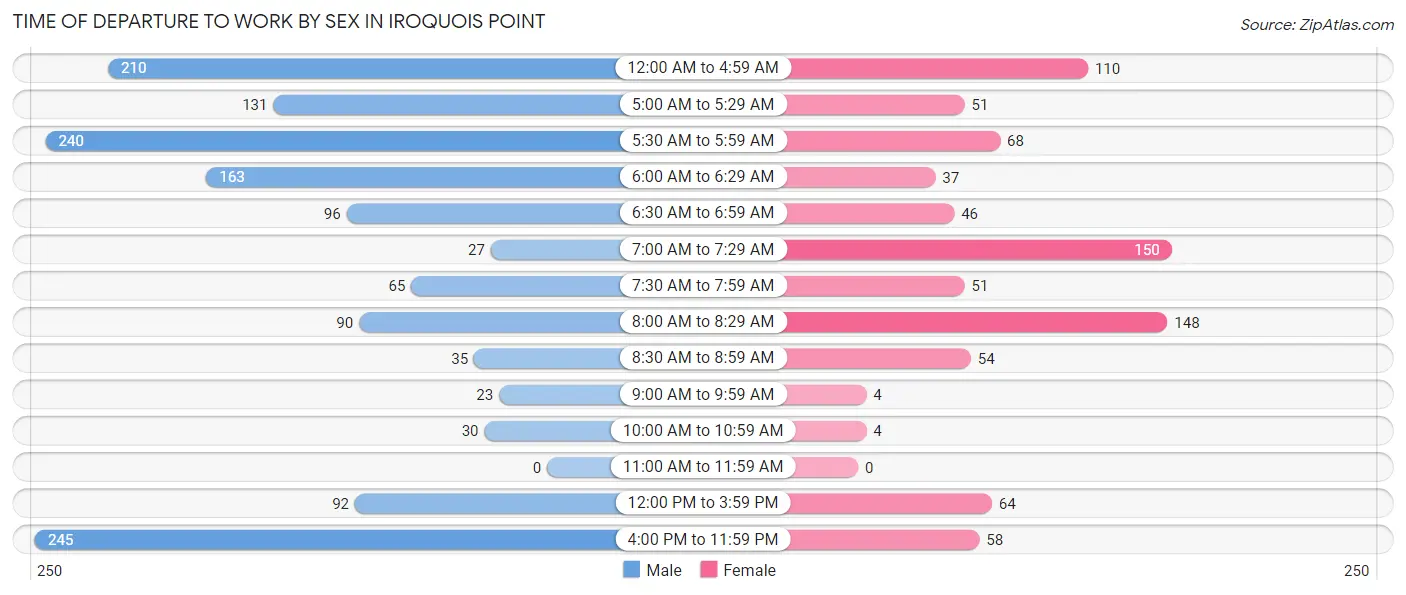
| Time of Departure | Male | Female |
| 12:00 AM to 4:59 AM | 210 (14.5%) | 110 (13.0%) |
| 5:00 AM to 5:29 AM | 131 (9.0%) | 51 (6.0%) |
| 5:30 AM to 5:59 AM | 240 (16.6%) | 68 (8.1%) |
| 6:00 AM to 6:29 AM | 163 (11.3%) | 37 (4.4%) |
| 6:30 AM to 6:59 AM | 96 (6.6%) | 46 (5.4%) |
| 7:00 AM to 7:29 AM | 27 (1.9%) | 150 (17.7%) |
| 7:30 AM to 7:59 AM | 65 (4.5%) | 51 (6.0%) |
| 8:00 AM to 8:29 AM | 90 (6.2%) | 148 (17.5%) |
| 8:30 AM to 8:59 AM | 35 (2.4%) | 54 (6.4%) |
| 9:00 AM to 9:59 AM | 23 (1.6%) | 4 (0.5%) |
| 10:00 AM to 10:59 AM | 30 (2.1%) | 4 (0.5%) |
| 11:00 AM to 11:59 AM | 0 (0.0%) | 0 (0.0%) |
| 12:00 PM to 3:59 PM | 92 (6.4%) | 64 (7.6%) |
| 4:00 PM to 11:59 PM | 245 (16.9%) | 58 (6.9%) |
| Total | 1,447 (100.0%) | 845 (100.0%) |
Housing Occupancy in Iroquois Point
Occupancy by Ownership in Iroquois Point
Of the total 1,511 dwellings in Iroquois Point, owner-occupied units account for 0 (0.0%), while renter-occupied units make up 1,511 (100.0%).
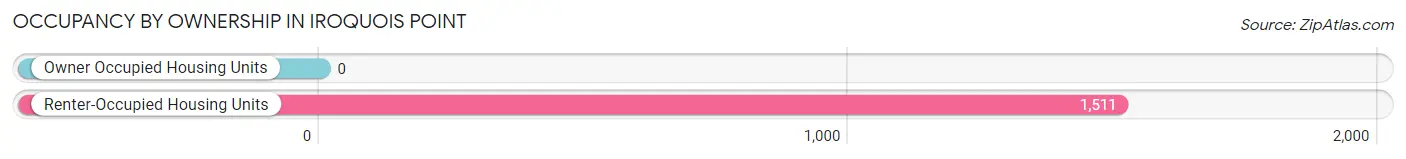
| Occupancy | # Housing Units | % Housing Units |
| Owner Occupied Housing Units | 0 | 0.0% |
| Renter-Occupied Housing Units | 1,511 | 100.0% |
| Total Occupied Housing Units | 1,511 | 100.0% |
Occupancy by Household Size in Iroquois Point
| Household Size | # Housing Units | % Housing Units |
| 1-Person Household | 244 | 16.2% |
| 2-Person Household | 263 | 17.4% |
| 3-Person Household | 261 | 17.3% |
| 4+ Person Household | 743 | 49.2% |
| Total Housing Units | 1,511 | 100.0% |
Occupancy by Ownership by Household Size in Iroquois Point
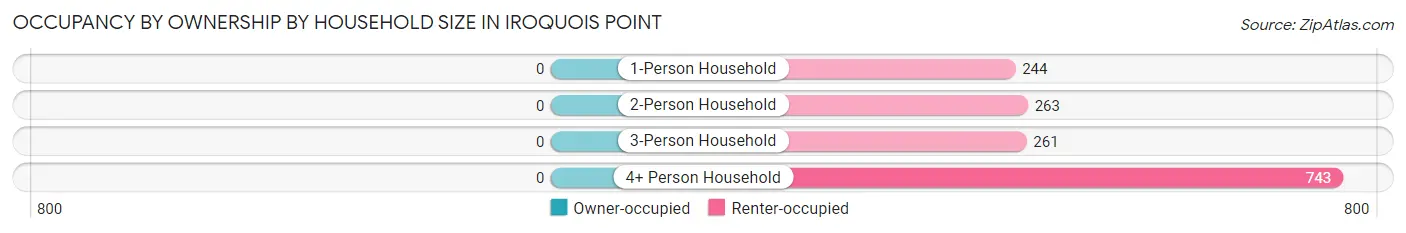
| Household Size | Owner-occupied | Renter-occupied |
| 1-Person Household | 0 (0.0%) | 244 (100.0%) |
| 2-Person Household | 0 (0.0%) | 263 (100.0%) |
| 3-Person Household | 0 (0.0%) | 261 (100.0%) |
| 4+ Person Household | 0 (0.0%) | 743 (100.0%) |
| Total Housing Units | 0 (0.0%) | 1,511 (100.0%) |
Occupancy by Educational Attainment in Iroquois Point
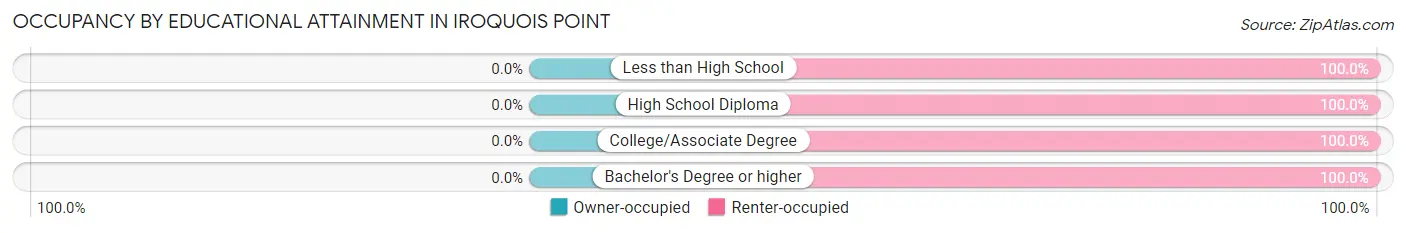
| Household Size | Owner-occupied | Renter-occupied |
| Less than High School | 0 (0.0%) | 50 (100.0%) |
| High School Diploma | 0 (0.0%) | 249 (100.0%) |
| College/Associate Degree | 0 (0.0%) | 564 (100.0%) |
| Bachelor's Degree or higher | 0 (0.0%) | 648 (100.0%) |
Occupancy by Age of Householder in Iroquois Point
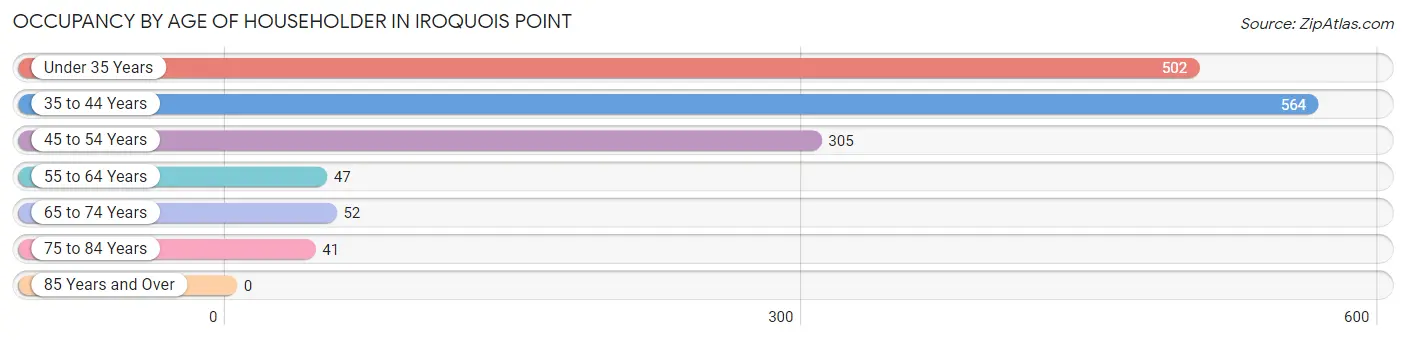
| Age Bracket | # Households | % Households |
| Under 35 Years | 502 | 33.2% |
| 35 to 44 Years | 564 | 37.3% |
| 45 to 54 Years | 305 | 20.2% |
| 55 to 64 Years | 47 | 3.1% |
| 65 to 74 Years | 52 | 3.4% |
| 75 to 84 Years | 41 | 2.7% |
| 85 Years and Over | 0 | 0.0% |
| Total | 1,511 | 100.0% |
Housing Finances in Iroquois Point
Median Income by Occupancy in Iroquois Point
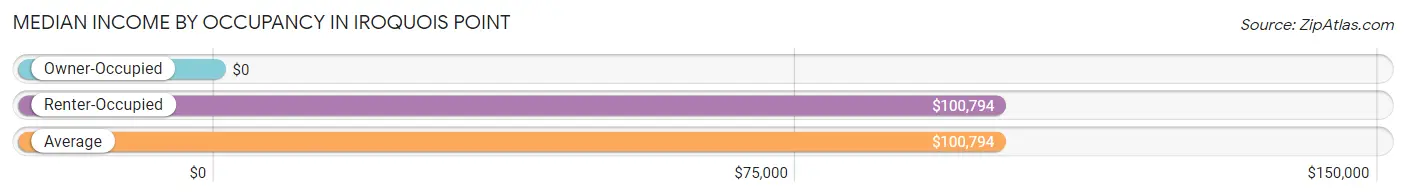
| Occupancy Type | # Households | Median Income |
| Owner-Occupied | 0 (0.0%) | $0 |
| Renter-Occupied | 1,511 (100.0%) | $100,794 |
| Average | 1,511 (100.0%) | $100,794 |
Occupancy by Householder Income Bracket in Iroquois Point
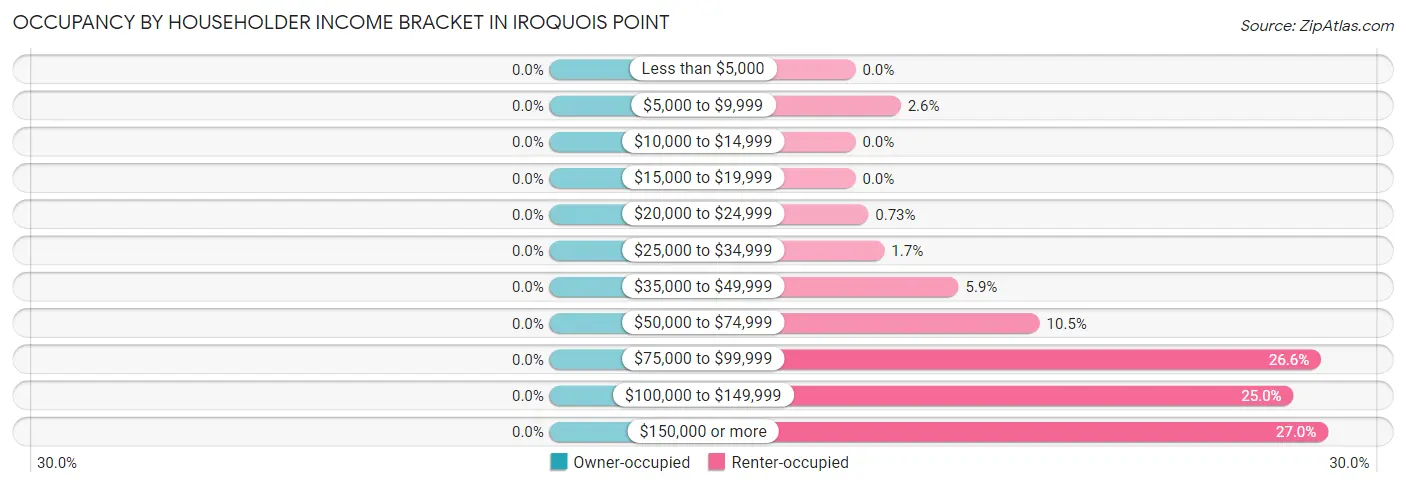
| Income Bracket | Owner-occupied | Renter-occupied |
| Less than $5,000 | 0 (0.0%) | 0 (0.0%) |
| $5,000 to $9,999 | 0 (0.0%) | 39 (2.6%) |
| $10,000 to $14,999 | 0 (0.0%) | 0 (0.0%) |
| $15,000 to $19,999 | 0 (0.0%) | 0 (0.0%) |
| $20,000 to $24,999 | 0 (0.0%) | 11 (0.7%) |
| $25,000 to $34,999 | 0 (0.0%) | 25 (1.7%) |
| $35,000 to $49,999 | 0 (0.0%) | 89 (5.9%) |
| $50,000 to $74,999 | 0 (0.0%) | 159 (10.5%) |
| $75,000 to $99,999 | 0 (0.0%) | 402 (26.6%) |
| $100,000 to $149,999 | 0 (0.0%) | 378 (25.0%) |
| $150,000 or more | 0 (0.0%) | 408 (27.0%) |
| Total | 0 (0.0%) | 1,511 (100.0%) |
Monthly Housing Cost Tiers in Iroquois Point
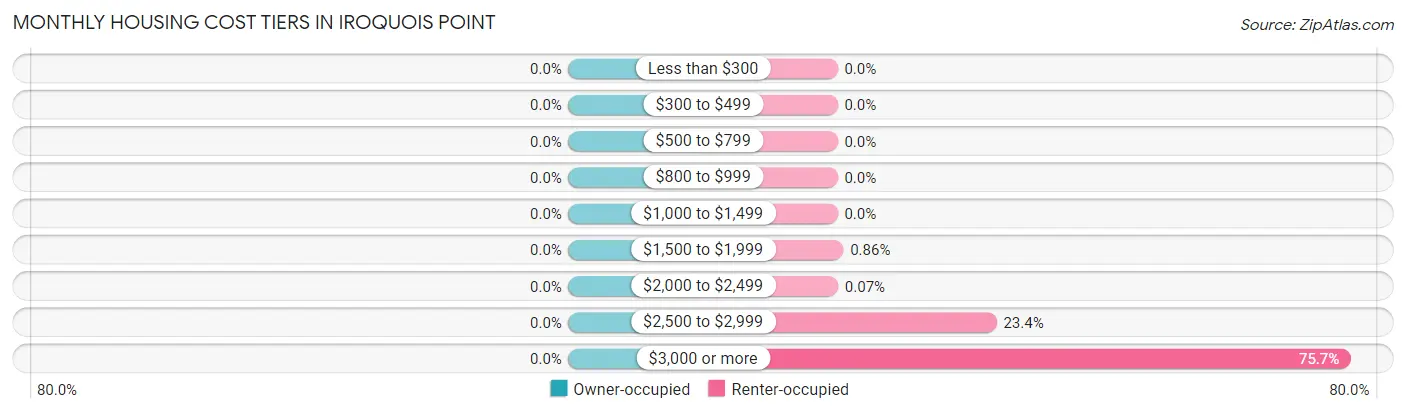
| Monthly Cost | Owner-occupied | Renter-occupied |
| Less than $300 | 0 (0.0%) | 0 (0.0%) |
| $300 to $499 | 0 (0.0%) | 0 (0.0%) |
| $500 to $799 | 0 (0.0%) | 0 (0.0%) |
| $800 to $999 | 0 (0.0%) | 0 (0.0%) |
| $1,000 to $1,499 | 0 (0.0%) | 0 (0.0%) |
| $1,500 to $1,999 | 0 (0.0%) | 13 (0.9%) |
| $2,000 to $2,499 | 0 (0.0%) | 1 (0.1%) |
| $2,500 to $2,999 | 0 (0.0%) | 354 (23.4%) |
| $3,000 or more | 0 (0.0%) | 1,143 (75.6%) |
| Total | 0 (0.0%) | 1,511 (100.0%) |
Physical Housing Characteristics in Iroquois Point
Housing Structures in Iroquois Point
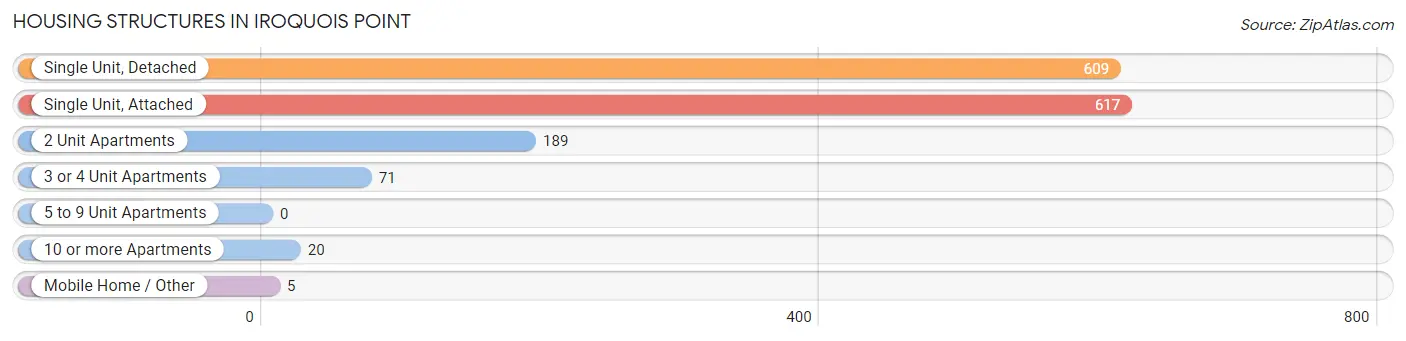
| Structure Type | # Housing Units | % Housing Units |
| Single Unit, Detached | 609 | 40.3% |
| Single Unit, Attached | 617 | 40.8% |
| 2 Unit Apartments | 189 | 12.5% |
| 3 or 4 Unit Apartments | 71 | 4.7% |
| 5 to 9 Unit Apartments | 0 | 0.0% |
| 10 or more Apartments | 20 | 1.3% |
| Mobile Home / Other | 5 | 0.3% |
| Total | 1,511 | 100.0% |
Housing Structures by Occupancy in Iroquois Point
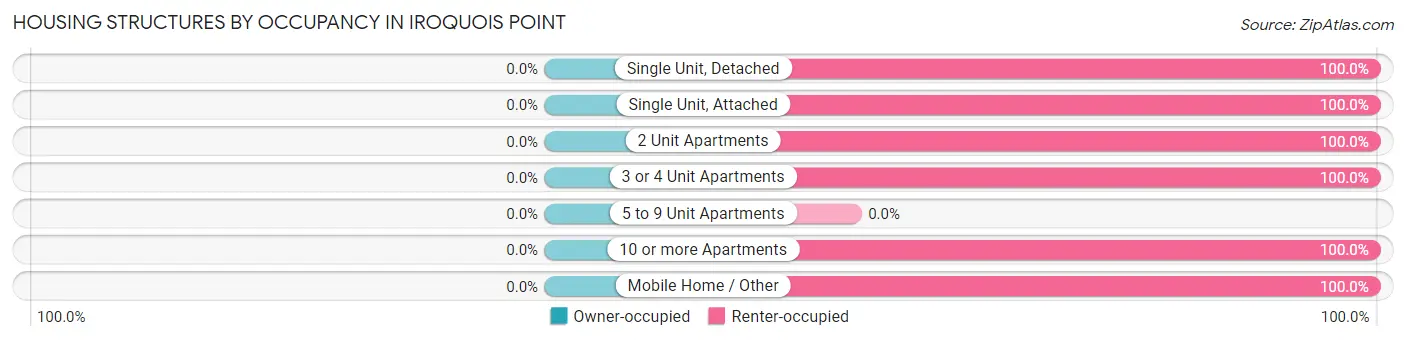
| Structure Type | Owner-occupied | Renter-occupied |
| Single Unit, Detached | 0 (0.0%) | 609 (100.0%) |
| Single Unit, Attached | 0 (0.0%) | 617 (100.0%) |
| 2 Unit Apartments | 0 (0.0%) | 189 (100.0%) |
| 3 or 4 Unit Apartments | 0 (0.0%) | 71 (100.0%) |
| 5 to 9 Unit Apartments | 0 (0.0%) | 0 (0.0%) |
| 10 or more Apartments | 0 (0.0%) | 20 (100.0%) |
| Mobile Home / Other | 0 (0.0%) | 5 (100.0%) |
| Total | 0 (0.0%) | 1,511 (100.0%) |
Housing Structures by Number of Rooms in Iroquois Point
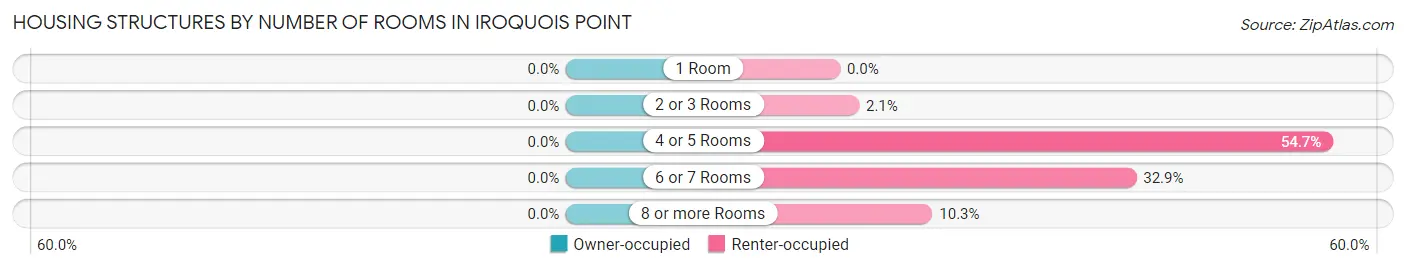
| Number of Rooms | Owner-occupied | Renter-occupied |
| 1 Room | 0 (0.0%) | 0 (0.0%) |
| 2 or 3 Rooms | 0 (0.0%) | 32 (2.1%) |
| 4 or 5 Rooms | 0 (0.0%) | 827 (54.7%) |
| 6 or 7 Rooms | 0 (0.0%) | 497 (32.9%) |
| 8 or more Rooms | 0 (0.0%) | 155 (10.3%) |
| Total | 0 (0.0%) | 1,511 (100.0%) |
Housing Structure by Heating Type in Iroquois Point
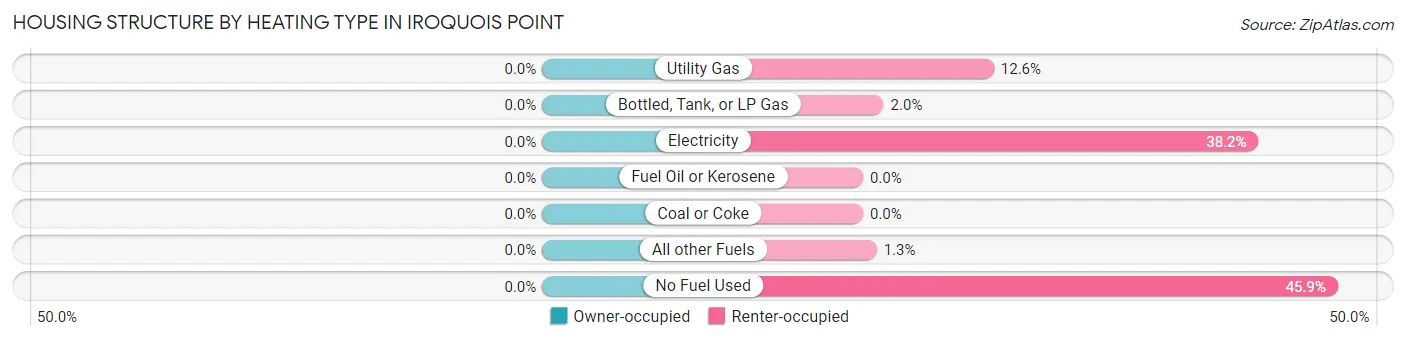
| Heating Type | Owner-occupied | Renter-occupied |
| Utility Gas | 0 (0.0%) | 191 (12.6%) |
| Bottled, Tank, or LP Gas | 0 (0.0%) | 30 (2.0%) |
| Electricity | 0 (0.0%) | 577 (38.2%) |
| Fuel Oil or Kerosene | 0 (0.0%) | 0 (0.0%) |
| Coal or Coke | 0 (0.0%) | 0 (0.0%) |
| All other Fuels | 0 (0.0%) | 20 (1.3%) |
| No Fuel Used | 0 (0.0%) | 693 (45.9%) |
| Total | 0 (0.0%) | 1,511 (100.0%) |
Household Vehicle Usage in Iroquois Point
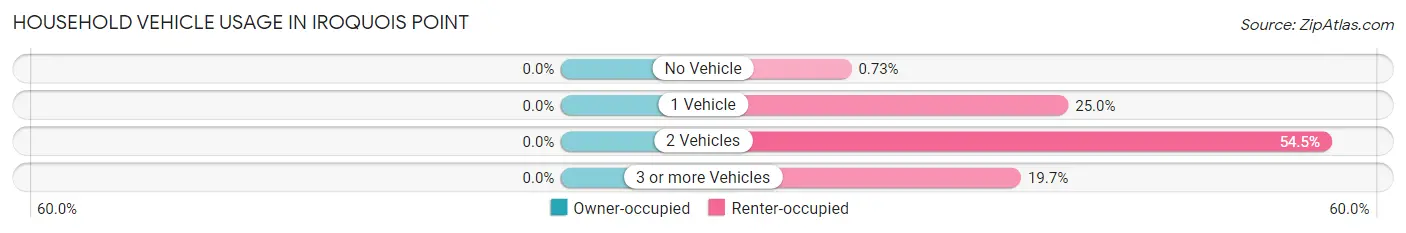
| Vehicles per Household | Owner-occupied | Renter-occupied |
| No Vehicle | 0 (0.0%) | 11 (0.7%) |
| 1 Vehicle | 0 (0.0%) | 378 (25.0%) |
| 2 Vehicles | 0 (0.0%) | 824 (54.5%) |
| 3 or more Vehicles | 0 (0.0%) | 298 (19.7%) |
| Total | 0 (0.0%) | 1,511 (100.0%) |
Real Estate & Mortgages in Iroquois Point
Real Estate and Mortgage Overview in Iroquois Point
| Characteristic | Without Mortgage | With Mortgage |
| Housing Units | 0 | 0 |
| Median Property Value | - | - |
| Median Household Income | - | - |
| Monthly Housing Costs | - | - |
| Real Estate Taxes | - | - |
Property Value by Mortgage Status in Iroquois Point
| Property Value | Without Mortgage | With Mortgage |
| Less than $50,000 | 0 (0.0%) | 0 (0.0%) |
| $50,000 to $99,999 | 0 (0.0%) | 0 (0.0%) |
| $100,000 to $299,999 | 0 (0.0%) | 0 (0.0%) |
| $300,000 to $499,999 | 0 (0.0%) | 0 (0.0%) |
| $500,000 to $749,999 | 0 (0.0%) | 0 (0.0%) |
| $750,000 to $999,999 | 0 (0.0%) | 0 (0.0%) |
| $1,000,000 or more | 0 (0.0%) | 0 (0.0%) |
| Total | 0 (0.0%) | 0 (0.0%) |
Household Income by Mortgage Status in Iroquois Point
| Household Income | Without Mortgage | With Mortgage |
| Less than $10,000 | 0 (0.0%) | 0 (0.0%) |
| $10,000 to $24,999 | 0 (0.0%) | 0 (0.0%) |
| $25,000 to $34,999 | 0 (0.0%) | 0 (0.0%) |
| $35,000 to $49,999 | 0 (0.0%) | 0 (0.0%) |
| $50,000 to $74,999 | 0 (0.0%) | 0 (0.0%) |
| $75,000 to $99,999 | 0 (0.0%) | 0 (0.0%) |
| $100,000 to $149,999 | 0 (0.0%) | 0 (0.0%) |
| $150,000 or more | 0 (0.0%) | 0 (0.0%) |
| Total | 0 (0.0%) | 0 (0.0%) |
Property Value to Household Income Ratio in Iroquois Point
| Value-to-Income Ratio | Without Mortgage | With Mortgage |
| Less than 2.0x | 0 (0.0%) | 0 (0.0%) |
| 2.0x to 2.9x | 0 (0.0%) | 0 (0.0%) |
| 3.0x to 3.9x | 0 (0.0%) | 0 (0.0%) |
| 4.0x or more | 0 (0.0%) | 0 (0.0%) |
| Total | 0 (0.0%) | 0 (0.0%) |
Real Estate Taxes by Mortgage Status in Iroquois Point
| Property Taxes | Without Mortgage | With Mortgage |
| Less than $800 | 0 (0.0%) | 0 (0.0%) |
| $800 to $1,499 | 0 (0.0%) | 0 (0.0%) |
| $800 to $1,499 | 0 (0.0%) | 0 (0.0%) |
| Total | 0 (0.0%) | 0 (0.0%) |
Health & Disability in Iroquois Point
Health Insurance Coverage by Age in Iroquois Point
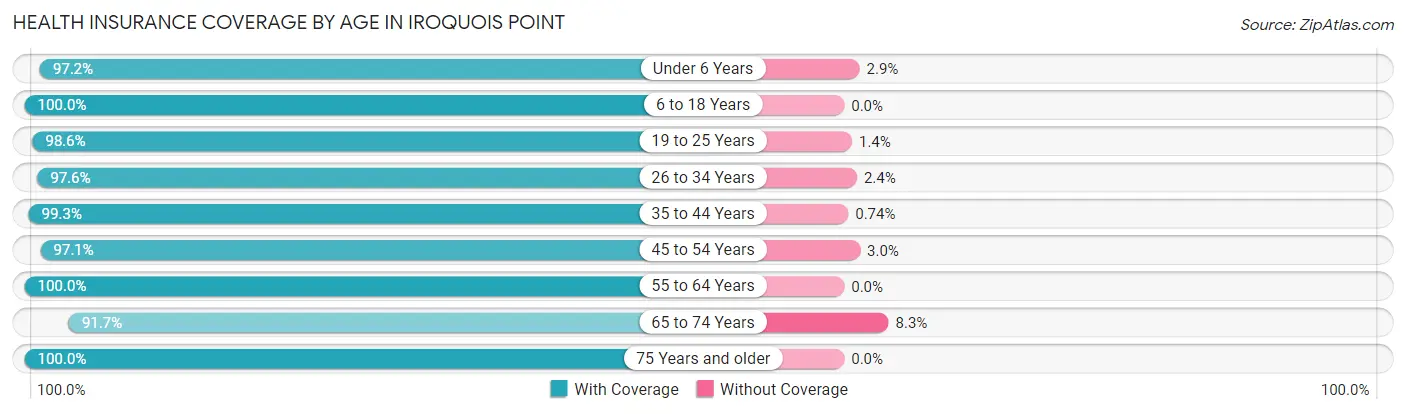
| Age Bracket | With Coverage | Without Coverage |
| Under 6 Years | 785 (97.2%) | 23 (2.9%) |
| 6 to 18 Years | 1,584 (100.0%) | 0 (0.0%) |
| 19 to 25 Years | 480 (98.6%) | 7 (1.4%) |
| 26 to 34 Years | 536 (97.6%) | 13 (2.4%) |
| 35 to 44 Years | 1,072 (99.3%) | 8 (0.7%) |
| 45 to 54 Years | 526 (97.1%) | 16 (2.9%) |
| 55 to 64 Years | 173 (100.0%) | 0 (0.0%) |
| 65 to 74 Years | 111 (91.7%) | 10 (8.3%) |
| 75 Years and older | 86 (100.0%) | 0 (0.0%) |
| Total | 5,353 (98.6%) | 77 (1.4%) |
Health Insurance Coverage by Citizenship Status in Iroquois Point
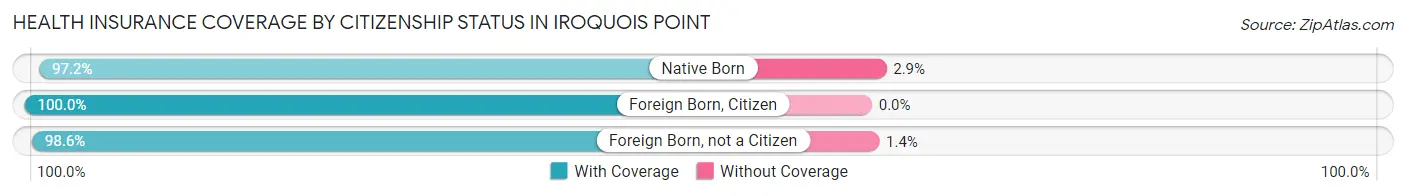
| Citizenship Status | With Coverage | Without Coverage |
| Native Born | 785 (97.2%) | 23 (2.9%) |
| Foreign Born, Citizen | 1,584 (100.0%) | 0 (0.0%) |
| Foreign Born, not a Citizen | 480 (98.6%) | 7 (1.4%) |
Health Insurance Coverage by Household Income in Iroquois Point
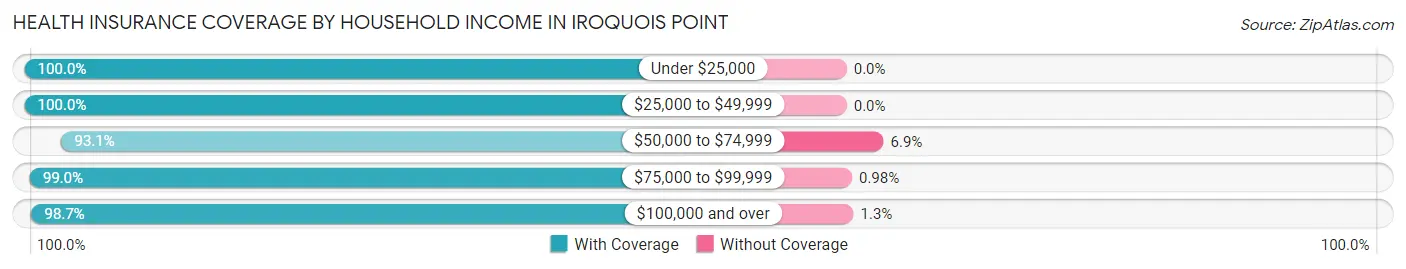
| Household Income | With Coverage | Without Coverage |
| Under $25,000 | 237 (100.0%) | 0 (0.0%) |
| $25,000 to $49,999 | 451 (100.0%) | 0 (0.0%) |
| $50,000 to $74,999 | 324 (93.1%) | 24 (6.9%) |
| $75,000 to $99,999 | 1,014 (99.0%) | 10 (1.0%) |
| $100,000 and over | 3,327 (98.7%) | 43 (1.3%) |
Public vs Private Health Insurance Coverage by Age in Iroquois Point
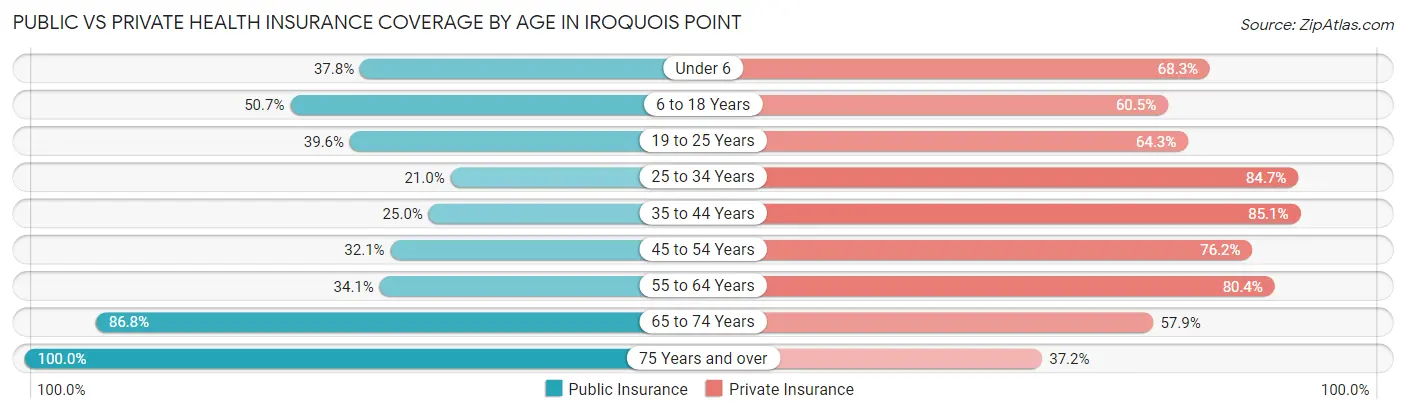
| Age Bracket | Public Insurance | Private Insurance |
| Under 6 | 305 (37.8%) | 552 (68.3%) |
| 6 to 18 Years | 803 (50.7%) | 959 (60.5%) |
| 19 to 25 Years | 193 (39.6%) | 313 (64.3%) |
| 25 to 34 Years | 115 (20.9%) | 465 (84.7%) |
| 35 to 44 Years | 270 (25.0%) | 919 (85.1%) |
| 45 to 54 Years | 174 (32.1%) | 413 (76.2%) |
| 55 to 64 Years | 59 (34.1%) | 139 (80.3%) |
| 65 to 74 Years | 105 (86.8%) | 70 (57.9%) |
| 75 Years and over | 86 (100.0%) | 32 (37.2%) |
| Total | 2,110 (38.9%) | 3,862 (71.1%) |
Disability Status by Sex by Age in Iroquois Point
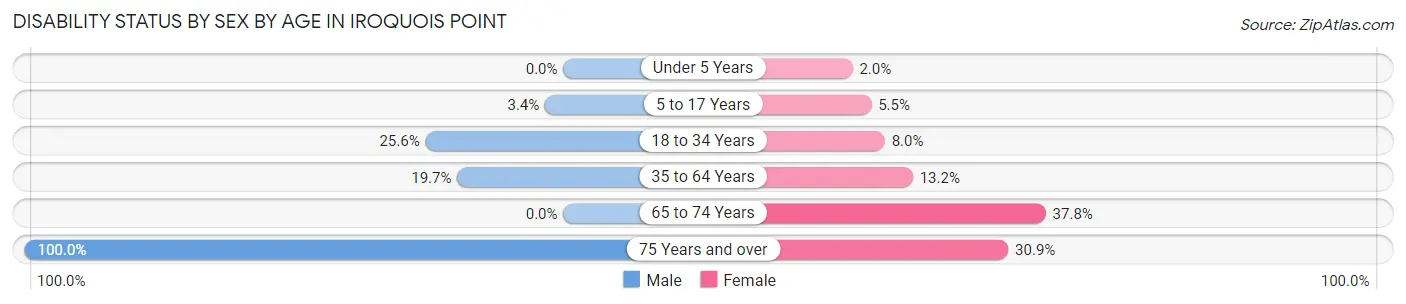
| Age Bracket | Male | Female |
| Under 5 Years | 0 (0.0%) | 9 (2.0%) |
| 5 to 17 Years | 31 (3.4%) | 47 (5.5%) |
| 18 to 34 Years | 87 (25.6%) | 56 (8.0%) |
| 35 to 64 Years | 192 (19.7%) | 108 (13.2%) |
| 65 to 74 Years | 0 (0.0%) | 28 (37.8%) |
| 75 Years and over | 18 (100.0%) | 21 (30.9%) |
Disability Class by Sex by Age in Iroquois Point
Disability Class: Hearing Difficulty
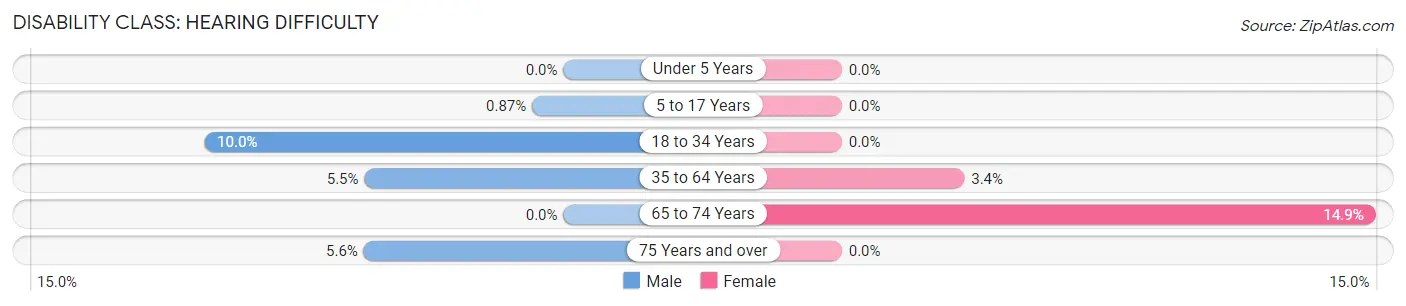
| Age Bracket | Male | Female |
| Under 5 Years | 0 (0.0%) | 0 (0.0%) |
| 5 to 17 Years | 8 (0.9%) | 0 (0.0%) |
| 18 to 34 Years | 34 (10.0%) | 0 (0.0%) |
| 35 to 64 Years | 54 (5.5%) | 28 (3.4%) |
| 65 to 74 Years | 0 (0.0%) | 11 (14.9%) |
| 75 Years and over | 1 (5.6%) | 0 (0.0%) |
Disability Class: Vision Difficulty
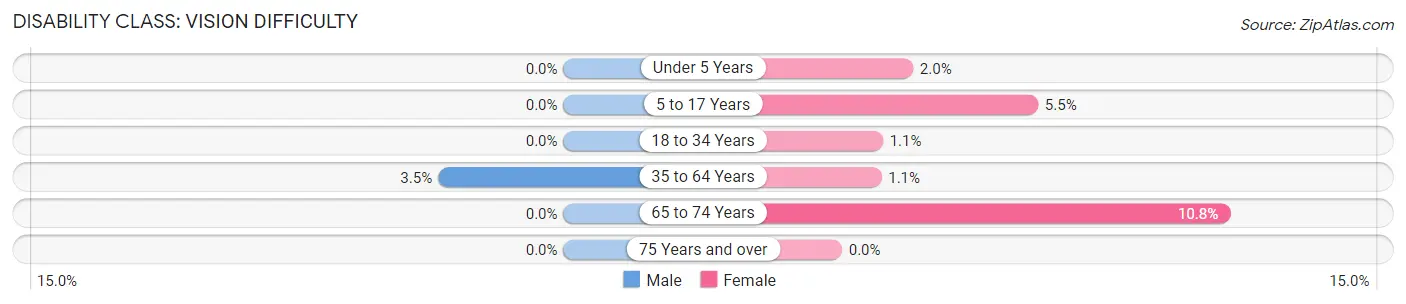
| Age Bracket | Male | Female |
| Under 5 Years | 0 (0.0%) | 9 (2.0%) |
| 5 to 17 Years | 0 (0.0%) | 47 (5.5%) |
| 18 to 34 Years | 0 (0.0%) | 8 (1.1%) |
| 35 to 64 Years | 34 (3.5%) | 9 (1.1%) |
| 65 to 74 Years | 0 (0.0%) | 8 (10.8%) |
| 75 Years and over | 0 (0.0%) | 0 (0.0%) |
Disability Class: Cognitive Difficulty
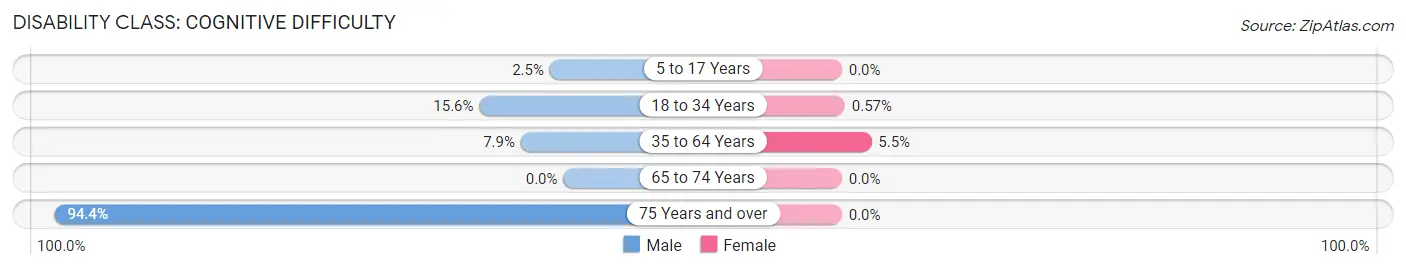
| Age Bracket | Male | Female |
| 5 to 17 Years | 23 (2.5%) | 0 (0.0%) |
| 18 to 34 Years | 53 (15.6%) | 4 (0.6%) |
| 35 to 64 Years | 77 (7.9%) | 45 (5.5%) |
| 65 to 74 Years | 0 (0.0%) | 0 (0.0%) |
| 75 Years and over | 17 (94.4%) | 0 (0.0%) |
Disability Class: Ambulatory Difficulty
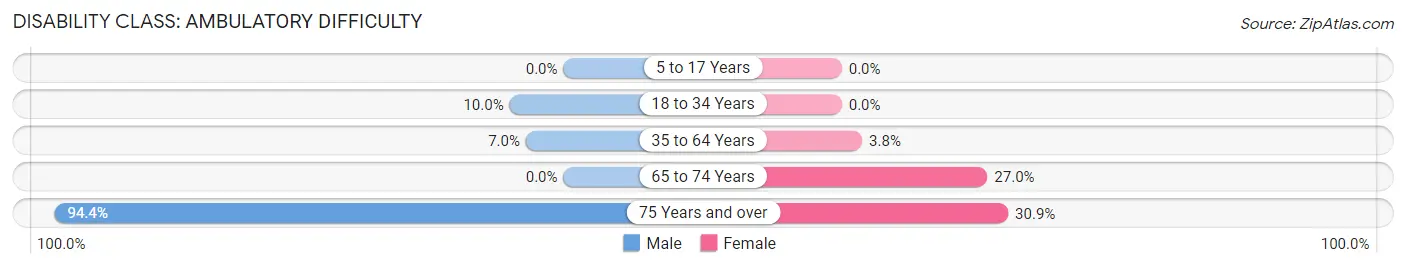
| Age Bracket | Male | Female |
| 5 to 17 Years | 0 (0.0%) | 0 (0.0%) |
| 18 to 34 Years | 34 (10.0%) | 0 (0.0%) |
| 35 to 64 Years | 68 (7.0%) | 31 (3.8%) |
| 65 to 74 Years | 0 (0.0%) | 20 (27.0%) |
| 75 Years and over | 17 (94.4%) | 21 (30.9%) |
Disability Class: Self-Care Difficulty
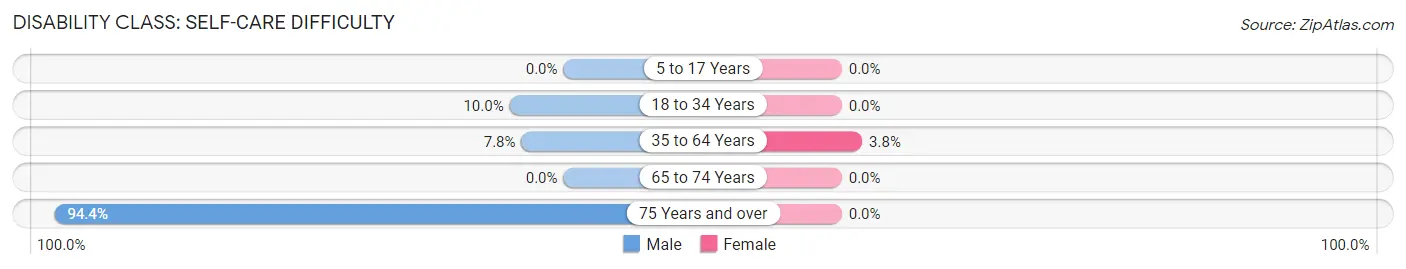
| Age Bracket | Male | Female |
| 5 to 17 Years | 0 (0.0%) | 0 (0.0%) |
| 18 to 34 Years | 34 (10.0%) | 0 (0.0%) |
| 35 to 64 Years | 76 (7.8%) | 31 (3.8%) |
| 65 to 74 Years | 0 (0.0%) | 0 (0.0%) |
| 75 Years and over | 17 (94.4%) | 0 (0.0%) |
Technology Access in Iroquois Point
Computing Device Access in Iroquois Point
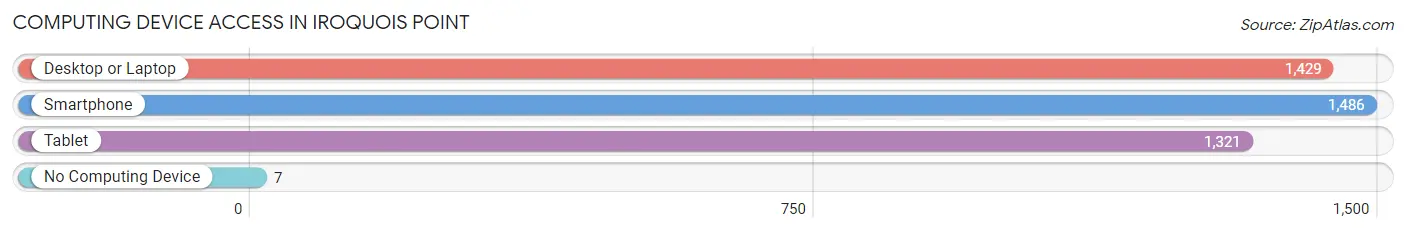
| Device Type | # Households | % Households |
| Desktop or Laptop | 1,429 | 94.6% |
| Smartphone | 1,486 | 98.4% |
| Tablet | 1,321 | 87.4% |
| No Computing Device | 7 | 0.5% |
| Total | 1,511 | 100.0% |
Internet Access in Iroquois Point
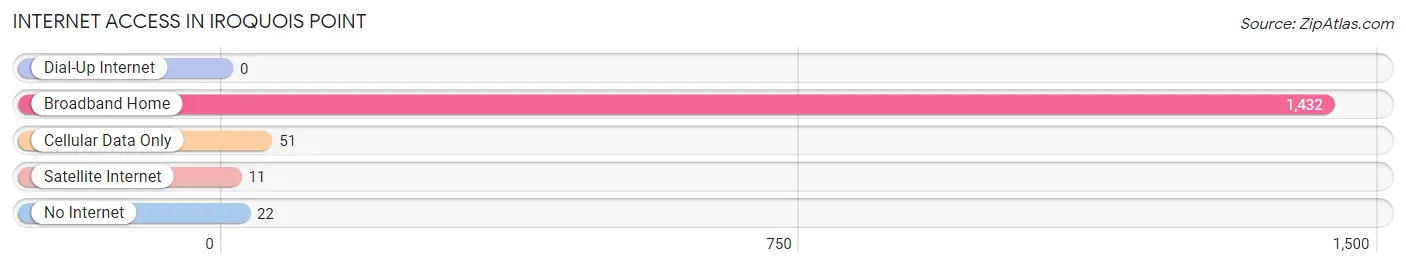
| Internet Type | # Households | % Households |
| Dial-Up Internet | 0 | 0.0% |
| Broadband Home | 1,432 | 94.8% |
| Cellular Data Only | 51 | 3.4% |
| Satellite Internet | 11 | 0.7% |
| No Internet | 22 | 1.5% |
| Total | 1,511 | 100.0% |
Iroquois Point Summary
Iroquois Point is a census-designated place (CDP) located in Honolulu County, Hawaii, United States. It is located on the western side of the island of Oahu, and is part of the city and county of Honolulu. As of the 2010 census, the population of Iroquois Point was 1,945.
History
Iroquois Point was originally part of the ahupuaa of Waipio, which was part of the larger ahupuaa of Waialua. The area was first settled by Native Hawaiians in the late 1700s, and was used for agricultural purposes. In the early 1800s, the area was used as a military base by the Kingdom of Hawaii. In the late 1800s, the area was developed as a sugar plantation, and the Iroquois Point Sugar Company was established in 1891. The company operated until the early 1900s, when it was sold to the Hawaiian Sugar Planters' Association.
In the early 1900s, the area was developed as a residential community, and the Iroquois Point subdivision was established in 1912. The area was annexed by the City and County of Honolulu in 1959.
Geography
Iroquois Point is located at 21°22'25"N 157°51'45"W (21.373611, -157.862472). It is bordered to the north by the city of Honolulu, to the east by the Pacific Ocean, to the south by the city of Waipahu, and to the west by the city of Ewa Beach.
The total area of Iroquois Point is 0.9 square miles (2.3 km2), all of which is land. The terrain is mostly flat, with some hills in the northern part of the CDP.
Economy
The economy of Iroquois Point is largely based on tourism and military spending. The area is home to several military installations, including the Pearl Harbor Naval Base, the Hickam Air Force Base, and the Marine Corps Base Hawaii. These installations provide a significant amount of employment for the local population.
In addition, Iroquois Point is home to several tourist attractions, including the USS Arizona Memorial, the USS Missouri Memorial, and the Pearl Harbor Visitor Center. These attractions draw a large number of visitors to the area each year, providing a boost to the local economy.
Demographics
As of the 2010 census, there were 1,945 people, 690 households, and 517 families residing in Iroquois Point. The population density was 2,093.3 people per square mile (808.3/km2). There were 745 housing units at an average density of 817.2 per square mile (315.7/km2). The racial makeup of the CDP was 44.2% White, 8.2% African American, 0.3% Native American, 24.2% Asian, 0.1% Pacific Islander, 16.2% from other races, and 6.9% from two or more races. Hispanic or Latino of any race were 24.2% of the population.
There were 690 households, out of which 33.3% had children under the age of 18 living with them, 51.3% were married couples living together, 12.3% had a female householder with no husband present, and 30.3% were non-families. 24.3% of all households were made up of individuals, and 8.3% had someone living alone who was 65 years of age or older. The average household size was 2.81 and the average family size was 3.37.
In the CDP, the population was spread out, with 25.2% under the age of 18, 8.2% from 18 to 24, 28.2% from 25 to 44, 25.2% from 45 to 64, and 13.2% who were 65 years of age or older. The median age was 37 years. For every 100 females, there were 99.2 males. For every 100 females age 18 and over, there were 97.2 males.
The median income for a household in the CDP was $50,938, and the median income for a family was $56,250. Males had a median income of $37,500 versus $30,000 for females. The per capita income for the CDP was $21,945. About 8.2% of families and 10.2% of the population were below the poverty line, including 14.2% of those under age 18 and 4.2% of those age 65 or over.
Common Questions
What is Per Capita Income in Iroquois Point?
Per Capita income in Iroquois Point is $32,204.
What is the Median Family Income in Iroquois Point?
Median Family Income in Iroquois Point is $100,121.
What is the Median Household income in Iroquois Point?
Median Household Income in Iroquois Point is $100,794.
What is Income or Wage Gap in Iroquois Point?
Income or Wage Gap in Iroquois Point is 52.5%.
Women in Iroquois Point earn 47.5 cents for every dollar earned by a man.
What is Inequality or Gini Index in Iroquois Point?
Inequality or Gini Index in Iroquois Point is 0.31.
What is the Total Population of Iroquois Point?
Total Population of Iroquois Point is 5,921.
What is the Total Male Population of Iroquois Point?
Total Male Population of Iroquois Point is 2,903.
What is the Total Female Population of Iroquois Point?
Total Female Population of Iroquois Point is 3,018.
What is the Ratio of Males per 100 Females in Iroquois Point?
There are 96.19 Males per 100 Females in Iroquois Point.
What is the Ratio of Females per 100 Males in Iroquois Point?
There are 103.96 Females per 100 Males in Iroquois Point.
What is the Median Population Age in Iroquois Point?
Median Population Age in Iroquois Point is 25.2 Years.
What is the Average Family Size in Iroquois Point
Average Family Size in Iroquois Point is 4.3 People.
What is the Average Household Size in Iroquois Point
Average Household Size in Iroquois Point is 3.9 People.
How Large is the Labor Force in Iroquois Point?
There are 2,747 People in the Labor Forcein in Iroquois Point.
What is the Percentage of People in the Labor Force in Iroquois Point?
74.6% of People are in the Labor Force in Iroquois Point.
What is the Unemployment Rate in Iroquois Point?
Unemployment Rate in Iroquois Point is 9.0%.