Kapalua, HI Map & Demographics
Kapalua Map
Kapalua Overview
$118,830
PER CAPITA INCOME
$162,500
AVG FAMILY INCOME
$178,750
AVG HOUSEHOLD INCOME
6.7%
WAGE / INCOME GAP [ % ]
93.3¢/ $1
WAGE / INCOME GAP [ $ ]
0.52
INEQUALITY / GINI INDEX
392
TOTAL POPULATION
210
MALE POPULATION
182
FEMALE POPULATION
115.38
MALES / 100 FEMALES
86.67
FEMALES / 100 MALES
53.3
MEDIAN AGE
2.8
AVG FAMILY SIZE
2.4
AVG HOUSEHOLD SIZE
189
LABOR FORCE [ PEOPLE ]
55.9%
PERCENT IN LABOR FORCE
4.2%
UNEMPLOYMENT RATE
Income in Kapalua
Income Overview in Kapalua
Per Capita Income in Kapalua is $118,830, while median incomes of families and households are $162,500 and $178,750 respectively.
| Characteristic | Number | Measure |
| Per Capita Income | 392 | $118,830 |
| Median Family Income | 122 | $162,500 |
| Mean Family Income | 122 | $298,707 |
| Median Household Income | 163 | $178,750 |
| Mean Household Income | 163 | $289,657 |
| Income Deficit | 122 | $0 |
| Wage / Income Gap (%) | 392 | 6.72% |
| Wage / Income Gap ($) | 392 | 93.28¢ per $1 |
| Gini / Inequality Index | 392 | 0.52 |
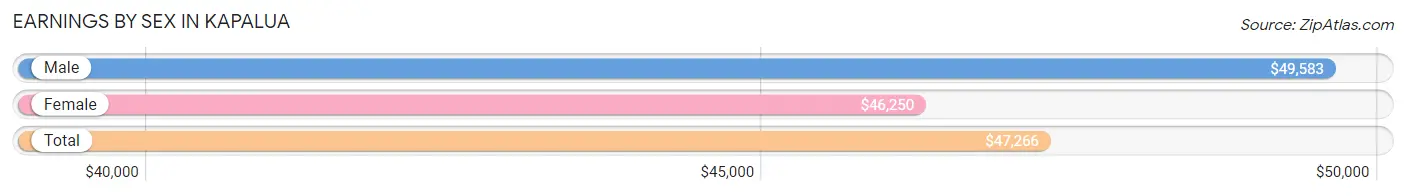
Earnings by Sex in Kapalua
Average Earnings in Kapalua are $47,266, $49,583 for men and $46,250 for women, a difference of 6.7%.
| Sex | Number | Average Earnings |
| Male | 100 (47.6%) | $49,583 |
| Female | 110 (52.4%) | $46,250 |
| Total | 210 (100.0%) | $47,266 |
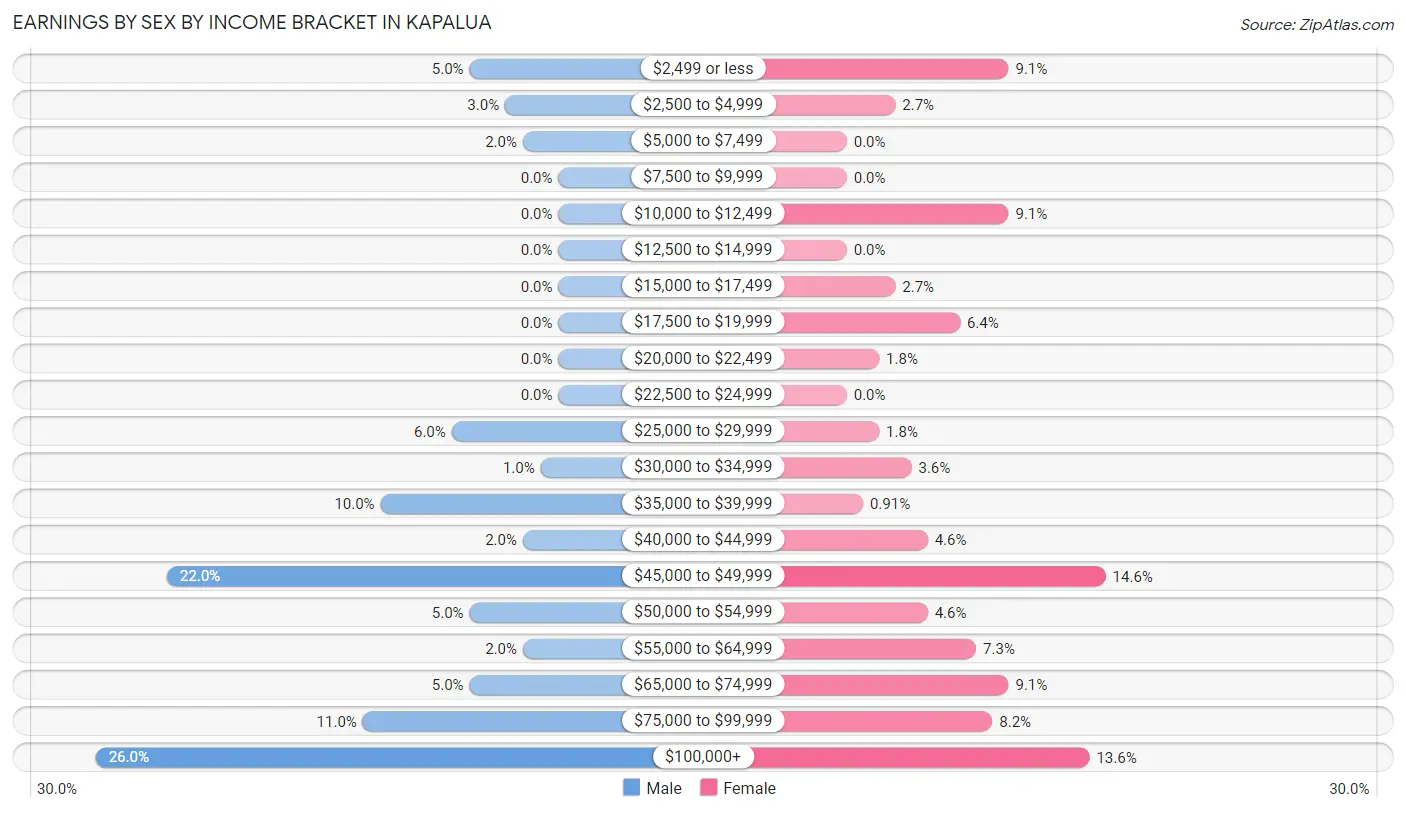
Earnings by Sex by Income Bracket in Kapalua
The most common earnings brackets in Kapalua are $100,000+ for men (26 | 26.0%) and $45,000 to $49,999 for women (16 | 14.5%).
| Income | Male | Female |
| $2,499 or less | 5 (5.0%) | 10 (9.1%) |
| $2,500 to $4,999 | 3 (3.0%) | 3 (2.7%) |
| $5,000 to $7,499 | 2 (2.0%) | 0 (0.0%) |
| $7,500 to $9,999 | 0 (0.0%) | 0 (0.0%) |
| $10,000 to $12,499 | 0 (0.0%) | 10 (9.1%) |
| $12,500 to $14,999 | 0 (0.0%) | 0 (0.0%) |
| $15,000 to $17,499 | 0 (0.0%) | 3 (2.7%) |
| $17,500 to $19,999 | 0 (0.0%) | 7 (6.4%) |
| $20,000 to $22,499 | 0 (0.0%) | 2 (1.8%) |
| $22,500 to $24,999 | 0 (0.0%) | 0 (0.0%) |
| $25,000 to $29,999 | 6 (6.0%) | 2 (1.8%) |
| $30,000 to $34,999 | 1 (1.0%) | 4 (3.6%) |
| $35,000 to $39,999 | 10 (10.0%) | 1 (0.9%) |
| $40,000 to $44,999 | 2 (2.0%) | 5 (4.5%) |
| $45,000 to $49,999 | 22 (22.0%) | 16 (14.5%) |
| $50,000 to $54,999 | 5 (5.0%) | 5 (4.5%) |
| $55,000 to $64,999 | 2 (2.0%) | 8 (7.3%) |
| $65,000 to $74,999 | 5 (5.0%) | 10 (9.1%) |
| $75,000 to $99,999 | 11 (11.0%) | 9 (8.2%) |
| $100,000+ | 26 (26.0%) | 15 (13.6%) |
| Total | 100 (100.0%) | 110 (100.0%) |
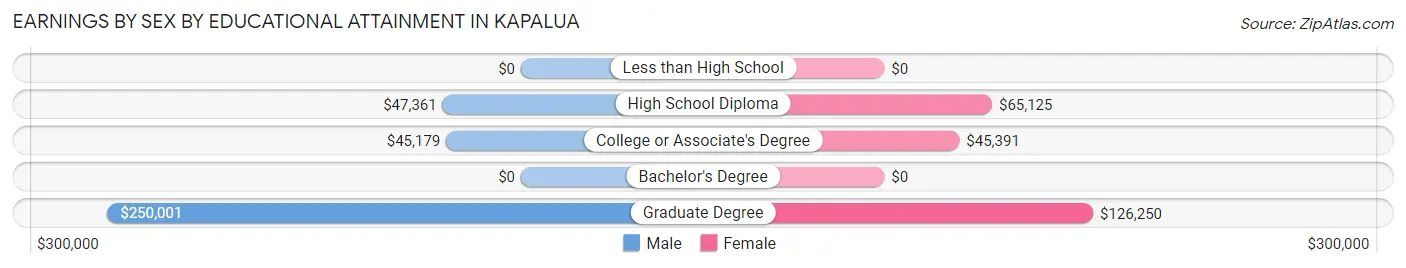
Earnings by Sex by Educational Attainment in Kapalua
Average earnings in Kapalua are $49,583 for men and $46,641 for women, a difference of 5.9%. Men with an educational attainment of graduate degree enjoy the highest average annual earnings of $250,001, while those with college or associate's degree education earn the least with $45,179. Women with an educational attainment of graduate degree earn the most with the average annual earnings of $126,250, while those with college or associate's degree education have the smallest earnings of $45,391.
| Educational Attainment | Male Income | Female Income |
| Less than High School | - | - |
| High School Diploma | $47,361 | $65,125 |
| College or Associate's Degree | $45,179 | $45,391 |
| Bachelor's Degree | - | - |
| Graduate Degree | $250,001 | $126,250 |
| Total | $49,583 | $46,641 |
Family Income in Kapalua
Family Income Brackets in Kapalua
According to the Kapalua family income data, there are 58 families falling into the $200,000+ income range, which is the most common income bracket and makes up 47.5% of all families.
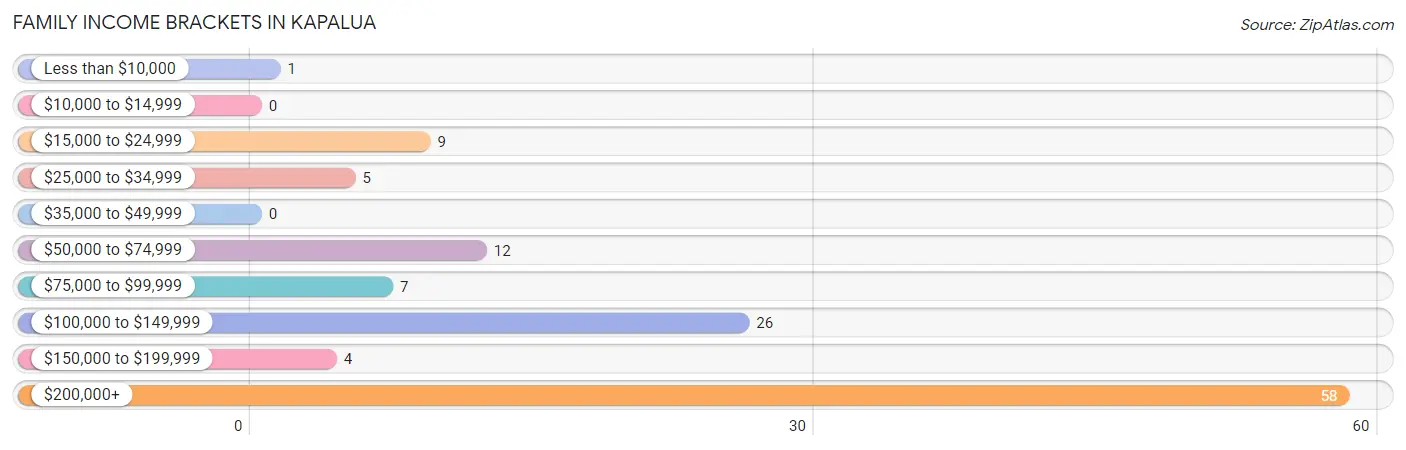
| Income Bracket | # Families | % Families |
| Less than $10,000 | 1 | 0.8% |
| $10,000 to $14,999 | 0 | 0.0% |
| $15,000 to $24,999 | 9 | 7.4% |
| $25,000 to $34,999 | 5 | 4.1% |
| $35,000 to $49,999 | 0 | 0.0% |
| $50,000 to $74,999 | 12 | 9.8% |
| $75,000 to $99,999 | 7 | 5.7% |
| $100,000 to $149,999 | 26 | 21.3% |
| $150,000 to $199,999 | 4 | 3.3% |
| $200,000+ | 58 | 47.5% |
Family Income by Famaliy Size in Kapalua
2-person families (75 | 61.5%) account for the highest median family income in Kapalua with $171,250 per family, while 2-person families (75 | 61.5%) have the highest median income of $85,625 per family member.
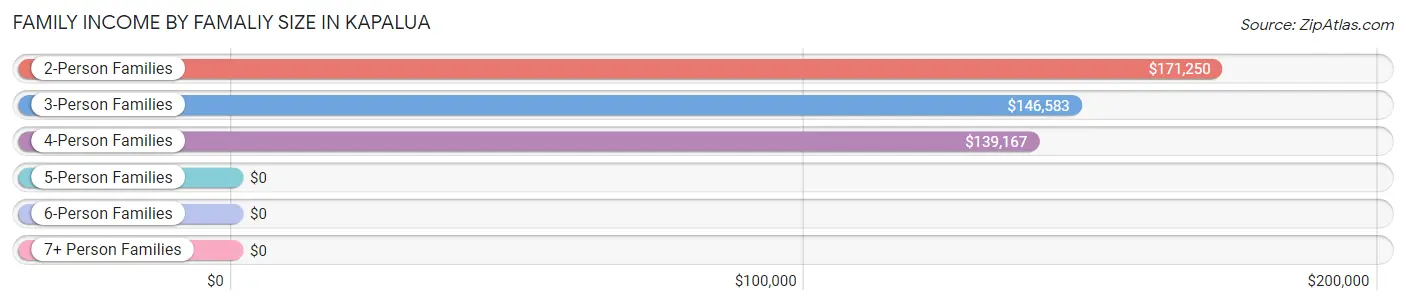
| Income Bracket | # Families | Median Income |
| 2-Person Families | 75 (61.5%) | $171,250 |
| 3-Person Families | 27 (22.1%) | $146,583 |
| 4-Person Families | 6 (4.9%) | $139,167 |
| 5-Person Families | 0 (0.0%) | $0 |
| 6-Person Families | 7 (5.7%) | $0 |
| 7+ Person Families | 7 (5.7%) | $0 |
| Total | 122 (100.0%) | $162,500 |
Family Income by Number of Earners in Kapalua
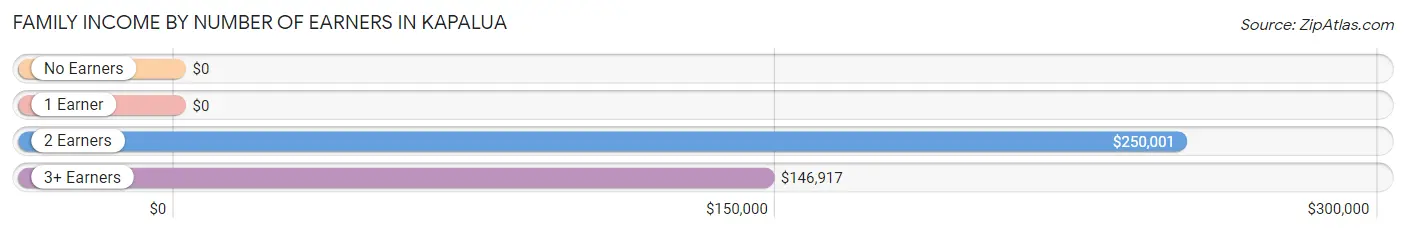
| Number of Earners | # Families | Median Income |
| No Earners | 27 (22.1%) | $0 |
| 1 Earner | 51 (41.8%) | $0 |
| 2 Earners | 21 (17.2%) | $250,001 |
| 3+ Earners | 23 (18.9%) | $146,917 |
| Total | 122 (100.0%) | $162,500 |
Household Income in Kapalua
Household Income Brackets in Kapalua
With 79 households falling in the category, the $200,000+ income range is the most frequent in Kapalua, accounting for 48.5% of all households.
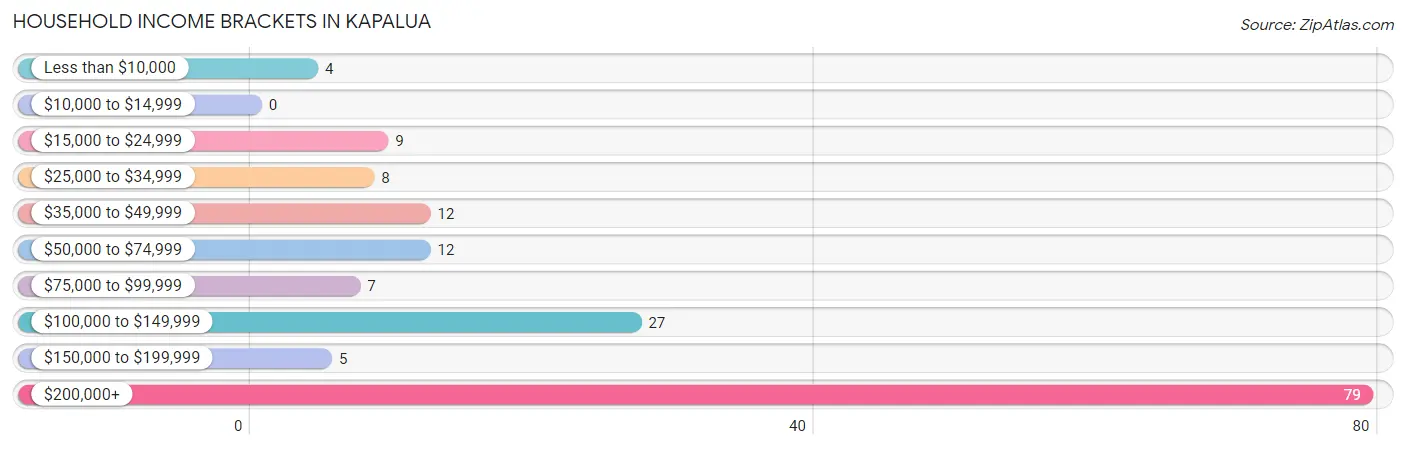
| Income Bracket | # Households | % Households |
| Less than $10,000 | 4 | 2.5% |
| $10,000 to $14,999 | 0 | 0.0% |
| $15,000 to $24,999 | 9 | 5.5% |
| $25,000 to $34,999 | 8 | 4.9% |
| $35,000 to $49,999 | 12 | 7.4% |
| $50,000 to $74,999 | 12 | 7.4% |
| $75,000 to $99,999 | 7 | 4.3% |
| $100,000 to $149,999 | 27 | 16.6% |
| $150,000 to $199,999 | 5 | 3.1% |
| $200,000+ | 79 | 48.5% |
Household Income by Householder Age in Kapalua
The median household income in Kapalua is $178,750, with the highest median household income of $250,001 found in the 45 to 64 years age bracket for the primary householder. A total of 69 households (42.3%) fall into this category.
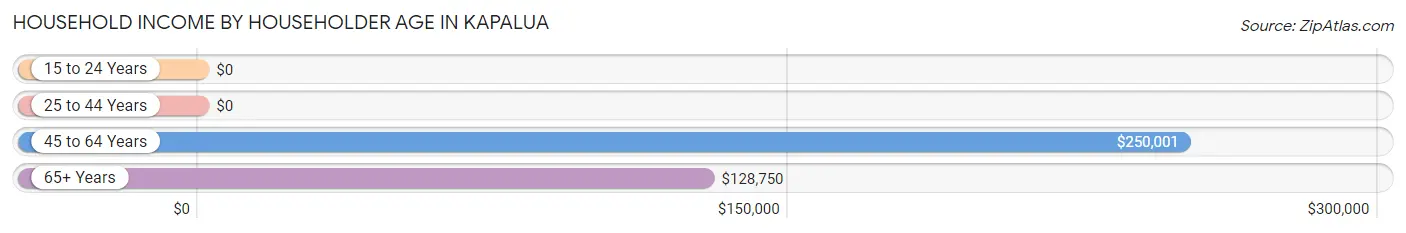
| Income Bracket | # Households | Median Income |
| 15 to 24 Years | 0 (0.0%) | $0 |
| 25 to 44 Years | 12 (7.4%) | $0 |
| 45 to 64 Years | 69 (42.3%) | $250,001 |
| 65+ Years | 82 (50.3%) | $128,750 |
| Total | 163 (100.0%) | $178,750 |
Poverty in Kapalua
Income Below Poverty by Sex and Age in Kapalua
With 4.3% poverty level for males and 8.2% for females among the residents of Kapalua, 6 to 11 year old males and 55 to 64 year old females are the most vulnerable to poverty, with 5 males (16.7%) and 7 females (28.0%) in their respective age groups living below the poverty level.
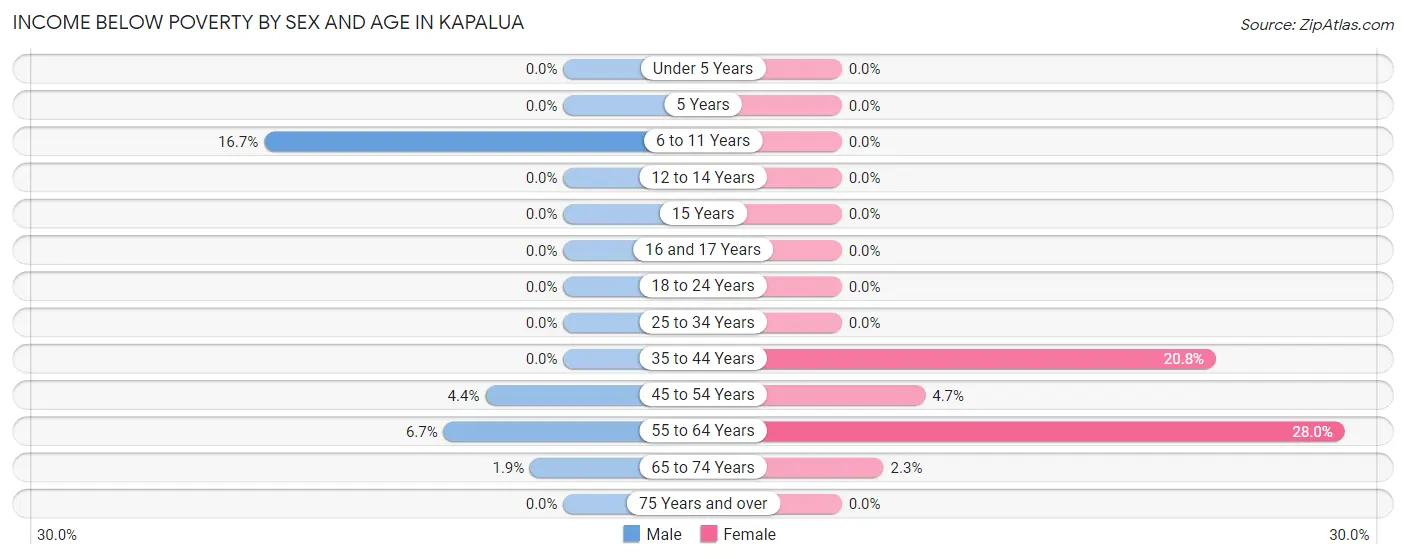
| Age Bracket | Male | Female |
| Under 5 Years | 0 (0.0%) | 0 (0.0%) |
| 5 Years | 0 (0.0%) | 0 (0.0%) |
| 6 to 11 Years | 5 (16.7%) | 0 (0.0%) |
| 12 to 14 Years | 0 (0.0%) | 0 (0.0%) |
| 15 Years | 0 (0.0%) | 0 (0.0%) |
| 16 and 17 Years | 0 (0.0%) | 0 (0.0%) |
| 18 to 24 Years | 0 (0.0%) | 0 (0.0%) |
| 25 to 34 Years | 0 (0.0%) | 0 (0.0%) |
| 35 to 44 Years | 0 (0.0%) | 5 (20.8%) |
| 45 to 54 Years | 1 (4.3%) | 2 (4.6%) |
| 55 to 64 Years | 2 (6.7%) | 7 (28.0%) |
| 65 to 74 Years | 1 (1.8%) | 1 (2.3%) |
| 75 Years and over | 0 (0.0%) | 0 (0.0%) |
| Total | 9 (4.3%) | 15 (8.2%) |
Income Above Poverty by Sex and Age in Kapalua
According to the poverty statistics in Kapalua, males aged 12 to 14 years and females aged 6 to 11 years are the age groups that are most secure financially, with 100.0% of males and 100.0% of females in these age groups living above the poverty line.
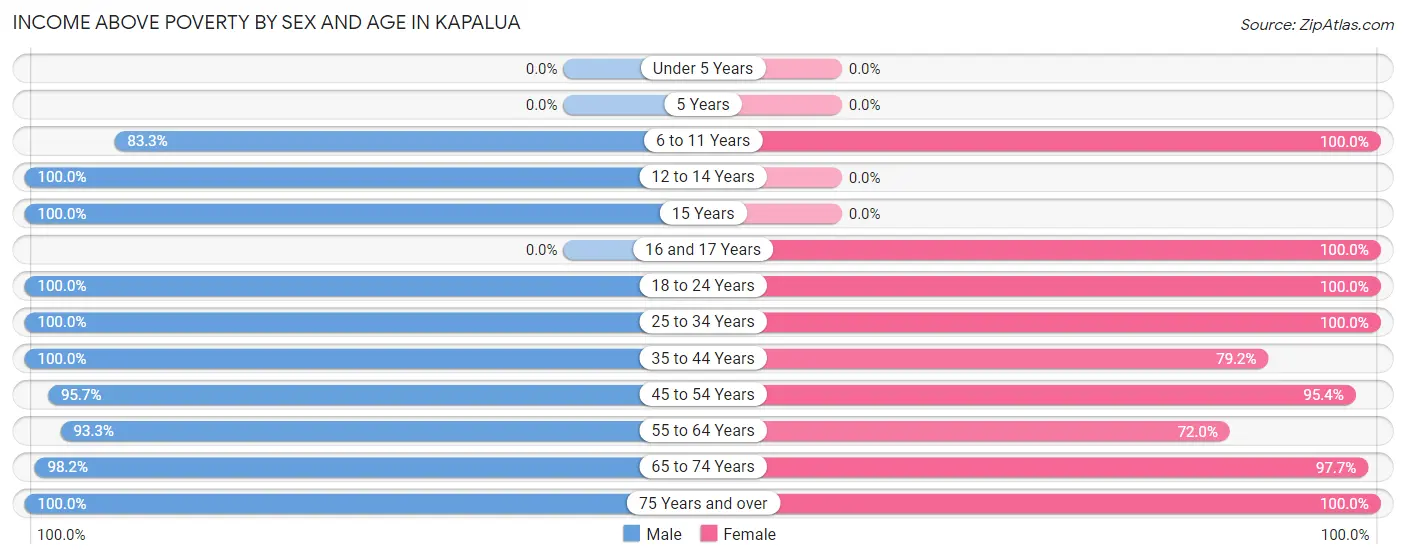
| Age Bracket | Male | Female |
| Under 5 Years | 0 (0.0%) | 0 (0.0%) |
| 5 Years | 0 (0.0%) | 0 (0.0%) |
| 6 to 11 Years | 25 (83.3%) | 9 (100.0%) |
| 12 to 14 Years | 14 (100.0%) | 0 (0.0%) |
| 15 Years | 1 (100.0%) | 0 (0.0%) |
| 16 and 17 Years | 0 (0.0%) | 5 (100.0%) |
| 18 to 24 Years | 2 (100.0%) | 1 (100.0%) |
| 25 to 34 Years | 29 (100.0%) | 17 (100.0%) |
| 35 to 44 Years | 14 (100.0%) | 19 (79.2%) |
| 45 to 54 Years | 22 (95.7%) | 41 (95.4%) |
| 55 to 64 Years | 28 (93.3%) | 18 (72.0%) |
| 65 to 74 Years | 53 (98.2%) | 42 (97.7%) |
| 75 Years and over | 13 (100.0%) | 15 (100.0%) |
| Total | 201 (95.7%) | 167 (91.8%) |
Income Below Poverty Among Married-Couple Families in Kapalua
The poverty statistics for married-couple families in Kapalua show that 2.7% or 3 of the total 111 families live below the poverty line. Families with no children have the highest poverty rate of 3.5%, comprising of 3 families. On the other hand, families with 1 or 2 children have the lowest poverty rate of 0.0%, which includes 0 families.
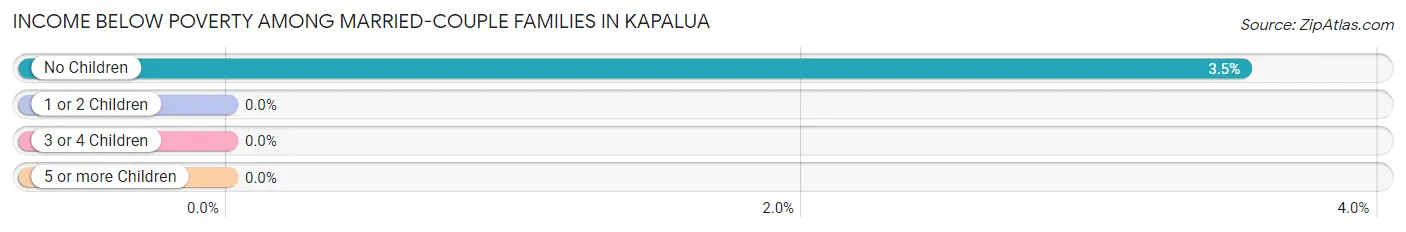
| Children | Above Poverty | Below Poverty |
| No Children | 82 (96.5%) | 3 (3.5%) |
| 1 or 2 Children | 19 (100.0%) | 0 (0.0%) |
| 3 or 4 Children | 7 (100.0%) | 0 (0.0%) |
| 5 or more Children | 0 (0.0%) | 0 (0.0%) |
| Total | 108 (97.3%) | 3 (2.7%) |
Income Below Poverty Among Single-Parent Households in Kapalua
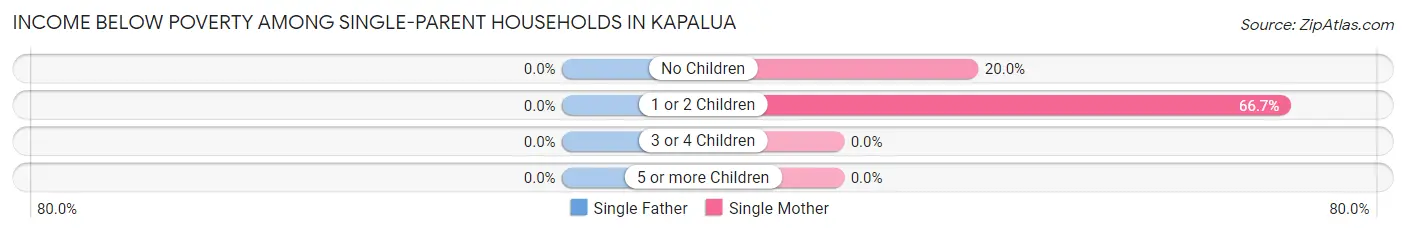
| Children | Single Father | Single Mother |
| No Children | 0 (0.0%) | 1 (20.0%) |
| 1 or 2 Children | 0 (0.0%) | 4 (66.7%) |
| 3 or 4 Children | 0 (0.0%) | 0 (0.0%) |
| 5 or more Children | 0 (0.0%) | 0 (0.0%) |
| Total | 0 (0.0%) | 5 (45.5%) |
Income Below Poverty Among Married-Couple vs Single-Parent Households in Kapalua
The poverty data for Kapalua shows that 3 of the married-couple family households (2.7%) and 5 of the single-parent households (45.5%) are living below the poverty level. Within the married-couple family households, those with no children have the highest poverty rate, with 3 households (3.5%) falling below the poverty line. Among the single-parent households, those with 1 or 2 children have the highest poverty rate, with 4 household (66.7%) living below poverty.
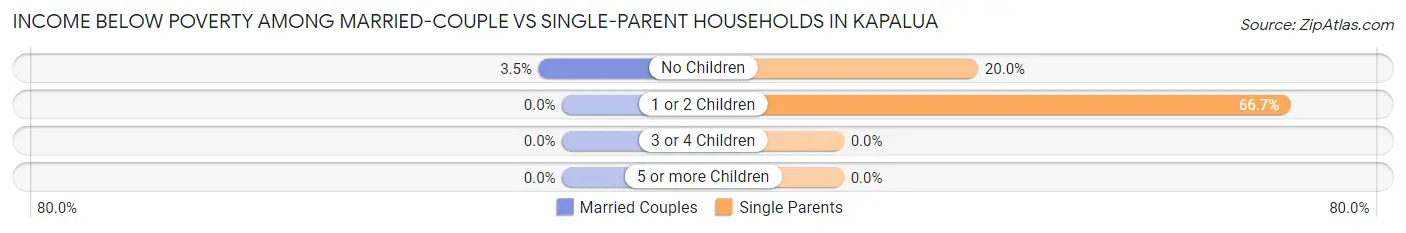
| Children | Married-Couple Families | Single-Parent Households |
| No Children | 3 (3.5%) | 1 (20.0%) |
| 1 or 2 Children | 0 (0.0%) | 4 (66.7%) |
| 3 or 4 Children | 0 (0.0%) | 0 (0.0%) |
| 5 or more Children | 0 (0.0%) | 0 (0.0%) |
| Total | 3 (2.7%) | 5 (45.5%) |
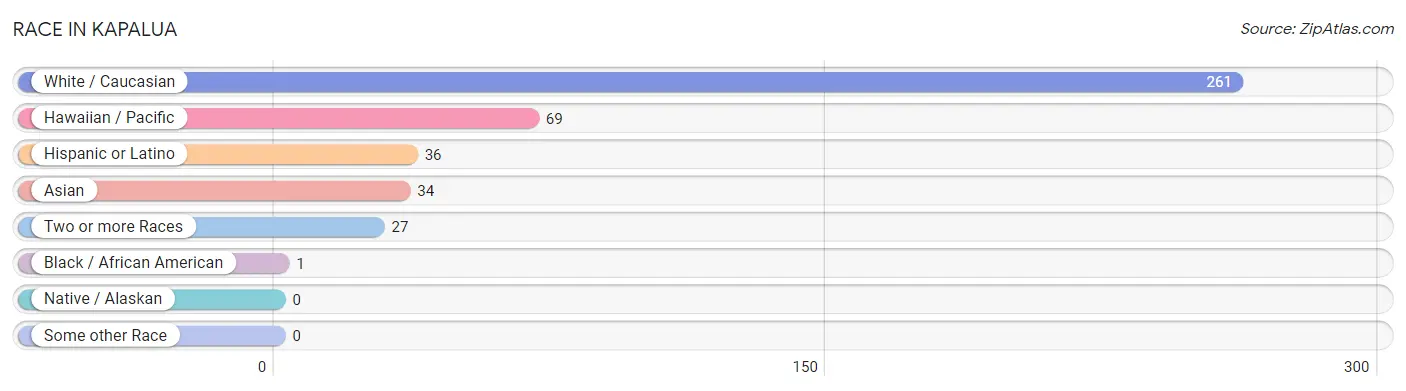
Race in Kapalua
The most populous races in Kapalua are White / Caucasian (261 | 66.6%), Hawaiian / Pacific (69 | 17.6%), and Hispanic or Latino (36 | 9.2%).
| Race | # Population | % Population |
| Asian | 34 | 8.7% |
| Black / African American | 1 | 0.3% |
| Hawaiian / Pacific | 69 | 17.6% |
| Hispanic or Latino | 36 | 9.2% |
| Native / Alaskan | 0 | 0.0% |
| White / Caucasian | 261 | 66.6% |
| Two or more Races | 27 | 6.9% |
| Some other Race | 0 | 0.0% |
| Total | 392 | 100.0% |
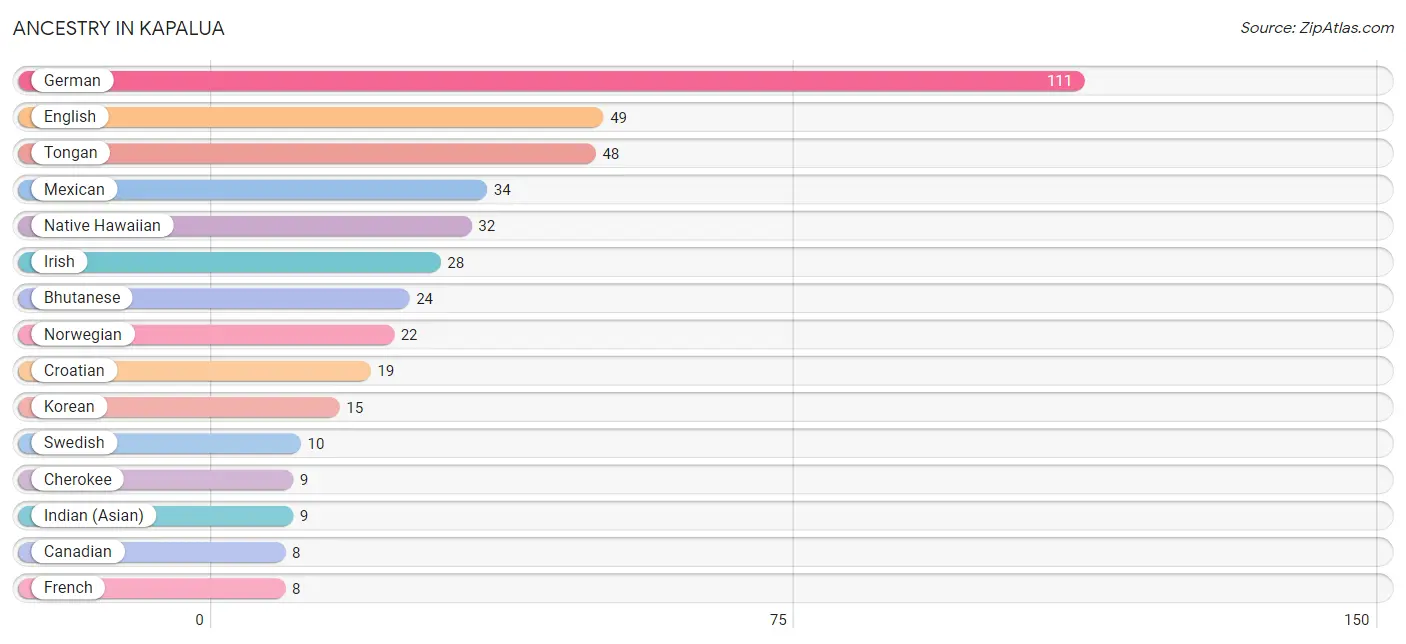
Ancestry in Kapalua
The most populous ancestries reported in Kapalua are German (111 | 28.3%), English (49 | 12.5%), Tongan (48 | 12.2%), Mexican (34 | 8.7%), and Native Hawaiian (32 | 8.2%), together accounting for 69.9% of all Kapalua residents.
| Ancestry | # Population | % Population |
| American | 6 | 1.5% |
| Arab | 3 | 0.8% |
| Bhutanese | 24 | 6.1% |
| Burmese | 3 | 0.8% |
| Cambodian | 2 | 0.5% |
| Canadian | 8 | 2.0% |
| Cherokee | 9 | 2.3% |
| Croatian | 19 | 4.9% |
| Cuban | 2 | 0.5% |
| Czech | 4 | 1.0% |
| Czechoslovakian | 1 | 0.3% |
| Dutch | 3 | 0.8% |
| English | 49 | 12.5% |
| European | 5 | 1.3% |
| Finnish | 1 | 0.3% |
| French | 8 | 2.0% |
| French Canadian | 2 | 0.5% |
| German | 111 | 28.3% |
| Hungarian | 4 | 1.0% |
| Indian (Asian) | 9 | 2.3% |
| Irish | 28 | 7.1% |
| Italian | 5 | 1.3% |
| Korean | 15 | 3.8% |
| Latvian | 1 | 0.3% |
| Mexican | 34 | 8.7% |
| Native Hawaiian | 32 | 8.2% |
| Norwegian | 22 | 5.6% |
| Polish | 4 | 1.0% |
| Portuguese | 1 | 0.3% |
| Russian | 8 | 2.0% |
| Scotch-Irish | 2 | 0.5% |
| Scottish | 6 | 1.5% |
| Sioux | 1 | 0.3% |
| Slovene | 4 | 1.0% |
| Swedish | 10 | 2.5% |
| Syrian | 2 | 0.5% |
| Tongan | 48 | 12.2% |
| Ukrainian | 2 | 0.5% |
| Yaqui | 1 | 0.3% | View All 39 Rows |
Immigrants in Kapalua
The most numerous immigrant groups reported in Kapalua came from Canada (10 | 2.5%), Asia (7 | 1.8%), Latin America (5 | 1.3%), Eastern Asia (4 | 1.0%), and Europe (4 | 1.0%), together accounting for 7.7% of all Kapalua residents.
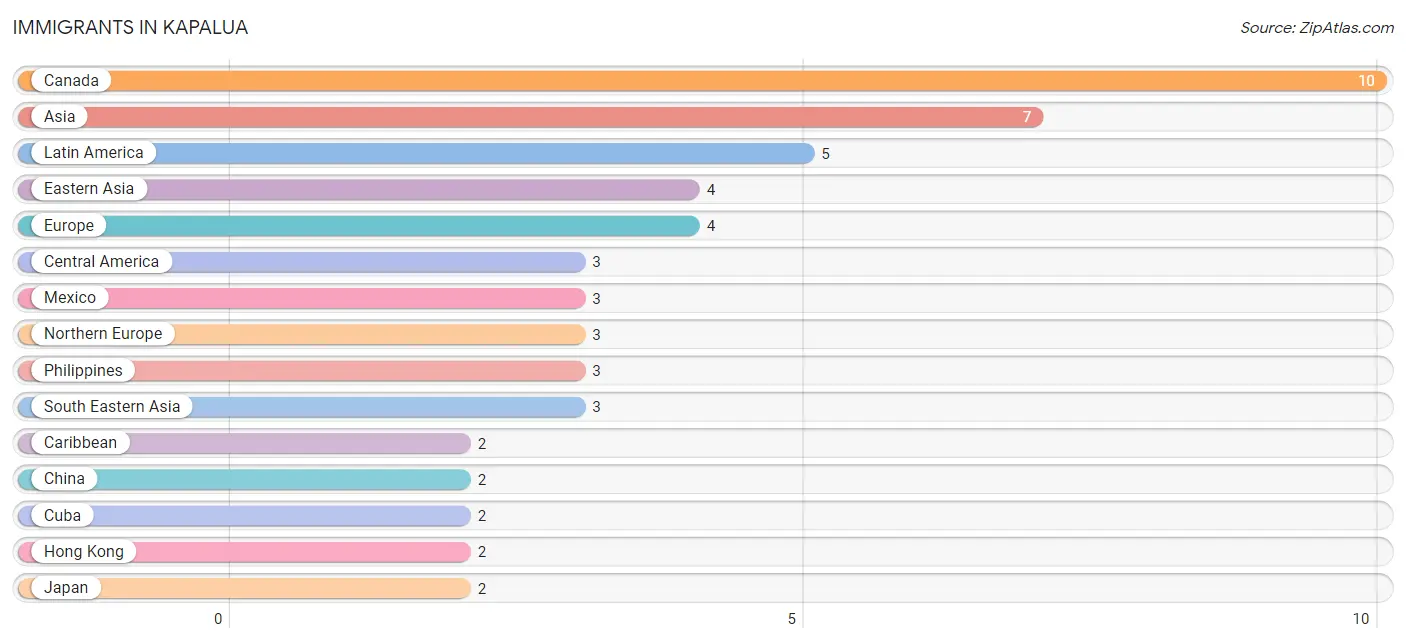
| Immigration Origin | # Population | % Population |
| Asia | 7 | 1.8% |
| Canada | 10 | 2.5% |
| Caribbean | 2 | 0.5% |
| Central America | 3 | 0.8% |
| China | 2 | 0.5% |
| Cuba | 2 | 0.5% |
| Eastern Asia | 4 | 1.0% |
| Eastern Europe | 1 | 0.3% |
| England | 1 | 0.3% |
| Europe | 4 | 1.0% |
| Hong Kong | 2 | 0.5% |
| Japan | 2 | 0.5% |
| Latin America | 5 | 1.3% |
| Mexico | 3 | 0.8% |
| Northern Europe | 3 | 0.8% |
| Philippines | 3 | 0.8% |
| Poland | 1 | 0.3% |
| Scotland | 2 | 0.5% |
| South Eastern Asia | 3 | 0.8% | View All 19 Rows |
Sex and Age in Kapalua
Sex and Age in Kapalua
The most populous age groups in Kapalua are 65 to 69 Years (34 | 16.2%) for men and 65 to 69 Years (34 | 18.7%) for women.
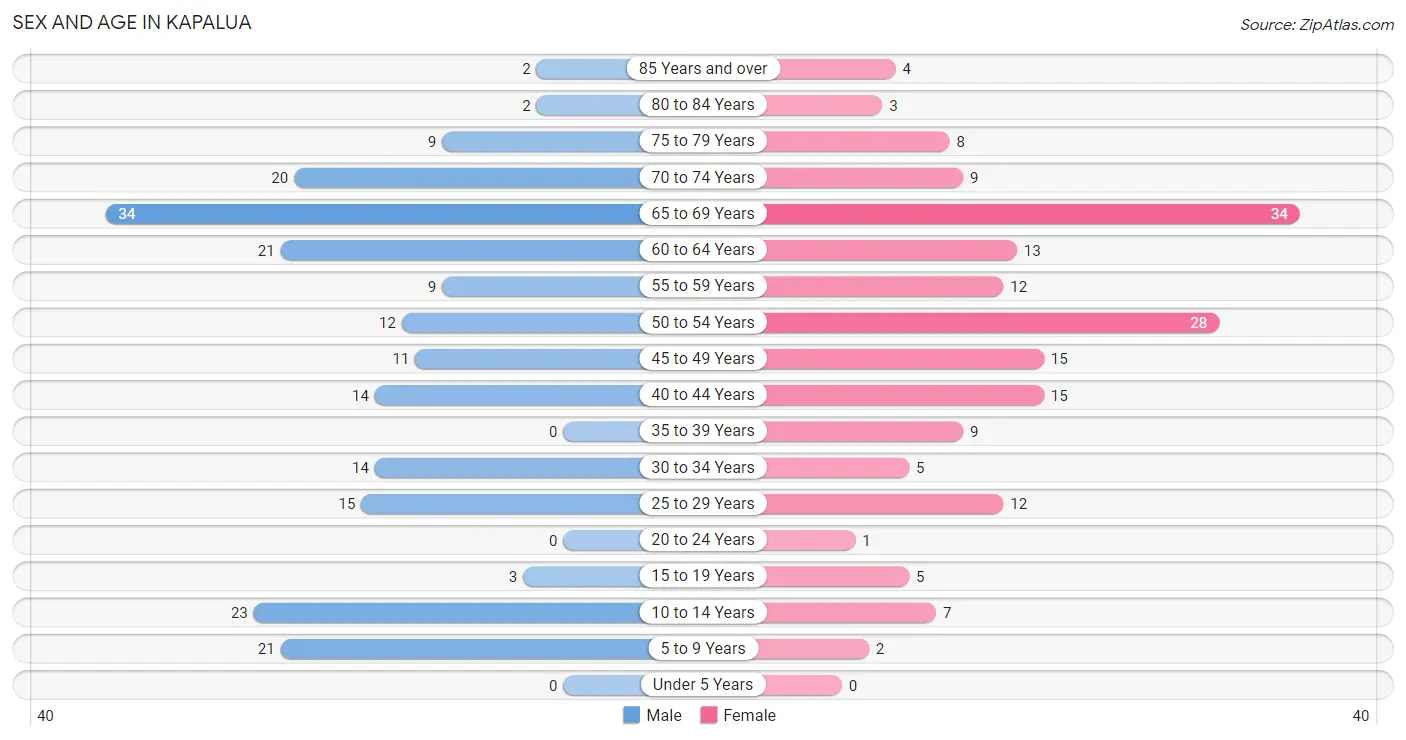
| Age Bracket | Male | Female |
| Under 5 Years | 0 (0.0%) | 0 (0.0%) |
| 5 to 9 Years | 21 (10.0%) | 2 (1.1%) |
| 10 to 14 Years | 23 (11.0%) | 7 (3.8%) |
| 15 to 19 Years | 3 (1.4%) | 5 (2.8%) |
| 20 to 24 Years | 0 (0.0%) | 1 (0.5%) |
| 25 to 29 Years | 15 (7.1%) | 12 (6.6%) |
| 30 to 34 Years | 14 (6.7%) | 5 (2.8%) |
| 35 to 39 Years | 0 (0.0%) | 9 (5.0%) |
| 40 to 44 Years | 14 (6.7%) | 15 (8.2%) |
| 45 to 49 Years | 11 (5.2%) | 15 (8.2%) |
| 50 to 54 Years | 12 (5.7%) | 28 (15.4%) |
| 55 to 59 Years | 9 (4.3%) | 12 (6.6%) |
| 60 to 64 Years | 21 (10.0%) | 13 (7.1%) |
| 65 to 69 Years | 34 (16.2%) | 34 (18.7%) |
| 70 to 74 Years | 20 (9.5%) | 9 (5.0%) |
| 75 to 79 Years | 9 (4.3%) | 8 (4.4%) |
| 80 to 84 Years | 2 (0.9%) | 3 (1.7%) |
| 85 Years and over | 2 (0.9%) | 4 (2.2%) |
| Total | 210 (100.0%) | 182 (100.0%) |
Families and Households in Kapalua
Median Family Size in Kapalua
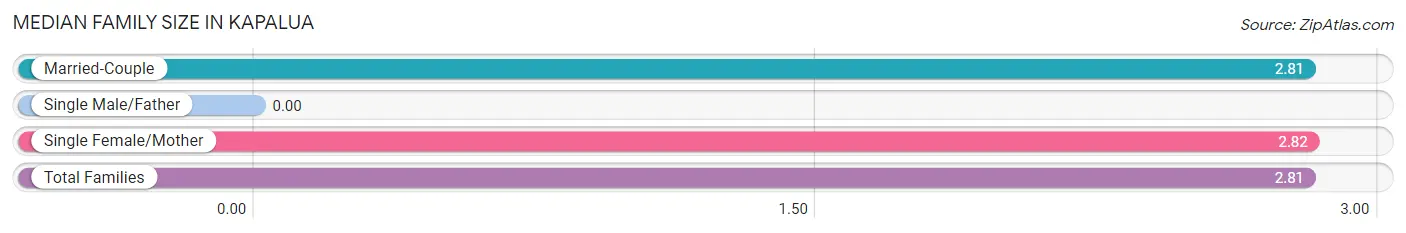
| Family Type | # Families | Family Size |
| Married-Couple | 111 (91.0%) | 2.81 |
| Single Male/Father | 0 (0.0%) | - |
| Single Female/Mother | 11 (9.0%) | 2.82 |
| Total Families | 122 (100.0%) | 2.81 |
Median Household Size in Kapalua
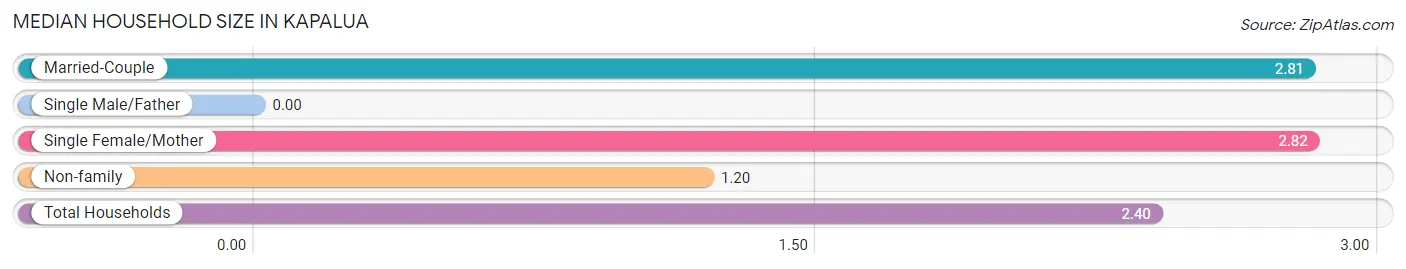
| Household Type | # Households | Household Size |
| Married-Couple | 111 (68.1%) | 2.81 |
| Single Male/Father | 0 (0.0%) | - |
| Single Female/Mother | 11 (6.8%) | 2.82 |
| Non-family | 41 (25.2%) | 1.20 |
| Total Households | 163 (100.0%) | 2.40 |
Household Size by Marriage Status in Kapalua
Out of a total of 163 households in Kapalua, 122 (74.9%) are family households, while 41 (25.2%) are nonfamily households. The most numerous type of family households are 2-person households, comprising 75, and the most common type of nonfamily households are 1-person households, comprising 32.
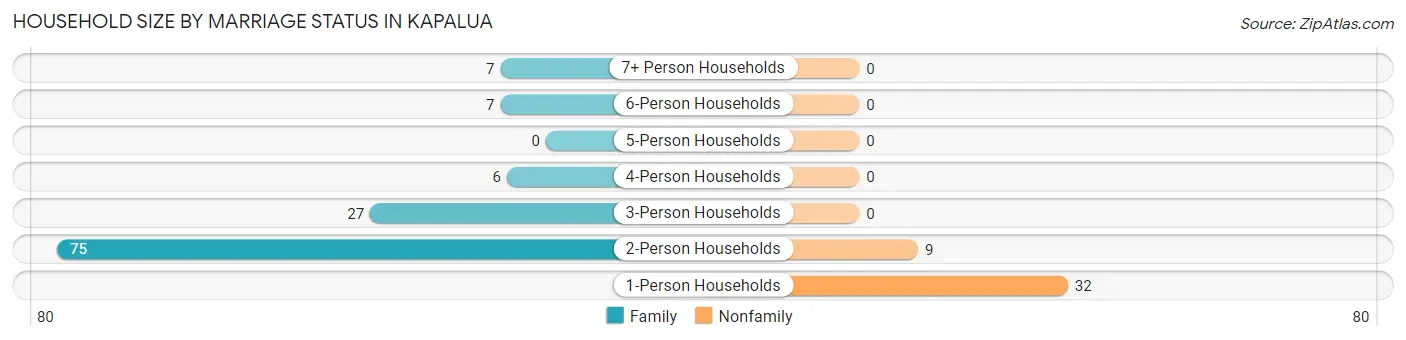
| Household Size | Family Households | Nonfamily Households |
| 1-Person Households | - | 32 (19.6%) |
| 2-Person Households | 75 (46.0%) | 9 (5.5%) |
| 3-Person Households | 27 (16.6%) | 0 (0.0%) |
| 4-Person Households | 6 (3.7%) | 0 (0.0%) |
| 5-Person Households | 0 (0.0%) | 0 (0.0%) |
| 6-Person Households | 7 (4.3%) | 0 (0.0%) |
| 7+ Person Households | 7 (4.3%) | 0 (0.0%) |
| Total | 122 (74.9%) | 41 (25.2%) |
Female Fertility in Kapalua
Fertility by Age in Kapalua
| Age Bracket | Women with Births | Births / 1,000 Women |
| 15 to 19 years | 0 (0.0%) | 0.0 |
| 20 to 34 years | 0 (0.0%) | 0.0 |
| 35 to 50 years | 0 (0.0%) | 0.0 |
| Total | 0 (0.0%) | 0.0 |
Fertility by Age by Marriage Status in Kapalua
| Age Bracket | Married | Unmarried |
| 15 to 19 years | 0 (0.0%) | 0 (0.0%) |
| 20 to 34 years | 0 (0.0%) | 0 (0.0%) |
| 35 to 50 years | 0 (0.0%) | 0 (0.0%) |
| Total | 0 (0.0%) | 0 (0.0%) |
Fertility by Education in Kapalua
| Educational Attainment | Women with Births | Births / 1,000 Women |
| Less than High School | 0 (0.0%) | 0.0 |
| High School Diploma | 0 (0.0%) | 0.0 |
| College or Associate's Degree | 0 (0.0%) | 0.0 |
| Bachelor's Degree | 0 (0.0%) | 0.0 |
| Graduate Degree | 0 (0.0%) | 0.0 |
| Total | 0 (0.0%) | 0.0 |
Fertility by Education by Marriage Status in Kapalua
| Educational Attainment | Married | Unmarried |
| Less than High School | 0 (0.0%) | 0 (0.0%) |
| High School Diploma | 0 (0.0%) | 0 (0.0%) |
| College or Associate's Degree | 0 (0.0%) | 0 (0.0%) |
| Bachelor's Degree | 0 (0.0%) | 0 (0.0%) |
| Graduate Degree | 0 (0.0%) | 0 (0.0%) |
| Total | 0 (0.0%) | 0 (0.0%) |
Employment Characteristics in Kapalua
Employment by Class of Employer in Kapalua
Among the 163 employed individuals in Kapalua, private company employees (114 | 69.9%), self-employed (not incorporated) (23 | 14.1%), and not-for-profit organizations (12 | 7.4%) make up the most common classes of employment.
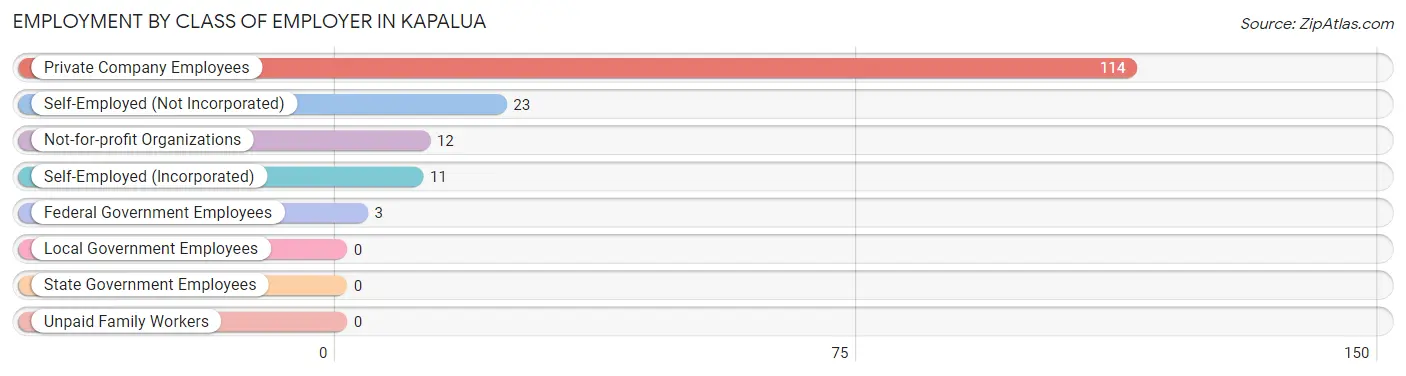
| Employer Class | # Employees | % Employees |
| Private Company Employees | 114 | 69.9% |
| Self-Employed (Incorporated) | 11 | 6.8% |
| Self-Employed (Not Incorporated) | 23 | 14.1% |
| Not-for-profit Organizations | 12 | 7.4% |
| Local Government Employees | 0 | 0.0% |
| State Government Employees | 0 | 0.0% |
| Federal Government Employees | 3 | 1.8% |
| Unpaid Family Workers | 0 | 0.0% |
| Total | 163 | 100.0% |
Employment Status by Age in Kapalua
According to the labor force statistics for Kapalua, out of the total population over 16 years of age (338), 55.9% or 189 individuals are in the labor force, with 4.2% or 8 of them unemployed. The age group with the highest labor force participation rate is 25 to 29 years, with 96.3% or 26 individuals in the labor force. Within the labor force, the 55 to 59 years age range has the highest percentage of unemployed individuals, with 20.0% or 2 of them being unemployed.
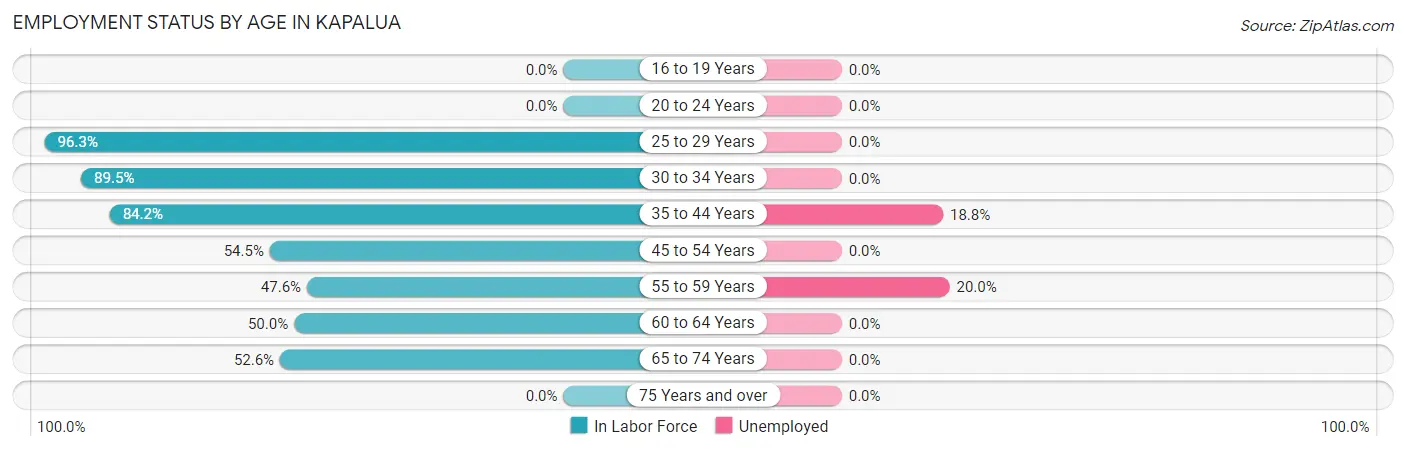
| Age Bracket | In Labor Force | Unemployed |
| 16 to 19 Years | 0 (0.0%) | 0 (0.0%) |
| 20 to 24 Years | 0 (0.0%) | 0 (0.0%) |
| 25 to 29 Years | 26 (96.3%) | 0 (0.0%) |
| 30 to 34 Years | 17 (89.5%) | 0 (0.0%) |
| 35 to 44 Years | 32 (84.2%) | 6 (18.8%) |
| 45 to 54 Years | 36 (54.5%) | 0 (0.0%) |
| 55 to 59 Years | 10 (47.6%) | 2 (20.0%) |
| 60 to 64 Years | 17 (50.0%) | 0 (0.0%) |
| 65 to 74 Years | 51 (52.6%) | 0 (0.0%) |
| 75 Years and over | 0 (0.0%) | 0 (0.0%) |
| Total | 189 (55.9%) | 8 (4.2%) |
Employment Status by Educational Attainment in Kapalua
According to labor force statistics for Kapalua, 67.3% of individuals (138) out of the total population between 25 and 64 years of age (205) are in the labor force, with 5.8% or 8 of them being unemployed. The group with the highest labor force participation rate are those with the educational attainment of high school diploma, with 82.4% or 61 individuals in the labor force. Within the labor force, individuals with college / associate degree education have the highest percentage of unemployment, with 12.8% or 6 of them being unemployed.
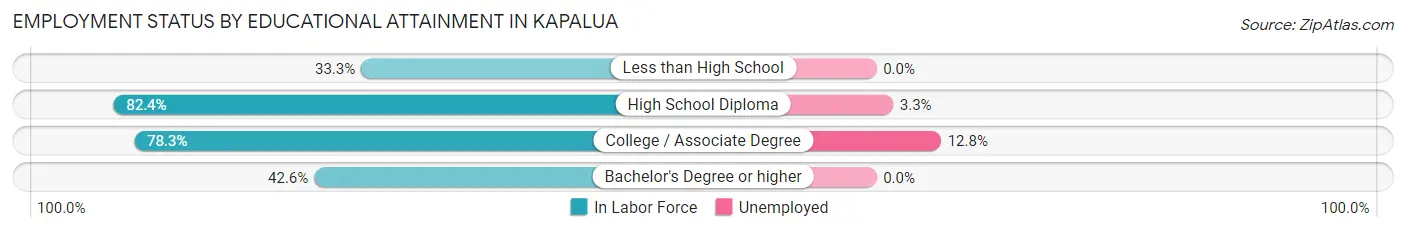
| Educational Attainment | In Labor Force | Unemployed |
| Less than High School | 1 (33.3%) | 0 (0.0%) |
| High School Diploma | 61 (82.4%) | 2 (3.3%) |
| College / Associate Degree | 47 (78.3%) | 8 (12.8%) |
| Bachelor's Degree or higher | 29 (42.6%) | 0 (0.0%) |
| Total | 138 (67.3%) | 12 (5.8%) |
Employment Occupations by Sex in Kapalua
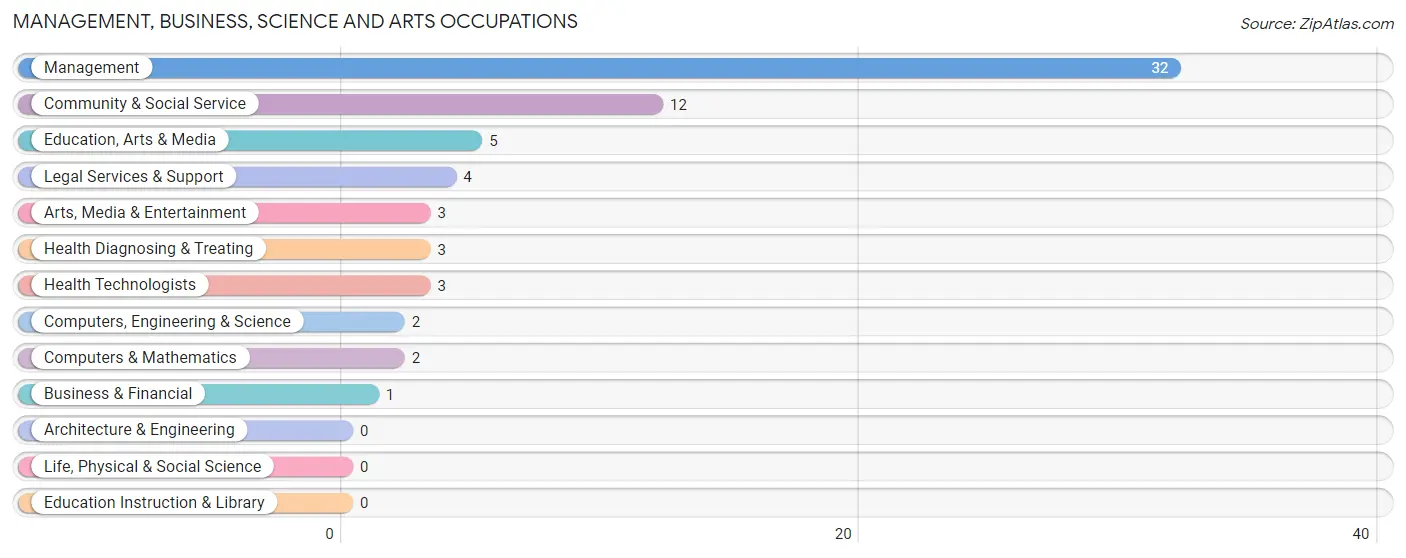
Management, Business, Science and Arts Occupations
The most common Management, Business, Science and Arts occupations in Kapalua are Management (32 | 17.7%), Community & Social Service (12 | 6.6%), Education, Arts & Media (5 | 2.8%), Legal Services & Support (4 | 2.2%), and Arts, Media & Entertainment (3 | 1.7%).
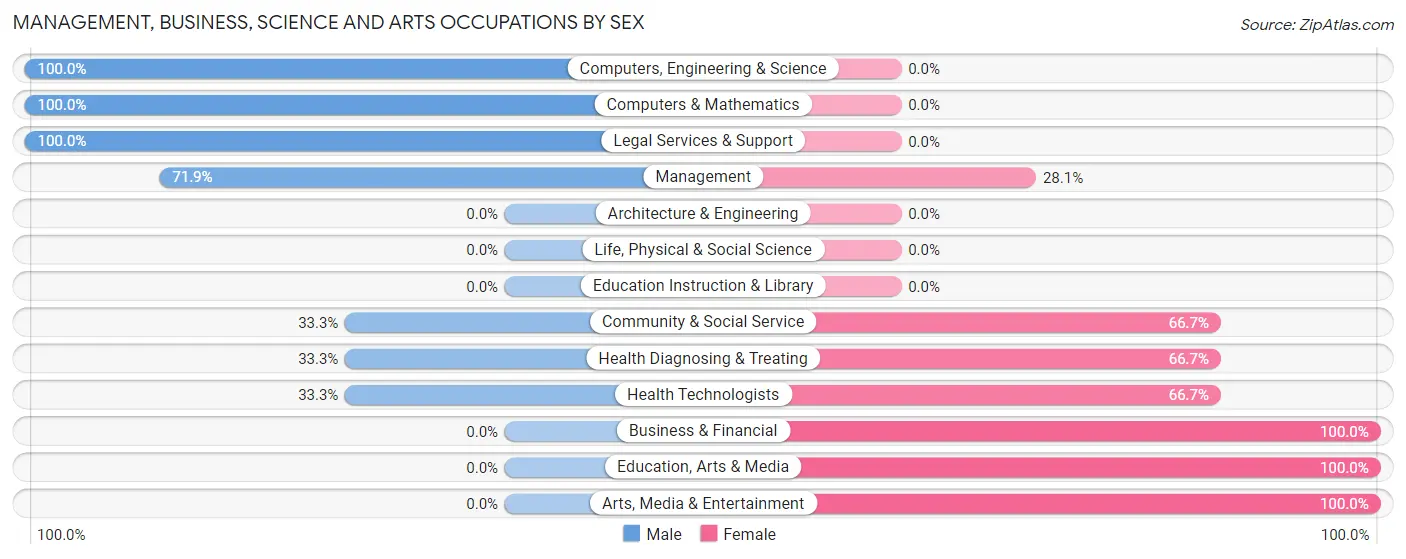
Management, Business, Science and Arts Occupations by Sex
Within the Management, Business, Science and Arts occupations in Kapalua, the most male-oriented occupations are Computers, Engineering & Science (100.0%), Computers & Mathematics (100.0%), and Legal Services & Support (100.0%), while the most female-oriented occupations are Business & Financial (100.0%), Education, Arts & Media (100.0%), and Arts, Media & Entertainment (100.0%).
| Occupation | Male | Female |
| Management | 23 (71.9%) | 9 (28.1%) |
| Business & Financial | 0 (0.0%) | 1 (100.0%) |
| Computers, Engineering & Science | 2 (100.0%) | 0 (0.0%) |
| Computers & Mathematics | 2 (100.0%) | 0 (0.0%) |
| Architecture & Engineering | 0 (0.0%) | 0 (0.0%) |
| Life, Physical & Social Science | 0 (0.0%) | 0 (0.0%) |
| Community & Social Service | 4 (33.3%) | 8 (66.7%) |
| Education, Arts & Media | 0 (0.0%) | 5 (100.0%) |
| Legal Services & Support | 4 (100.0%) | 0 (0.0%) |
| Education Instruction & Library | 0 (0.0%) | 0 (0.0%) |
| Arts, Media & Entertainment | 0 (0.0%) | 3 (100.0%) |
| Health Diagnosing & Treating | 1 (33.3%) | 2 (66.7%) |
| Health Technologists | 1 (33.3%) | 2 (66.7%) |
| Total (Category) | 30 (60.0%) | 20 (40.0%) |
| Total (Overall) | 92 (50.8%) | 89 (49.2%) |
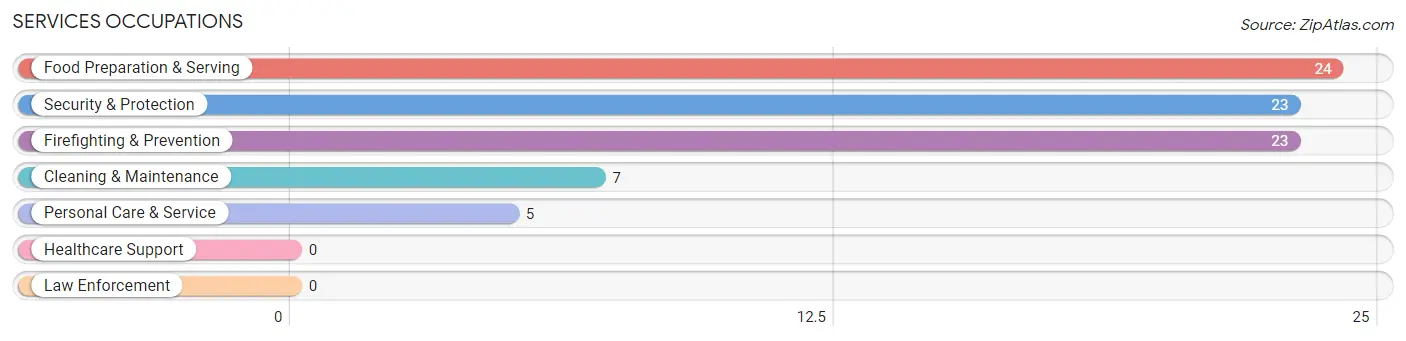
Services Occupations
The most common Services occupations in Kapalua are Food Preparation & Serving (24 | 13.3%), Security & Protection (23 | 12.7%), Firefighting & Prevention (23 | 12.7%), Cleaning & Maintenance (7 | 3.9%), and Personal Care & Service (5 | 2.8%).
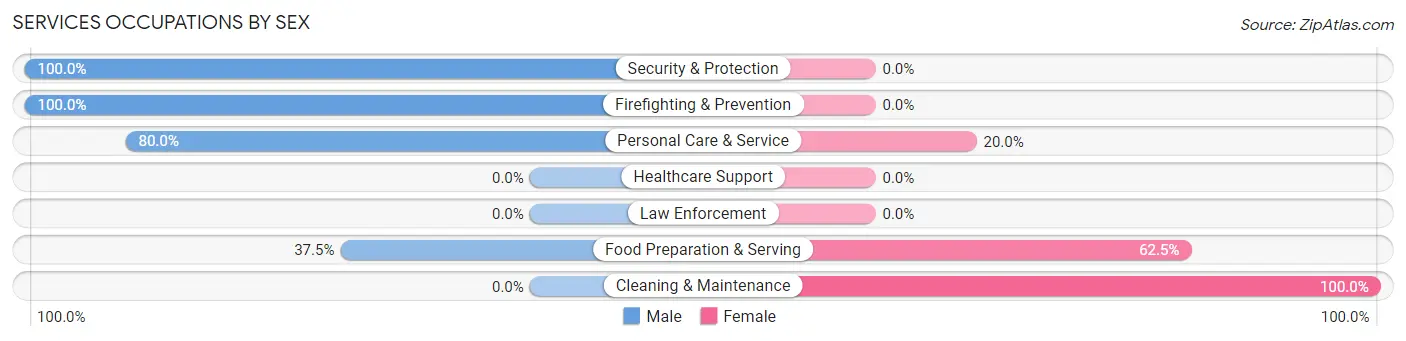
Services Occupations by Sex
Within the Services occupations in Kapalua, the most male-oriented occupations are Security & Protection (100.0%), Firefighting & Prevention (100.0%), and Personal Care & Service (80.0%), while the most female-oriented occupations are Cleaning & Maintenance (100.0%), Food Preparation & Serving (62.5%), and Personal Care & Service (20.0%).
| Occupation | Male | Female |
| Healthcare Support | 0 (0.0%) | 0 (0.0%) |
| Security & Protection | 23 (100.0%) | 0 (0.0%) |
| Firefighting & Prevention | 23 (100.0%) | 0 (0.0%) |
| Law Enforcement | 0 (0.0%) | 0 (0.0%) |
| Food Preparation & Serving | 9 (37.5%) | 15 (62.5%) |
| Cleaning & Maintenance | 0 (0.0%) | 7 (100.0%) |
| Personal Care & Service | 4 (80.0%) | 1 (20.0%) |
| Total (Category) | 36 (61.0%) | 23 (39.0%) |
| Total (Overall) | 92 (50.8%) | 89 (49.2%) |
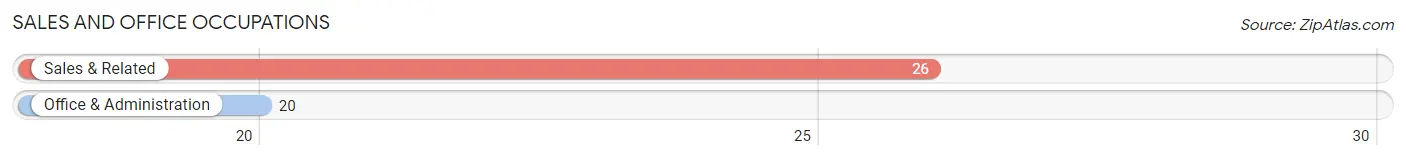
Sales and Office Occupations
The most common Sales and Office occupations in Kapalua are Sales & Related (26 | 14.4%), and Office & Administration (20 | 11.1%).
Sales and Office Occupations by Sex
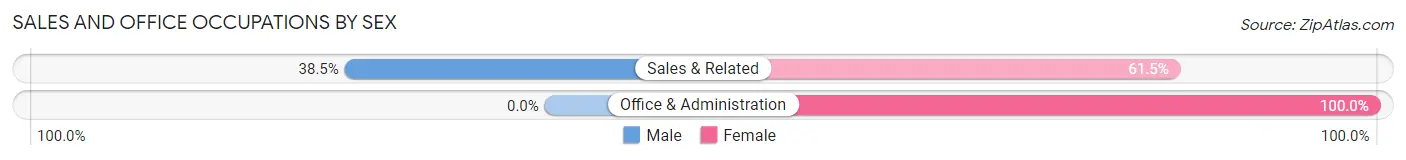
| Occupation | Male | Female |
| Sales & Related | 10 (38.5%) | 16 (61.5%) |
| Office & Administration | 0 (0.0%) | 20 (100.0%) |
| Total (Category) | 10 (21.7%) | 36 (78.3%) |
| Total (Overall) | 92 (50.8%) | 89 (49.2%) |
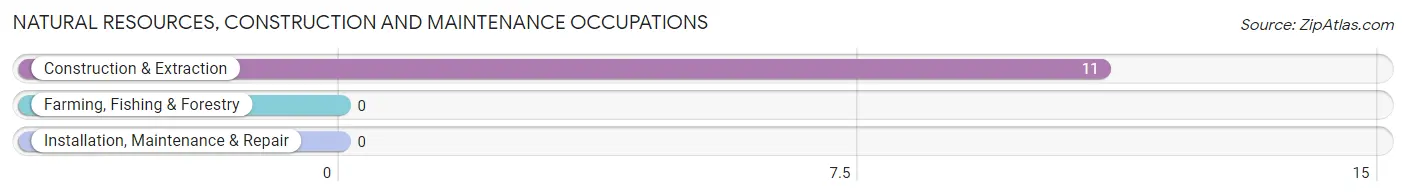
Natural Resources, Construction and Maintenance Occupations
The most common Natural Resources, Construction and Maintenance occupations in Kapalua are , and Construction & Extraction (11 | 6.1%).
Natural Resources, Construction and Maintenance Occupations by Sex
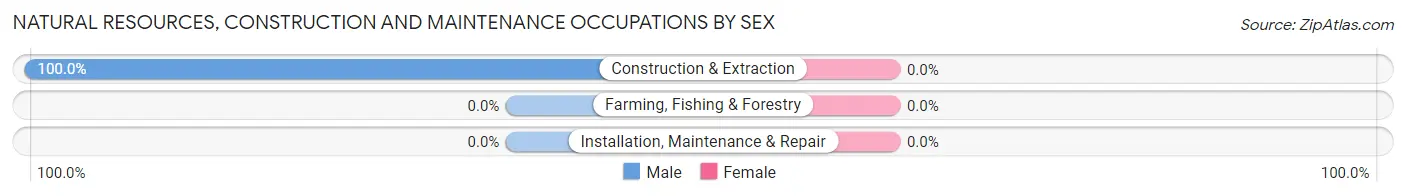
| Occupation | Male | Female |
| Farming, Fishing & Forestry | 0 (0.0%) | 0 (0.0%) |
| Construction & Extraction | 11 (100.0%) | 0 (0.0%) |
| Installation, Maintenance & Repair | 0 (0.0%) | 0 (0.0%) |
| Total (Category) | 11 (100.0%) | 0 (0.0%) |
| Total (Overall) | 92 (50.8%) | 89 (49.2%) |
Production, Transportation and Moving Occupations
The most common Production, Transportation and Moving occupations in Kapalua are Transportation (10 | 5.5%), and Production (5 | 2.8%).
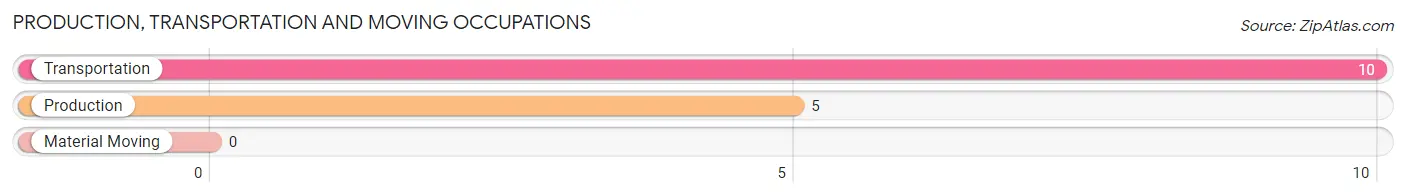
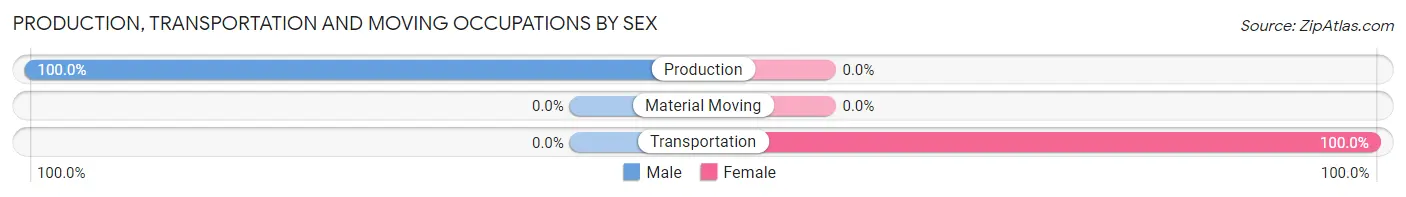
Production, Transportation and Moving Occupations by Sex
| Occupation | Male | Female |
| Production | 5 (100.0%) | 0 (0.0%) |
| Transportation | 0 (0.0%) | 10 (100.0%) |
| Material Moving | 0 (0.0%) | 0 (0.0%) |
| Total (Category) | 5 (33.3%) | 10 (66.7%) |
| Total (Overall) | 92 (50.8%) | 89 (49.2%) |
Employment Industries by Sex in Kapalua
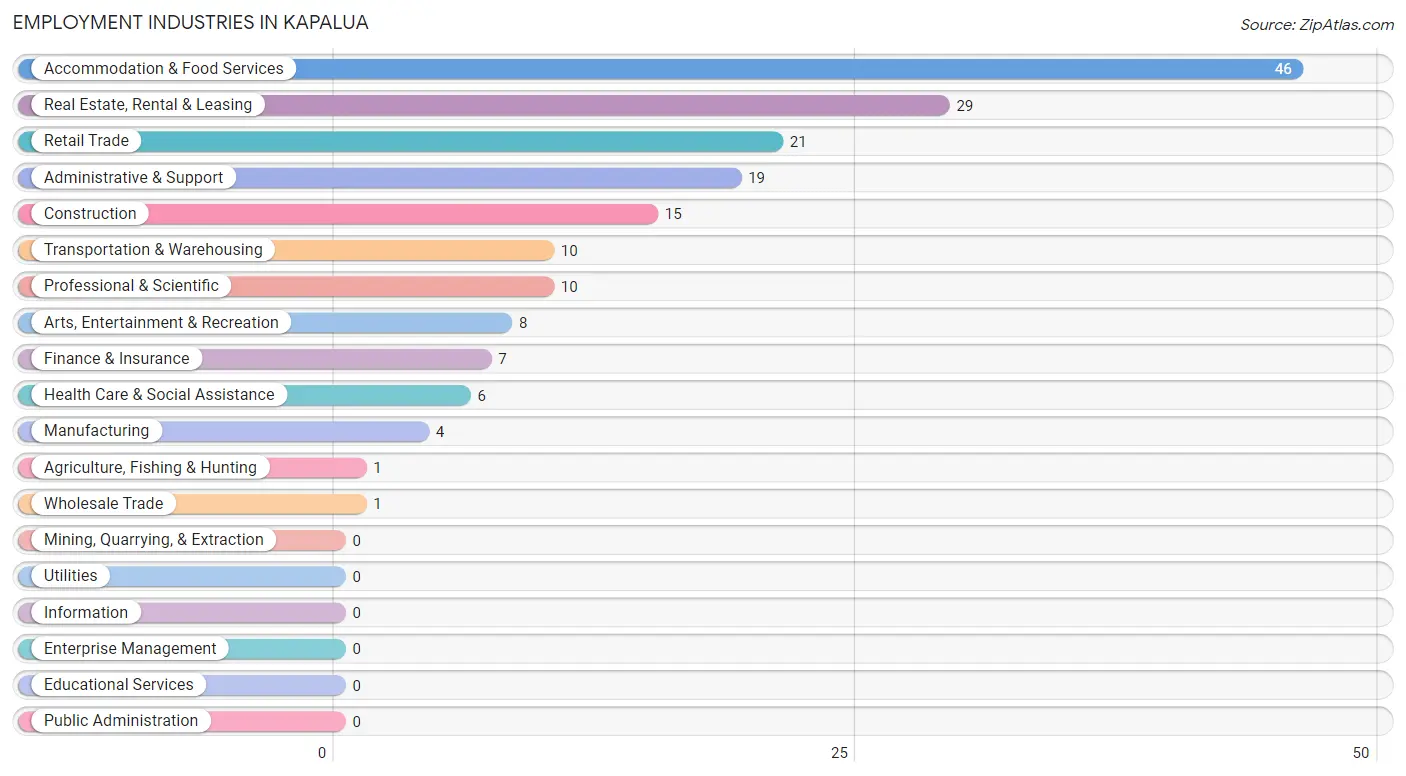
Employment Industries in Kapalua
The major employment industries in Kapalua include Accommodation & Food Services (46 | 25.4%), Real Estate, Rental & Leasing (29 | 16.0%), Retail Trade (21 | 11.6%), Administrative & Support (19 | 10.5%), and Construction (15 | 8.3%).
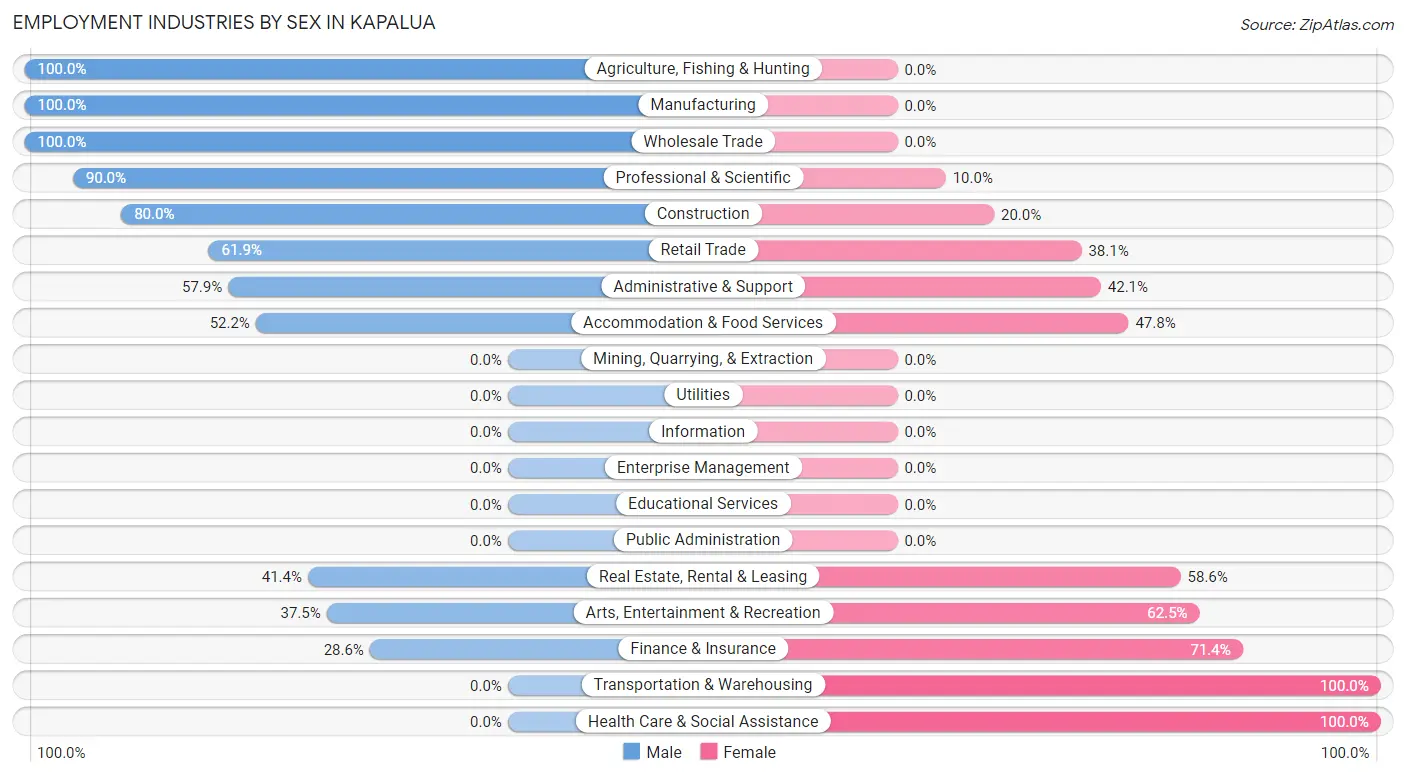
Employment Industries by Sex in Kapalua
The Kapalua industries that see more men than women are Agriculture, Fishing & Hunting (100.0%), Manufacturing (100.0%), and Wholesale Trade (100.0%), whereas the industries that tend to have a higher number of women are Transportation & Warehousing (100.0%), Health Care & Social Assistance (100.0%), and Finance & Insurance (71.4%).
| Industry | Male | Female |
| Agriculture, Fishing & Hunting | 1 (100.0%) | 0 (0.0%) |
| Mining, Quarrying, & Extraction | 0 (0.0%) | 0 (0.0%) |
| Construction | 12 (80.0%) | 3 (20.0%) |
| Manufacturing | 4 (100.0%) | 0 (0.0%) |
| Wholesale Trade | 1 (100.0%) | 0 (0.0%) |
| Retail Trade | 13 (61.9%) | 8 (38.1%) |
| Transportation & Warehousing | 0 (0.0%) | 10 (100.0%) |
| Utilities | 0 (0.0%) | 0 (0.0%) |
| Information | 0 (0.0%) | 0 (0.0%) |
| Finance & Insurance | 2 (28.6%) | 5 (71.4%) |
| Real Estate, Rental & Leasing | 12 (41.4%) | 17 (58.6%) |
| Professional & Scientific | 9 (90.0%) | 1 (10.0%) |
| Enterprise Management | 0 (0.0%) | 0 (0.0%) |
| Administrative & Support | 11 (57.9%) | 8 (42.1%) |
| Educational Services | 0 (0.0%) | 0 (0.0%) |
| Health Care & Social Assistance | 0 (0.0%) | 6 (100.0%) |
| Arts, Entertainment & Recreation | 3 (37.5%) | 5 (62.5%) |
| Accommodation & Food Services | 24 (52.2%) | 22 (47.8%) |
| Public Administration | 0 (0.0%) | 0 (0.0%) |
| Total | 92 (50.8%) | 89 (49.2%) |
Education in Kapalua
School Enrollment in Kapalua
The most common levels of schooling among the 61 students in Kapalua are middle school (28 | 45.9%), elementary school (20 | 32.8%), and kindergarten (6 | 9.8%).
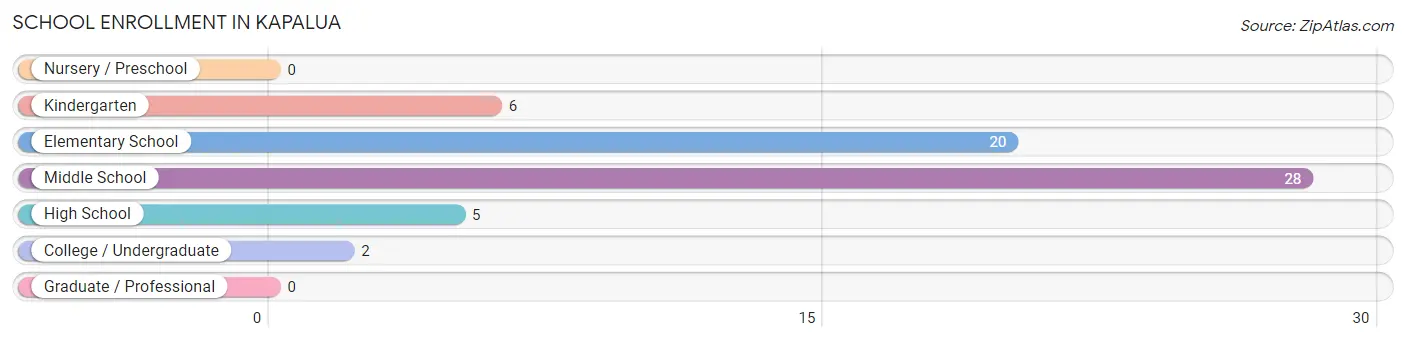
| School Level | # Students | % Students |
| Nursery / Preschool | 0 | 0.0% |
| Kindergarten | 6 | 9.8% |
| Elementary School | 20 | 32.8% |
| Middle School | 28 | 45.9% |
| High School | 5 | 8.2% |
| College / Undergraduate | 2 | 3.3% |
| Graduate / Professional | 0 | 0.0% |
| Total | 61 | 100.0% |
School Enrollment by Age by Funding Source in Kapalua
Out of a total of 61 students who are enrolled in schools in Kapalua, 27 (44.3%) attend a private institution, while the remaining 34 (55.7%) are enrolled in public schools. The age group of 15 to 17 year olds has the highest likelihood of being enrolled in private schools, with 6 (100.0% in the age bracket) enrolled. Conversely, the age group of 35 years and over has the lowest likelihood of being enrolled in a private school, with 2 (100.0% in the age bracket) attending a public institution.
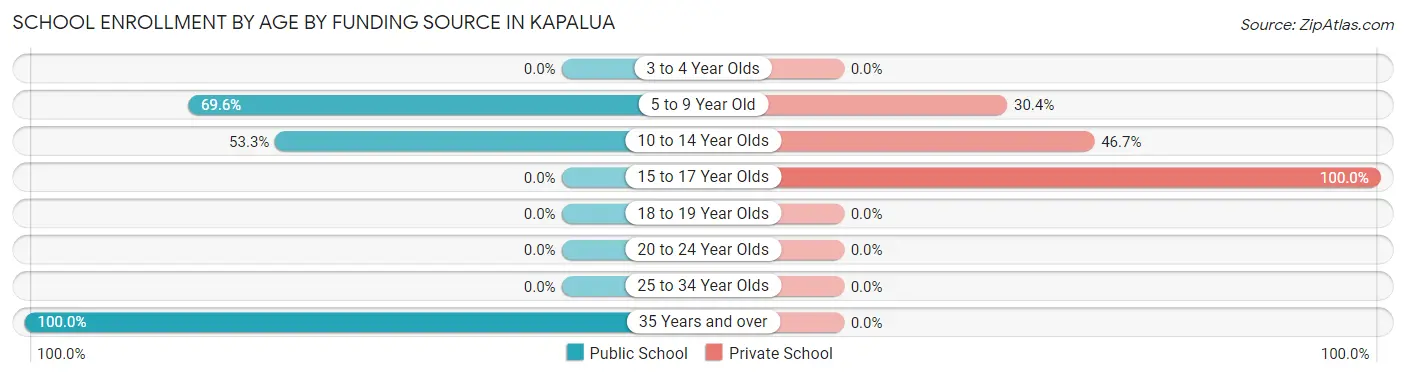
| Age Bracket | Public School | Private School |
| 3 to 4 Year Olds | 0 (0.0%) | 0 (0.0%) |
| 5 to 9 Year Old | 16 (69.6%) | 7 (30.4%) |
| 10 to 14 Year Olds | 16 (53.3%) | 14 (46.7%) |
| 15 to 17 Year Olds | 0 (0.0%) | 6 (100.0%) |
| 18 to 19 Year Olds | 0 (0.0%) | 0 (0.0%) |
| 20 to 24 Year Olds | 0 (0.0%) | 0 (0.0%) |
| 25 to 34 Year Olds | 0 (0.0%) | 0 (0.0%) |
| 35 Years and over | 2 (100.0%) | 0 (0.0%) |
| Total | 34 (55.7%) | 27 (44.3%) |
Educational Attainment by Field of Study in Kapalua
Business (30 | 20.7%), social sciences (16 | 11.0%), engineering (14 | 9.7%), psychology (12 | 8.3%), and bio, nature & agricultural (11 | 7.6%) are the most common fields of study among 145 individuals in Kapalua who have obtained a bachelor's degree or higher.
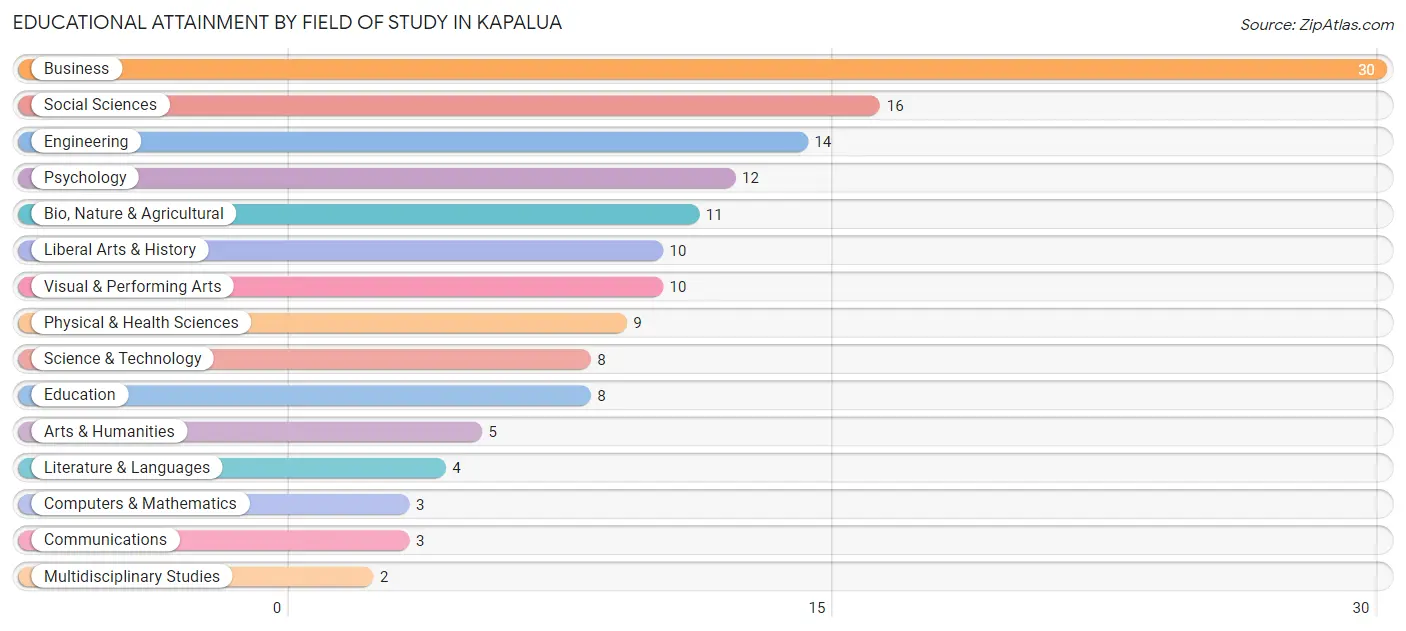
| Field of Study | # Graduates | % Graduates |
| Computers & Mathematics | 3 | 2.1% |
| Bio, Nature & Agricultural | 11 | 7.6% |
| Physical & Health Sciences | 9 | 6.2% |
| Psychology | 12 | 8.3% |
| Social Sciences | 16 | 11.0% |
| Engineering | 14 | 9.7% |
| Multidisciplinary Studies | 2 | 1.4% |
| Science & Technology | 8 | 5.5% |
| Business | 30 | 20.7% |
| Education | 8 | 5.5% |
| Literature & Languages | 4 | 2.8% |
| Liberal Arts & History | 10 | 6.9% |
| Visual & Performing Arts | 10 | 6.9% |
| Communications | 3 | 2.1% |
| Arts & Humanities | 5 | 3.5% |
| Total | 145 | 100.0% |
Transportation & Commute in Kapalua
Vehicle Availability by Sex in Kapalua
The most prevalent vehicle ownership categories in Kapalua are males with 1 vehicle (29, accounting for 32.6%) and females with 1 vehicle (27, making up 39.2%).
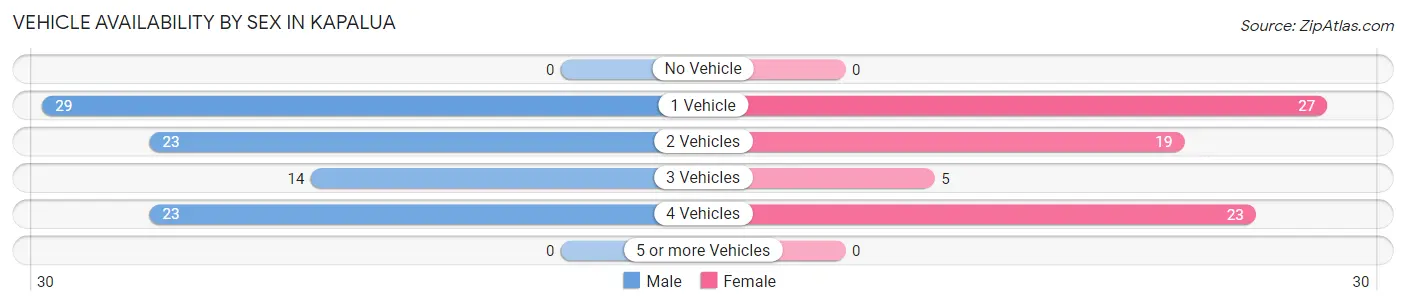
| Vehicles Available | Male | Female |
| No Vehicle | 0 (0.0%) | 0 (0.0%) |
| 1 Vehicle | 29 (32.6%) | 27 (36.5%) |
| 2 Vehicles | 23 (25.8%) | 19 (25.7%) |
| 3 Vehicles | 14 (15.7%) | 5 (6.8%) |
| 4 Vehicles | 23 (25.8%) | 23 (31.1%) |
| 5 or more Vehicles | 0 (0.0%) | 0 (0.0%) |
| Total | 89 (100.0%) | 74 (100.0%) |
Commute Time in Kapalua
The most frequently occuring commute durations in Kapalua are 10 to 14 minutes (48 commuters, 35.8%), 15 to 19 minutes (37 commuters, 27.6%), and 5 to 9 minutes (15 commuters, 11.2%).
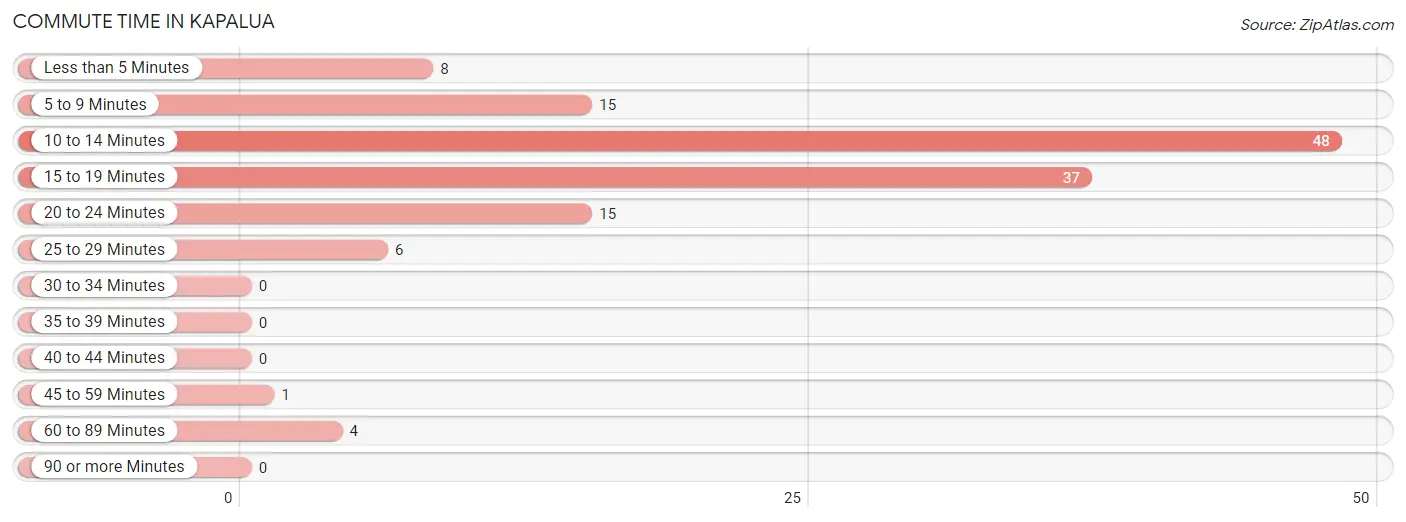
| Commute Time | # Commuters | % Commuters |
| Less than 5 Minutes | 8 | 6.0% |
| 5 to 9 Minutes | 15 | 11.2% |
| 10 to 14 Minutes | 48 | 35.8% |
| 15 to 19 Minutes | 37 | 27.6% |
| 20 to 24 Minutes | 15 | 11.2% |
| 25 to 29 Minutes | 6 | 4.5% |
| 30 to 34 Minutes | 0 | 0.0% |
| 35 to 39 Minutes | 0 | 0.0% |
| 40 to 44 Minutes | 0 | 0.0% |
| 45 to 59 Minutes | 1 | 0.7% |
| 60 to 89 Minutes | 4 | 3.0% |
| 90 or more Minutes | 0 | 0.0% |
Commute Time by Sex in Kapalua
The most common commute times in Kapalua are 10 to 14 minutes (31 commuters, 39.2%) for males and 15 to 19 minutes (21 commuters, 38.2%) for females.
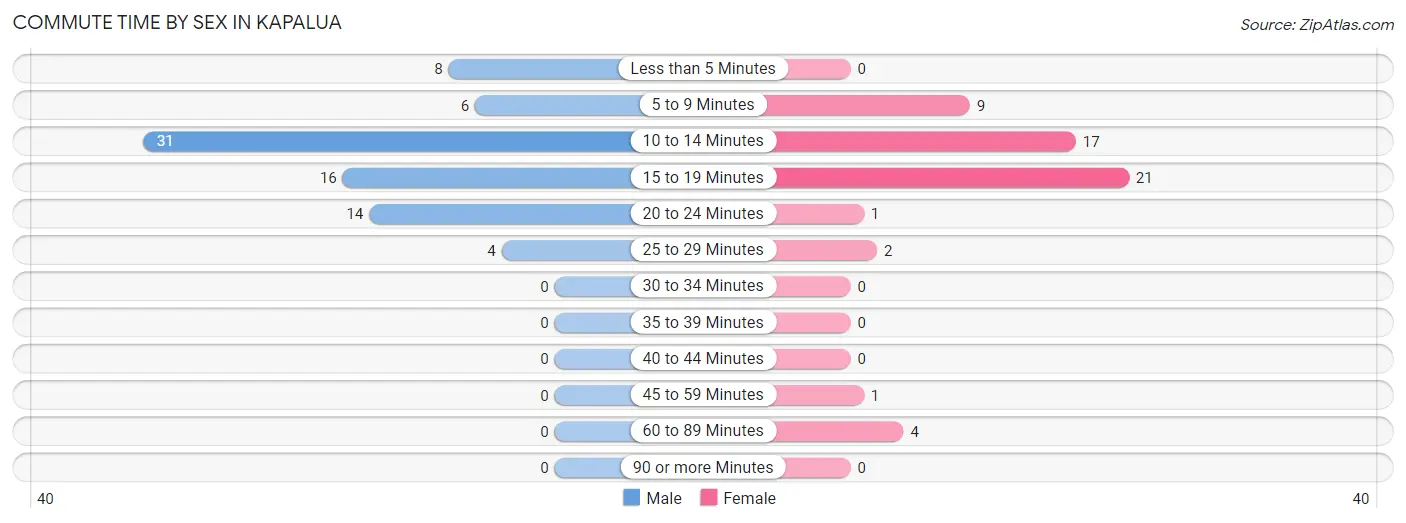
| Commute Time | Male | Female |
| Less than 5 Minutes | 8 (10.1%) | 0 (0.0%) |
| 5 to 9 Minutes | 6 (7.6%) | 9 (16.4%) |
| 10 to 14 Minutes | 31 (39.2%) | 17 (30.9%) |
| 15 to 19 Minutes | 16 (20.3%) | 21 (38.2%) |
| 20 to 24 Minutes | 14 (17.7%) | 1 (1.8%) |
| 25 to 29 Minutes | 4 (5.1%) | 2 (3.6%) |
| 30 to 34 Minutes | 0 (0.0%) | 0 (0.0%) |
| 35 to 39 Minutes | 0 (0.0%) | 0 (0.0%) |
| 40 to 44 Minutes | 0 (0.0%) | 0 (0.0%) |
| 45 to 59 Minutes | 0 (0.0%) | 1 (1.8%) |
| 60 to 89 Minutes | 0 (0.0%) | 4 (7.3%) |
| 90 or more Minutes | 0 (0.0%) | 0 (0.0%) |
Time of Departure to Work by Sex in Kapalua
The most frequent times of departure to work in Kapalua are 10:00 AM to 10:59 AM (23, 29.1%) for males and 10:00 AM to 10:59 AM (13, 23.6%) for females.
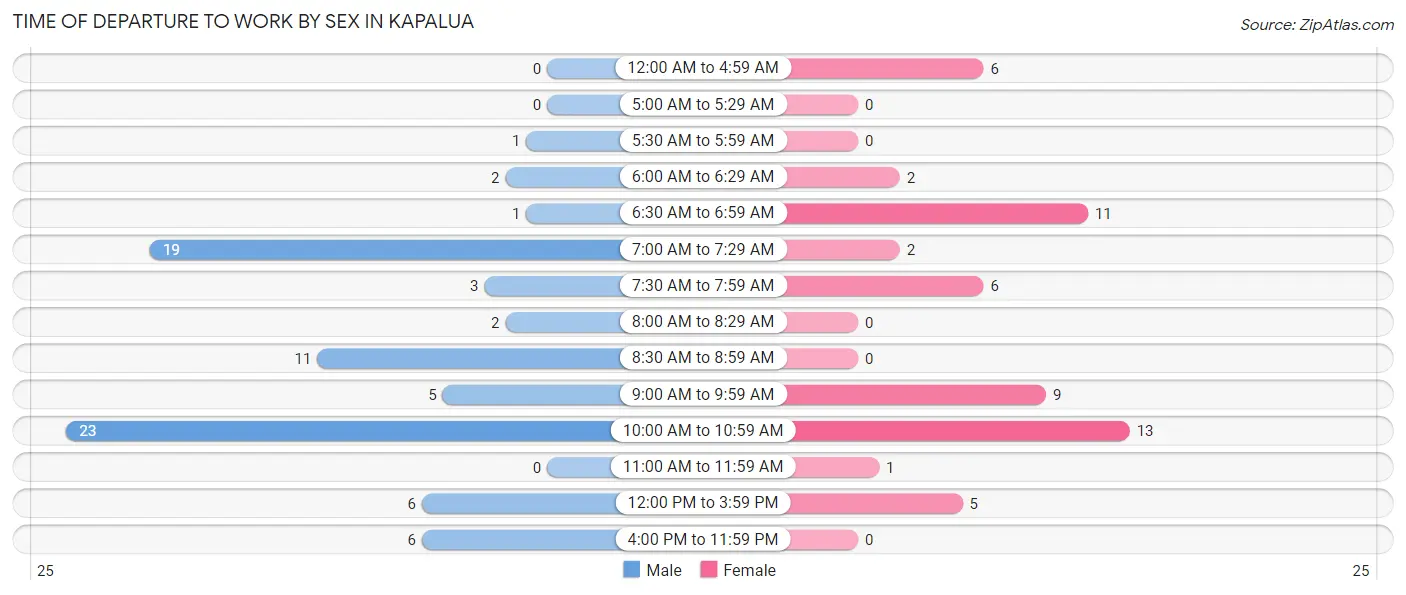
| Time of Departure | Male | Female |
| 12:00 AM to 4:59 AM | 0 (0.0%) | 6 (10.9%) |
| 5:00 AM to 5:29 AM | 0 (0.0%) | 0 (0.0%) |
| 5:30 AM to 5:59 AM | 1 (1.3%) | 0 (0.0%) |
| 6:00 AM to 6:29 AM | 2 (2.5%) | 2 (3.6%) |
| 6:30 AM to 6:59 AM | 1 (1.3%) | 11 (20.0%) |
| 7:00 AM to 7:29 AM | 19 (24.0%) | 2 (3.6%) |
| 7:30 AM to 7:59 AM | 3 (3.8%) | 6 (10.9%) |
| 8:00 AM to 8:29 AM | 2 (2.5%) | 0 (0.0%) |
| 8:30 AM to 8:59 AM | 11 (13.9%) | 0 (0.0%) |
| 9:00 AM to 9:59 AM | 5 (6.3%) | 9 (16.4%) |
| 10:00 AM to 10:59 AM | 23 (29.1%) | 13 (23.6%) |
| 11:00 AM to 11:59 AM | 0 (0.0%) | 1 (1.8%) |
| 12:00 PM to 3:59 PM | 6 (7.6%) | 5 (9.1%) |
| 4:00 PM to 11:59 PM | 6 (7.6%) | 0 (0.0%) |
| Total | 79 (100.0%) | 55 (100.0%) |
Housing Occupancy in Kapalua
Occupancy by Ownership in Kapalua
Of the total 163 dwellings in Kapalua, owner-occupied units account for 122 (74.9%), while renter-occupied units make up 41 (25.2%).
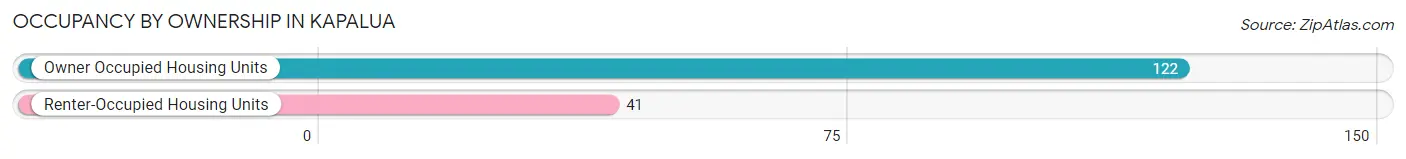
| Occupancy | # Housing Units | % Housing Units |
| Owner Occupied Housing Units | 122 | 74.9% |
| Renter-Occupied Housing Units | 41 | 25.2% |
| Total Occupied Housing Units | 163 | 100.0% |
Occupancy by Household Size in Kapalua
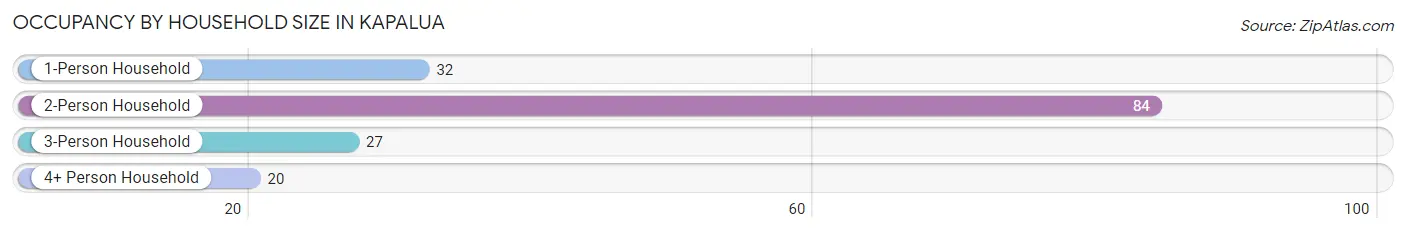
| Household Size | # Housing Units | % Housing Units |
| 1-Person Household | 32 | 19.6% |
| 2-Person Household | 84 | 51.5% |
| 3-Person Household | 27 | 16.6% |
| 4+ Person Household | 20 | 12.3% |
| Total Housing Units | 163 | 100.0% |
Occupancy by Ownership by Household Size in Kapalua
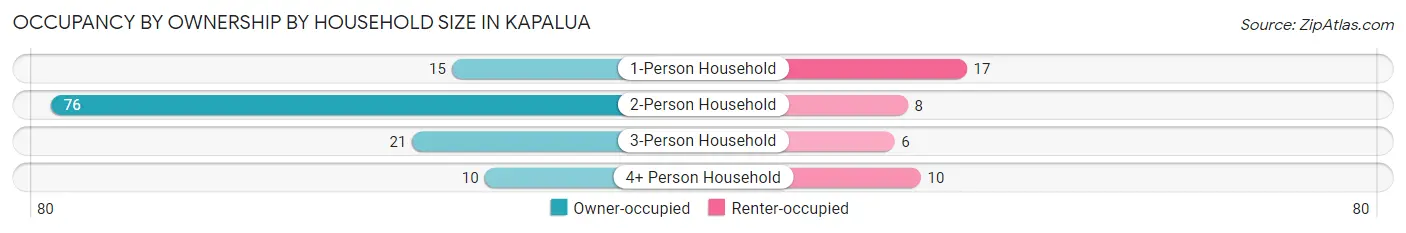
| Household Size | Owner-occupied | Renter-occupied |
| 1-Person Household | 15 (46.9%) | 17 (53.1%) |
| 2-Person Household | 76 (90.5%) | 8 (9.5%) |
| 3-Person Household | 21 (77.8%) | 6 (22.2%) |
| 4+ Person Household | 10 (50.0%) | 10 (50.0%) |
| Total Housing Units | 122 (74.9%) | 41 (25.2%) |
Occupancy by Educational Attainment in Kapalua
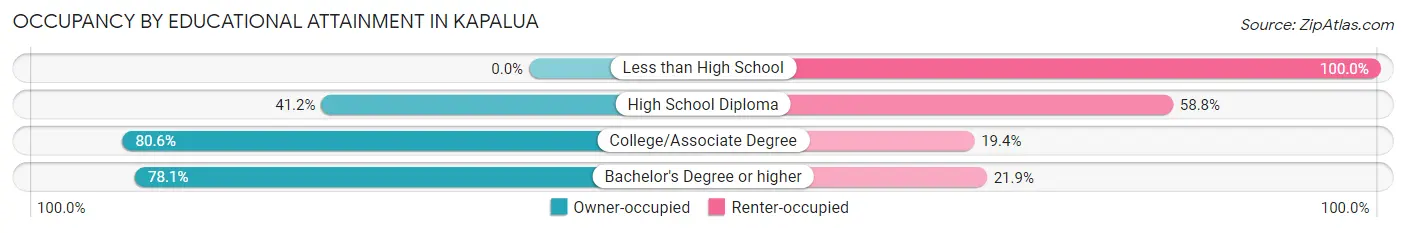
| Household Size | Owner-occupied | Renter-occupied |
| Less than High School | 0 (0.0%) | 1 (100.0%) |
| High School Diploma | 7 (41.2%) | 10 (58.8%) |
| College/Associate Degree | 58 (80.6%) | 14 (19.4%) |
| Bachelor's Degree or higher | 57 (78.1%) | 16 (21.9%) |
Occupancy by Age of Householder in Kapalua
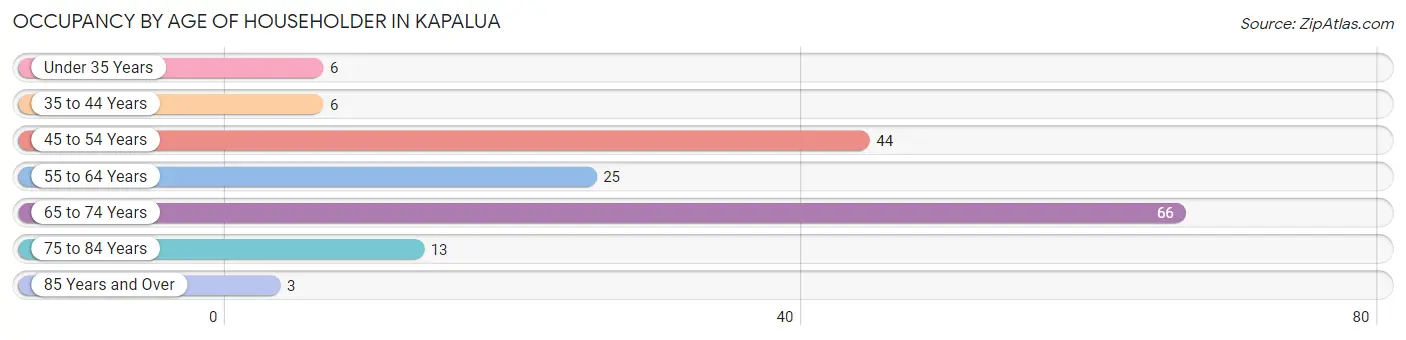
| Age Bracket | # Households | % Households |
| Under 35 Years | 6 | 3.7% |
| 35 to 44 Years | 6 | 3.7% |
| 45 to 54 Years | 44 | 27.0% |
| 55 to 64 Years | 25 | 15.3% |
| 65 to 74 Years | 66 | 40.5% |
| 75 to 84 Years | 13 | 8.0% |
| 85 Years and Over | 3 | 1.8% |
| Total | 163 | 100.0% |
Housing Finances in Kapalua
Median Income by Occupancy in Kapalua
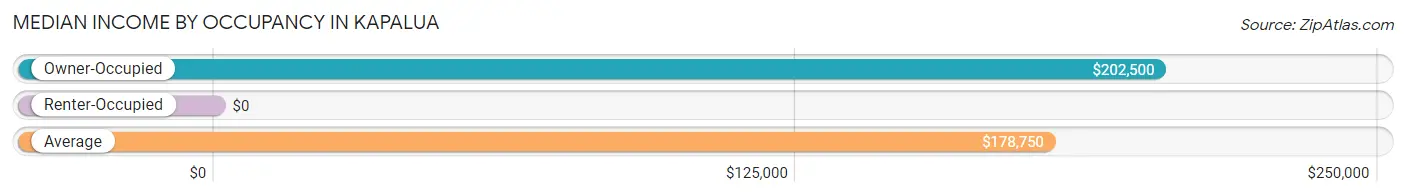
| Occupancy Type | # Households | Median Income |
| Owner-Occupied | 122 (74.9%) | $202,500 |
| Renter-Occupied | 41 (25.2%) | $0 |
| Average | 163 (100.0%) | $178,750 |
Occupancy by Householder Income Bracket in Kapalua
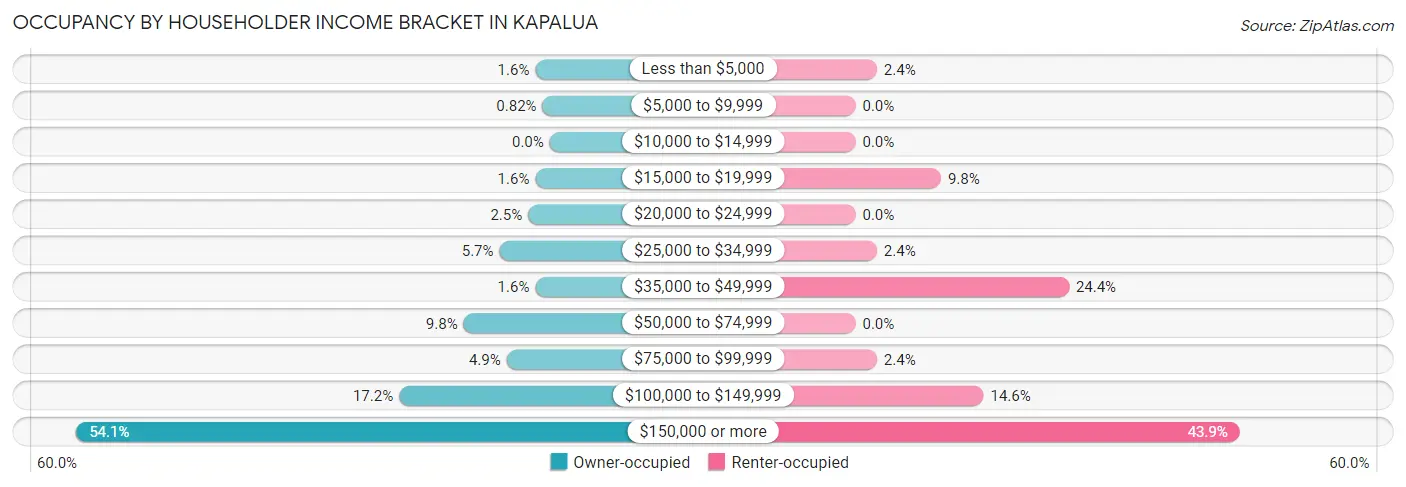
| Income Bracket | Owner-occupied | Renter-occupied |
| Less than $5,000 | 2 (1.6%) | 1 (2.4%) |
| $5,000 to $9,999 | 1 (0.8%) | 0 (0.0%) |
| $10,000 to $14,999 | 0 (0.0%) | 0 (0.0%) |
| $15,000 to $19,999 | 2 (1.6%) | 4 (9.8%) |
| $20,000 to $24,999 | 3 (2.5%) | 0 (0.0%) |
| $25,000 to $34,999 | 7 (5.7%) | 1 (2.4%) |
| $35,000 to $49,999 | 2 (1.6%) | 10 (24.4%) |
| $50,000 to $74,999 | 12 (9.8%) | 0 (0.0%) |
| $75,000 to $99,999 | 6 (4.9%) | 1 (2.4%) |
| $100,000 to $149,999 | 21 (17.2%) | 6 (14.6%) |
| $150,000 or more | 66 (54.1%) | 18 (43.9%) |
| Total | 122 (100.0%) | 41 (100.0%) |
Monthly Housing Cost Tiers in Kapalua
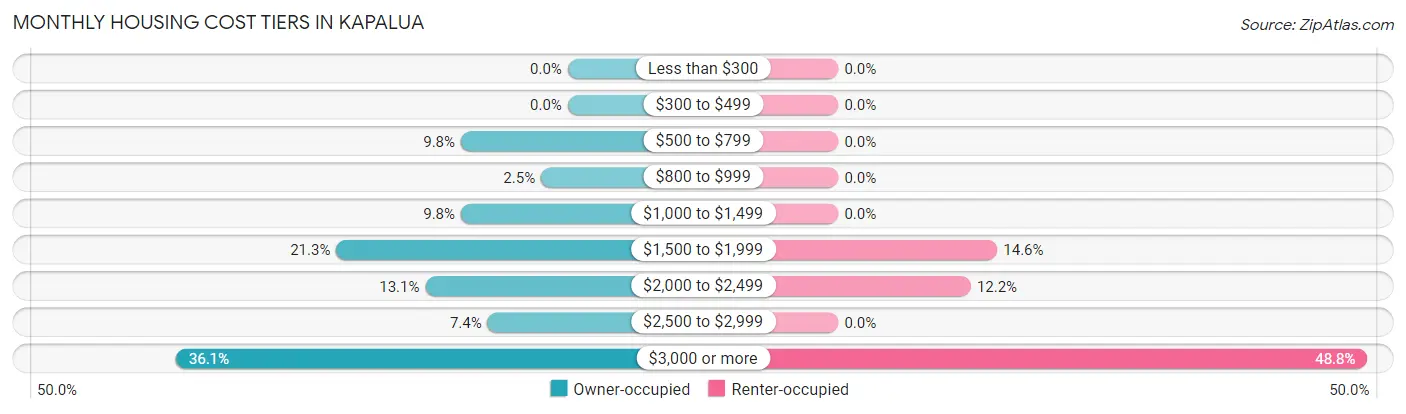
| Monthly Cost | Owner-occupied | Renter-occupied |
| Less than $300 | 0 (0.0%) | 0 (0.0%) |
| $300 to $499 | 0 (0.0%) | 0 (0.0%) |
| $500 to $799 | 12 (9.8%) | 0 (0.0%) |
| $800 to $999 | 3 (2.5%) | 0 (0.0%) |
| $1,000 to $1,499 | 12 (9.8%) | 0 (0.0%) |
| $1,500 to $1,999 | 26 (21.3%) | 6 (14.6%) |
| $2,000 to $2,499 | 16 (13.1%) | 5 (12.2%) |
| $2,500 to $2,999 | 9 (7.4%) | 0 (0.0%) |
| $3,000 or more | 44 (36.1%) | 20 (48.8%) |
| Total | 122 (100.0%) | 41 (100.0%) |
Physical Housing Characteristics in Kapalua
Housing Structures in Kapalua
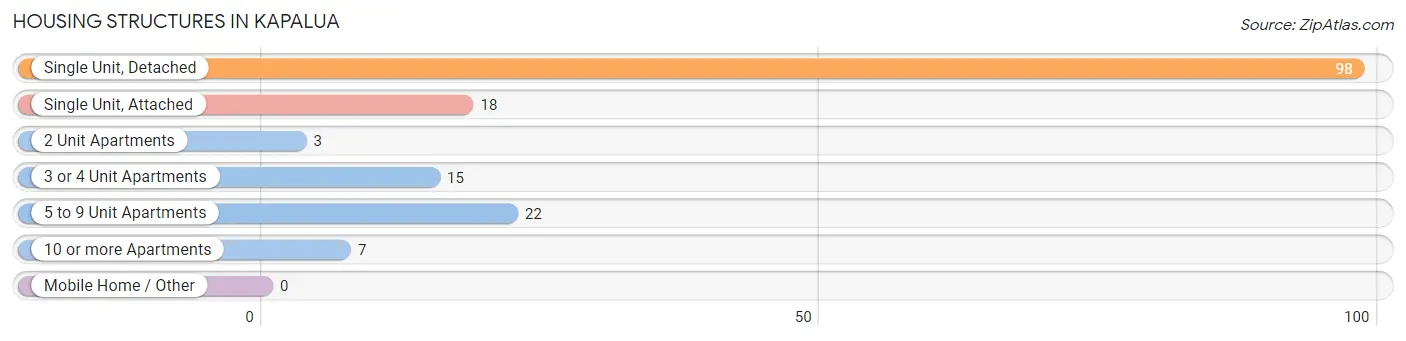
| Structure Type | # Housing Units | % Housing Units |
| Single Unit, Detached | 98 | 60.1% |
| Single Unit, Attached | 18 | 11.0% |
| 2 Unit Apartments | 3 | 1.8% |
| 3 or 4 Unit Apartments | 15 | 9.2% |
| 5 to 9 Unit Apartments | 22 | 13.5% |
| 10 or more Apartments | 7 | 4.3% |
| Mobile Home / Other | 0 | 0.0% |
| Total | 163 | 100.0% |
Housing Structures by Occupancy in Kapalua
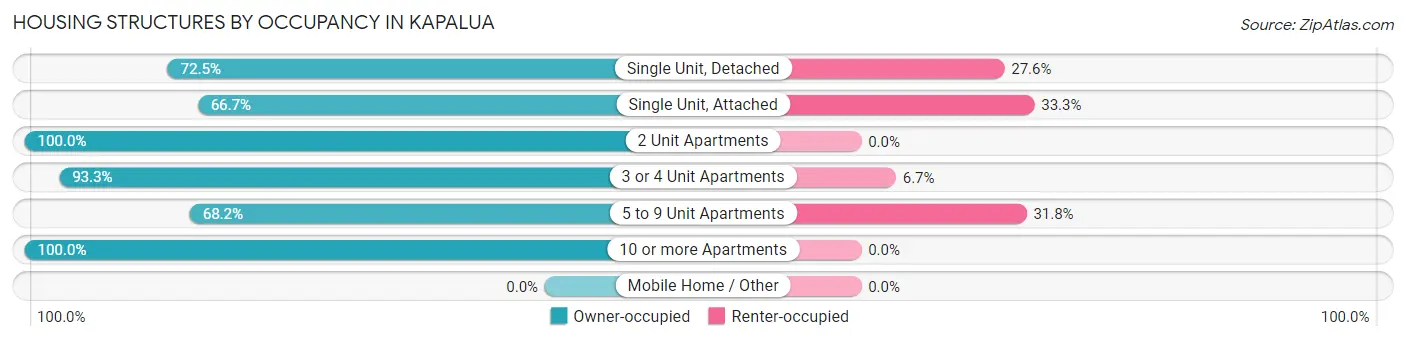
| Structure Type | Owner-occupied | Renter-occupied |
| Single Unit, Detached | 71 (72.5%) | 27 (27.6%) |
| Single Unit, Attached | 12 (66.7%) | 6 (33.3%) |
| 2 Unit Apartments | 3 (100.0%) | 0 (0.0%) |
| 3 or 4 Unit Apartments | 14 (93.3%) | 1 (6.7%) |
| 5 to 9 Unit Apartments | 15 (68.2%) | 7 (31.8%) |
| 10 or more Apartments | 7 (100.0%) | 0 (0.0%) |
| Mobile Home / Other | 0 (0.0%) | 0 (0.0%) |
| Total | 122 (74.9%) | 41 (25.2%) |
Housing Structures by Number of Rooms in Kapalua
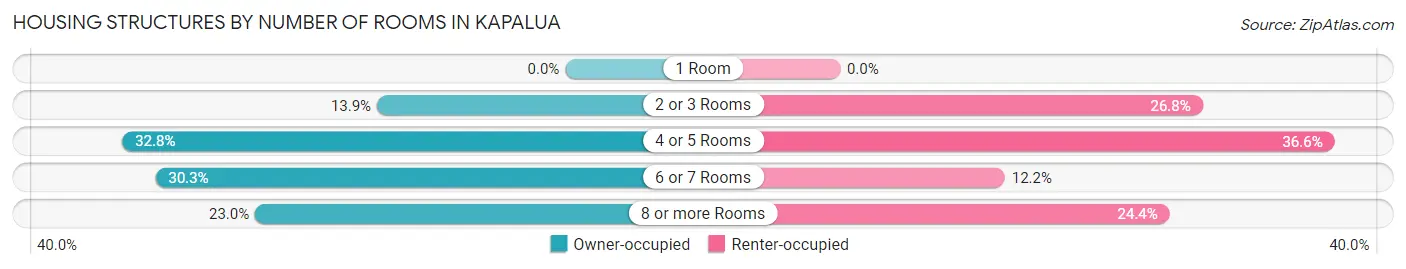
| Number of Rooms | Owner-occupied | Renter-occupied |
| 1 Room | 0 (0.0%) | 0 (0.0%) |
| 2 or 3 Rooms | 17 (13.9%) | 11 (26.8%) |
| 4 or 5 Rooms | 40 (32.8%) | 15 (36.6%) |
| 6 or 7 Rooms | 37 (30.3%) | 5 (12.2%) |
| 8 or more Rooms | 28 (23.0%) | 10 (24.4%) |
| Total | 122 (100.0%) | 41 (100.0%) |
Housing Structure by Heating Type in Kapalua
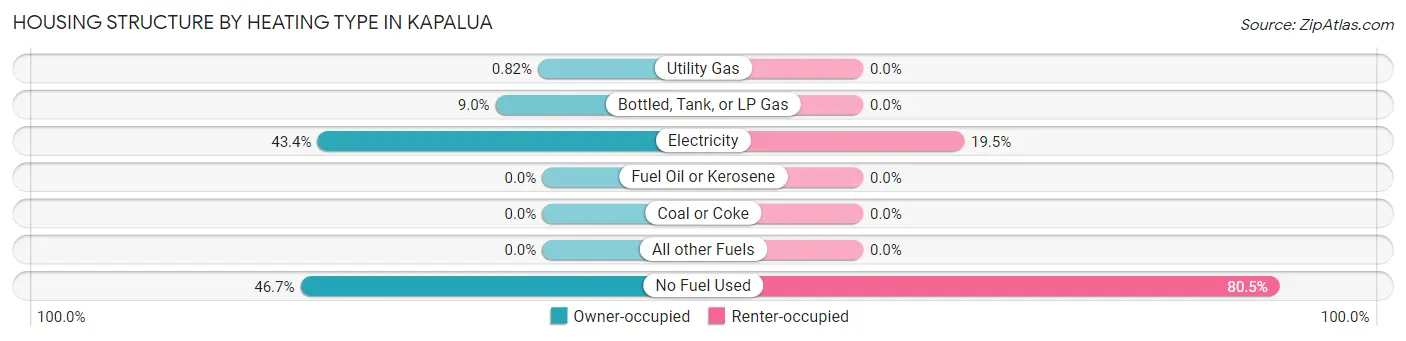
| Heating Type | Owner-occupied | Renter-occupied |
| Utility Gas | 1 (0.8%) | 0 (0.0%) |
| Bottled, Tank, or LP Gas | 11 (9.0%) | 0 (0.0%) |
| Electricity | 53 (43.4%) | 8 (19.5%) |
| Fuel Oil or Kerosene | 0 (0.0%) | 0 (0.0%) |
| Coal or Coke | 0 (0.0%) | 0 (0.0%) |
| All other Fuels | 0 (0.0%) | 0 (0.0%) |
| No Fuel Used | 57 (46.7%) | 33 (80.5%) |
| Total | 122 (100.0%) | 41 (100.0%) |
Household Vehicle Usage in Kapalua
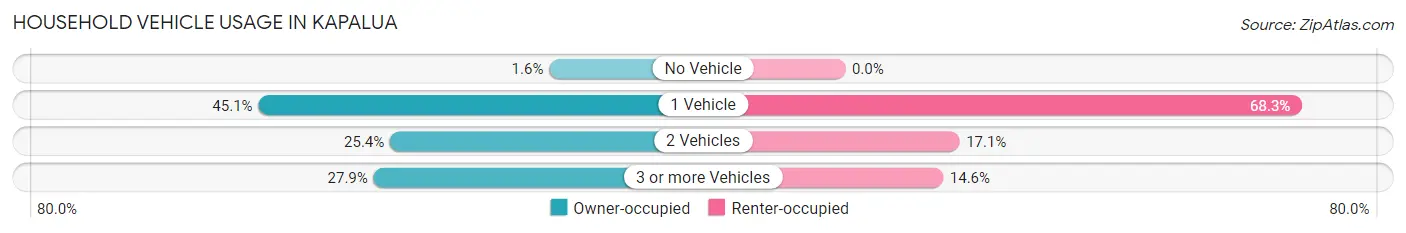
| Vehicles per Household | Owner-occupied | Renter-occupied |
| No Vehicle | 2 (1.6%) | 0 (0.0%) |
| 1 Vehicle | 55 (45.1%) | 28 (68.3%) |
| 2 Vehicles | 31 (25.4%) | 7 (17.1%) |
| 3 or more Vehicles | 34 (27.9%) | 6 (14.6%) |
| Total | 122 (100.0%) | 41 (100.0%) |
Real Estate & Mortgages in Kapalua
Real Estate and Mortgage Overview in Kapalua
| Characteristic | Without Mortgage | With Mortgage |
| Housing Units | 72 | 50 |
| Median Property Value | $2,000,001 | $1,083,300 |
| Median Household Income | $250,001 | $22 |
| Monthly Housing Costs | $1,501 | $26 |
| Real Estate Taxes | $8,750 | $0 |
Property Value by Mortgage Status in Kapalua
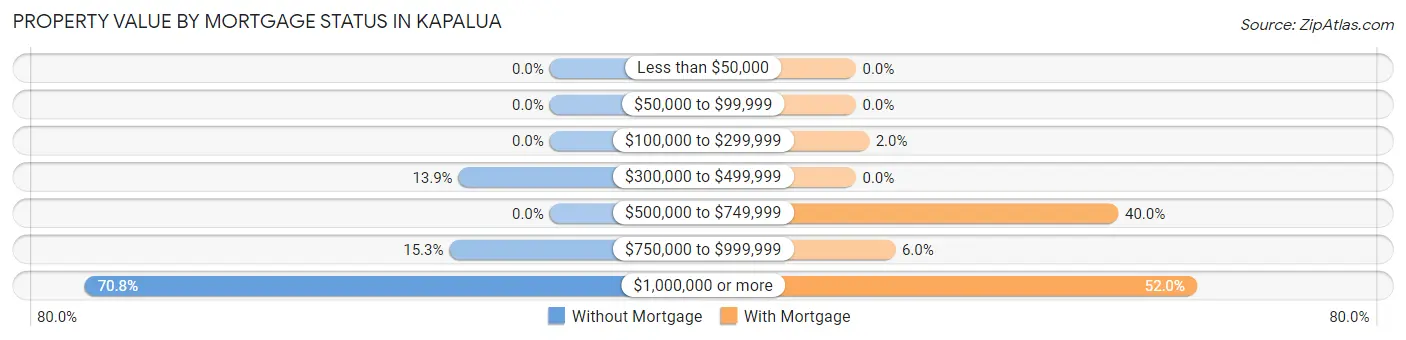
| Property Value | Without Mortgage | With Mortgage |
| Less than $50,000 | 0 (0.0%) | 0 (0.0%) |
| $50,000 to $99,999 | 0 (0.0%) | 0 (0.0%) |
| $100,000 to $299,999 | 0 (0.0%) | 1 (2.0%) |
| $300,000 to $499,999 | 10 (13.9%) | 0 (0.0%) |
| $500,000 to $749,999 | 0 (0.0%) | 20 (40.0%) |
| $750,000 to $999,999 | 11 (15.3%) | 3 (6.0%) |
| $1,000,000 or more | 51 (70.8%) | 26 (52.0%) |
| Total | 72 (100.0%) | 50 (100.0%) |
Household Income by Mortgage Status in Kapalua
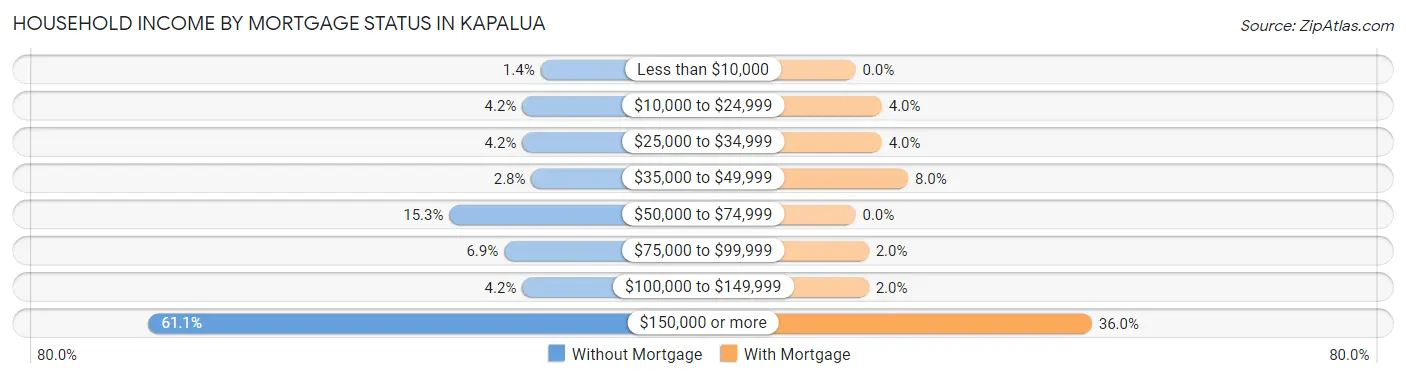
| Household Income | Without Mortgage | With Mortgage |
| Less than $10,000 | 1 (1.4%) | 0 (0.0%) |
| $10,000 to $24,999 | 3 (4.2%) | 2 (4.0%) |
| $25,000 to $34,999 | 3 (4.2%) | 2 (4.0%) |
| $35,000 to $49,999 | 2 (2.8%) | 4 (8.0%) |
| $50,000 to $74,999 | 11 (15.3%) | 0 (0.0%) |
| $75,000 to $99,999 | 5 (6.9%) | 1 (2.0%) |
| $100,000 to $149,999 | 3 (4.2%) | 1 (2.0%) |
| $150,000 or more | 44 (61.1%) | 18 (36.0%) |
| Total | 72 (100.0%) | 50 (100.0%) |
Property Value to Household Income Ratio in Kapalua
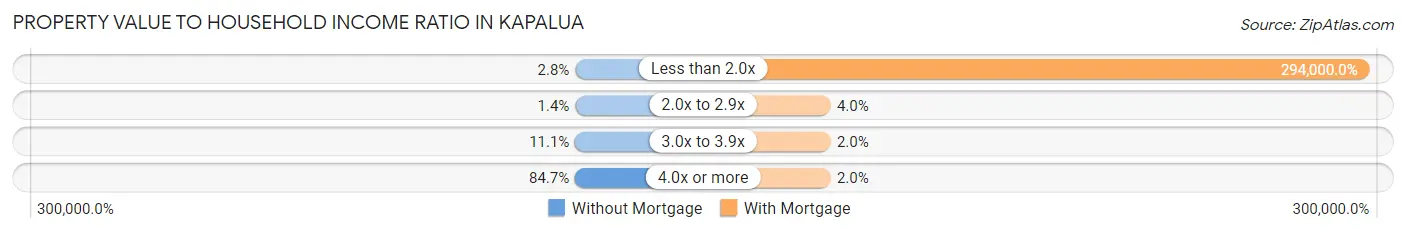
| Value-to-Income Ratio | Without Mortgage | With Mortgage |
| Less than 2.0x | 2 (2.8%) | 147,000 (294,000.0%) |
| 2.0x to 2.9x | 1 (1.4%) | 2 (4.0%) |
| 3.0x to 3.9x | 8 (11.1%) | 1 (2.0%) |
| 4.0x or more | 61 (84.7%) | 1 (2.0%) |
| Total | 72 (100.0%) | 50 (100.0%) |
Real Estate Taxes by Mortgage Status in Kapalua
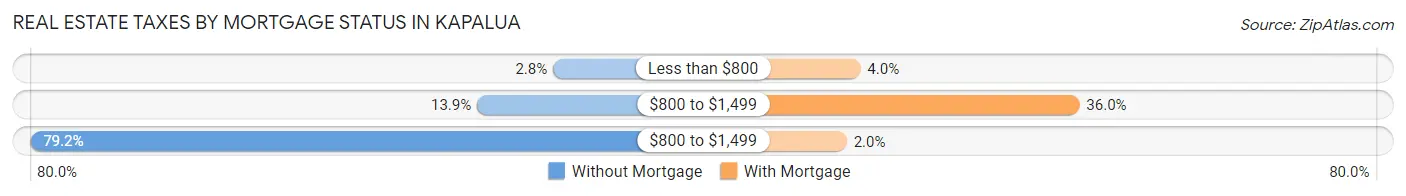
| Property Taxes | Without Mortgage | With Mortgage |
| Less than $800 | 2 (2.8%) | 2 (4.0%) |
| $800 to $1,499 | 10 (13.9%) | 18 (36.0%) |
| $800 to $1,499 | 57 (79.2%) | 1 (2.0%) |
| Total | 72 (100.0%) | 50 (100.0%) |
Health & Disability in Kapalua
Health Insurance Coverage by Age in Kapalua
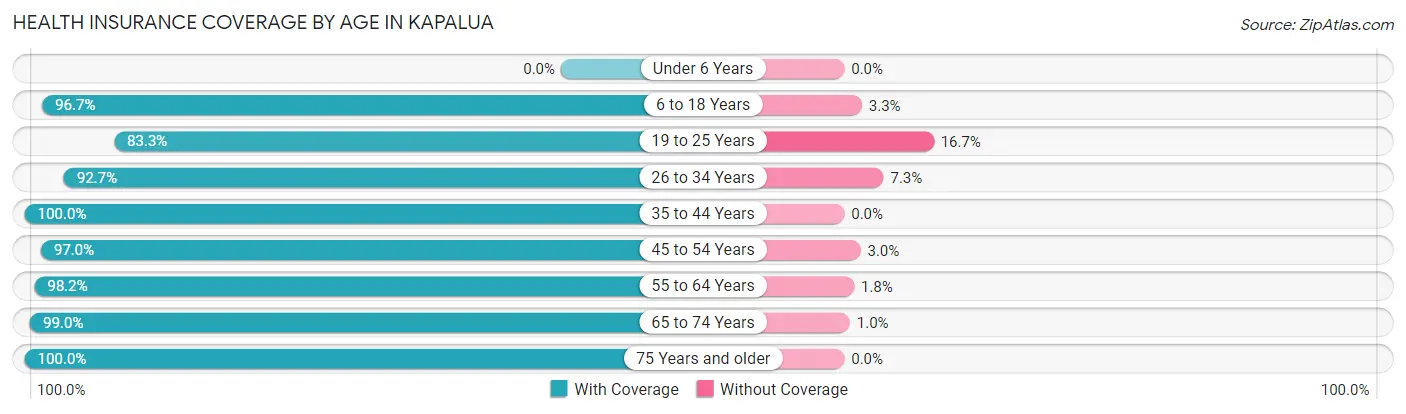
| Age Bracket | With Coverage | Without Coverage |
| Under 6 Years | 0 (0.0%) | 0 (0.0%) |
| 6 to 18 Years | 59 (96.7%) | 2 (3.3%) |
| 19 to 25 Years | 5 (83.3%) | 1 (16.7%) |
| 26 to 34 Years | 38 (92.7%) | 3 (7.3%) |
| 35 to 44 Years | 38 (100.0%) | 0 (0.0%) |
| 45 to 54 Years | 64 (97.0%) | 2 (3.0%) |
| 55 to 64 Years | 54 (98.2%) | 1 (1.8%) |
| 65 to 74 Years | 96 (99.0%) | 1 (1.0%) |
| 75 Years and older | 28 (100.0%) | 0 (0.0%) |
| Total | 382 (97.5%) | 10 (2.5%) |
Health Insurance Coverage by Citizenship Status in Kapalua
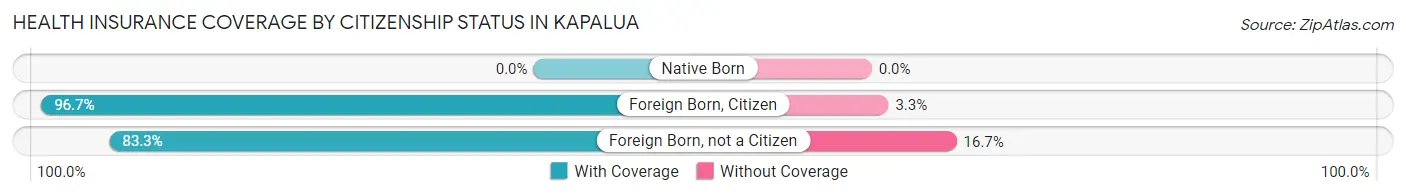
| Citizenship Status | With Coverage | Without Coverage |
| Native Born | 0 (0.0%) | 0 (0.0%) |
| Foreign Born, Citizen | 59 (96.7%) | 2 (3.3%) |
| Foreign Born, not a Citizen | 5 (83.3%) | 1 (16.7%) |
Health Insurance Coverage by Household Income in Kapalua
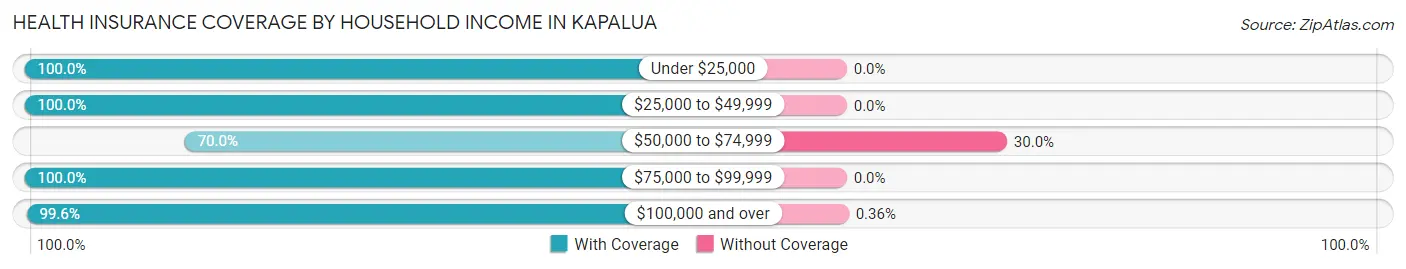
| Household Income | With Coverage | Without Coverage |
| Under $25,000 | 26 (100.0%) | 0 (0.0%) |
| $25,000 to $49,999 | 27 (100.0%) | 0 (0.0%) |
| $50,000 to $74,999 | 21 (70.0%) | 9 (30.0%) |
| $75,000 to $99,999 | 28 (100.0%) | 0 (0.0%) |
| $100,000 and over | 280 (99.6%) | 1 (0.4%) |
Public vs Private Health Insurance Coverage by Age in Kapalua
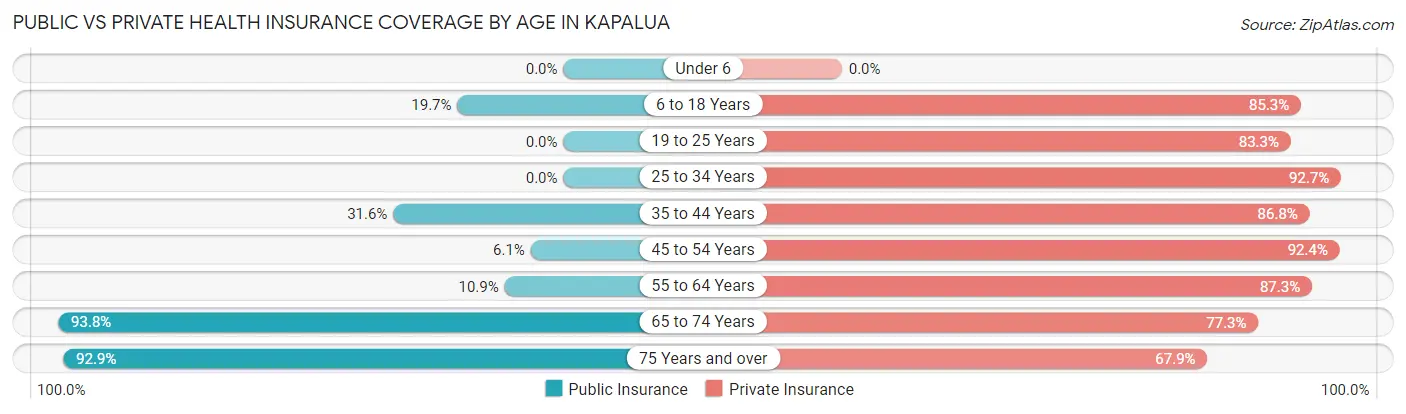
| Age Bracket | Public Insurance | Private Insurance |
| Under 6 | 0 (0.0%) | 0 (0.0%) |
| 6 to 18 Years | 12 (19.7%) | 52 (85.3%) |
| 19 to 25 Years | 0 (0.0%) | 5 (83.3%) |
| 25 to 34 Years | 0 (0.0%) | 38 (92.7%) |
| 35 to 44 Years | 12 (31.6%) | 33 (86.8%) |
| 45 to 54 Years | 4 (6.1%) | 61 (92.4%) |
| 55 to 64 Years | 6 (10.9%) | 48 (87.3%) |
| 65 to 74 Years | 91 (93.8%) | 75 (77.3%) |
| 75 Years and over | 26 (92.9%) | 19 (67.9%) |
| Total | 151 (38.5%) | 331 (84.4%) |
Disability Status by Sex by Age in Kapalua
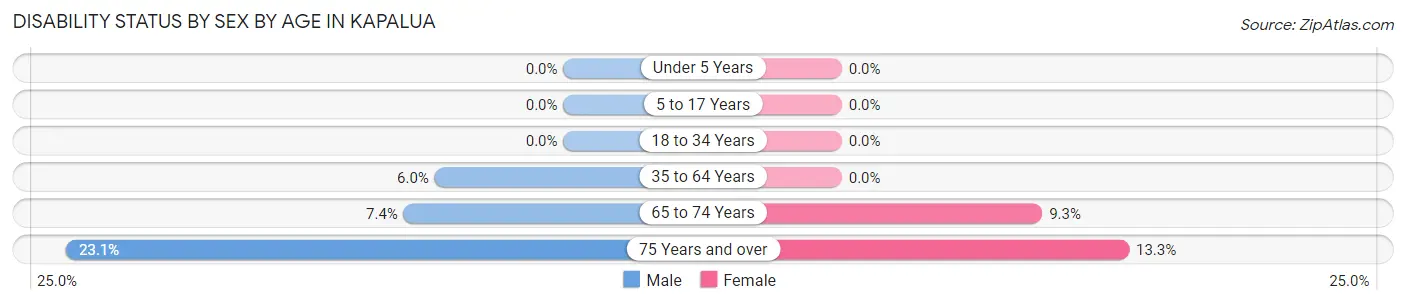
| Age Bracket | Male | Female |
| Under 5 Years | 0 (0.0%) | 0 (0.0%) |
| 5 to 17 Years | 0 (0.0%) | 0 (0.0%) |
| 18 to 34 Years | 0 (0.0%) | 0 (0.0%) |
| 35 to 64 Years | 4 (6.0%) | 0 (0.0%) |
| 65 to 74 Years | 4 (7.4%) | 4 (9.3%) |
| 75 Years and over | 3 (23.1%) | 2 (13.3%) |
Disability Class by Sex by Age in Kapalua
Disability Class: Hearing Difficulty
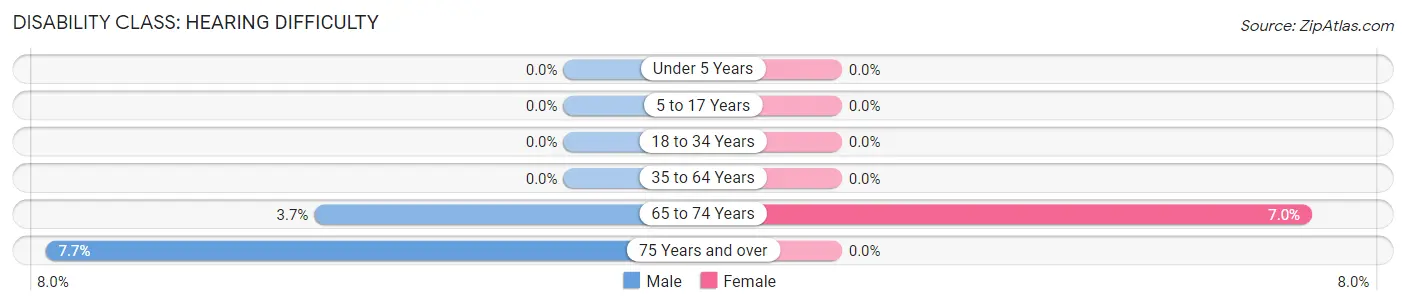
| Age Bracket | Male | Female |
| Under 5 Years | 0 (0.0%) | 0 (0.0%) |
| 5 to 17 Years | 0 (0.0%) | 0 (0.0%) |
| 18 to 34 Years | 0 (0.0%) | 0 (0.0%) |
| 35 to 64 Years | 0 (0.0%) | 0 (0.0%) |
| 65 to 74 Years | 2 (3.7%) | 3 (7.0%) |
| 75 Years and over | 1 (7.7%) | 0 (0.0%) |
Disability Class: Vision Difficulty
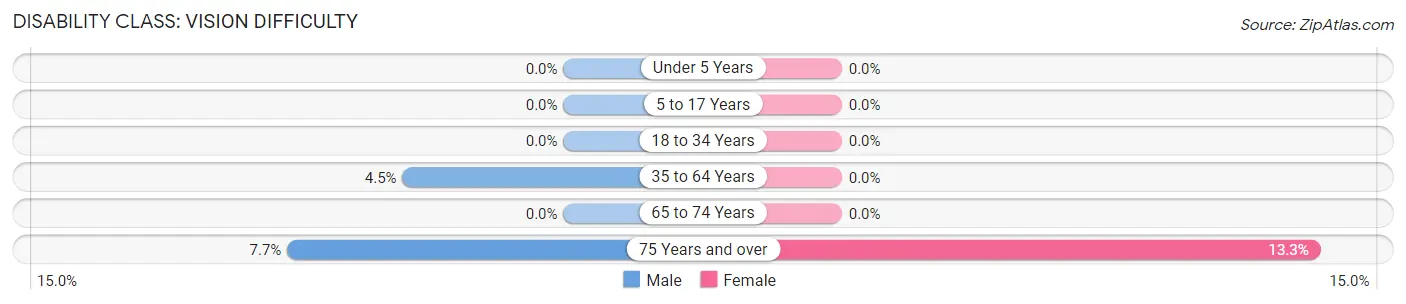
| Age Bracket | Male | Female |
| Under 5 Years | 0 (0.0%) | 0 (0.0%) |
| 5 to 17 Years | 0 (0.0%) | 0 (0.0%) |
| 18 to 34 Years | 0 (0.0%) | 0 (0.0%) |
| 35 to 64 Years | 3 (4.5%) | 0 (0.0%) |
| 65 to 74 Years | 0 (0.0%) | 0 (0.0%) |
| 75 Years and over | 1 (7.7%) | 2 (13.3%) |
Disability Class: Cognitive Difficulty
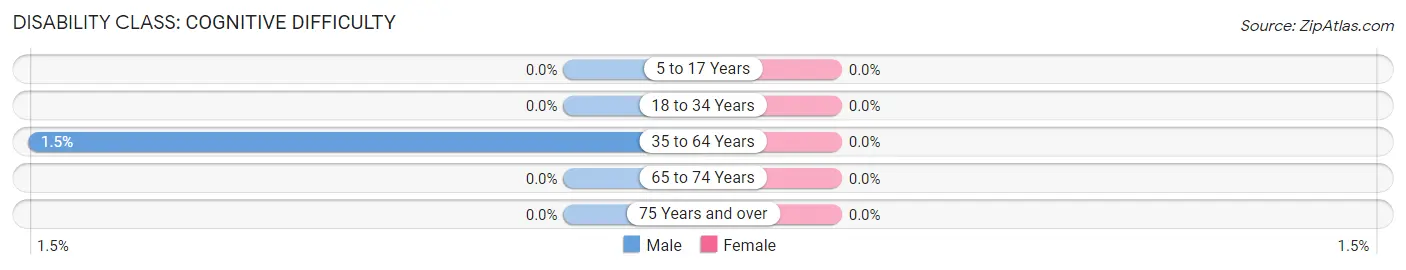
| Age Bracket | Male | Female |
| 5 to 17 Years | 0 (0.0%) | 0 (0.0%) |
| 18 to 34 Years | 0 (0.0%) | 0 (0.0%) |
| 35 to 64 Years | 1 (1.5%) | 0 (0.0%) |
| 65 to 74 Years | 0 (0.0%) | 0 (0.0%) |
| 75 Years and over | 0 (0.0%) | 0 (0.0%) |
Disability Class: Ambulatory Difficulty
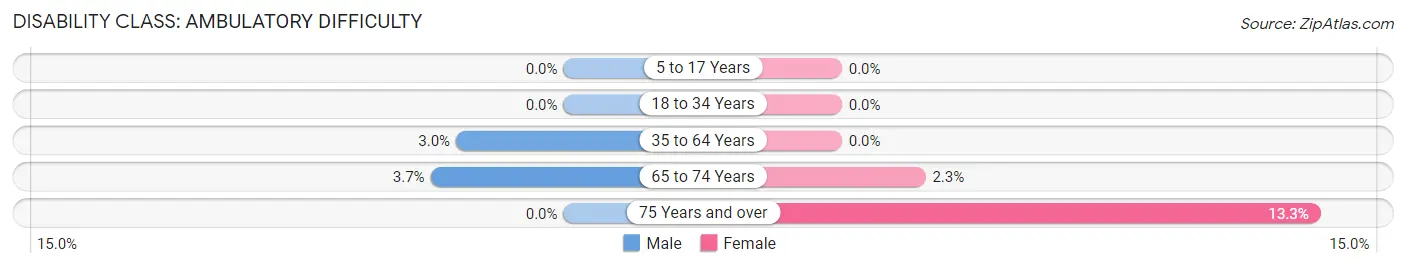
| Age Bracket | Male | Female |
| 5 to 17 Years | 0 (0.0%) | 0 (0.0%) |
| 18 to 34 Years | 0 (0.0%) | 0 (0.0%) |
| 35 to 64 Years | 2 (3.0%) | 0 (0.0%) |
| 65 to 74 Years | 2 (3.7%) | 1 (2.3%) |
| 75 Years and over | 0 (0.0%) | 2 (13.3%) |
Disability Class: Self-Care Difficulty
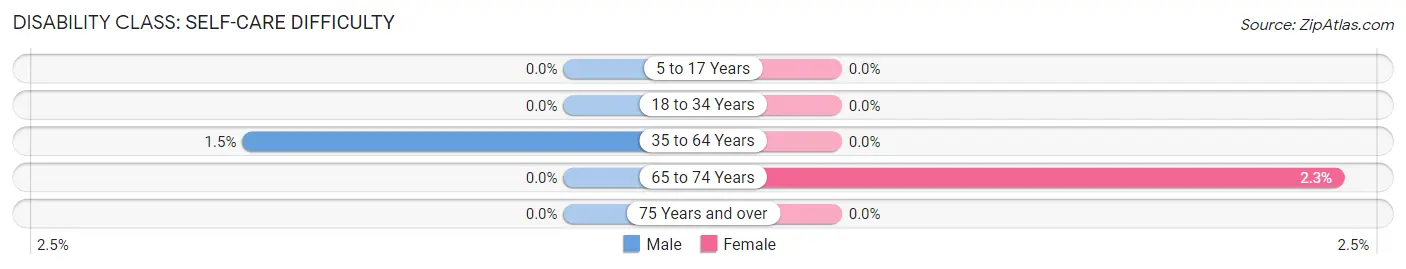
| Age Bracket | Male | Female |
| 5 to 17 Years | 0 (0.0%) | 0 (0.0%) |
| 18 to 34 Years | 0 (0.0%) | 0 (0.0%) |
| 35 to 64 Years | 1 (1.5%) | 0 (0.0%) |
| 65 to 74 Years | 0 (0.0%) | 1 (2.3%) |
| 75 Years and over | 0 (0.0%) | 0 (0.0%) |
Technology Access in Kapalua
Computing Device Access in Kapalua
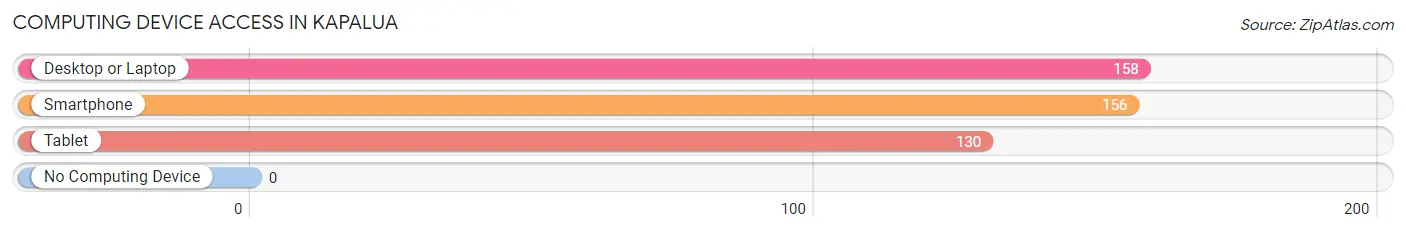
| Device Type | # Households | % Households |
| Desktop or Laptop | 158 | 96.9% |
| Smartphone | 156 | 95.7% |
| Tablet | 130 | 79.7% |
| No Computing Device | 0 | 0.0% |
| Total | 163 | 100.0% |
Internet Access in Kapalua
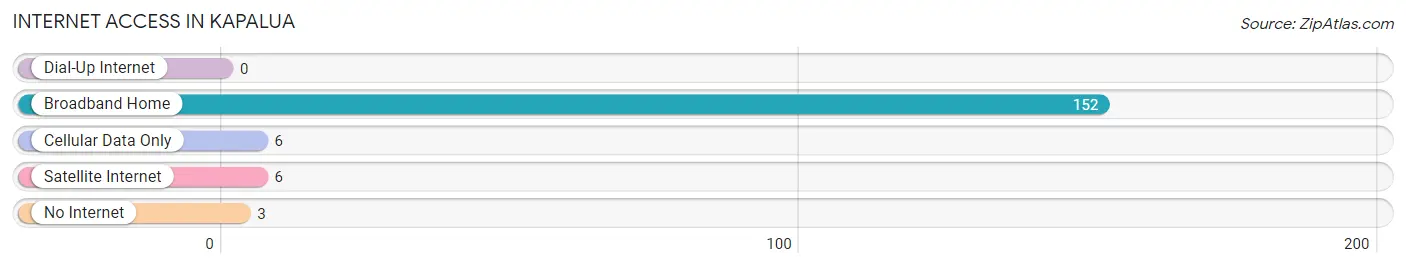
| Internet Type | # Households | % Households |
| Dial-Up Internet | 0 | 0.0% |
| Broadband Home | 152 | 93.2% |
| Cellular Data Only | 6 | 3.7% |
| Satellite Internet | 6 | 3.7% |
| No Internet | 3 | 1.8% |
| Total | 163 | 100.0% |
Kapalua Summary
Kapalua, HI is a small, unincorporated community located on the northwest coast of Maui, Hawaii. It is part of the West Maui Mountains and is bordered by the Pacific Ocean to the west and the Auau Channel to the east. The area is known for its stunning beaches, lush tropical forests, and world-class resorts. Kapalua is home to some of the most luxurious resorts in the world, including the Ritz-Carlton Kapalua, the Montage Kapalua Bay, and the Kapalua Bay Villas.
History
Kapalua has a long and rich history. The area was first settled by Polynesian voyagers in the late 1700s. The first Europeans to visit the area were British sailors in the early 1800s. In 1845, the area was annexed by the Kingdom of Hawaii and became part of Maui County.
In the late 1800s, the area was developed as a sugar plantation. The plantation was owned by the Kapalua Sugar Company, which was founded in 1876. The company operated until the early 1900s, when it was sold to the Hawaiian Commercial & Sugar Company.
In the early 1900s, the area began to be developed as a tourist destination. The first hotel, the Kapalua Inn, was built in 1927. The area was further developed in the 1950s and 1960s, when several luxury resorts were built.
Geography
Kapalua is located on the northwest coast of Maui, Hawaii. It is part of the West Maui Mountains and is bordered by the Pacific Ocean to the west and the Auau Channel to the east. The area is known for its stunning beaches, lush tropical forests, and world-class resorts.
The area is home to several beaches, including Kapalua Bay, Honolua Bay, and D.T. Fleming Beach Park. The area is also home to several hiking trails, including the Kapalua Coastal Trail and the Kapalua Ridge Trail.
Economy
Kapalua is primarily a tourist destination. The area is home to several luxury resorts, including the Ritz-Carlton Kapalua, the Montage Kapalua Bay, and the Kapalua Bay Villas. The area is also home to several golf courses, including the Kapalua Golf Course and the Plantation Course.
The area is also home to several restaurants, bars, and shops. The area is also home to several art galleries, including the Kapalua Art Gallery and the Kapalua Cultural Center.
Demographics
As of the 2010 census, the population of Kapalua was 1,845. The racial makeup of the area was 79.3% White, 8.2% Asian, 6.2% Native Hawaiian and Other Pacific Islander, 4.2% from two or more races, and 1.3% from other races. The median household income was $75,000.
Kapalua is a popular tourist destination and is home to several luxury resorts. The area is known for its stunning beaches, lush tropical forests, and world-class resorts. The area is also home to several restaurants, bars, and shops. The area is also home to several art galleries, including the Kapalua Art Gallery and the Kapalua Cultural Center.
Common Questions
What is Per Capita Income in Kapalua?
Per Capita income in Kapalua is $118,830.
What is the Median Family Income in Kapalua?
Median Family Income in Kapalua is $162,500.
What is the Median Household income in Kapalua?
Median Household Income in Kapalua is $178,750.
What is Income or Wage Gap in Kapalua?
Income or Wage Gap in Kapalua is 6.7%.
Women in Kapalua earn 93.3 cents for every dollar earned by a man.
What is Inequality or Gini Index in Kapalua?
Inequality or Gini Index in Kapalua is 0.52.
What is the Total Population of Kapalua?
Total Population of Kapalua is 392.
What is the Total Male Population of Kapalua?
Total Male Population of Kapalua is 210.
What is the Total Female Population of Kapalua?
Total Female Population of Kapalua is 182.
What is the Ratio of Males per 100 Females in Kapalua?
There are 115.38 Males per 100 Females in Kapalua.
What is the Ratio of Females per 100 Males in Kapalua?
There are 86.67 Females per 100 Males in Kapalua.
What is the Median Population Age in Kapalua?
Median Population Age in Kapalua is 53.3 Years.
What is the Average Family Size in Kapalua
Average Family Size in Kapalua is 2.8 People.
What is the Average Household Size in Kapalua
Average Household Size in Kapalua is 2.4 People.
How Large is the Labor Force in Kapalua?
There are 189 People in the Labor Forcein in Kapalua.
What is the Percentage of People in the Labor Force in Kapalua?
55.9% of People are in the Labor Force in Kapalua.
What is the Unemployment Rate in Kapalua?
Unemployment Rate in Kapalua is 4.2%.