Halaula, HI Map & Demographics
Halaula Map
Halaula Overview
$26,615
PER CAPITA INCOME
$93,250
AVG FAMILY INCOME
$61,250
AVG HOUSEHOLD INCOME
30.1%
WAGE / INCOME GAP [ % ]
69.9¢/ $1
WAGE / INCOME GAP [ $ ]
0.40
INEQUALITY / GINI INDEX
959
TOTAL POPULATION
505
MALE POPULATION
454
FEMALE POPULATION
111.23
MALES / 100 FEMALES
89.90
FEMALES / 100 MALES
37.2
MEDIAN AGE
4.4
AVG FAMILY SIZE
4.0
AVG HOUSEHOLD SIZE
360
LABOR FORCE [ PEOPLE ]
53.7%
PERCENT IN LABOR FORCE
5.0%
UNEMPLOYMENT RATE
Income in Halaula
Income Overview in Halaula
Per Capita Income in Halaula is $26,615, while median incomes of families and households are $93,250 and $61,250 respectively.
| Characteristic | Number | Measure |
| Per Capita Income | 959 | $26,615 |
| Median Family Income | 179 | $93,250 |
| Mean Family Income | 179 | $111,134 |
| Median Household Income | 242 | $61,250 |
| Mean Household Income | 242 | $100,773 |
| Income Deficit | 179 | $0 |
| Wage / Income Gap (%) | 959 | 30.11% |
| Wage / Income Gap ($) | 959 | 69.89¢ per $1 |
| Gini / Inequality Index | 959 | 0.40 |
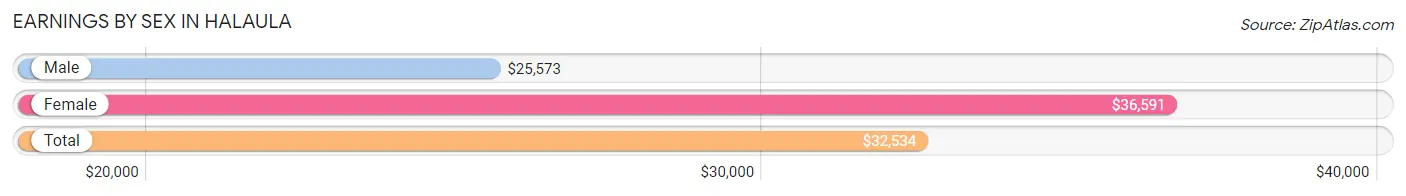
Earnings by Sex in Halaula
Average Earnings in Halaula are $32,534, $25,573 for men and $36,591 for women, a difference of 30.1%.
| Sex | Number | Average Earnings |
| Male | 239 (57.9%) | $25,573 |
| Female | 174 (42.1%) | $36,591 |
| Total | 413 (100.0%) | $32,534 |
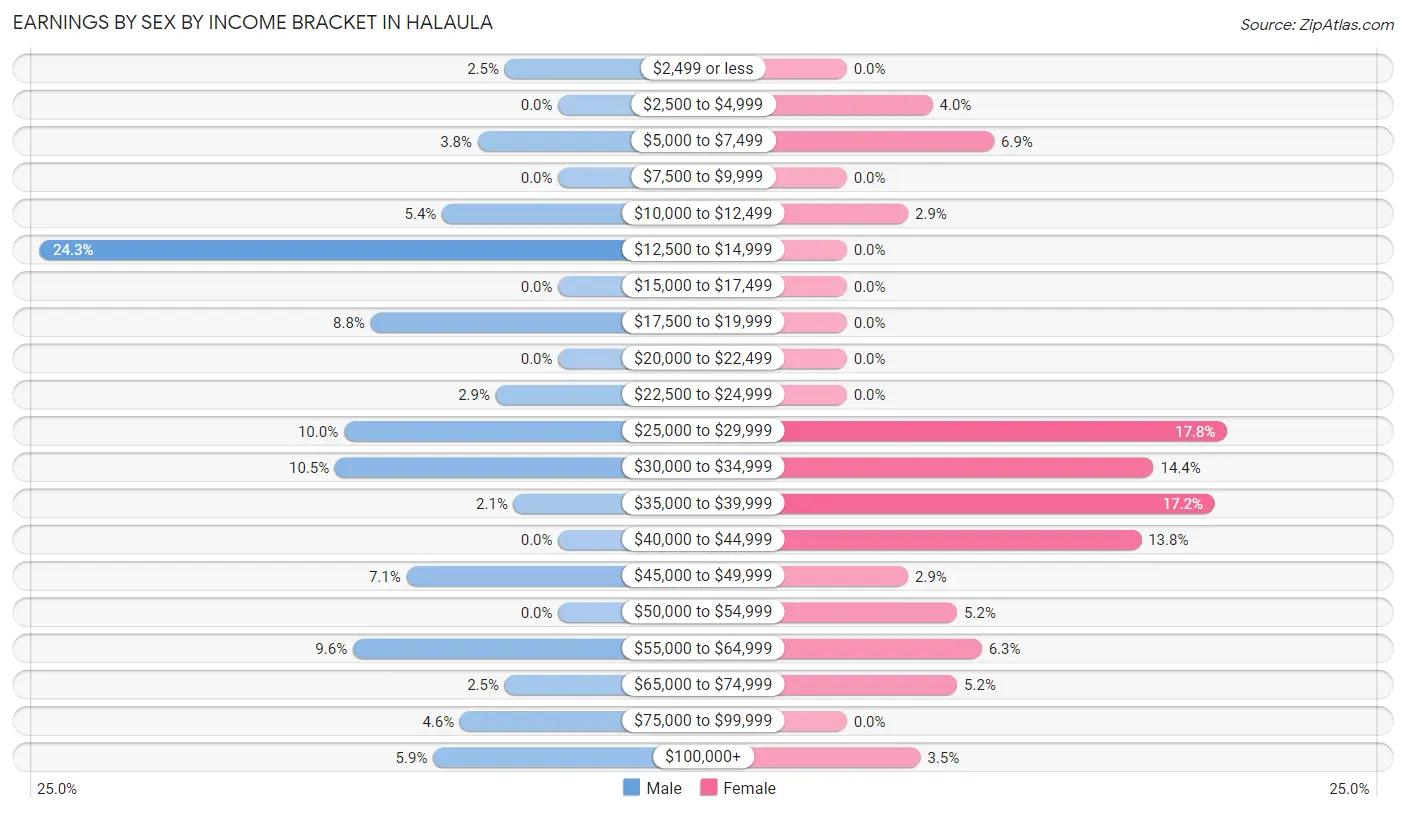
Earnings by Sex by Income Bracket in Halaula
The most common earnings brackets in Halaula are $12,500 to $14,999 for men (58 | 24.3%) and $25,000 to $29,999 for women (31 | 17.8%).
| Income | Male | Female |
| $2,499 or less | 6 (2.5%) | 0 (0.0%) |
| $2,500 to $4,999 | 0 (0.0%) | 7 (4.0%) |
| $5,000 to $7,499 | 9 (3.8%) | 12 (6.9%) |
| $7,500 to $9,999 | 0 (0.0%) | 0 (0.0%) |
| $10,000 to $12,499 | 13 (5.4%) | 5 (2.9%) |
| $12,500 to $14,999 | 58 (24.3%) | 0 (0.0%) |
| $15,000 to $17,499 | 0 (0.0%) | 0 (0.0%) |
| $17,500 to $19,999 | 21 (8.8%) | 0 (0.0%) |
| $20,000 to $22,499 | 0 (0.0%) | 0 (0.0%) |
| $22,500 to $24,999 | 7 (2.9%) | 0 (0.0%) |
| $25,000 to $29,999 | 24 (10.0%) | 31 (17.8%) |
| $30,000 to $34,999 | 25 (10.5%) | 25 (14.4%) |
| $35,000 to $39,999 | 5 (2.1%) | 30 (17.2%) |
| $40,000 to $44,999 | 0 (0.0%) | 24 (13.8%) |
| $45,000 to $49,999 | 17 (7.1%) | 5 (2.9%) |
| $50,000 to $54,999 | 0 (0.0%) | 9 (5.2%) |
| $55,000 to $64,999 | 23 (9.6%) | 11 (6.3%) |
| $65,000 to $74,999 | 6 (2.5%) | 9 (5.2%) |
| $75,000 to $99,999 | 11 (4.6%) | 0 (0.0%) |
| $100,000+ | 14 (5.9%) | 6 (3.5%) |
| Total | 239 (100.0%) | 174 (100.0%) |
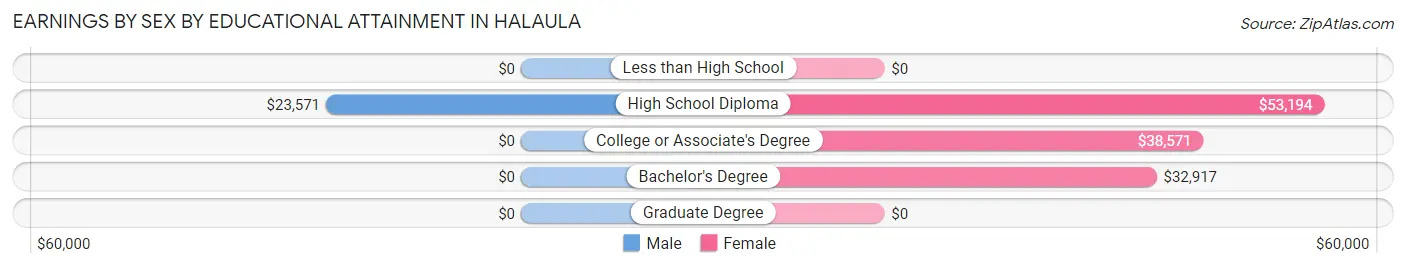
Earnings by Sex by Educational Attainment in Halaula
Average earnings in Halaula are $25,885 for men and $37,697 for women, a difference of 31.3%. Men with an educational attainment of high school diploma enjoy the highest average annual earnings of $23,571, while those with high school diploma education earn the least with $23,571. Women with an educational attainment of high school diploma earn the most with the average annual earnings of $53,194, while those with bachelor's degree education have the smallest earnings of $32,917.
| Educational Attainment | Male Income | Female Income |
| Less than High School | - | - |
| High School Diploma | $23,571 | $53,194 |
| College or Associate's Degree | - | - |
| Bachelor's Degree | - | - |
| Graduate Degree | - | - |
| Total | $25,885 | $37,697 |
Family Income in Halaula
Family Income Brackets in Halaula
According to the Halaula family income data, there are 61 families falling into the $35,000 to $49,999 income range, which is the most common income bracket and makes up 34.1% of all families.
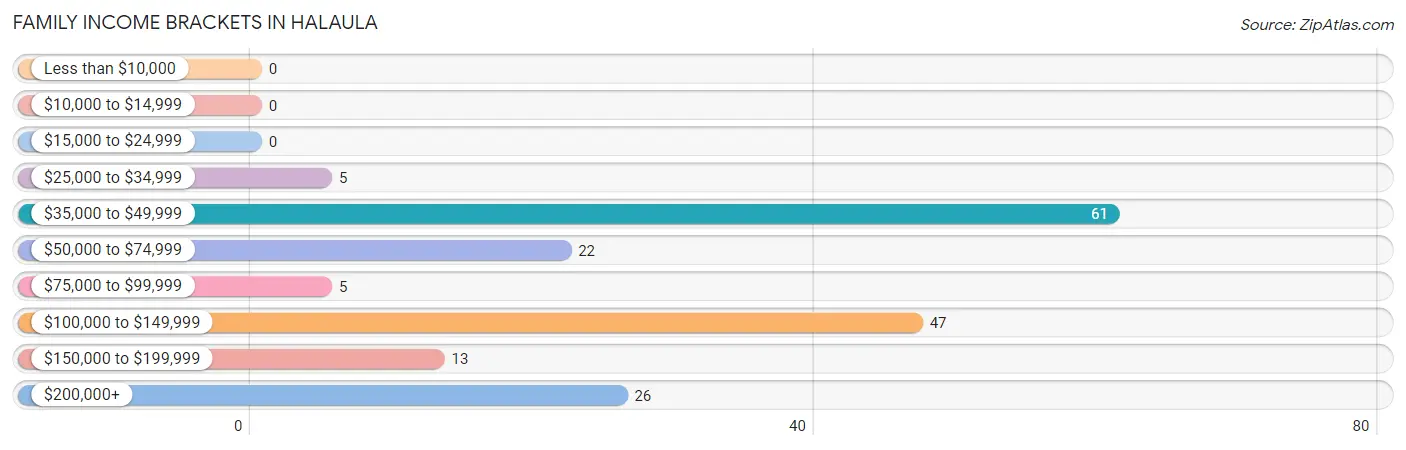
| Income Bracket | # Families | % Families |
| Less than $10,000 | 0 | 0.0% |
| $10,000 to $14,999 | 0 | 0.0% |
| $15,000 to $24,999 | 0 | 0.0% |
| $25,000 to $34,999 | 5 | 2.8% |
| $35,000 to $49,999 | 61 | 34.1% |
| $50,000 to $74,999 | 22 | 12.3% |
| $75,000 to $99,999 | 5 | 2.8% |
| $100,000 to $149,999 | 47 | 26.3% |
| $150,000 to $199,999 | 13 | 7.3% |
| $200,000+ | 26 | 14.5% |
Family Income by Famaliy Size in Halaula
7+ person families (52 | 29.0%) account for the highest median family income in Halaula with $195,000 per family, while 4-person families (13 | 7.3%) have the highest median income of $37,110 per family member.
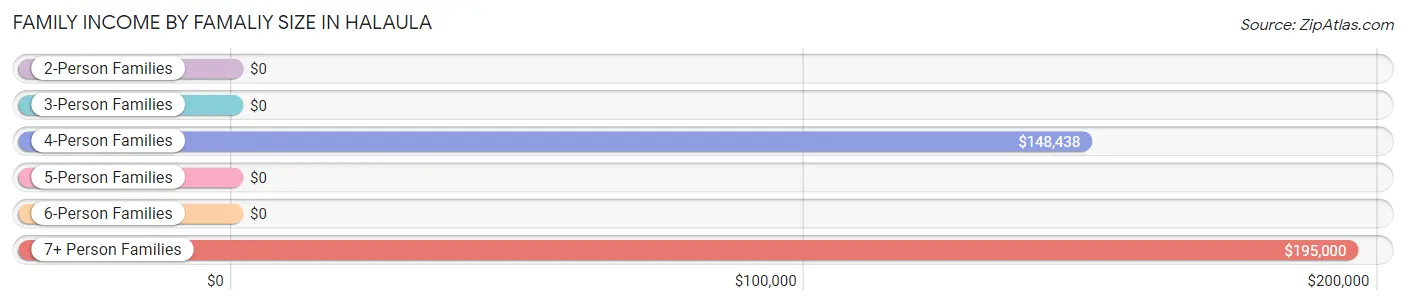
| Income Bracket | # Families | Median Income |
| 2-Person Families | 109 (60.9%) | $0 |
| 3-Person Families | 0 (0.0%) | $0 |
| 4-Person Families | 13 (7.3%) | $148,438 |
| 5-Person Families | 5 (2.8%) | $0 |
| 6-Person Families | 0 (0.0%) | $0 |
| 7+ Person Families | 52 (29.0%) | $195,000 |
| Total | 179 (100.0%) | $93,250 |
Family Income by Number of Earners in Halaula
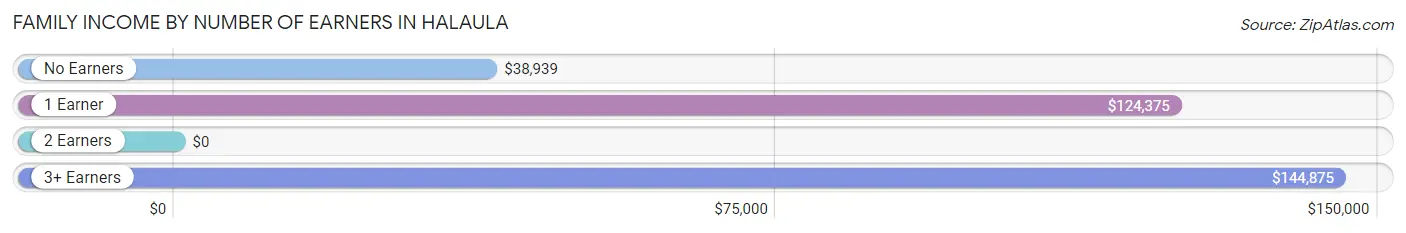
| Number of Earners | # Families | Median Income |
| No Earners | 71 (39.7%) | $38,939 |
| 1 Earner | 34 (19.0%) | $124,375 |
| 2 Earners | 31 (17.3%) | $0 |
| 3+ Earners | 43 (24.0%) | $144,875 |
| Total | 179 (100.0%) | $93,250 |
Household Income in Halaula
Household Income Brackets in Halaula
With 87 households falling in the category, the $50,000 to $74,999 income range is the most frequent in Halaula, accounting for 35.9% of all households.
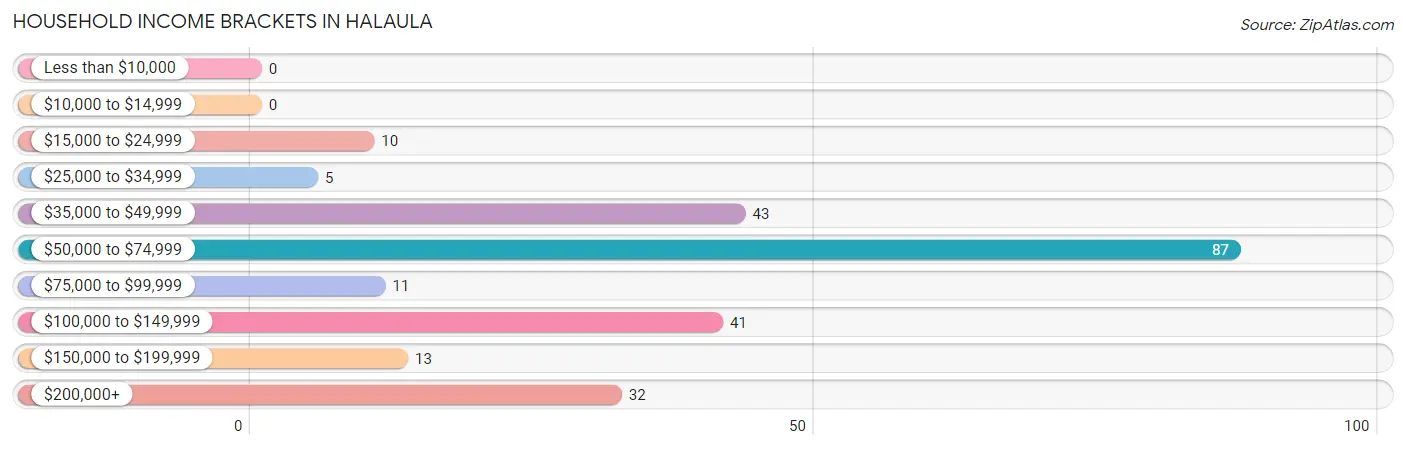
| Income Bracket | # Households | % Households |
| Less than $10,000 | 0 | 0.0% |
| $10,000 to $14,999 | 0 | 0.0% |
| $15,000 to $24,999 | 10 | 4.1% |
| $25,000 to $34,999 | 5 | 2.1% |
| $35,000 to $49,999 | 43 | 17.8% |
| $50,000 to $74,999 | 87 | 36.0% |
| $75,000 to $99,999 | 11 | 4.5% |
| $100,000 to $149,999 | 41 | 16.9% |
| $150,000 to $199,999 | 13 | 5.4% |
| $200,000+ | 32 | 13.2% |
Household Income by Householder Age in Halaula
The median household income in Halaula is $61,250, with the highest median household income of $95,625 found in the 45 to 64 years age bracket for the primary householder. A total of 39 households (16.1%) fall into this category.
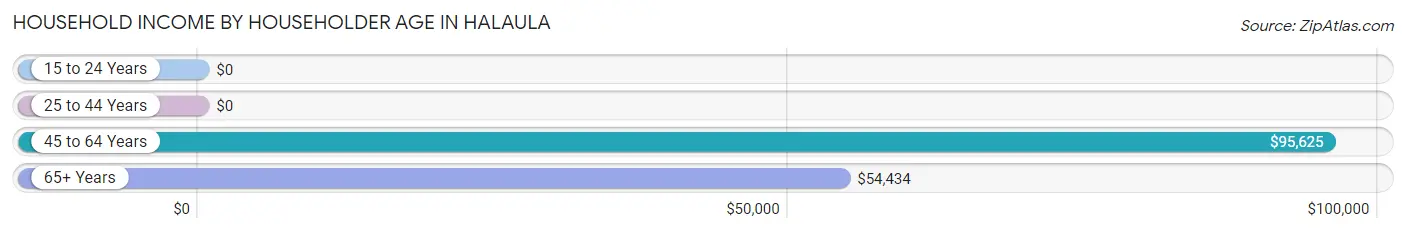
| Income Bracket | # Households | Median Income |
| 15 to 24 Years | 0 (0.0%) | $0 |
| 25 to 44 Years | 31 (12.8%) | $0 |
| 45 to 64 Years | 39 (16.1%) | $95,625 |
| 65+ Years | 172 (71.1%) | $54,434 |
| Total | 242 (100.0%) | $61,250 |
Poverty in Halaula
Income Below Poverty by Sex and Age in Halaula
With 13.3% poverty level for males and 3.3% for females among the residents of Halaula, 18 to 24 year old males and 18 to 24 year old females are the most vulnerable to poverty, with 6 males (100.0%) and 4 females (26.7%) in their respective age groups living below the poverty level.
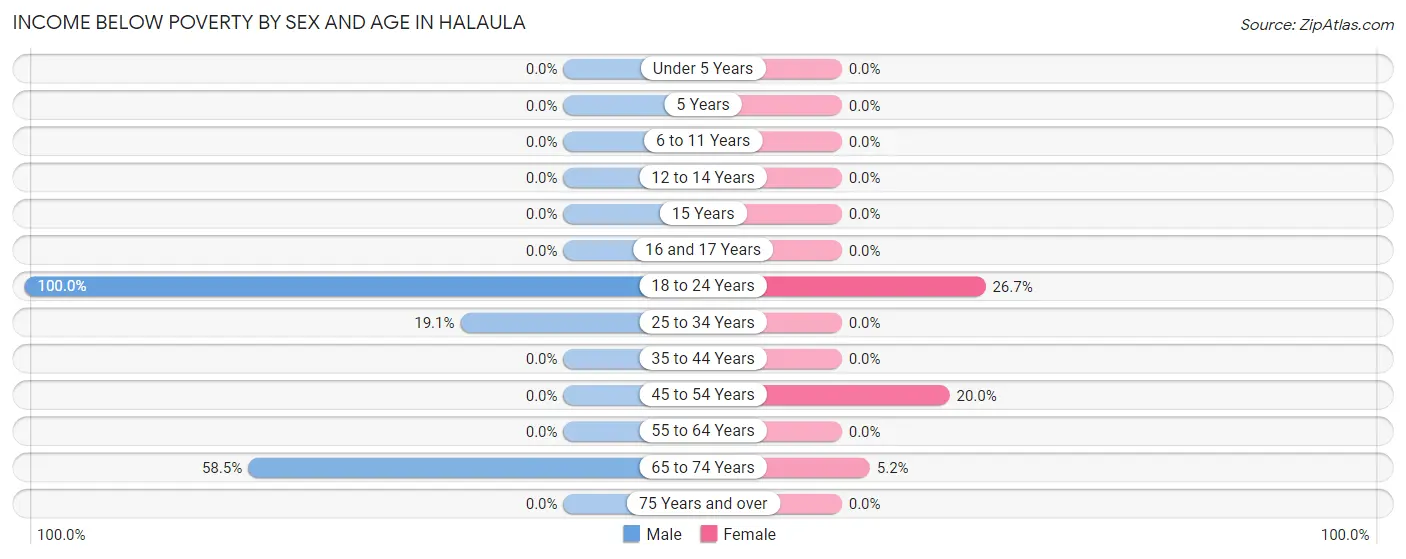
| Age Bracket | Male | Female |
| Under 5 Years | 0 (0.0%) | 0 (0.0%) |
| 5 Years | 0 (0.0%) | 0 (0.0%) |
| 6 to 11 Years | 0 (0.0%) | 0 (0.0%) |
| 12 to 14 Years | 0 (0.0%) | 0 (0.0%) |
| 15 Years | 0 (0.0%) | 0 (0.0%) |
| 16 and 17 Years | 0 (0.0%) | 0 (0.0%) |
| 18 to 24 Years | 6 (100.0%) | 4 (26.7%) |
| 25 to 34 Years | 13 (19.1%) | 0 (0.0%) |
| 35 to 44 Years | 0 (0.0%) | 0 (0.0%) |
| 45 to 54 Years | 0 (0.0%) | 6 (20.0%) |
| 55 to 64 Years | 0 (0.0%) | 0 (0.0%) |
| 65 to 74 Years | 48 (58.5%) | 5 (5.2%) |
| 75 Years and over | 0 (0.0%) | 0 (0.0%) |
| Total | 67 (13.3%) | 15 (3.3%) |
Income Above Poverty by Sex and Age in Halaula
According to the poverty statistics in Halaula, males aged under 5 years and females aged under 5 years are the age groups that are most secure financially, with 100.0% of males and 100.0% of females in these age groups living above the poverty line.
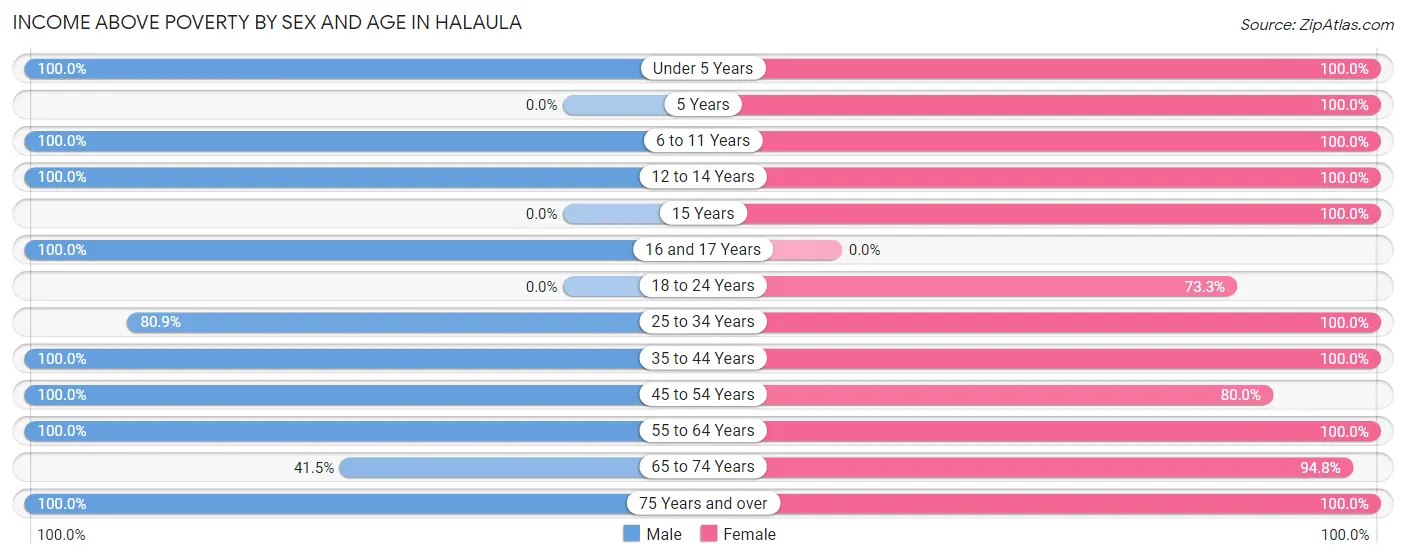
| Age Bracket | Male | Female |
| Under 5 Years | 47 (100.0%) | 17 (100.0%) |
| 5 Years | 0 (0.0%) | 15 (100.0%) |
| 6 to 11 Years | 120 (100.0%) | 51 (100.0%) |
| 12 to 14 Years | 25 (100.0%) | 9 (100.0%) |
| 15 Years | 0 (0.0%) | 5 (100.0%) |
| 16 and 17 Years | 9 (100.0%) | 0 (0.0%) |
| 18 to 24 Years | 0 (0.0%) | 11 (73.3%) |
| 25 to 34 Years | 55 (80.9%) | 56 (100.0%) |
| 35 to 44 Years | 52 (100.0%) | 38 (100.0%) |
| 45 to 54 Years | 17 (100.0%) | 24 (80.0%) |
| 55 to 64 Years | 36 (100.0%) | 49 (100.0%) |
| 65 to 74 Years | 34 (41.5%) | 91 (94.8%) |
| 75 Years and over | 43 (100.0%) | 73 (100.0%) |
| Total | 438 (86.7%) | 439 (96.7%) |
Income Below Poverty Among Married-Couple Families in Halaula
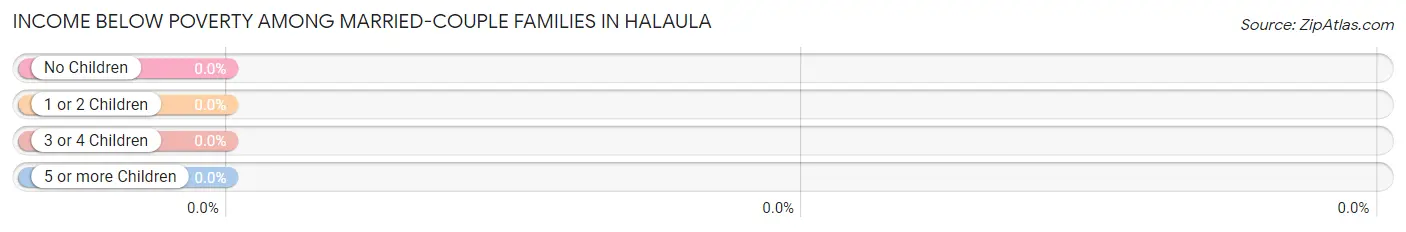
| Children | Above Poverty | Below Poverty |
| No Children | 55 (100.0%) | 0 (0.0%) |
| 1 or 2 Children | 14 (100.0%) | 0 (0.0%) |
| 3 or 4 Children | 10 (100.0%) | 0 (0.0%) |
| 5 or more Children | 9 (100.0%) | 0 (0.0%) |
| Total | 88 (100.0%) | 0 (0.0%) |
Income Below Poverty Among Single-Parent Households in Halaula
| Children | Single Father | Single Mother |
| No Children | 0 (0.0%) | 0 (0.0%) |
| 1 or 2 Children | 0 (0.0%) | 0 (0.0%) |
| 3 or 4 Children | 0 (0.0%) | 0 (0.0%) |
| 5 or more Children | 0 (0.0%) | 0 (0.0%) |
| Total | 0 (0.0%) | 0 (0.0%) |
Income Below Poverty Among Married-Couple vs Single-Parent Households in Halaula
| Children | Married-Couple Families | Single-Parent Households |
| No Children | 0 (0.0%) | 0 (0.0%) |
| 1 or 2 Children | 0 (0.0%) | 0 (0.0%) |
| 3 or 4 Children | 0 (0.0%) | 0 (0.0%) |
| 5 or more Children | 0 (0.0%) | 0 (0.0%) |
| Total | 0 (0.0%) | 0 (0.0%) |
Race in Halaula
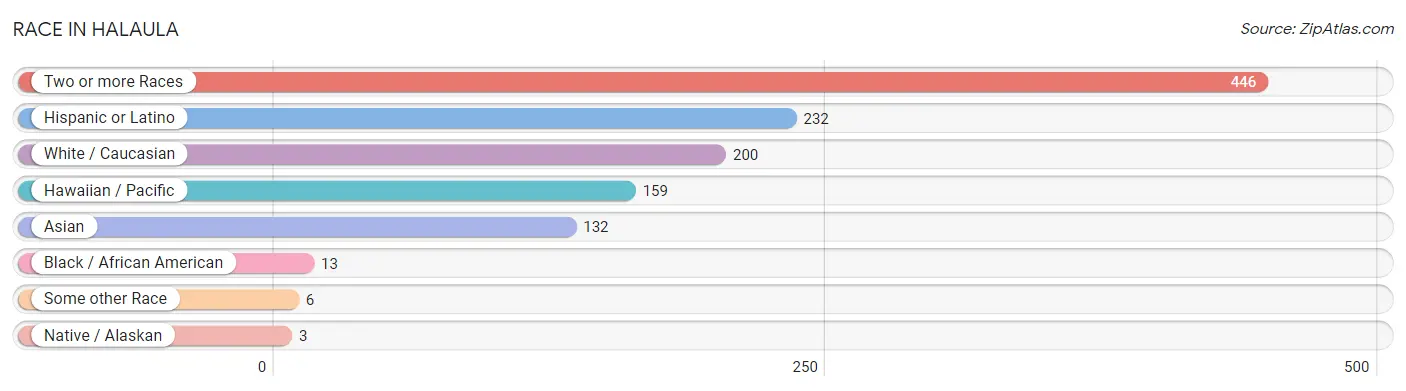
The most populous races in Halaula are Two or more Races (446 | 46.5%), Hispanic or Latino (232 | 24.2%), and White / Caucasian (200 | 20.9%).
| Race | # Population | % Population |
| Asian | 132 | 13.8% |
| Black / African American | 13 | 1.4% |
| Hawaiian / Pacific | 159 | 16.6% |
| Hispanic or Latino | 232 | 24.2% |
| Native / Alaskan | 3 | 0.3% |
| White / Caucasian | 200 | 20.9% |
| Two or more Races | 446 | 46.5% |
| Some other Race | 6 | 0.6% |
| Total | 959 | 100.0% |
Ancestry in Halaula
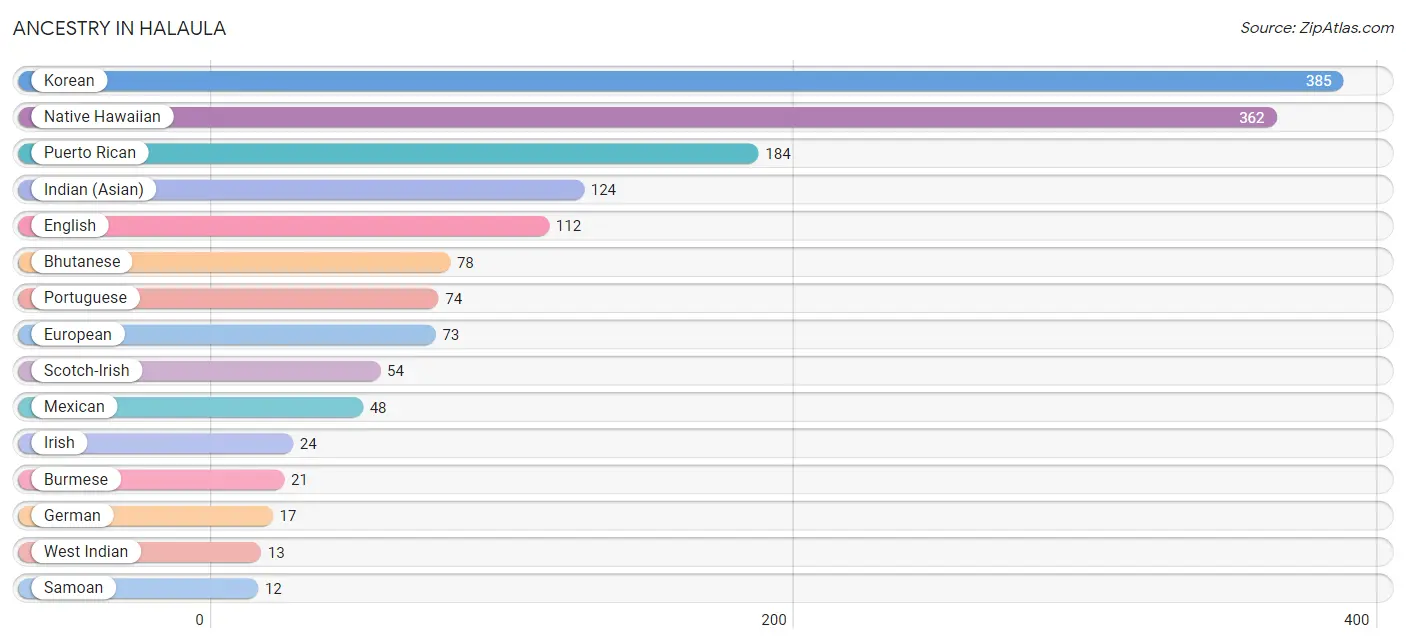
The most populous ancestries reported in Halaula are Korean (385 | 40.2%), Native Hawaiian (362 | 37.8%), Puerto Rican (184 | 19.2%), Indian (Asian) (124 | 12.9%), and English (112 | 11.7%), together accounting for 121.7% of all Halaula residents.
| Ancestry | # Population | % Population |
| American | 9 | 0.9% |
| Bhutanese | 78 | 8.1% |
| British | 6 | 0.6% |
| Burmese | 21 | 2.2% |
| Cherokee | 3 | 0.3% |
| Danish | 5 | 0.5% |
| Dutch | 8 | 0.8% |
| English | 112 | 11.7% |
| European | 73 | 7.6% |
| Finnish | 5 | 0.5% |
| German | 17 | 1.8% |
| Icelander | 6 | 0.6% |
| Indian (Asian) | 124 | 12.9% |
| Irish | 24 | 2.5% |
| Italian | 3 | 0.3% |
| Korean | 385 | 40.2% |
| Mexican | 48 | 5.0% |
| Native Hawaiian | 362 | 37.8% |
| Portuguese | 74 | 7.7% |
| Puerto Rican | 184 | 19.2% |
| Samoan | 12 | 1.3% |
| Scotch-Irish | 54 | 5.6% |
| Swedish | 12 | 1.3% |
| West Indian | 13 | 1.4% | View All 24 Rows |
Immigrants in Halaula
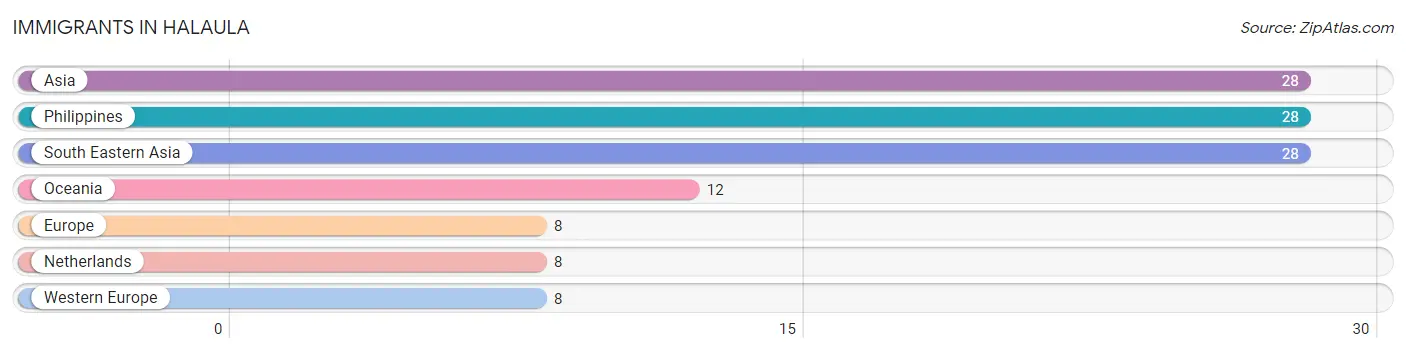
The most numerous immigrant groups reported in Halaula came from Asia (28 | 2.9%), Philippines (28 | 2.9%), South Eastern Asia (28 | 2.9%), Oceania (12 | 1.3%), and Europe (8 | 0.8%), together accounting for 10.8% of all Halaula residents.
| Immigration Origin | # Population | % Population |
| Asia | 28 | 2.9% |
| Europe | 8 | 0.8% |
| Netherlands | 8 | 0.8% |
| Oceania | 12 | 1.3% |
| Philippines | 28 | 2.9% |
| South Eastern Asia | 28 | 2.9% |
| Western Europe | 8 | 0.8% | View All 7 Rows |
Sex and Age in Halaula
Sex and Age in Halaula
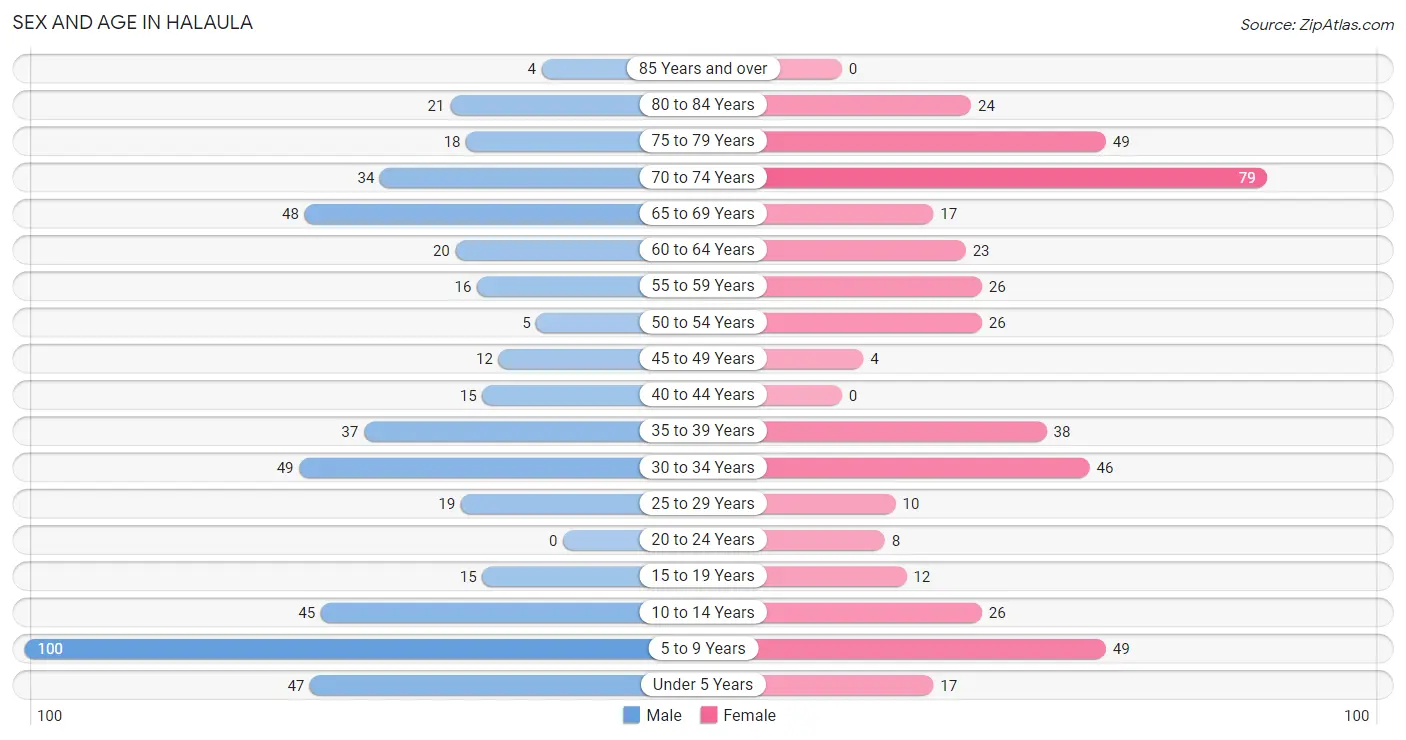
The most populous age groups in Halaula are 5 to 9 Years (100 | 19.8%) for men and 70 to 74 Years (79 | 17.4%) for women.
| Age Bracket | Male | Female |
| Under 5 Years | 47 (9.3%) | 17 (3.7%) |
| 5 to 9 Years | 100 (19.8%) | 49 (10.8%) |
| 10 to 14 Years | 45 (8.9%) | 26 (5.7%) |
| 15 to 19 Years | 15 (3.0%) | 12 (2.6%) |
| 20 to 24 Years | 0 (0.0%) | 8 (1.8%) |
| 25 to 29 Years | 19 (3.8%) | 10 (2.2%) |
| 30 to 34 Years | 49 (9.7%) | 46 (10.1%) |
| 35 to 39 Years | 37 (7.3%) | 38 (8.4%) |
| 40 to 44 Years | 15 (3.0%) | 0 (0.0%) |
| 45 to 49 Years | 12 (2.4%) | 4 (0.9%) |
| 50 to 54 Years | 5 (1.0%) | 26 (5.7%) |
| 55 to 59 Years | 16 (3.2%) | 26 (5.7%) |
| 60 to 64 Years | 20 (4.0%) | 23 (5.1%) |
| 65 to 69 Years | 48 (9.5%) | 17 (3.7%) |
| 70 to 74 Years | 34 (6.7%) | 79 (17.4%) |
| 75 to 79 Years | 18 (3.6%) | 49 (10.8%) |
| 80 to 84 Years | 21 (4.2%) | 24 (5.3%) |
| 85 Years and over | 4 (0.8%) | 0 (0.0%) |
| Total | 505 (100.0%) | 454 (100.0%) |
Families and Households in Halaula
Median Family Size in Halaula
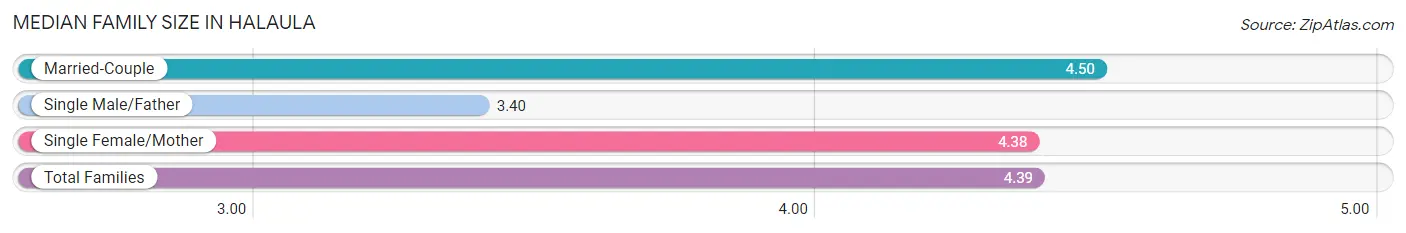
The median family size in Halaula is 4.39 persons per family, with married-couple families (88 | 49.2%) accounting for the largest median family size of 4.5 persons per family. On the other hand, single male/father families (10 | 5.6%) represent the smallest median family size with 3.40 persons per family.
| Family Type | # Families | Family Size |
| Married-Couple | 88 (49.2%) | 4.50 |
| Single Male/Father | 10 (5.6%) | 3.40 |
| Single Female/Mother | 81 (45.3%) | 4.38 |
| Total Families | 179 (100.0%) | 4.39 |
Median Household Size in Halaula
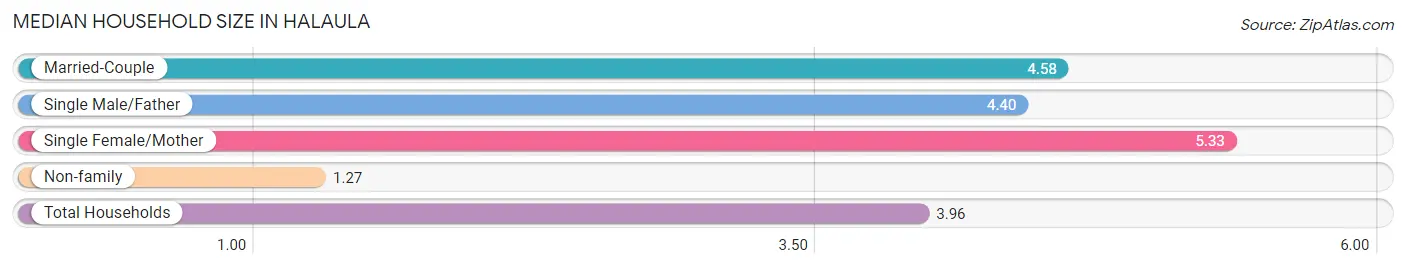
The median household size in Halaula is 3.96 persons per household, with single female/mother households (81 | 33.5%) accounting for the largest median household size of 5.33 persons per household. non-family households (63 | 26.0%) represent the smallest median household size with 1.27 persons per household.
| Household Type | # Households | Household Size |
| Married-Couple | 88 (36.4%) | 4.58 |
| Single Male/Father | 10 (4.1%) | 4.40 |
| Single Female/Mother | 81 (33.5%) | 5.33 |
| Non-family | 63 (26.0%) | 1.27 |
| Total Households | 242 (100.0%) | 3.96 |
Household Size by Marriage Status in Halaula
Out of a total of 242 households in Halaula, 179 (74.0%) are family households, while 63 (26.0%) are nonfamily households. The most numerous type of family households are 3-person households, comprising 58, and the most common type of nonfamily households are 1-person households, comprising 40.
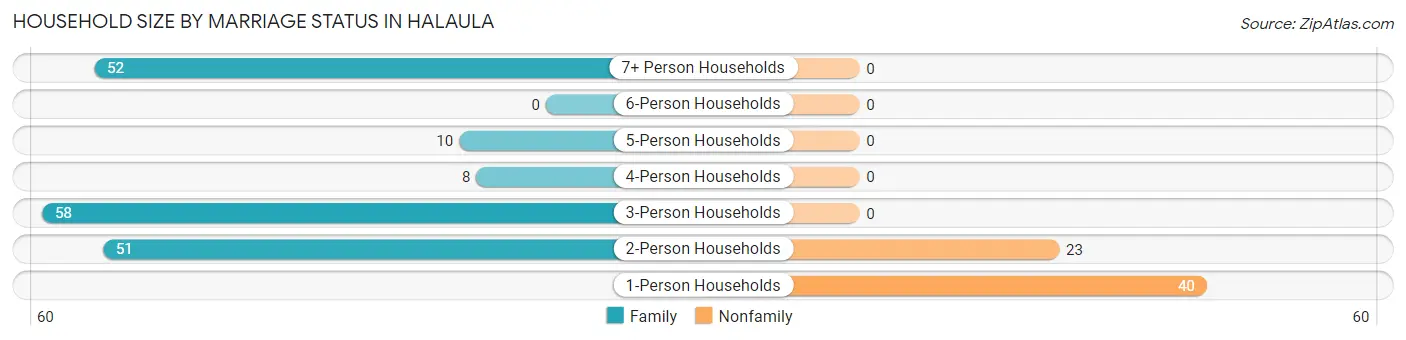
| Household Size | Family Households | Nonfamily Households |
| 1-Person Households | - | 40 (16.5%) |
| 2-Person Households | 51 (21.1%) | 23 (9.5%) |
| 3-Person Households | 58 (24.0%) | 0 (0.0%) |
| 4-Person Households | 8 (3.3%) | 0 (0.0%) |
| 5-Person Households | 10 (4.1%) | 0 (0.0%) |
| 6-Person Households | 0 (0.0%) | 0 (0.0%) |
| 7+ Person Households | 52 (21.5%) | 0 (0.0%) |
| Total | 179 (74.0%) | 63 (26.0%) |
Female Fertility in Halaula
Fertility by Age in Halaula
Average fertility rate in Halaula is 81.0 births per 1,000 women. Women in the age bracket of 20 to 34 years have the highest fertility rate with 156.0 births per 1,000 women. Women in the age bracket of 20 to 34 years acount for 100.0% of all women with births.
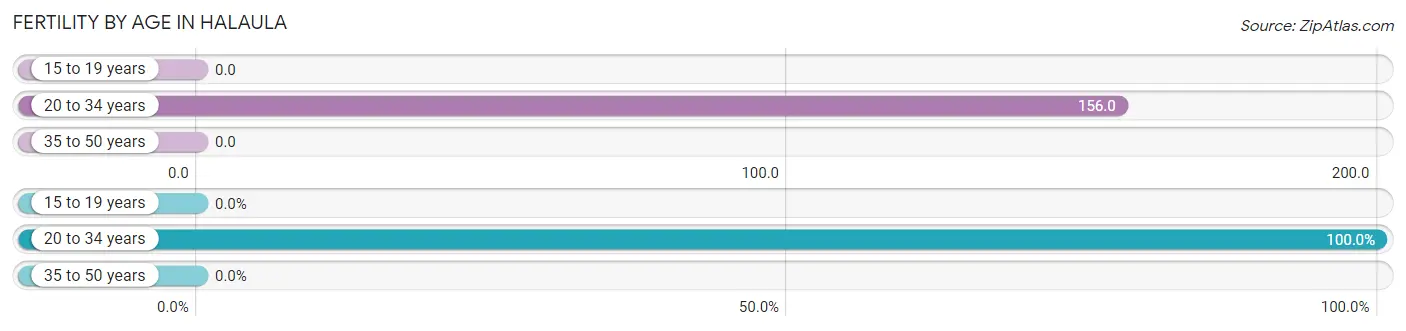
| Age Bracket | Women with Births | Births / 1,000 Women |
| 15 to 19 years | 0 (0.0%) | 0.0 |
| 20 to 34 years | 10 (100.0%) | 156.0 |
| 35 to 50 years | 0 (0.0%) | 0.0 |
| Total | 10 (100.0%) | 81.0 |
Fertility by Age by Marriage Status in Halaula
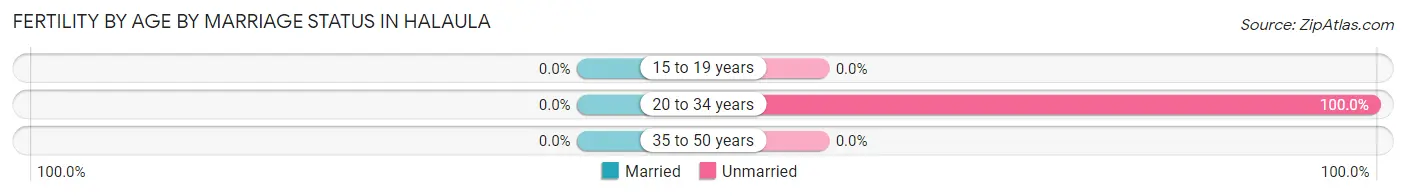
| Age Bracket | Married | Unmarried |
| 15 to 19 years | 0 (0.0%) | 0 (0.0%) |
| 20 to 34 years | 0 (0.0%) | 10 (100.0%) |
| 35 to 50 years | 0 (0.0%) | 0 (0.0%) |
| Total | 0 (0.0%) | 10 (100.0%) |
Fertility by Education in Halaula
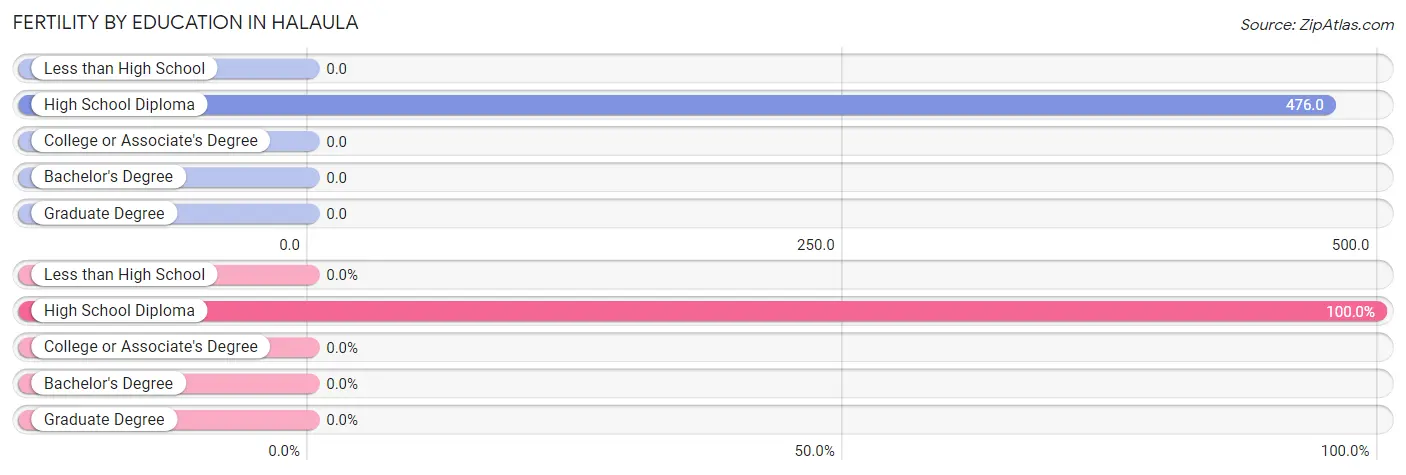
| Educational Attainment | Women with Births | Births / 1,000 Women |
| Less than High School | 0 (0.0%) | 0.0 |
| High School Diploma | 10 (100.0%) | 476.0 |
| College or Associate's Degree | 0 (0.0%) | 0.0 |
| Bachelor's Degree | 0 (0.0%) | 0.0 |
| Graduate Degree | 0 (0.0%) | 0.0 |
| Total | 10 (100.0%) | 81.0 |
Fertility by Education by Marriage Status in Halaula
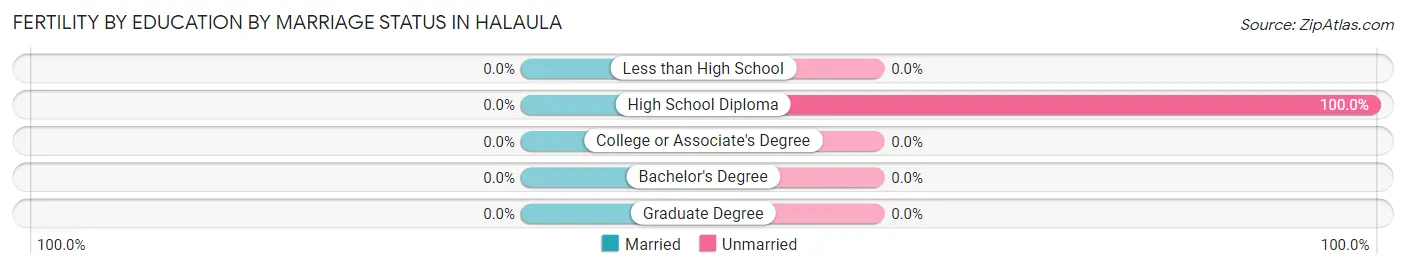
| Educational Attainment | Married | Unmarried |
| Less than High School | 0 (0.0%) | 0 (0.0%) |
| High School Diploma | 0 (0.0%) | 10 (100.0%) |
| College or Associate's Degree | 0 (0.0%) | 0 (0.0%) |
| Bachelor's Degree | 0 (0.0%) | 0 (0.0%) |
| Graduate Degree | 0 (0.0%) | 0 (0.0%) |
| Total | 0 (0.0%) | 10 (100.0%) |
Employment Characteristics in Halaula
Employment by Class of Employer in Halaula
Among the 342 employed individuals in Halaula, private company employees (191 | 55.8%), self-employed (not incorporated) (78 | 22.8%), and state government employees (45 | 13.2%) make up the most common classes of employment.
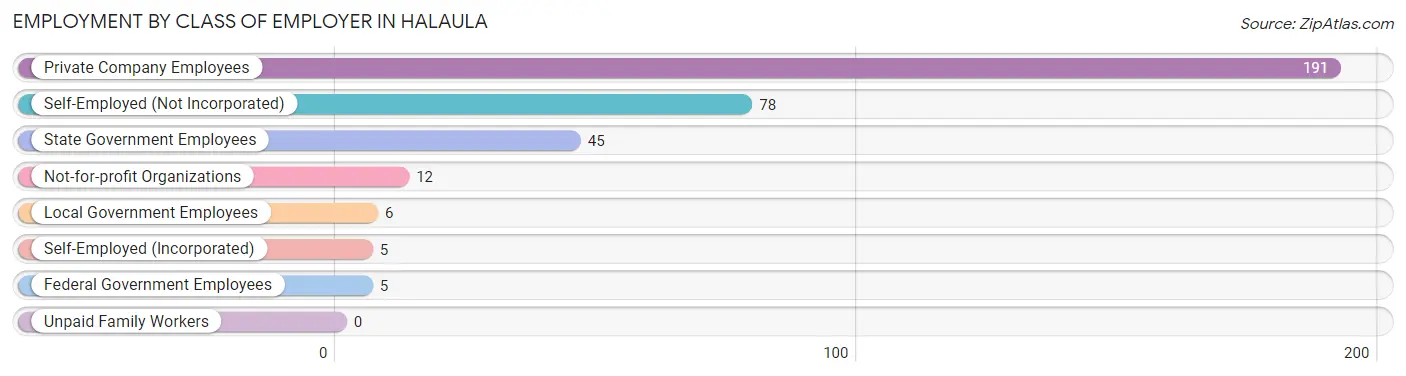
| Employer Class | # Employees | % Employees |
| Private Company Employees | 191 | 55.8% |
| Self-Employed (Incorporated) | 5 | 1.5% |
| Self-Employed (Not Incorporated) | 78 | 22.8% |
| Not-for-profit Organizations | 12 | 3.5% |
| Local Government Employees | 6 | 1.8% |
| State Government Employees | 45 | 13.2% |
| Federal Government Employees | 5 | 1.5% |
| Unpaid Family Workers | 0 | 0.0% |
| Total | 342 | 100.0% |
Employment Status by Age in Halaula
According to the labor force statistics for Halaula, out of the total population over 16 years of age (670), 53.7% or 360 individuals are in the labor force, with 5.0% or 18 of them unemployed. The age group with the highest labor force participation rate is 20 to 24 years, with 100.0% or 8 individuals in the labor force. Within the labor force, the 20 to 24 years age range has the highest percentage of unemployed individuals, with 50.0% or 4 of them being unemployed.
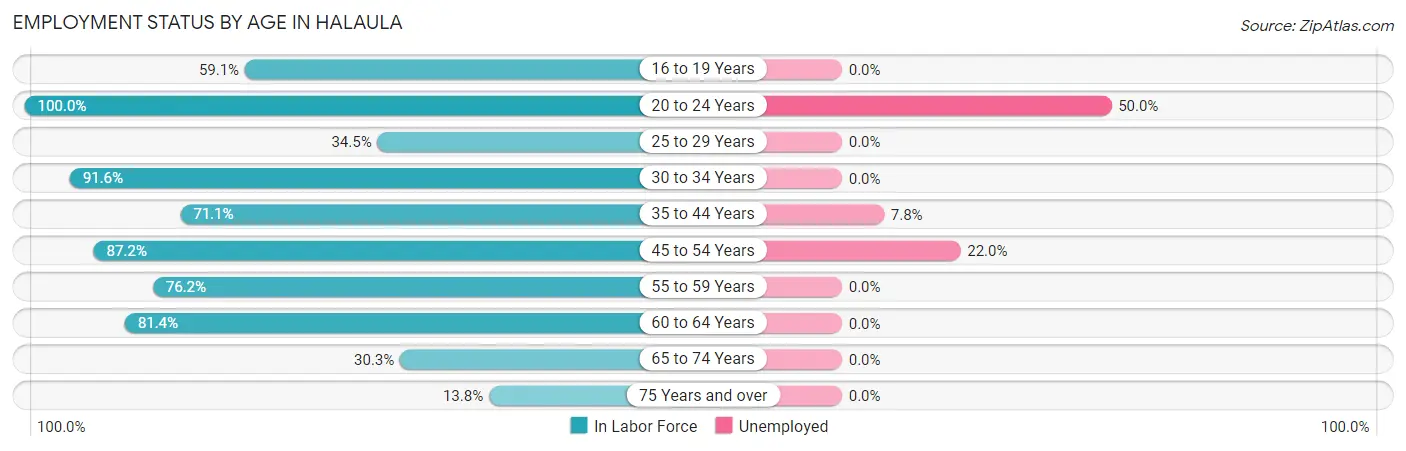
| Age Bracket | In Labor Force | Unemployed |
| 16 to 19 Years | 13 (59.1%) | 0 (0.0%) |
| 20 to 24 Years | 8 (100.0%) | 4 (50.0%) |
| 25 to 29 Years | 10 (34.5%) | 0 (0.0%) |
| 30 to 34 Years | 87 (91.6%) | 0 (0.0%) |
| 35 to 44 Years | 64 (71.1%) | 5 (7.8%) |
| 45 to 54 Years | 41 (87.2%) | 9 (22.0%) |
| 55 to 59 Years | 32 (76.2%) | 0 (0.0%) |
| 60 to 64 Years | 35 (81.4%) | 0 (0.0%) |
| 65 to 74 Years | 54 (30.3%) | 0 (0.0%) |
| 75 Years and over | 16 (13.8%) | 0 (0.0%) |
| Total | 360 (53.7%) | 18 (5.0%) |
Employment Status by Educational Attainment in Halaula
According to labor force statistics for Halaula, 77.7% of individuals (269) out of the total population between 25 and 64 years of age (346) are in the labor force, with 5.2% or 14 of them being unemployed. The group with the highest labor force participation rate are those with the educational attainment of bachelor's degree or higher, with 89.6% or 43 individuals in the labor force. Within the labor force, individuals with high school diploma education have the highest percentage of unemployment, with 14.4% or 14 of them being unemployed.
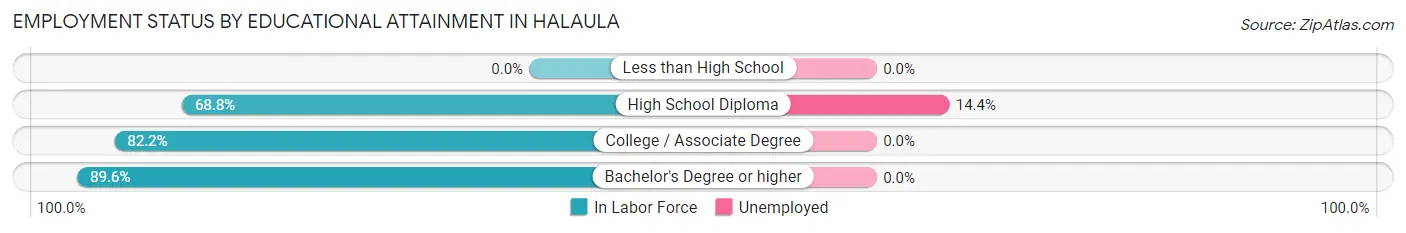
| Educational Attainment | In Labor Force | Unemployed |
| Less than High School | 0 (0.0%) | 0 (0.0%) |
| High School Diploma | 97 (68.8%) | 20 (14.4%) |
| College / Associate Degree | 129 (82.2%) | 0 (0.0%) |
| Bachelor's Degree or higher | 43 (89.6%) | 0 (0.0%) |
| Total | 269 (77.7%) | 18 (5.2%) |
Employment Occupations by Sex in Halaula
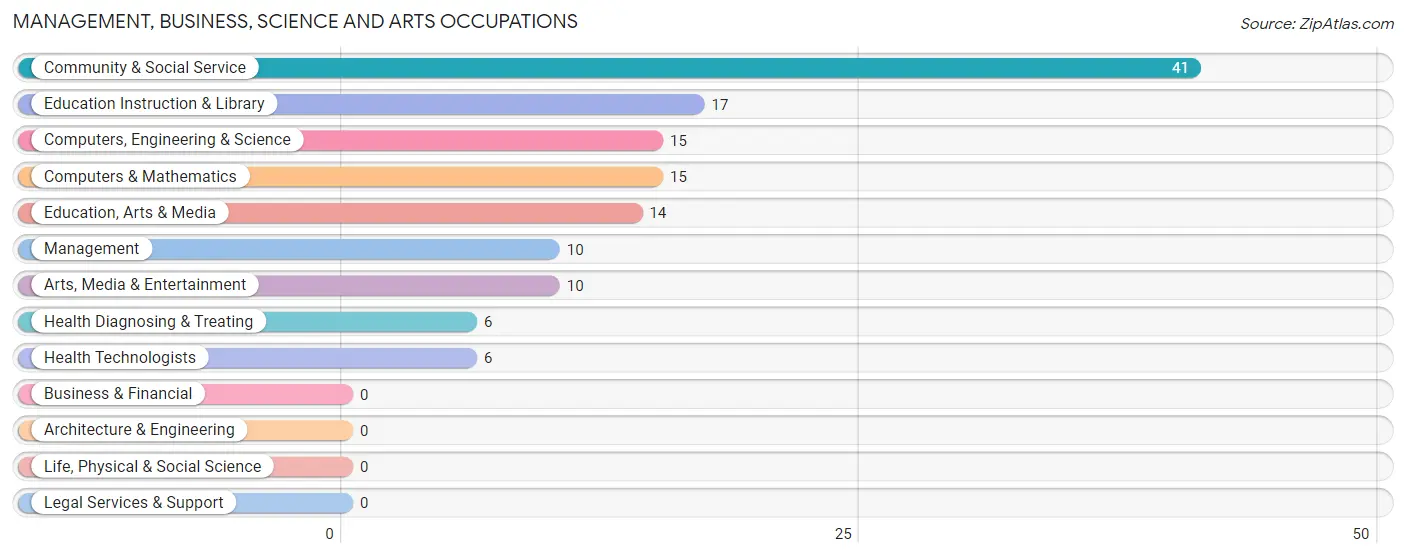
Management, Business, Science and Arts Occupations
The most common Management, Business, Science and Arts occupations in Halaula are Community & Social Service (41 | 12.0%), Education Instruction & Library (17 | 5.0%), Computers, Engineering & Science (15 | 4.4%), Computers & Mathematics (15 | 4.4%), and Education, Arts & Media (14 | 4.1%).
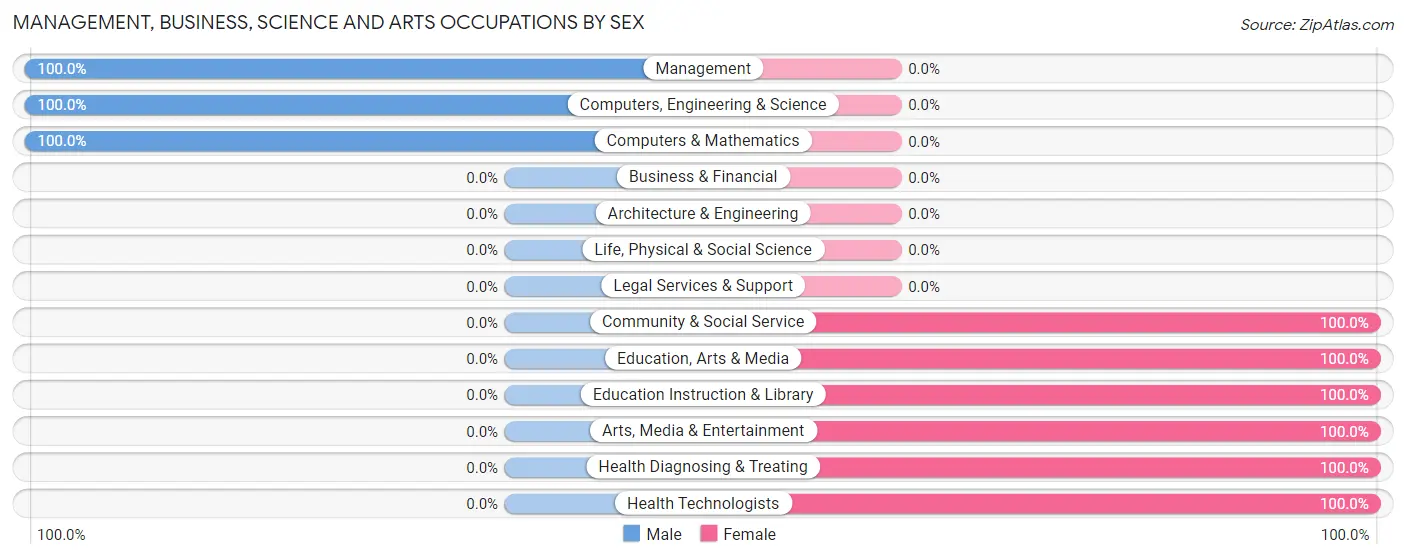
Management, Business, Science and Arts Occupations by Sex
Within the Management, Business, Science and Arts occupations in Halaula, the most male-oriented occupations are Management (100.0%), Computers, Engineering & Science (100.0%), and Computers & Mathematics (100.0%), while the most female-oriented occupations are Community & Social Service (100.0%), Education, Arts & Media (100.0%), and Education Instruction & Library (100.0%).
| Occupation | Male | Female |
| Management | 10 (100.0%) | 0 (0.0%) |
| Business & Financial | 0 (0.0%) | 0 (0.0%) |
| Computers, Engineering & Science | 15 (100.0%) | 0 (0.0%) |
| Computers & Mathematics | 15 (100.0%) | 0 (0.0%) |
| Architecture & Engineering | 0 (0.0%) | 0 (0.0%) |
| Life, Physical & Social Science | 0 (0.0%) | 0 (0.0%) |
| Community & Social Service | 0 (0.0%) | 41 (100.0%) |
| Education, Arts & Media | 0 (0.0%) | 14 (100.0%) |
| Legal Services & Support | 0 (0.0%) | 0 (0.0%) |
| Education Instruction & Library | 0 (0.0%) | 17 (100.0%) |
| Arts, Media & Entertainment | 0 (0.0%) | 10 (100.0%) |
| Health Diagnosing & Treating | 0 (0.0%) | 6 (100.0%) |
| Health Technologists | 0 (0.0%) | 6 (100.0%) |
| Total (Category) | 25 (34.7%) | 47 (65.3%) |
| Total (Overall) | 194 (56.7%) | 148 (43.3%) |
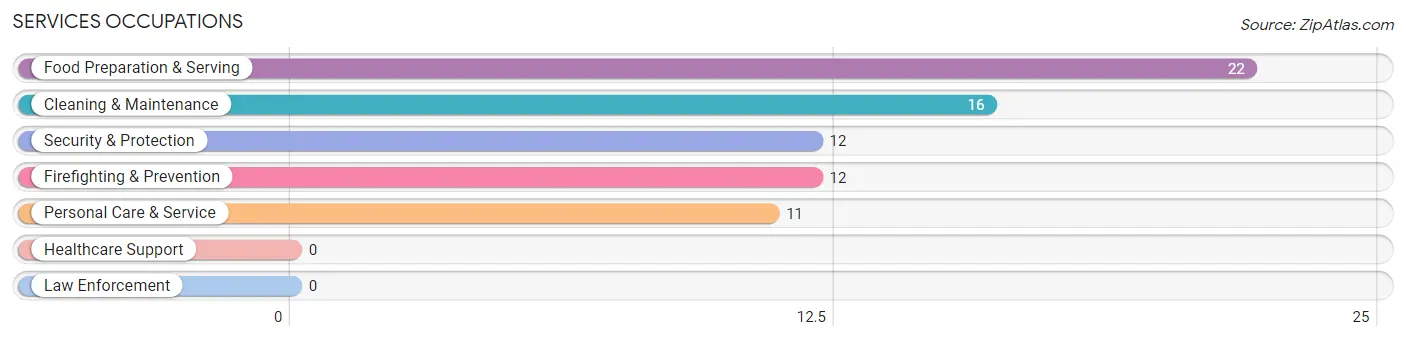
Services Occupations
The most common Services occupations in Halaula are Food Preparation & Serving (22 | 6.4%), Cleaning & Maintenance (16 | 4.7%), Security & Protection (12 | 3.5%), Firefighting & Prevention (12 | 3.5%), and Personal Care & Service (11 | 3.2%).
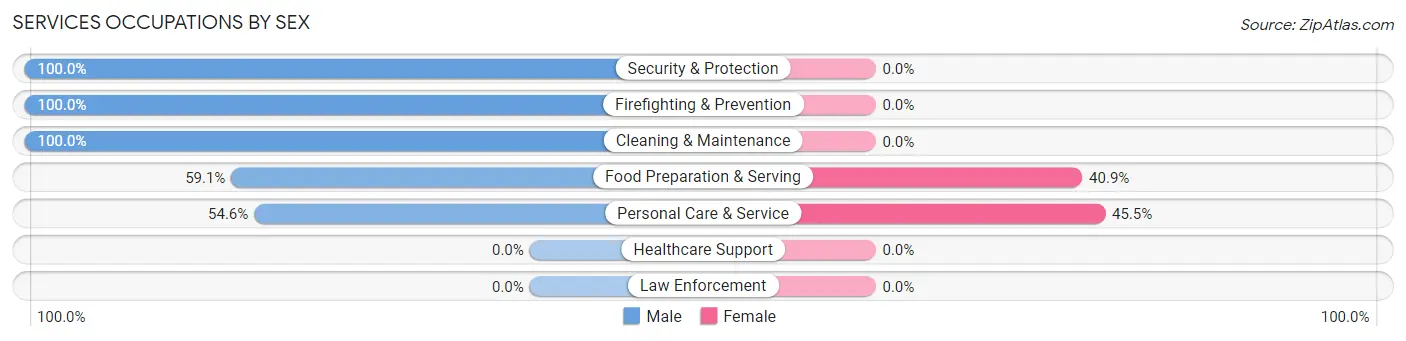
Services Occupations by Sex
Within the Services occupations in Halaula, the most male-oriented occupations are Security & Protection (100.0%), Firefighting & Prevention (100.0%), and Cleaning & Maintenance (100.0%), while the most female-oriented occupations are Personal Care & Service (45.5%), and Food Preparation & Serving (40.9%).
| Occupation | Male | Female |
| Healthcare Support | 0 (0.0%) | 0 (0.0%) |
| Security & Protection | 12 (100.0%) | 0 (0.0%) |
| Firefighting & Prevention | 12 (100.0%) | 0 (0.0%) |
| Law Enforcement | 0 (0.0%) | 0 (0.0%) |
| Food Preparation & Serving | 13 (59.1%) | 9 (40.9%) |
| Cleaning & Maintenance | 16 (100.0%) | 0 (0.0%) |
| Personal Care & Service | 6 (54.5%) | 5 (45.5%) |
| Total (Category) | 47 (77.0%) | 14 (23.0%) |
| Total (Overall) | 194 (56.7%) | 148 (43.3%) |
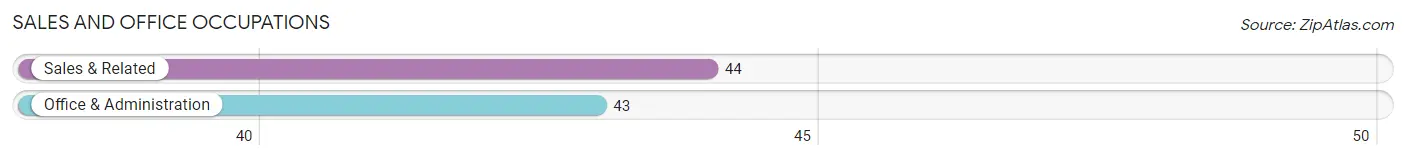
Sales and Office Occupations
The most common Sales and Office occupations in Halaula are Sales & Related (44 | 12.9%), and Office & Administration (43 | 12.6%).
Sales and Office Occupations by Sex
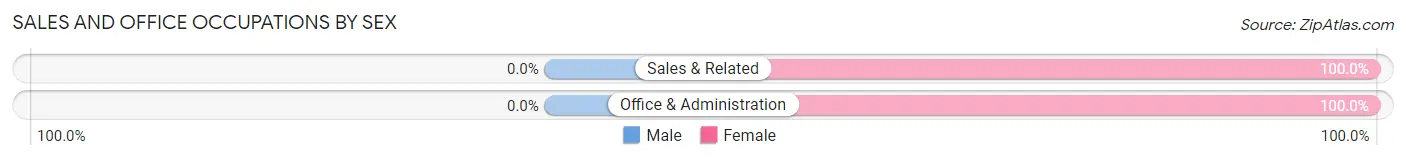
| Occupation | Male | Female |
| Sales & Related | 0 (0.0%) | 44 (100.0%) |
| Office & Administration | 0 (0.0%) | 43 (100.0%) |
| Total (Category) | 0 (0.0%) | 87 (100.0%) |
| Total (Overall) | 194 (56.7%) | 148 (43.3%) |
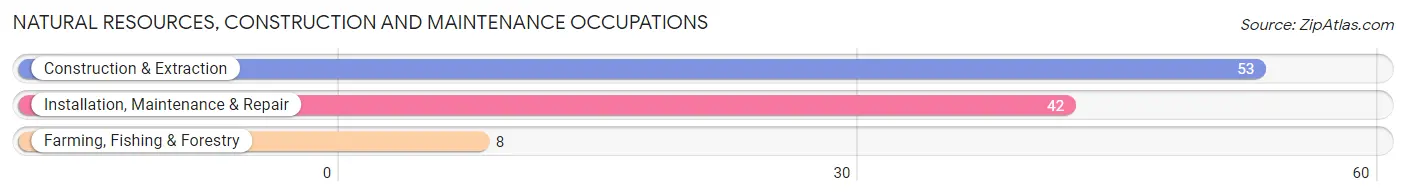
Natural Resources, Construction and Maintenance Occupations
The most common Natural Resources, Construction and Maintenance occupations in Halaula are Construction & Extraction (53 | 15.5%), Installation, Maintenance & Repair (42 | 12.3%), and Farming, Fishing & Forestry (8 | 2.3%).
Natural Resources, Construction and Maintenance Occupations by Sex
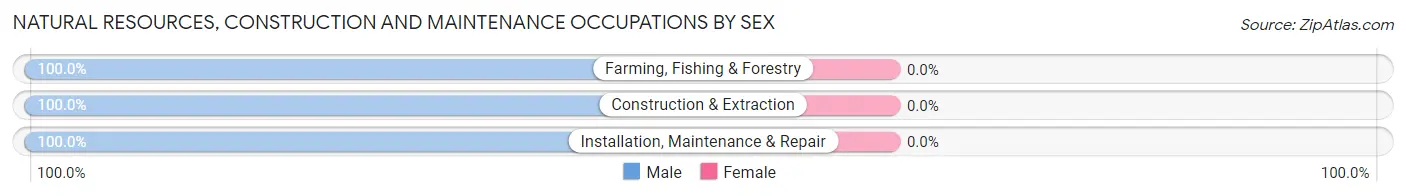
| Occupation | Male | Female |
| Farming, Fishing & Forestry | 8 (100.0%) | 0 (0.0%) |
| Construction & Extraction | 53 (100.0%) | 0 (0.0%) |
| Installation, Maintenance & Repair | 42 (100.0%) | 0 (0.0%) |
| Total (Category) | 103 (100.0%) | 0 (0.0%) |
| Total (Overall) | 194 (56.7%) | 148 (43.3%) |
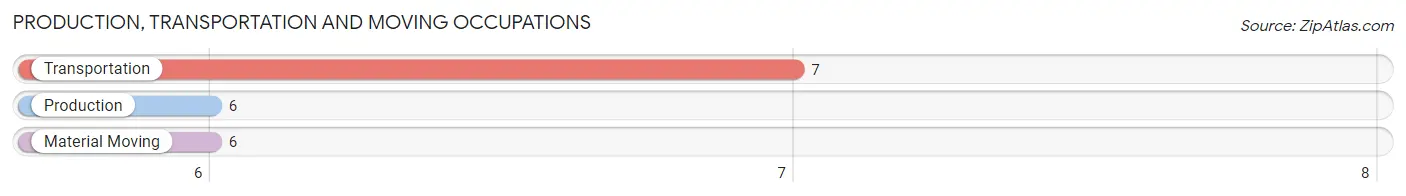
Production, Transportation and Moving Occupations
The most common Production, Transportation and Moving occupations in Halaula are Transportation (7 | 2.1%), Production (6 | 1.8%), and Material Moving (6 | 1.8%).
Production, Transportation and Moving Occupations by Sex
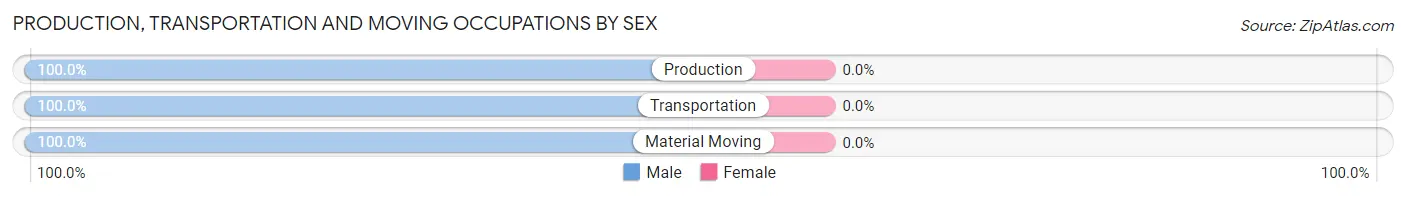
| Occupation | Male | Female |
| Production | 6 (100.0%) | 0 (0.0%) |
| Transportation | 7 (100.0%) | 0 (0.0%) |
| Material Moving | 6 (100.0%) | 0 (0.0%) |
| Total (Category) | 19 (100.0%) | 0 (0.0%) |
| Total (Overall) | 194 (56.7%) | 148 (43.3%) |
Employment Industries by Sex in Halaula
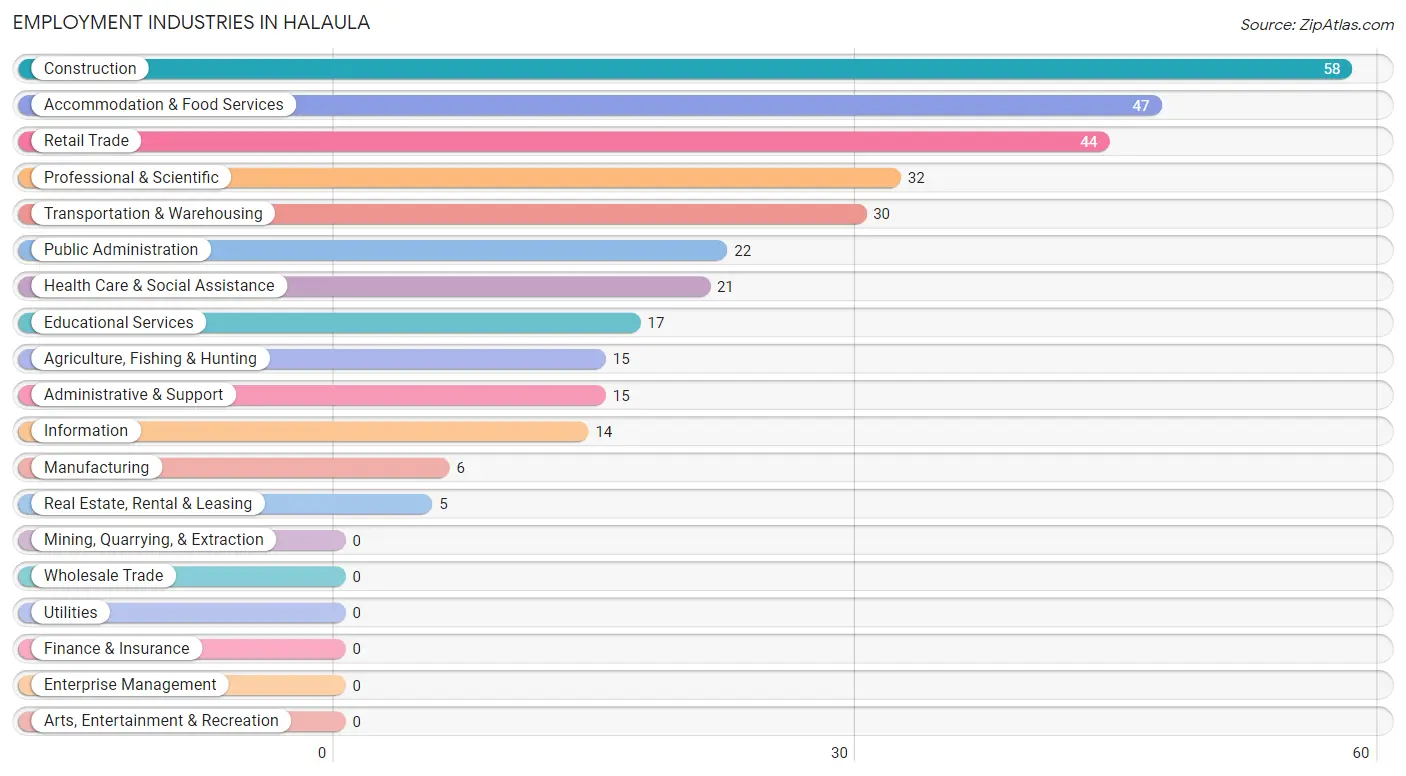
Employment Industries in Halaula
The major employment industries in Halaula include Construction (58 | 17.0%), Accommodation & Food Services (47 | 13.7%), Retail Trade (44 | 12.9%), Professional & Scientific (32 | 9.4%), and Transportation & Warehousing (30 | 8.8%).
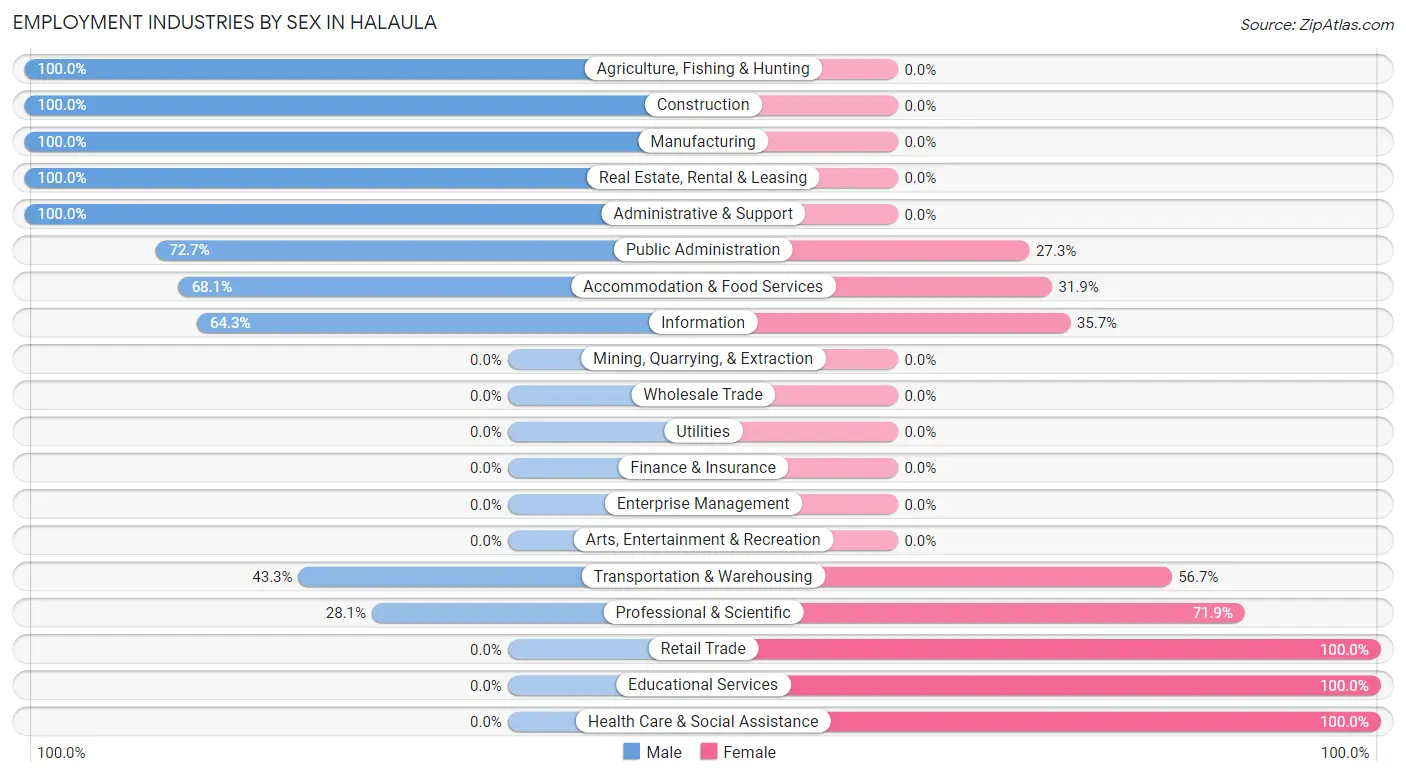
Employment Industries by Sex in Halaula
The Halaula industries that see more men than women are Agriculture, Fishing & Hunting (100.0%), Construction (100.0%), and Manufacturing (100.0%), whereas the industries that tend to have a higher number of women are Retail Trade (100.0%), Educational Services (100.0%), and Health Care & Social Assistance (100.0%).
| Industry | Male | Female |
| Agriculture, Fishing & Hunting | 15 (100.0%) | 0 (0.0%) |
| Mining, Quarrying, & Extraction | 0 (0.0%) | 0 (0.0%) |
| Construction | 58 (100.0%) | 0 (0.0%) |
| Manufacturing | 6 (100.0%) | 0 (0.0%) |
| Wholesale Trade | 0 (0.0%) | 0 (0.0%) |
| Retail Trade | 0 (0.0%) | 44 (100.0%) |
| Transportation & Warehousing | 13 (43.3%) | 17 (56.7%) |
| Utilities | 0 (0.0%) | 0 (0.0%) |
| Information | 9 (64.3%) | 5 (35.7%) |
| Finance & Insurance | 0 (0.0%) | 0 (0.0%) |
| Real Estate, Rental & Leasing | 5 (100.0%) | 0 (0.0%) |
| Professional & Scientific | 9 (28.1%) | 23 (71.9%) |
| Enterprise Management | 0 (0.0%) | 0 (0.0%) |
| Administrative & Support | 15 (100.0%) | 0 (0.0%) |
| Educational Services | 0 (0.0%) | 17 (100.0%) |
| Health Care & Social Assistance | 0 (0.0%) | 21 (100.0%) |
| Arts, Entertainment & Recreation | 0 (0.0%) | 0 (0.0%) |
| Accommodation & Food Services | 32 (68.1%) | 15 (31.9%) |
| Public Administration | 16 (72.7%) | 6 (27.3%) |
| Total | 194 (56.7%) | 148 (43.3%) |
Education in Halaula
School Enrollment in Halaula
The most common levels of schooling among the 321 students in Halaula are elementary school (136 | 42.4%), middle school (71 | 22.1%), and graduate / professional (65 | 20.3%).
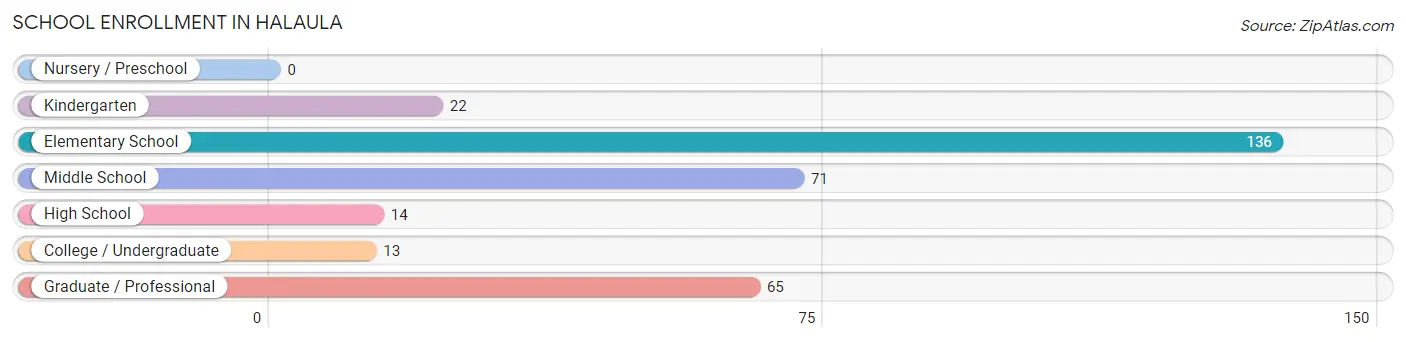
| School Level | # Students | % Students |
| Nursery / Preschool | 0 | 0.0% |
| Kindergarten | 22 | 6.9% |
| Elementary School | 136 | 42.4% |
| Middle School | 71 | 22.1% |
| High School | 14 | 4.4% |
| College / Undergraduate | 13 | 4.1% |
| Graduate / Professional | 65 | 20.3% |
| Total | 321 | 100.0% |
School Enrollment by Age by Funding Source in Halaula
Out of a total of 321 students who are enrolled in schools in Halaula, 60 (18.7%) attend a private institution, while the remaining 261 (81.3%) are enrolled in public schools. The age group of 3 to 4 year olds has the highest likelihood of being enrolled in private schools, with 9 (100.0% in the age bracket) enrolled. Conversely, the age group of 15 to 17 year olds has the lowest likelihood of being enrolled in a private school, with 14 (100.0% in the age bracket) attending a public institution.
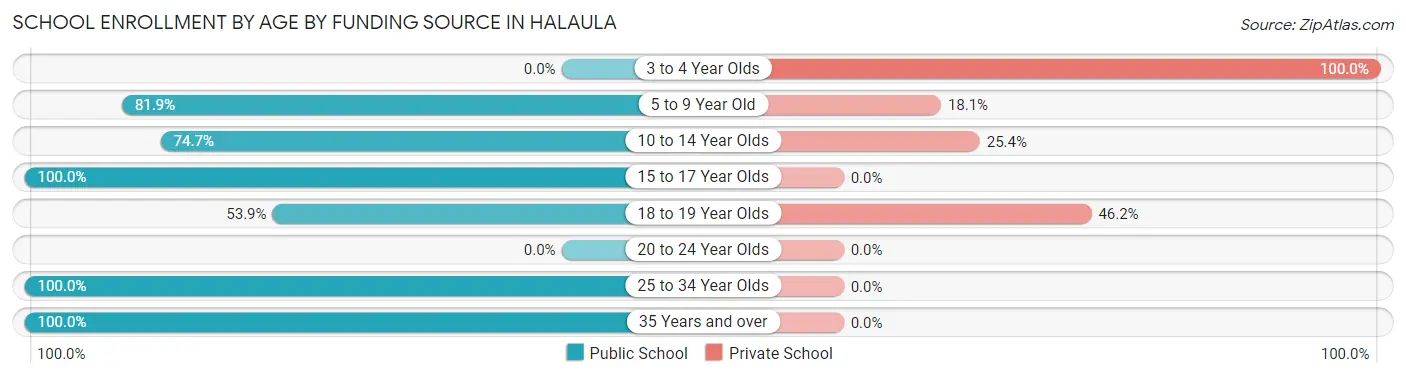
| Age Bracket | Public School | Private School |
| 3 to 4 Year Olds | 0 (0.0%) | 9 (100.0%) |
| 5 to 9 Year Old | 122 (81.9%) | 27 (18.1%) |
| 10 to 14 Year Olds | 53 (74.7%) | 18 (25.4%) |
| 15 to 17 Year Olds | 14 (100.0%) | 0 (0.0%) |
| 18 to 19 Year Olds | 7 (53.8%) | 6 (46.2%) |
| 20 to 24 Year Olds | 0 (0.0%) | 0 (0.0%) |
| 25 to 34 Year Olds | 12 (100.0%) | 0 (0.0%) |
| 35 Years and over | 53 (100.0%) | 0 (0.0%) |
| Total | 261 (81.3%) | 60 (18.7%) |
Educational Attainment by Field of Study in Halaula
Science & technology (59 | 40.7%), business (25 | 17.2%), liberal arts & history (12 | 8.3%), bio, nature & agricultural (9 | 6.2%), and education (9 | 6.2%) are the most common fields of study among 145 individuals in Halaula who have obtained a bachelor's degree or higher.
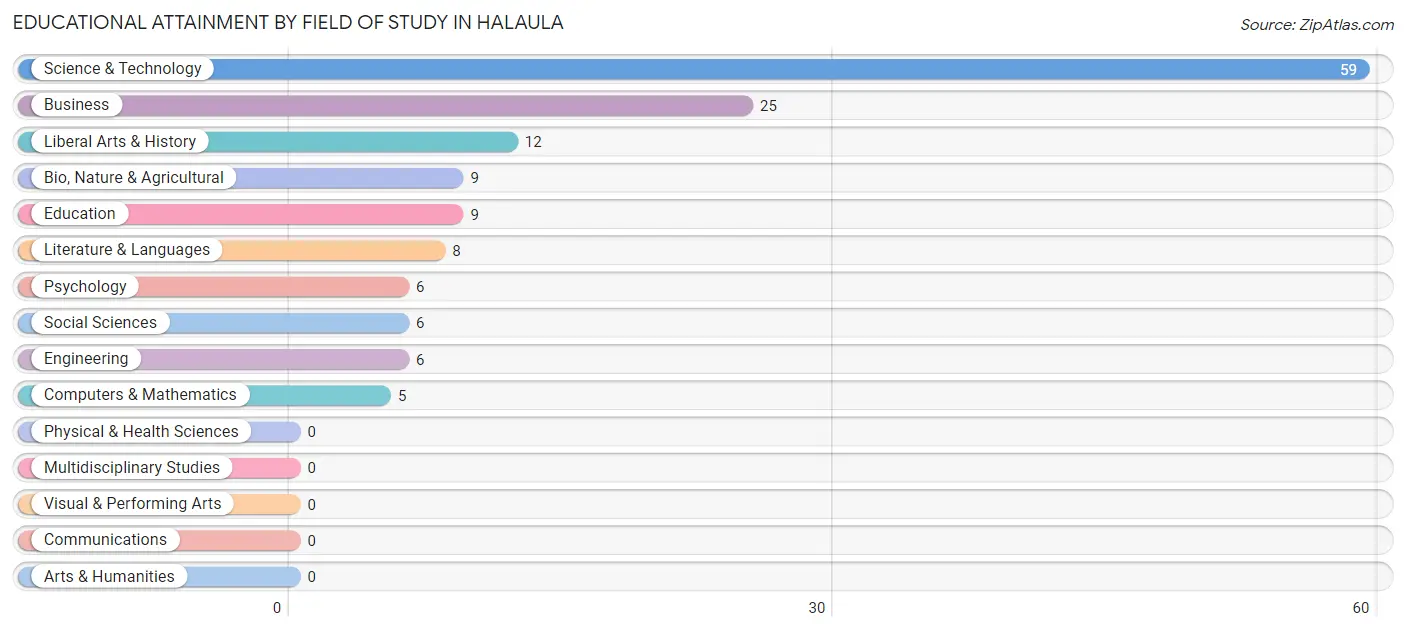
| Field of Study | # Graduates | % Graduates |
| Computers & Mathematics | 5 | 3.5% |
| Bio, Nature & Agricultural | 9 | 6.2% |
| Physical & Health Sciences | 0 | 0.0% |
| Psychology | 6 | 4.1% |
| Social Sciences | 6 | 4.1% |
| Engineering | 6 | 4.1% |
| Multidisciplinary Studies | 0 | 0.0% |
| Science & Technology | 59 | 40.7% |
| Business | 25 | 17.2% |
| Education | 9 | 6.2% |
| Literature & Languages | 8 | 5.5% |
| Liberal Arts & History | 12 | 8.3% |
| Visual & Performing Arts | 0 | 0.0% |
| Communications | 0 | 0.0% |
| Arts & Humanities | 0 | 0.0% |
| Total | 145 | 100.0% |
Transportation & Commute in Halaula
Vehicle Availability by Sex in Halaula
The most prevalent vehicle ownership categories in Halaula are males with 2 vehicles (58, accounting for 29.9%) and females with 2 vehicles (8, making up 39.2%).
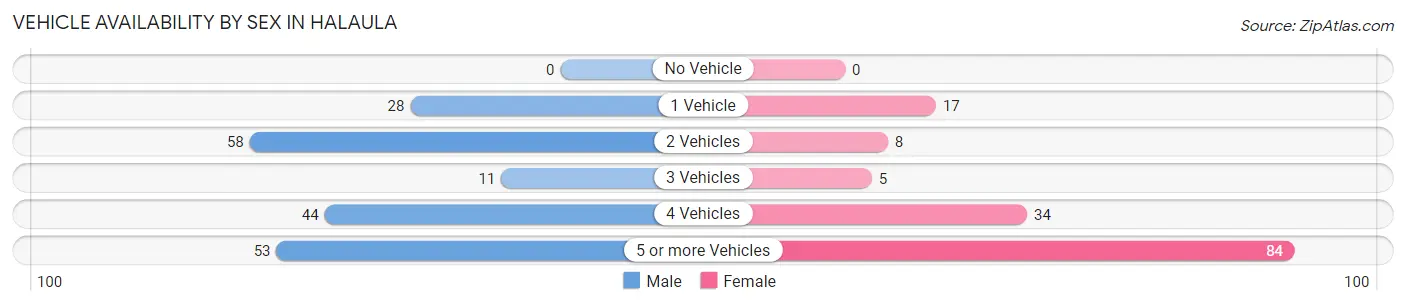
| Vehicles Available | Male | Female |
| No Vehicle | 0 (0.0%) | 0 (0.0%) |
| 1 Vehicle | 28 (14.4%) | 17 (11.5%) |
| 2 Vehicles | 58 (29.9%) | 8 (5.4%) |
| 3 Vehicles | 11 (5.7%) | 5 (3.4%) |
| 4 Vehicles | 44 (22.7%) | 34 (23.0%) |
| 5 or more Vehicles | 53 (27.3%) | 84 (56.8%) |
| Total | 194 (100.0%) | 148 (100.0%) |
Commute Time in Halaula
The most frequently occuring commute durations in Halaula are 15 to 19 minutes (63 commuters, 20.8%), 45 to 59 minutes (59 commuters, 19.5%), and 60 to 89 minutes (49 commuters, 16.2%).
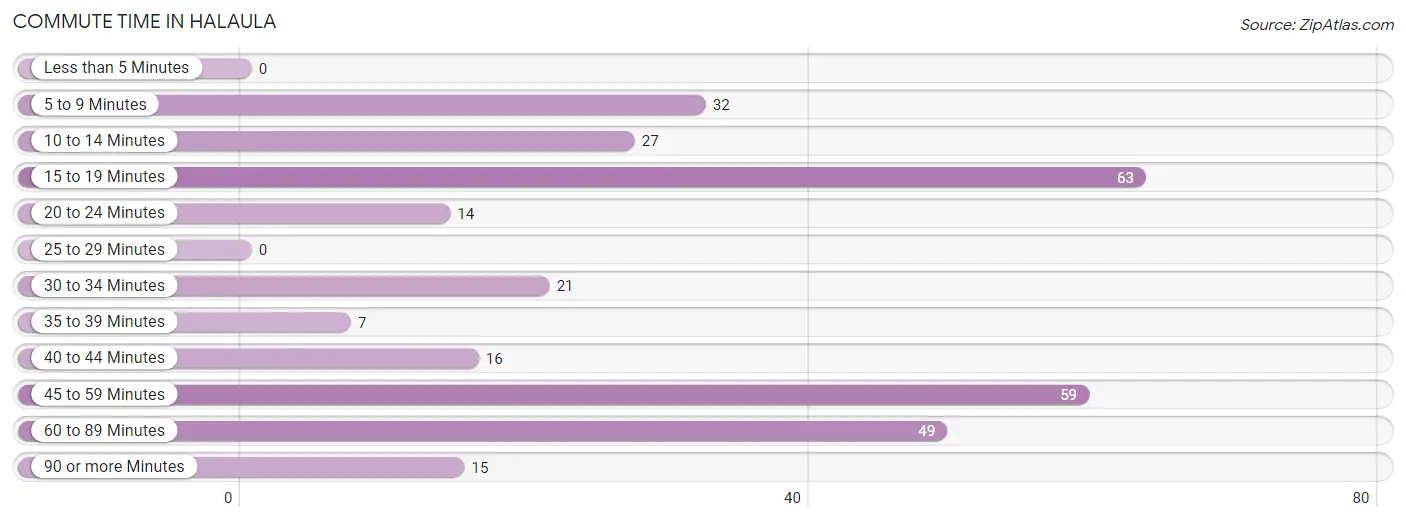
| Commute Time | # Commuters | % Commuters |
| Less than 5 Minutes | 0 | 0.0% |
| 5 to 9 Minutes | 32 | 10.6% |
| 10 to 14 Minutes | 27 | 8.9% |
| 15 to 19 Minutes | 63 | 20.8% |
| 20 to 24 Minutes | 14 | 4.6% |
| 25 to 29 Minutes | 0 | 0.0% |
| 30 to 34 Minutes | 21 | 6.9% |
| 35 to 39 Minutes | 7 | 2.3% |
| 40 to 44 Minutes | 16 | 5.3% |
| 45 to 59 Minutes | 59 | 19.5% |
| 60 to 89 Minutes | 49 | 16.2% |
| 90 or more Minutes | 15 | 5.0% |
Commute Time by Sex in Halaula
The most common commute times in Halaula are 15 to 19 minutes (54 commuters, 33.1%) for males and 45 to 59 minutes (37 commuters, 26.4%) for females.
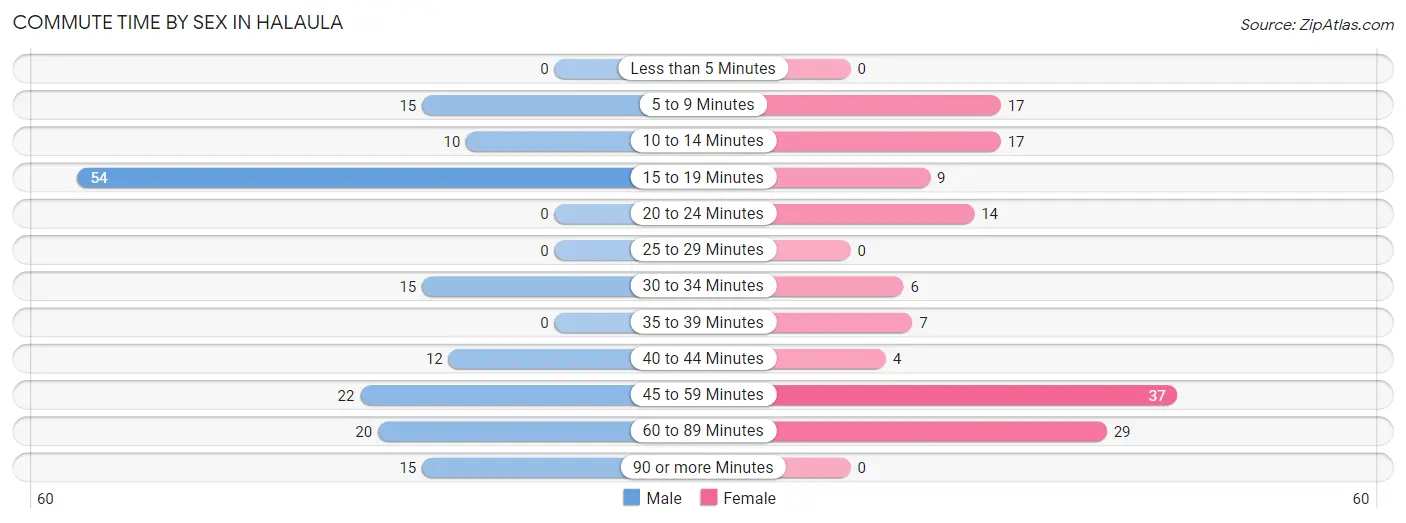
| Commute Time | Male | Female |
| Less than 5 Minutes | 0 (0.0%) | 0 (0.0%) |
| 5 to 9 Minutes | 15 (9.2%) | 17 (12.1%) |
| 10 to 14 Minutes | 10 (6.1%) | 17 (12.1%) |
| 15 to 19 Minutes | 54 (33.1%) | 9 (6.4%) |
| 20 to 24 Minutes | 0 (0.0%) | 14 (10.0%) |
| 25 to 29 Minutes | 0 (0.0%) | 0 (0.0%) |
| 30 to 34 Minutes | 15 (9.2%) | 6 (4.3%) |
| 35 to 39 Minutes | 0 (0.0%) | 7 (5.0%) |
| 40 to 44 Minutes | 12 (7.4%) | 4 (2.9%) |
| 45 to 59 Minutes | 22 (13.5%) | 37 (26.4%) |
| 60 to 89 Minutes | 20 (12.3%) | 29 (20.7%) |
| 90 or more Minutes | 15 (9.2%) | 0 (0.0%) |
Time of Departure to Work by Sex in Halaula
The most frequent times of departure to work in Halaula are 8:00 AM to 8:29 AM (53, 32.5%) for males and 7:30 AM to 7:59 AM (40, 28.6%) for females.
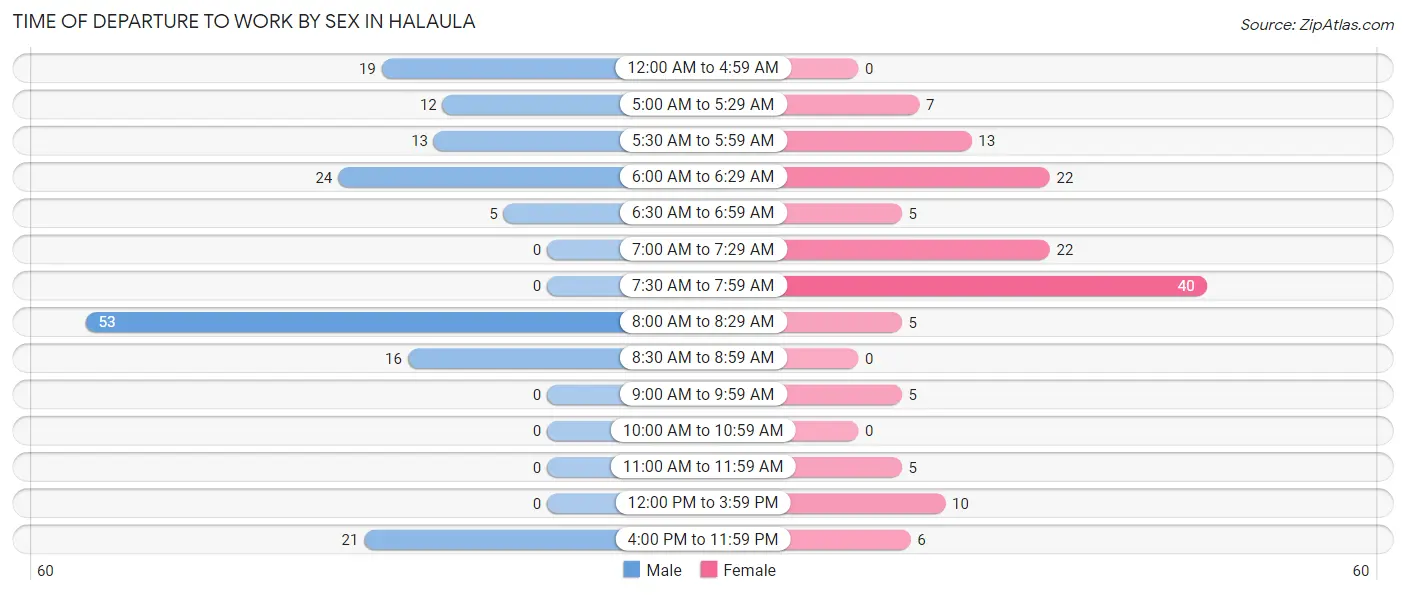
| Time of Departure | Male | Female |
| 12:00 AM to 4:59 AM | 19 (11.7%) | 0 (0.0%) |
| 5:00 AM to 5:29 AM | 12 (7.4%) | 7 (5.0%) |
| 5:30 AM to 5:59 AM | 13 (8.0%) | 13 (9.3%) |
| 6:00 AM to 6:29 AM | 24 (14.7%) | 22 (15.7%) |
| 6:30 AM to 6:59 AM | 5 (3.1%) | 5 (3.6%) |
| 7:00 AM to 7:29 AM | 0 (0.0%) | 22 (15.7%) |
| 7:30 AM to 7:59 AM | 0 (0.0%) | 40 (28.6%) |
| 8:00 AM to 8:29 AM | 53 (32.5%) | 5 (3.6%) |
| 8:30 AM to 8:59 AM | 16 (9.8%) | 0 (0.0%) |
| 9:00 AM to 9:59 AM | 0 (0.0%) | 5 (3.6%) |
| 10:00 AM to 10:59 AM | 0 (0.0%) | 0 (0.0%) |
| 11:00 AM to 11:59 AM | 0 (0.0%) | 5 (3.6%) |
| 12:00 PM to 3:59 PM | 0 (0.0%) | 10 (7.1%) |
| 4:00 PM to 11:59 PM | 21 (12.9%) | 6 (4.3%) |
| Total | 163 (100.0%) | 140 (100.0%) |
Housing Occupancy in Halaula
Occupancy by Ownership in Halaula
Of the total 242 dwellings in Halaula, owner-occupied units account for 166 (68.6%), while renter-occupied units make up 76 (31.4%).
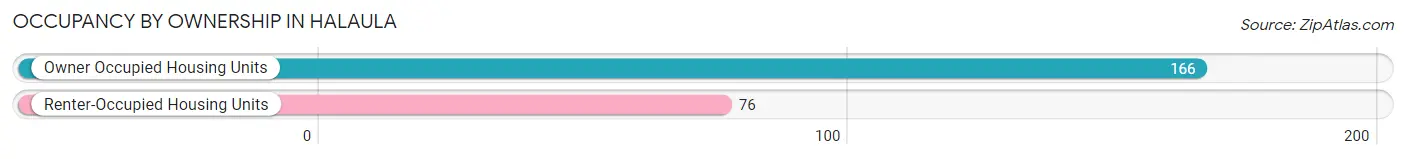
| Occupancy | # Housing Units | % Housing Units |
| Owner Occupied Housing Units | 166 | 68.6% |
| Renter-Occupied Housing Units | 76 | 31.4% |
| Total Occupied Housing Units | 242 | 100.0% |
Occupancy by Household Size in Halaula
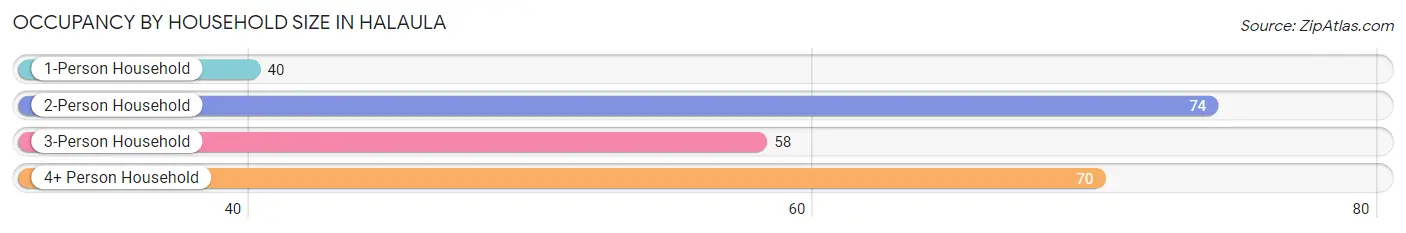
| Household Size | # Housing Units | % Housing Units |
| 1-Person Household | 40 | 16.5% |
| 2-Person Household | 74 | 30.6% |
| 3-Person Household | 58 | 24.0% |
| 4+ Person Household | 70 | 28.9% |
| Total Housing Units | 242 | 100.0% |
Occupancy by Ownership by Household Size in Halaula
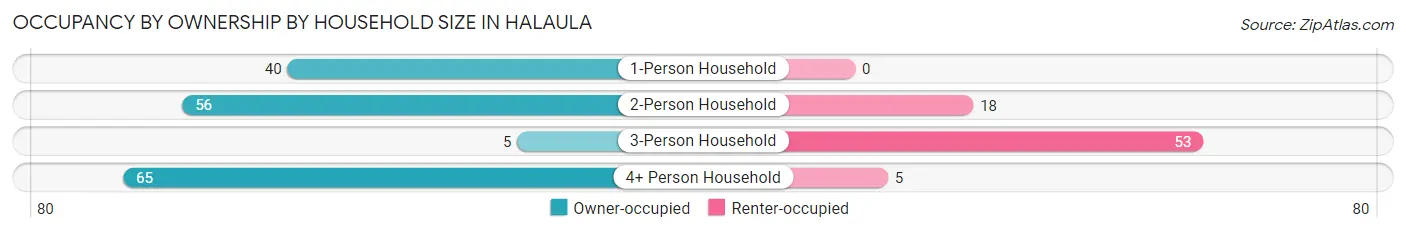
| Household Size | Owner-occupied | Renter-occupied |
| 1-Person Household | 40 (100.0%) | 0 (0.0%) |
| 2-Person Household | 56 (75.7%) | 18 (24.3%) |
| 3-Person Household | 5 (8.6%) | 53 (91.4%) |
| 4+ Person Household | 65 (92.9%) | 5 (7.1%) |
| Total Housing Units | 166 (68.6%) | 76 (31.4%) |
Occupancy by Educational Attainment in Halaula
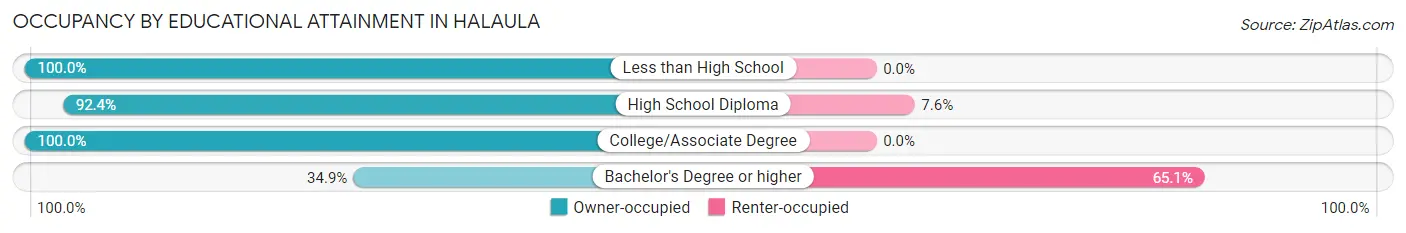
| Household Size | Owner-occupied | Renter-occupied |
| Less than High School | 5 (100.0%) | 0 (0.0%) |
| High School Diploma | 61 (92.4%) | 5 (7.6%) |
| College/Associate Degree | 62 (100.0%) | 0 (0.0%) |
| Bachelor's Degree or higher | 38 (34.9%) | 71 (65.1%) |
Occupancy by Age of Householder in Halaula
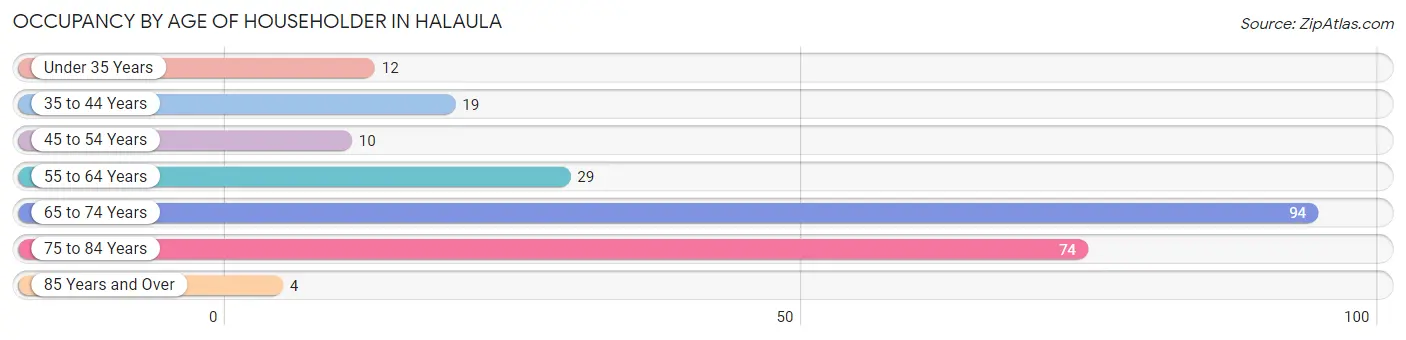
| Age Bracket | # Households | % Households |
| Under 35 Years | 12 | 5.0% |
| 35 to 44 Years | 19 | 7.9% |
| 45 to 54 Years | 10 | 4.1% |
| 55 to 64 Years | 29 | 12.0% |
| 65 to 74 Years | 94 | 38.8% |
| 75 to 84 Years | 74 | 30.6% |
| 85 Years and Over | 4 | 1.7% |
| Total | 242 | 100.0% |
Housing Finances in Halaula
Median Income by Occupancy in Halaula
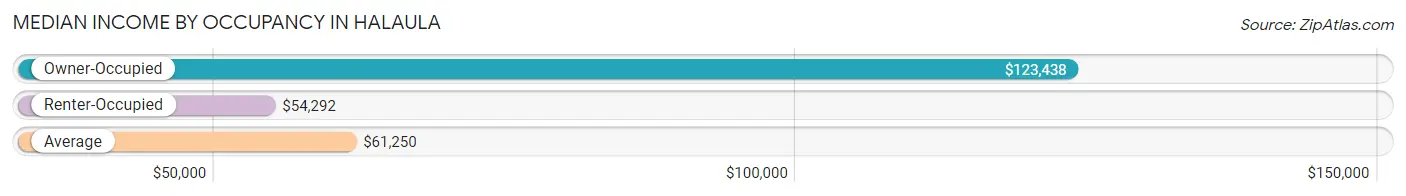
| Occupancy Type | # Households | Median Income |
| Owner-Occupied | 166 (68.6%) | $123,438 |
| Renter-Occupied | 76 (31.4%) | $54,292 |
| Average | 242 (100.0%) | $61,250 |
Occupancy by Householder Income Bracket in Halaula
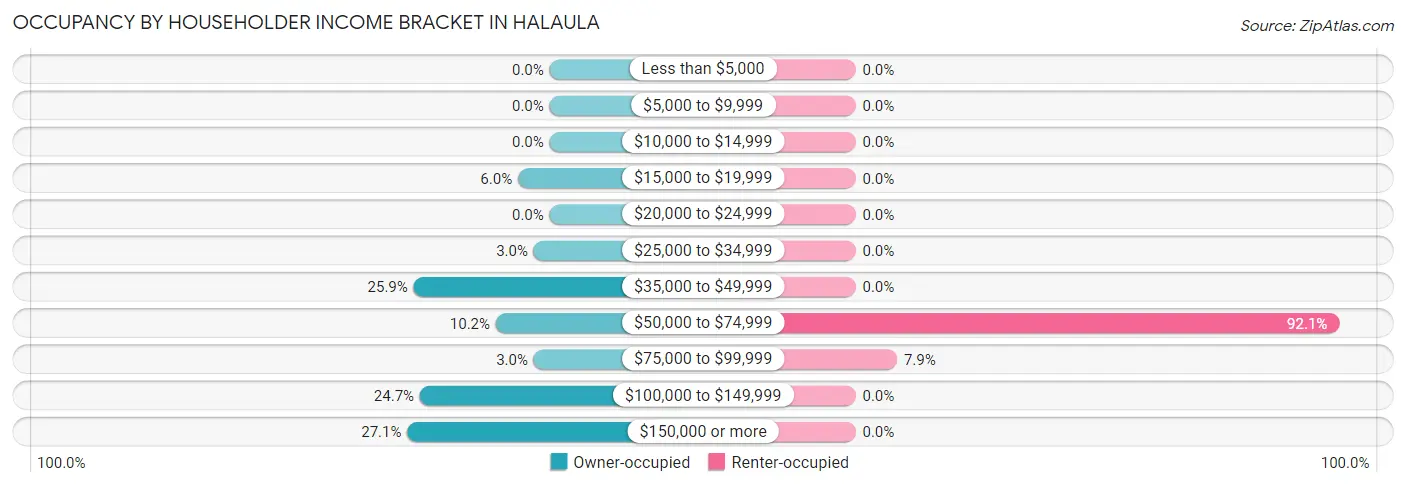
| Income Bracket | Owner-occupied | Renter-occupied |
| Less than $5,000 | 0 (0.0%) | 0 (0.0%) |
| $5,000 to $9,999 | 0 (0.0%) | 0 (0.0%) |
| $10,000 to $14,999 | 0 (0.0%) | 0 (0.0%) |
| $15,000 to $19,999 | 10 (6.0%) | 0 (0.0%) |
| $20,000 to $24,999 | 0 (0.0%) | 0 (0.0%) |
| $25,000 to $34,999 | 5 (3.0%) | 0 (0.0%) |
| $35,000 to $49,999 | 43 (25.9%) | 0 (0.0%) |
| $50,000 to $74,999 | 17 (10.2%) | 70 (92.1%) |
| $75,000 to $99,999 | 5 (3.0%) | 6 (7.9%) |
| $100,000 to $149,999 | 41 (24.7%) | 0 (0.0%) |
| $150,000 or more | 45 (27.1%) | 0 (0.0%) |
| Total | 166 (100.0%) | 76 (100.0%) |
Monthly Housing Cost Tiers in Halaula
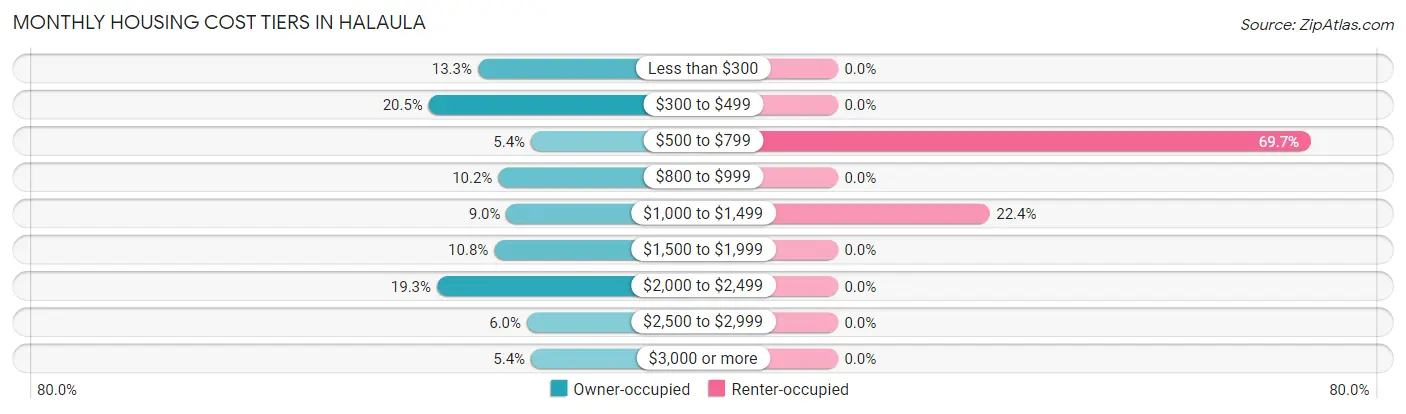
| Monthly Cost | Owner-occupied | Renter-occupied |
| Less than $300 | 22 (13.3%) | 0 (0.0%) |
| $300 to $499 | 34 (20.5%) | 0 (0.0%) |
| $500 to $799 | 9 (5.4%) | 53 (69.7%) |
| $800 to $999 | 17 (10.2%) | 0 (0.0%) |
| $1,000 to $1,499 | 15 (9.0%) | 17 (22.4%) |
| $1,500 to $1,999 | 18 (10.8%) | 0 (0.0%) |
| $2,000 to $2,499 | 32 (19.3%) | 0 (0.0%) |
| $2,500 to $2,999 | 10 (6.0%) | 0 (0.0%) |
| $3,000 or more | 9 (5.4%) | 0 (0.0%) |
| Total | 166 (100.0%) | 76 (100.0%) |
Physical Housing Characteristics in Halaula
Housing Structures in Halaula
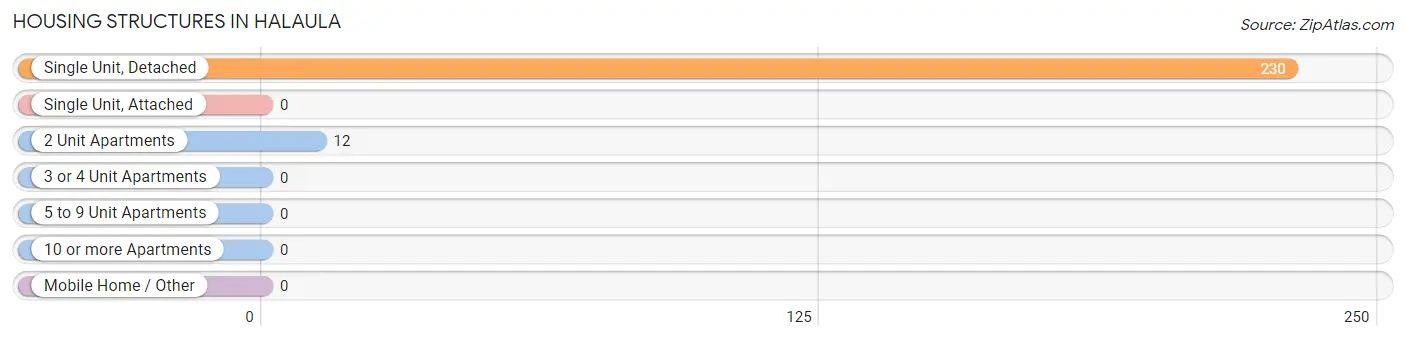
| Structure Type | # Housing Units | % Housing Units |
| Single Unit, Detached | 230 | 95.0% |
| Single Unit, Attached | 0 | 0.0% |
| 2 Unit Apartments | 12 | 5.0% |
| 3 or 4 Unit Apartments | 0 | 0.0% |
| 5 to 9 Unit Apartments | 0 | 0.0% |
| 10 or more Apartments | 0 | 0.0% |
| Mobile Home / Other | 0 | 0.0% |
| Total | 242 | 100.0% |
Housing Structures by Occupancy in Halaula
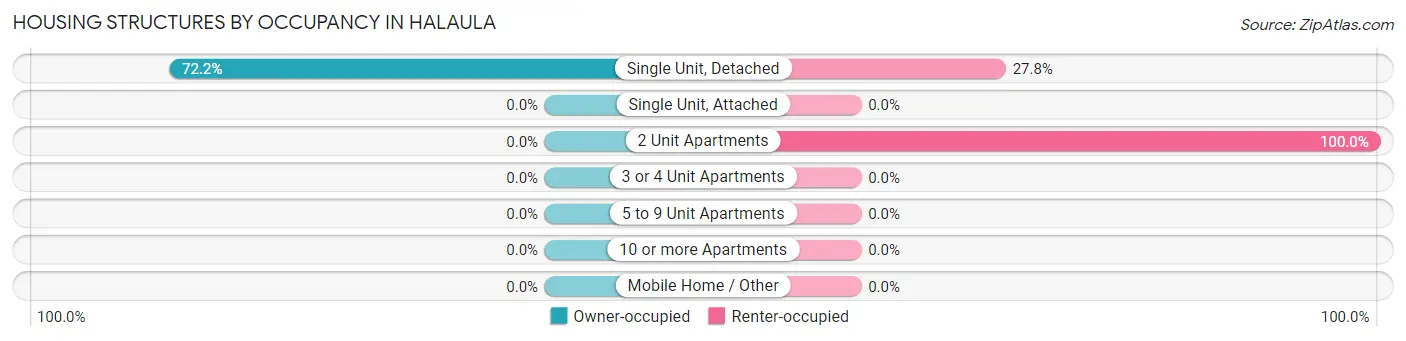
| Structure Type | Owner-occupied | Renter-occupied |
| Single Unit, Detached | 166 (72.2%) | 64 (27.8%) |
| Single Unit, Attached | 0 (0.0%) | 0 (0.0%) |
| 2 Unit Apartments | 0 (0.0%) | 12 (100.0%) |
| 3 or 4 Unit Apartments | 0 (0.0%) | 0 (0.0%) |
| 5 to 9 Unit Apartments | 0 (0.0%) | 0 (0.0%) |
| 10 or more Apartments | 0 (0.0%) | 0 (0.0%) |
| Mobile Home / Other | 0 (0.0%) | 0 (0.0%) |
| Total | 166 (68.6%) | 76 (31.4%) |
Housing Structures by Number of Rooms in Halaula
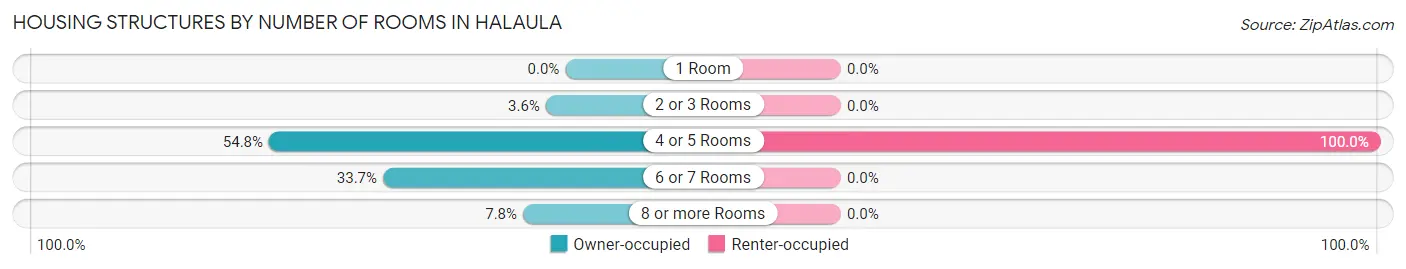
| Number of Rooms | Owner-occupied | Renter-occupied |
| 1 Room | 0 (0.0%) | 0 (0.0%) |
| 2 or 3 Rooms | 6 (3.6%) | 0 (0.0%) |
| 4 or 5 Rooms | 91 (54.8%) | 76 (100.0%) |
| 6 or 7 Rooms | 56 (33.7%) | 0 (0.0%) |
| 8 or more Rooms | 13 (7.8%) | 0 (0.0%) |
| Total | 166 (100.0%) | 76 (100.0%) |
Housing Structure by Heating Type in Halaula
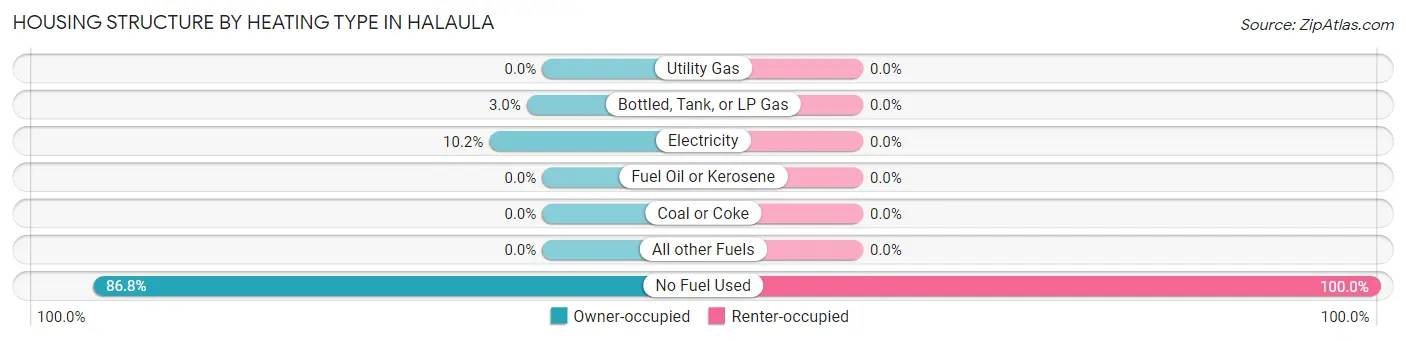
| Heating Type | Owner-occupied | Renter-occupied |
| Utility Gas | 0 (0.0%) | 0 (0.0%) |
| Bottled, Tank, or LP Gas | 5 (3.0%) | 0 (0.0%) |
| Electricity | 17 (10.2%) | 0 (0.0%) |
| Fuel Oil or Kerosene | 0 (0.0%) | 0 (0.0%) |
| Coal or Coke | 0 (0.0%) | 0 (0.0%) |
| All other Fuels | 0 (0.0%) | 0 (0.0%) |
| No Fuel Used | 144 (86.8%) | 76 (100.0%) |
| Total | 166 (100.0%) | 76 (100.0%) |
Household Vehicle Usage in Halaula
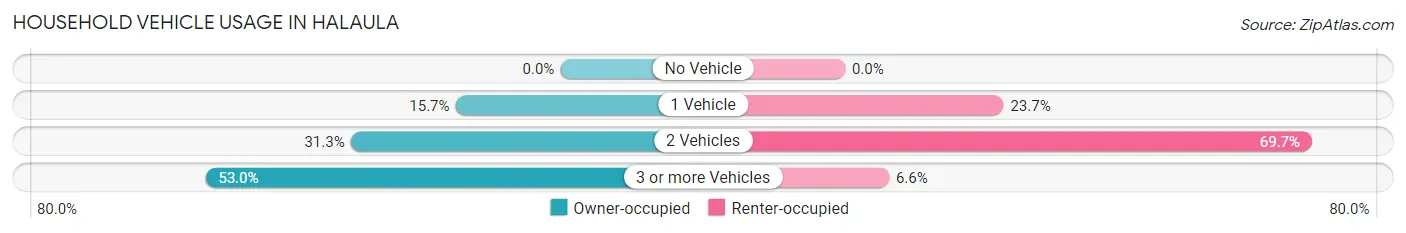
| Vehicles per Household | Owner-occupied | Renter-occupied |
| No Vehicle | 0 (0.0%) | 0 (0.0%) |
| 1 Vehicle | 26 (15.7%) | 18 (23.7%) |
| 2 Vehicles | 52 (31.3%) | 53 (69.7%) |
| 3 or more Vehicles | 88 (53.0%) | 5 (6.6%) |
| Total | 166 (100.0%) | 76 (100.0%) |
Real Estate & Mortgages in Halaula
Real Estate and Mortgage Overview in Halaula
| Characteristic | Without Mortgage | With Mortgage |
| Housing Units | 78 | 88 |
| Median Property Value | $382,900 | $495,700 |
| Median Household Income | $48,438 | $45 |
| Monthly Housing Costs | $345 | $9 |
| Real Estate Taxes | $1,143 | $0 |
Property Value by Mortgage Status in Halaula
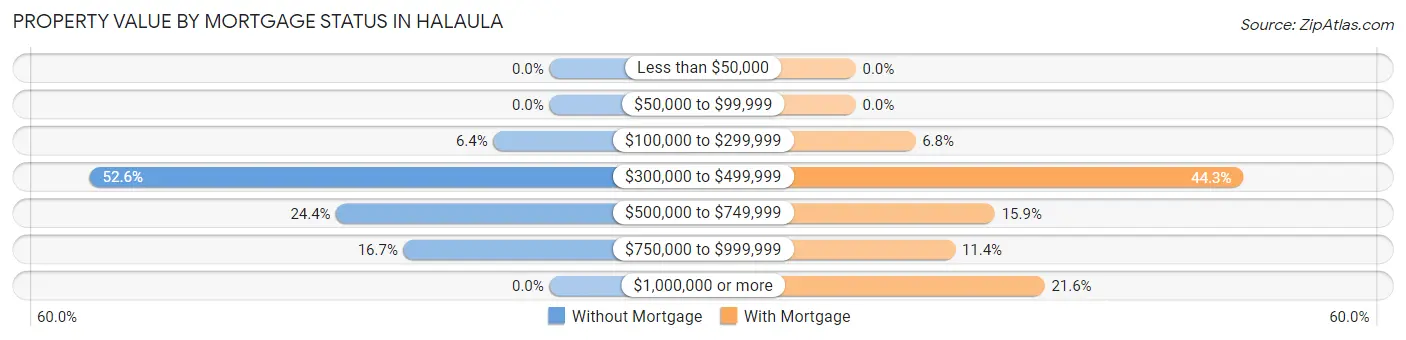
| Property Value | Without Mortgage | With Mortgage |
| Less than $50,000 | 0 (0.0%) | 0 (0.0%) |
| $50,000 to $99,999 | 0 (0.0%) | 0 (0.0%) |
| $100,000 to $299,999 | 5 (6.4%) | 6 (6.8%) |
| $300,000 to $499,999 | 41 (52.6%) | 39 (44.3%) |
| $500,000 to $749,999 | 19 (24.4%) | 14 (15.9%) |
| $750,000 to $999,999 | 13 (16.7%) | 10 (11.4%) |
| $1,000,000 or more | 0 (0.0%) | 19 (21.6%) |
| Total | 78 (100.0%) | 88 (100.0%) |
Household Income by Mortgage Status in Halaula
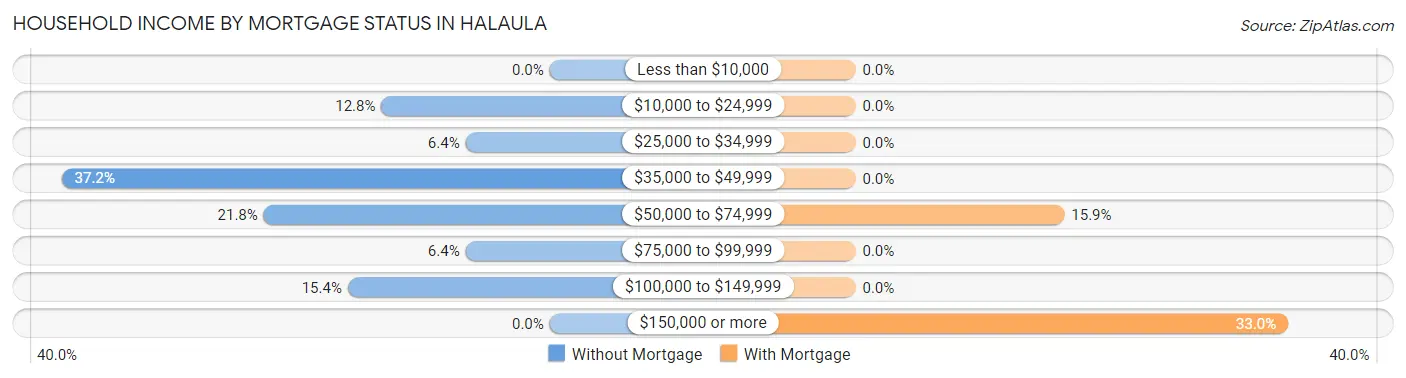
| Household Income | Without Mortgage | With Mortgage |
| Less than $10,000 | 0 (0.0%) | 0 (0.0%) |
| $10,000 to $24,999 | 10 (12.8%) | 0 (0.0%) |
| $25,000 to $34,999 | 5 (6.4%) | 0 (0.0%) |
| $35,000 to $49,999 | 29 (37.2%) | 0 (0.0%) |
| $50,000 to $74,999 | 17 (21.8%) | 14 (15.9%) |
| $75,000 to $99,999 | 5 (6.4%) | 0 (0.0%) |
| $100,000 to $149,999 | 12 (15.4%) | 0 (0.0%) |
| $150,000 or more | 0 (0.0%) | 29 (33.0%) |
| Total | 78 (100.0%) | 88 (100.0%) |
Property Value to Household Income Ratio in Halaula
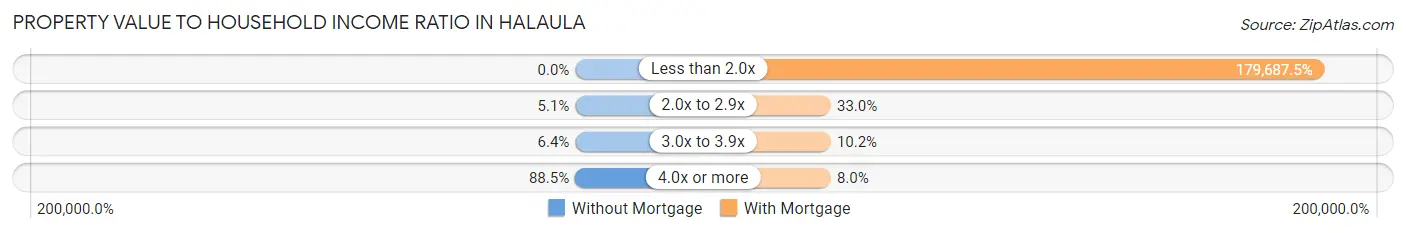
| Value-to-Income Ratio | Without Mortgage | With Mortgage |
| Less than 2.0x | 0 (0.0%) | 158,125 (179,687.5%) |
| 2.0x to 2.9x | 4 (5.1%) | 29 (33.0%) |
| 3.0x to 3.9x | 5 (6.4%) | 9 (10.2%) |
| 4.0x or more | 69 (88.5%) | 7 (8.0%) |
| Total | 78 (100.0%) | 88 (100.0%) |
Real Estate Taxes by Mortgage Status in Halaula
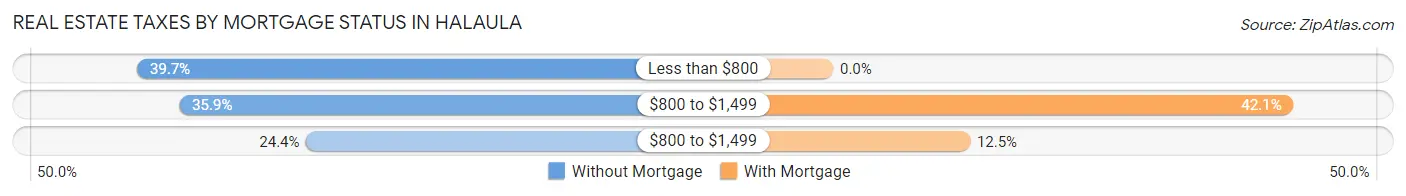
| Property Taxes | Without Mortgage | With Mortgage |
| Less than $800 | 31 (39.7%) | 0 (0.0%) |
| $800 to $1,499 | 28 (35.9%) | 37 (42.0%) |
| $800 to $1,499 | 19 (24.4%) | 11 (12.5%) |
| Total | 78 (100.0%) | 88 (100.0%) |
Health & Disability in Halaula
Health Insurance Coverage by Age in Halaula
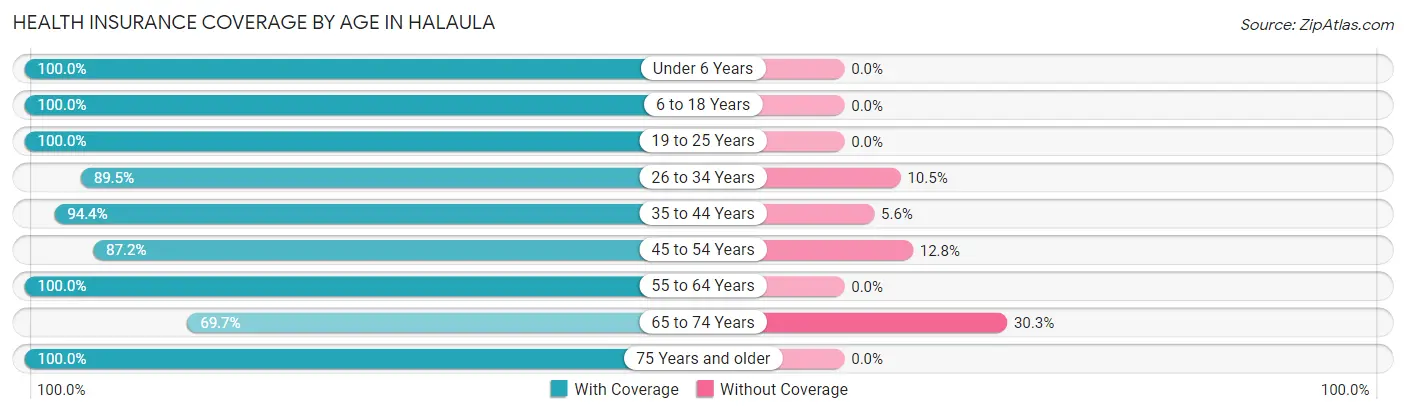
| Age Bracket | With Coverage | Without Coverage |
| Under 6 Years | 79 (100.0%) | 0 (0.0%) |
| 6 to 18 Years | 219 (100.0%) | 0 (0.0%) |
| 19 to 25 Years | 21 (100.0%) | 0 (0.0%) |
| 26 to 34 Years | 111 (89.5%) | 13 (10.5%) |
| 35 to 44 Years | 85 (94.4%) | 5 (5.6%) |
| 45 to 54 Years | 41 (87.2%) | 6 (12.8%) |
| 55 to 64 Years | 85 (100.0%) | 0 (0.0%) |
| 65 to 74 Years | 124 (69.7%) | 54 (30.3%) |
| 75 Years and older | 116 (100.0%) | 0 (0.0%) |
| Total | 881 (91.9%) | 78 (8.1%) |
Health Insurance Coverage by Citizenship Status in Halaula
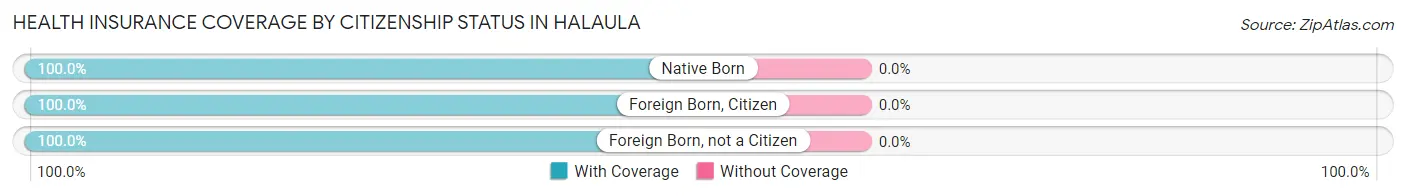
| Citizenship Status | With Coverage | Without Coverage |
| Native Born | 79 (100.0%) | 0 (0.0%) |
| Foreign Born, Citizen | 219 (100.0%) | 0 (0.0%) |
| Foreign Born, not a Citizen | 21 (100.0%) | 0 (0.0%) |
Health Insurance Coverage by Household Income in Halaula
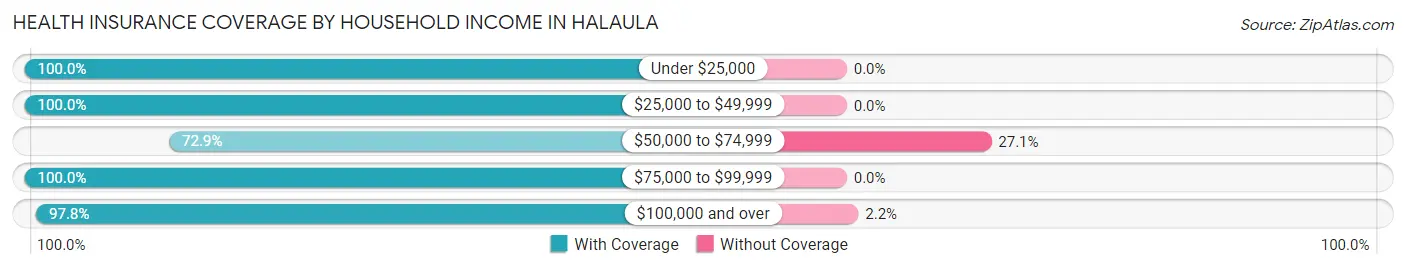
| Household Income | With Coverage | Without Coverage |
| Under $25,000 | 10 (100.0%) | 0 (0.0%) |
| $25,000 to $49,999 | 68 (100.0%) | 0 (0.0%) |
| $50,000 to $74,999 | 175 (72.9%) | 65 (27.1%) |
| $75,000 to $99,999 | 39 (100.0%) | 0 (0.0%) |
| $100,000 and over | 589 (97.8%) | 13 (2.2%) |
Public vs Private Health Insurance Coverage by Age in Halaula
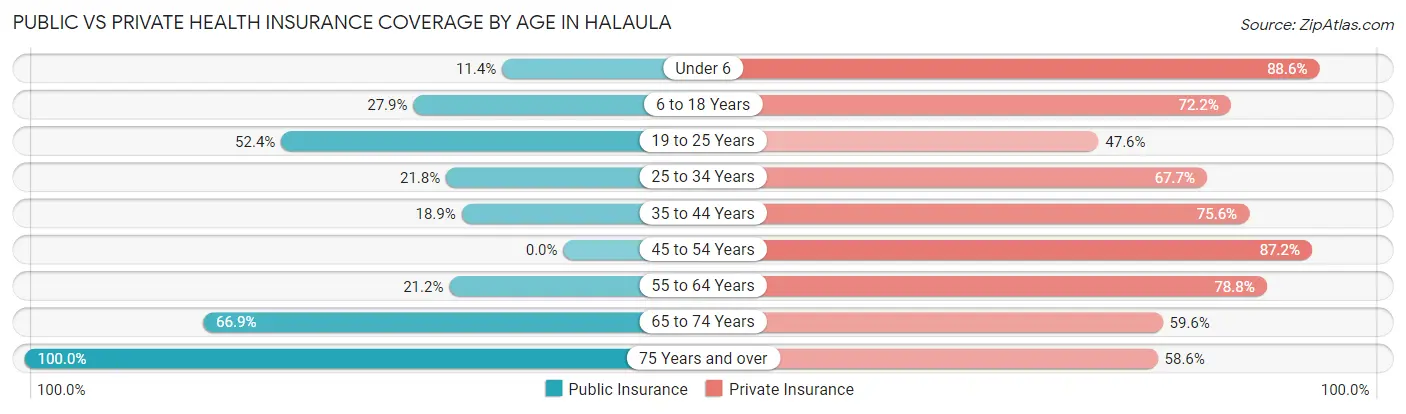
| Age Bracket | Public Insurance | Private Insurance |
| Under 6 | 9 (11.4%) | 70 (88.6%) |
| 6 to 18 Years | 61 (27.9%) | 158 (72.2%) |
| 19 to 25 Years | 11 (52.4%) | 10 (47.6%) |
| 25 to 34 Years | 27 (21.8%) | 84 (67.7%) |
| 35 to 44 Years | 17 (18.9%) | 68 (75.6%) |
| 45 to 54 Years | 0 (0.0%) | 41 (87.2%) |
| 55 to 64 Years | 18 (21.2%) | 67 (78.8%) |
| 65 to 74 Years | 119 (66.8%) | 106 (59.6%) |
| 75 Years and over | 116 (100.0%) | 68 (58.6%) |
| Total | 378 (39.4%) | 672 (70.1%) |
Disability Status by Sex by Age in Halaula
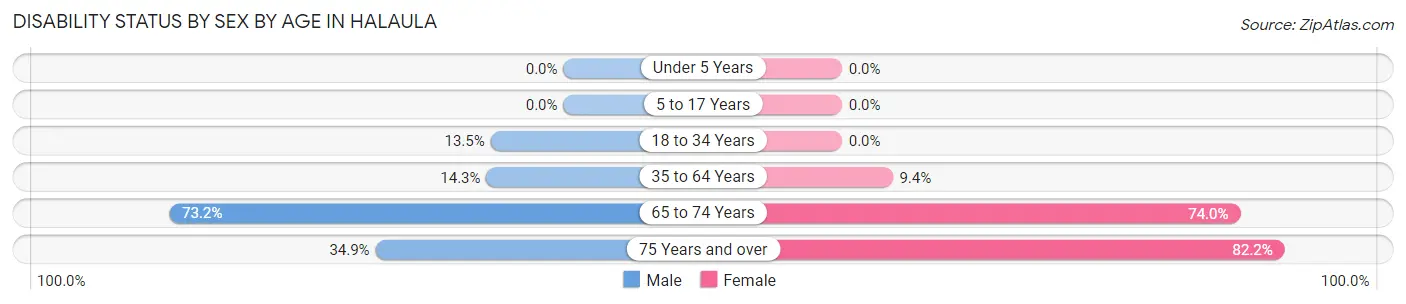
| Age Bracket | Male | Female |
| Under 5 Years | 0 (0.0%) | 0 (0.0%) |
| 5 to 17 Years | 0 (0.0%) | 0 (0.0%) |
| 18 to 34 Years | 10 (13.5%) | 0 (0.0%) |
| 35 to 64 Years | 15 (14.3%) | 11 (9.4%) |
| 65 to 74 Years | 60 (73.2%) | 71 (74.0%) |
| 75 Years and over | 15 (34.9%) | 60 (82.2%) |
Disability Class by Sex by Age in Halaula
Disability Class: Hearing Difficulty
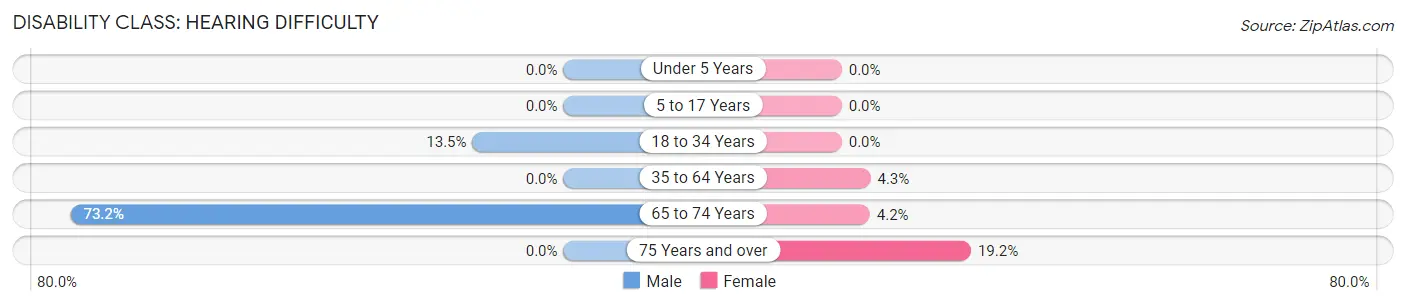
| Age Bracket | Male | Female |
| Under 5 Years | 0 (0.0%) | 0 (0.0%) |
| 5 to 17 Years | 0 (0.0%) | 0 (0.0%) |
| 18 to 34 Years | 10 (13.5%) | 0 (0.0%) |
| 35 to 64 Years | 0 (0.0%) | 5 (4.3%) |
| 65 to 74 Years | 60 (73.2%) | 4 (4.2%) |
| 75 Years and over | 0 (0.0%) | 14 (19.2%) |
Disability Class: Vision Difficulty
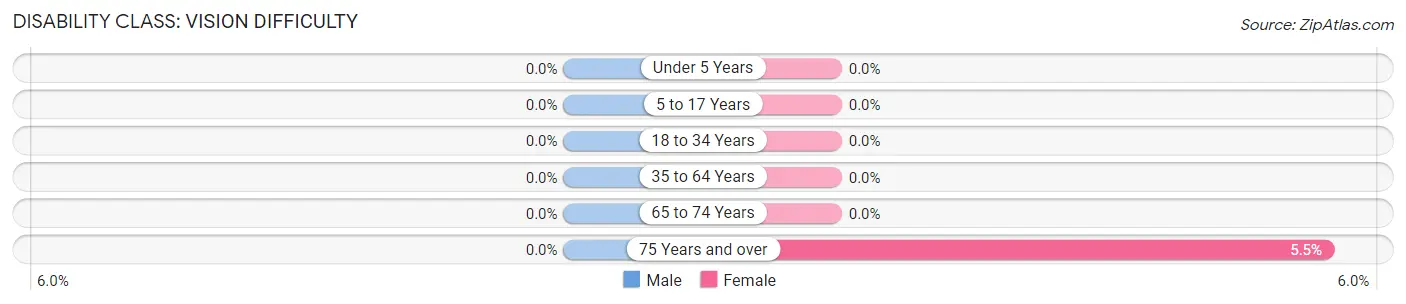
| Age Bracket | Male | Female |
| Under 5 Years | 0 (0.0%) | 0 (0.0%) |
| 5 to 17 Years | 0 (0.0%) | 0 (0.0%) |
| 18 to 34 Years | 0 (0.0%) | 0 (0.0%) |
| 35 to 64 Years | 0 (0.0%) | 0 (0.0%) |
| 65 to 74 Years | 0 (0.0%) | 0 (0.0%) |
| 75 Years and over | 0 (0.0%) | 4 (5.5%) |
Disability Class: Cognitive Difficulty
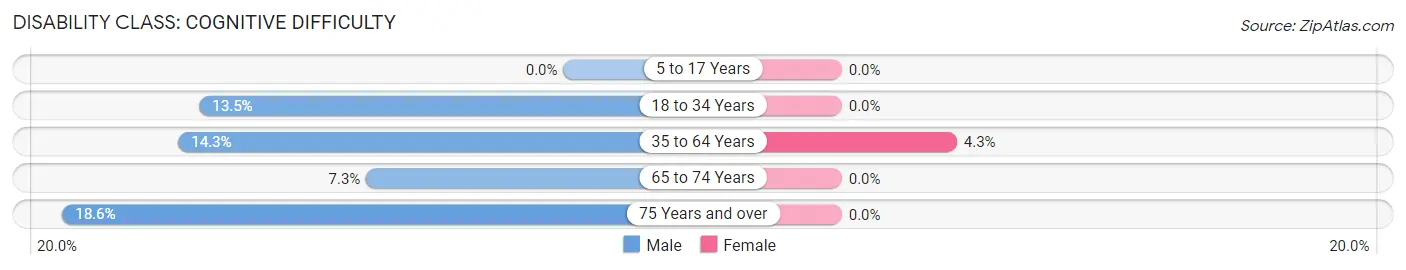
| Age Bracket | Male | Female |
| 5 to 17 Years | 0 (0.0%) | 0 (0.0%) |
| 18 to 34 Years | 10 (13.5%) | 0 (0.0%) |
| 35 to 64 Years | 15 (14.3%) | 5 (4.3%) |
| 65 to 74 Years | 6 (7.3%) | 0 (0.0%) |
| 75 Years and over | 8 (18.6%) | 0 (0.0%) |
Disability Class: Ambulatory Difficulty
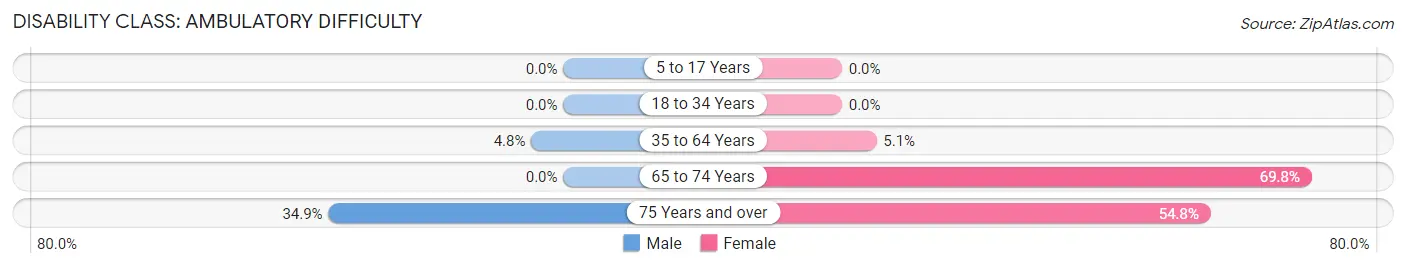
| Age Bracket | Male | Female |
| 5 to 17 Years | 0 (0.0%) | 0 (0.0%) |
| 18 to 34 Years | 0 (0.0%) | 0 (0.0%) |
| 35 to 64 Years | 5 (4.8%) | 6 (5.1%) |
| 65 to 74 Years | 0 (0.0%) | 67 (69.8%) |
| 75 Years and over | 15 (34.9%) | 40 (54.8%) |
Disability Class: Self-Care Difficulty
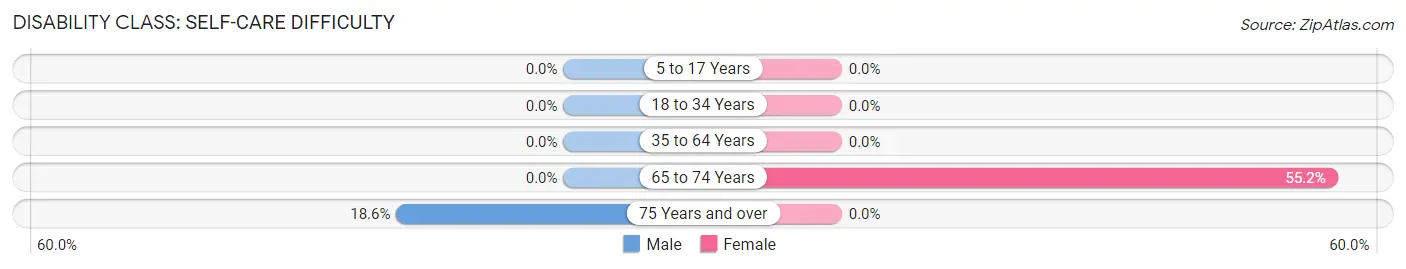
| Age Bracket | Male | Female |
| 5 to 17 Years | 0 (0.0%) | 0 (0.0%) |
| 18 to 34 Years | 0 (0.0%) | 0 (0.0%) |
| 35 to 64 Years | 0 (0.0%) | 0 (0.0%) |
| 65 to 74 Years | 0 (0.0%) | 53 (55.2%) |
| 75 Years and over | 8 (18.6%) | 0 (0.0%) |
Technology Access in Halaula
Computing Device Access in Halaula
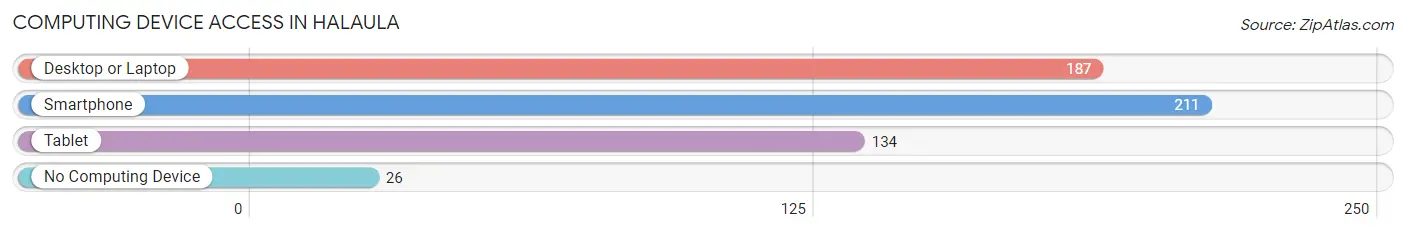
| Device Type | # Households | % Households |
| Desktop or Laptop | 187 | 77.3% |
| Smartphone | 211 | 87.2% |
| Tablet | 134 | 55.4% |
| No Computing Device | 26 | 10.7% |
| Total | 242 | 100.0% |
Internet Access in Halaula
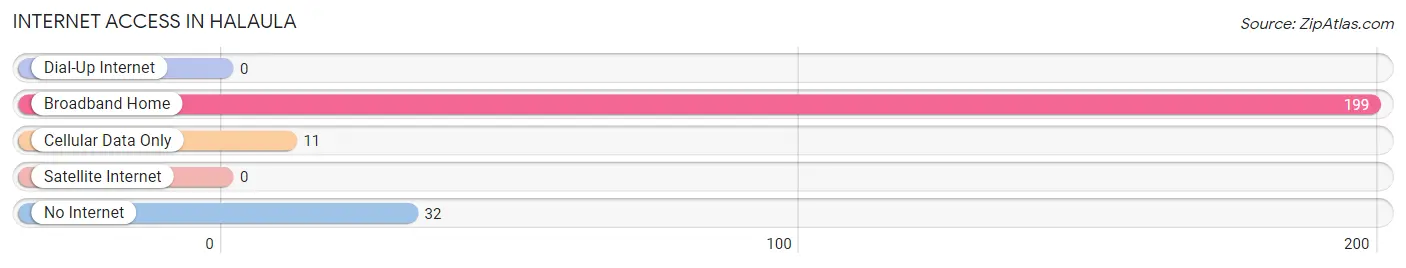
| Internet Type | # Households | % Households |
| Dial-Up Internet | 0 | 0.0% |
| Broadband Home | 199 | 82.2% |
| Cellular Data Only | 11 | 4.5% |
| Satellite Internet | 0 | 0.0% |
| No Internet | 32 | 13.2% |
| Total | 242 | 100.0% |
Halaula Summary
Hauula is a small unincorporated community located on the northeastern coast of the island of Oahu in the state of Hawaii. It is located in the Ko’olauloa District of the island and is part of the Honolulu metropolitan area. The population of Hauula was 2,937 at the 2010 census.
Geography
Hauula is located at 21°32'17" North, 157°51'17" West (21.538, -157.854). It is situated on the northeastern coast of Oahu, approximately 25 miles (40 km) from Honolulu. The community is bordered by Laie to the north, Punaluu to the south, and Kahana to the west. The Hauula Beach Park is located on the eastern side of the community.
The terrain of Hauula is mostly flat, with some rolling hills. The area is mostly covered in tropical vegetation, including coconut palms, banana trees, and other tropical plants. The climate is tropical, with temperatures ranging from the mid-70s to the mid-80s Fahrenheit (21-29 Celsius).
Economy
The economy of Hauula is largely based on tourism and agriculture. The area is home to several resorts and hotels, as well as a number of small businesses. Agriculture is also an important part of the local economy, with the cultivation of sugar cane, taro, and other crops.
Demographics
As of the 2010 census, the population of Hauula was 2,937. The racial makeup of the community was 57.3% White, 0.7% African American, 0.3% Native American, 11.2% Asian, 0.2% Pacific Islander, and 30.5% from other races. The median household income was $50,945, and the median family income was $54,945.
The majority of the population (77.2%) spoke English as their primary language, while 11.2% spoke Hawaiian, 4.2% spoke Spanish, and 2.2% spoke Tagalog. The median age was 38.2 years, and the median household size was 3.2 people.
Conclusion
Hauula is a small unincorporated community located on the northeastern coast of the island of Oahu in the state of Hawaii. It is part of the Honolulu metropolitan area and has a population of 2,937. The economy of Hauula is largely based on tourism and agriculture, and the majority of the population speaks English as their primary language. The median household income is $50,945, and the median family income is $54,945.
Common Questions
What is Per Capita Income in Halaula?
Per Capita income in Halaula is $26,615.
What is the Median Family Income in Halaula?
Median Family Income in Halaula is $93,250.
What is the Median Household income in Halaula?
Median Household Income in Halaula is $61,250.
What is Income or Wage Gap in Halaula?
Income or Wage Gap in Halaula is 30.1%.
Women in Halaula earn 69.9 cents for every dollar earned by a man.
What is Inequality or Gini Index in Halaula?
Inequality or Gini Index in Halaula is 0.40.
What is the Total Population of Halaula?
Total Population of Halaula is 959.
What is the Total Male Population of Halaula?
Total Male Population of Halaula is 505.
What is the Total Female Population of Halaula?
Total Female Population of Halaula is 454.
What is the Ratio of Males per 100 Females in Halaula?
There are 111.23 Males per 100 Females in Halaula.
What is the Ratio of Females per 100 Males in Halaula?
There are 89.90 Females per 100 Males in Halaula.
What is the Median Population Age in Halaula?
Median Population Age in Halaula is 37.2 Years.
What is the Average Family Size in Halaula
Average Family Size in Halaula is 4.4 People.
What is the Average Household Size in Halaula
Average Household Size in Halaula is 4.0 People.
How Large is the Labor Force in Halaula?
There are 360 People in the Labor Forcein in Halaula.
What is the Percentage of People in the Labor Force in Halaula?
53.7% of People are in the Labor Force in Halaula.
What is the Unemployment Rate in Halaula?
Unemployment Rate in Halaula is 5.0%.