Hanapepe, HI Map & Demographics
Hanapepe Map
Hanapepe Overview
$35,474
PER CAPITA INCOME
$99,583
AVG FAMILY INCOME
$88,385
AVG HOUSEHOLD INCOME
45.2%
WAGE / INCOME GAP [ % ]
54.8¢/ $1
WAGE / INCOME GAP [ $ ]
0.32
INEQUALITY / GINI INDEX
2,242
TOTAL POPULATION
1,188
MALE POPULATION
1,054
FEMALE POPULATION
112.71
MALES / 100 FEMALES
88.72
FEMALES / 100 MALES
43.1
MEDIAN AGE
3.6
AVG FAMILY SIZE
3.2
AVG HOUSEHOLD SIZE
1,347
LABOR FORCE [ PEOPLE ]
68.6%
PERCENT IN LABOR FORCE
6.5%
UNEMPLOYMENT RATE
Hanapepe Zip Codes
Hanapepe Area Codes
Income in Hanapepe
Income Overview in Hanapepe
Per Capita Income in Hanapepe is $35,474, while median incomes of families and households are $99,583 and $88,385 respectively.
| Characteristic | Number | Measure |
| Per Capita Income | 2,242 | $35,474 |
| Median Family Income | 557 | $99,583 |
| Mean Family Income | 557 | $115,057 |
| Median Household Income | 698 | $88,385 |
| Mean Household Income | 698 | $105,933 |
| Income Deficit | 557 | $0 |
| Wage / Income Gap (%) | 2,242 | 45.17% |
| Wage / Income Gap ($) | 2,242 | 54.83¢ per $1 |
| Gini / Inequality Index | 2,242 | 0.32 |
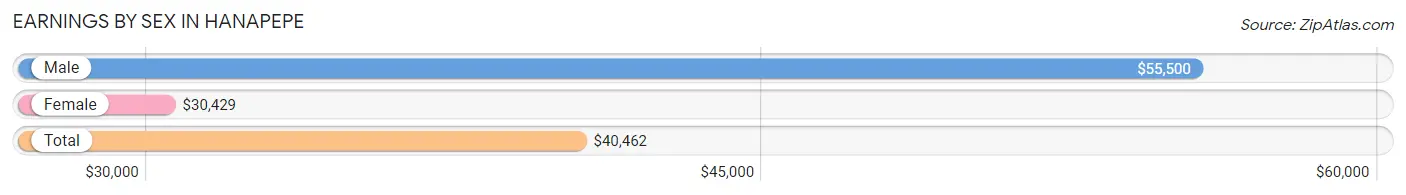
Earnings by Sex in Hanapepe
Average Earnings in Hanapepe are $40,462, $55,500 for men and $30,429 for women, a difference of 45.2%.
| Sex | Number | Average Earnings |
| Male | 732 (56.3%) | $55,500 |
| Female | 568 (43.7%) | $30,429 |
| Total | 1,300 (100.0%) | $40,462 |
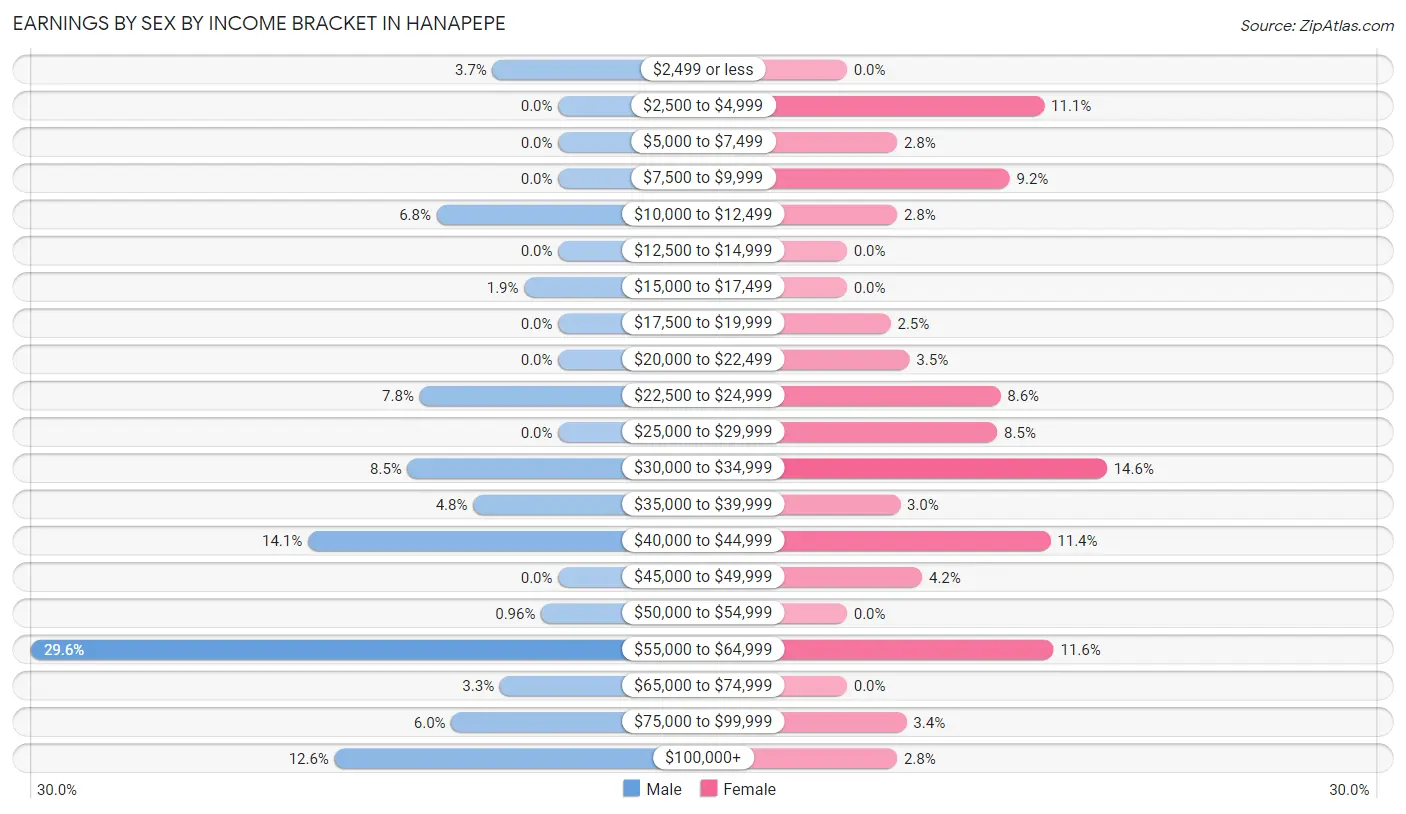
Earnings by Sex by Income Bracket in Hanapepe
The most common earnings brackets in Hanapepe are $55,000 to $64,999 for men (217 | 29.6%) and $30,000 to $34,999 for women (83 | 14.6%).
| Income | Male | Female |
| $2,499 or less | 27 (3.7%) | 0 (0.0%) |
| $2,500 to $4,999 | 0 (0.0%) | 63 (11.1%) |
| $5,000 to $7,499 | 0 (0.0%) | 16 (2.8%) |
| $7,500 to $9,999 | 0 (0.0%) | 52 (9.1%) |
| $10,000 to $12,499 | 50 (6.8%) | 16 (2.8%) |
| $12,500 to $14,999 | 0 (0.0%) | 0 (0.0%) |
| $15,000 to $17,499 | 14 (1.9%) | 0 (0.0%) |
| $17,500 to $19,999 | 0 (0.0%) | 14 (2.5%) |
| $20,000 to $22,499 | 0 (0.0%) | 20 (3.5%) |
| $22,500 to $24,999 | 57 (7.8%) | 49 (8.6%) |
| $25,000 to $29,999 | 0 (0.0%) | 48 (8.5%) |
| $30,000 to $34,999 | 62 (8.5%) | 83 (14.6%) |
| $35,000 to $39,999 | 35 (4.8%) | 17 (3.0%) |
| $40,000 to $44,999 | 103 (14.1%) | 65 (11.4%) |
| $45,000 to $49,999 | 0 (0.0%) | 24 (4.2%) |
| $50,000 to $54,999 | 7 (1.0%) | 0 (0.0%) |
| $55,000 to $64,999 | 217 (29.6%) | 66 (11.6%) |
| $65,000 to $74,999 | 24 (3.3%) | 0 (0.0%) |
| $75,000 to $99,999 | 44 (6.0%) | 19 (3.4%) |
| $100,000+ | 92 (12.6%) | 16 (2.8%) |
| Total | 732 (100.0%) | 568 (100.0%) |
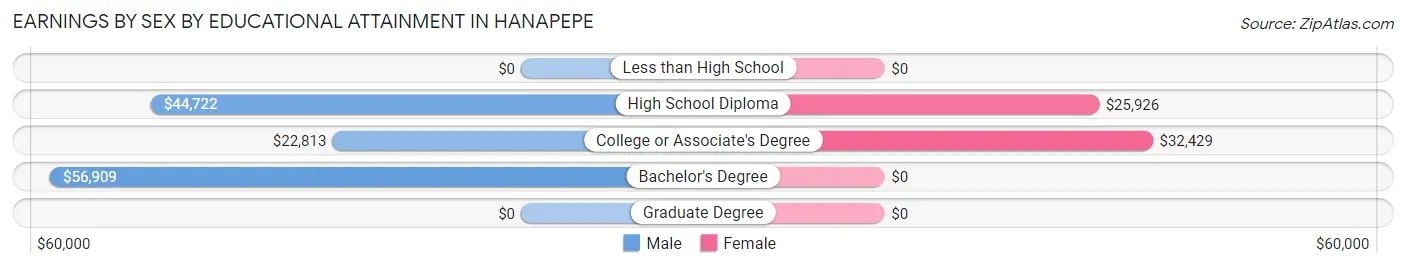
Earnings by Sex by Educational Attainment in Hanapepe
Average earnings in Hanapepe are $55,386 for men and $32,429 for women, a difference of 41.4%. Men with an educational attainment of bachelor's degree enjoy the highest average annual earnings of $56,909, while those with college or associate's degree education earn the least with $22,813. Women with an educational attainment of college or associate's degree earn the most with the average annual earnings of $32,429, while those with high school diploma education have the smallest earnings of $25,926.
| Educational Attainment | Male Income | Female Income |
| Less than High School | - | - |
| High School Diploma | $44,722 | $25,926 |
| College or Associate's Degree | $22,813 | $32,429 |
| Bachelor's Degree | $56,909 | $0 |
| Graduate Degree | - | - |
| Total | $55,386 | $32,429 |
Family Income in Hanapepe
Family Income Brackets in Hanapepe
According to the Hanapepe family income data, there are 170 families falling into the $150,000 to $199,999 income range, which is the most common income bracket and makes up 30.5% of all families.
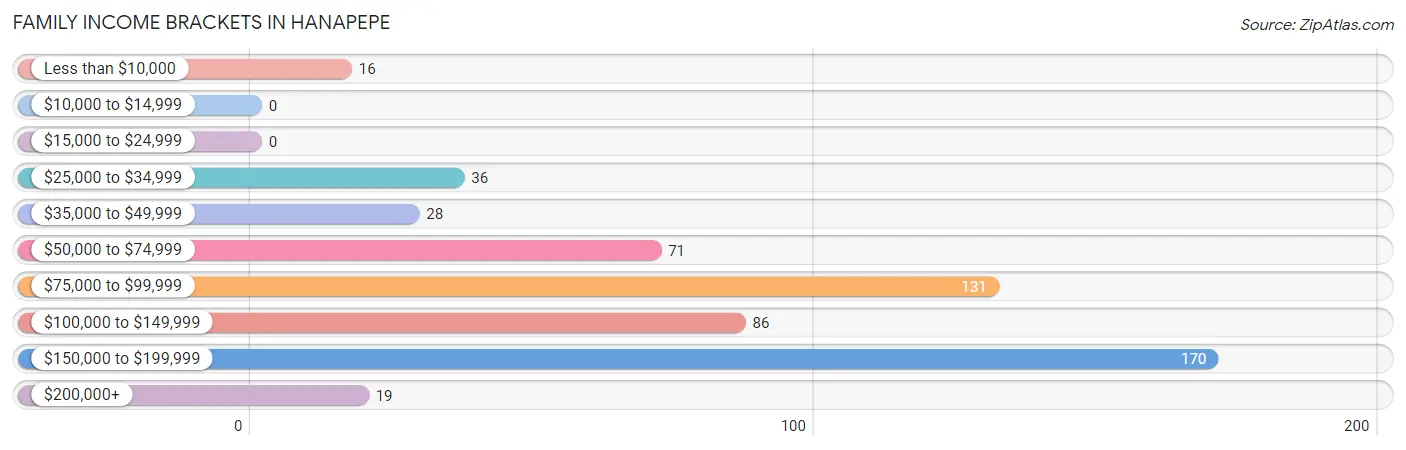
| Income Bracket | # Families | % Families |
| Less than $10,000 | 16 | 2.9% |
| $10,000 to $14,999 | 0 | 0.0% |
| $15,000 to $24,999 | 0 | 0.0% |
| $25,000 to $34,999 | 36 | 6.5% |
| $35,000 to $49,999 | 28 | 5.0% |
| $50,000 to $74,999 | 71 | 12.7% |
| $75,000 to $99,999 | 131 | 23.5% |
| $100,000 to $149,999 | 86 | 15.4% |
| $150,000 to $199,999 | 170 | 30.5% |
| $200,000+ | 19 | 3.4% |
Family Income by Famaliy Size in Hanapepe
4-person families (136 | 24.4%) account for the highest median family income in Hanapepe with $169,643 per family, while 2-person families (190 | 34.1%) have the highest median income of $50,486 per family member.
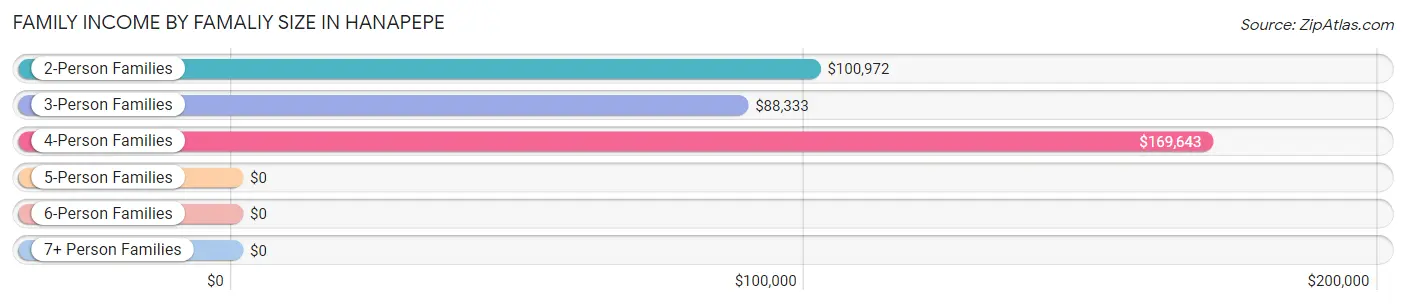
| Income Bracket | # Families | Median Income |
| 2-Person Families | 190 (34.1%) | $100,972 |
| 3-Person Families | 138 (24.8%) | $88,333 |
| 4-Person Families | 136 (24.4%) | $169,643 |
| 5-Person Families | 48 (8.6%) | $0 |
| 6-Person Families | 17 (3.0%) | $0 |
| 7+ Person Families | 28 (5.0%) | $0 |
| Total | 557 (100.0%) | $99,583 |
Family Income by Number of Earners in Hanapepe
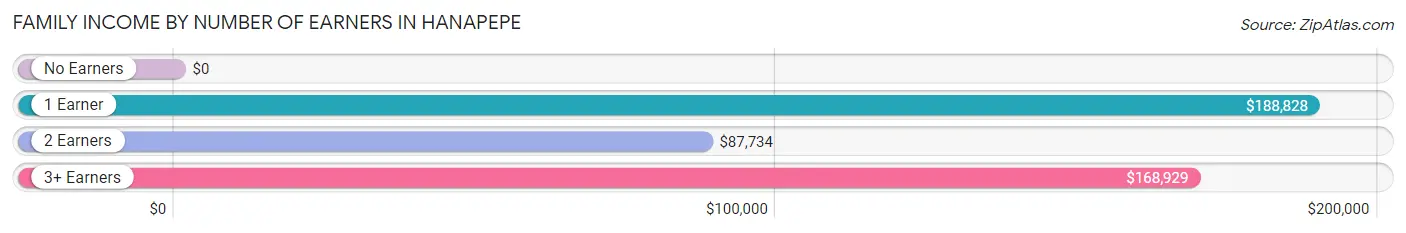
| Number of Earners | # Families | Median Income |
| No Earners | 71 (12.8%) | $0 |
| 1 Earner | 125 (22.4%) | $188,828 |
| 2 Earners | 205 (36.8%) | $87,734 |
| 3+ Earners | 156 (28.0%) | $168,929 |
| Total | 557 (100.0%) | $99,583 |
Household Income in Hanapepe
Household Income Brackets in Hanapepe
With 204 households falling in the category, the $150,000 to $199,999 income range is the most frequent in Hanapepe, accounting for 29.2% of all households.
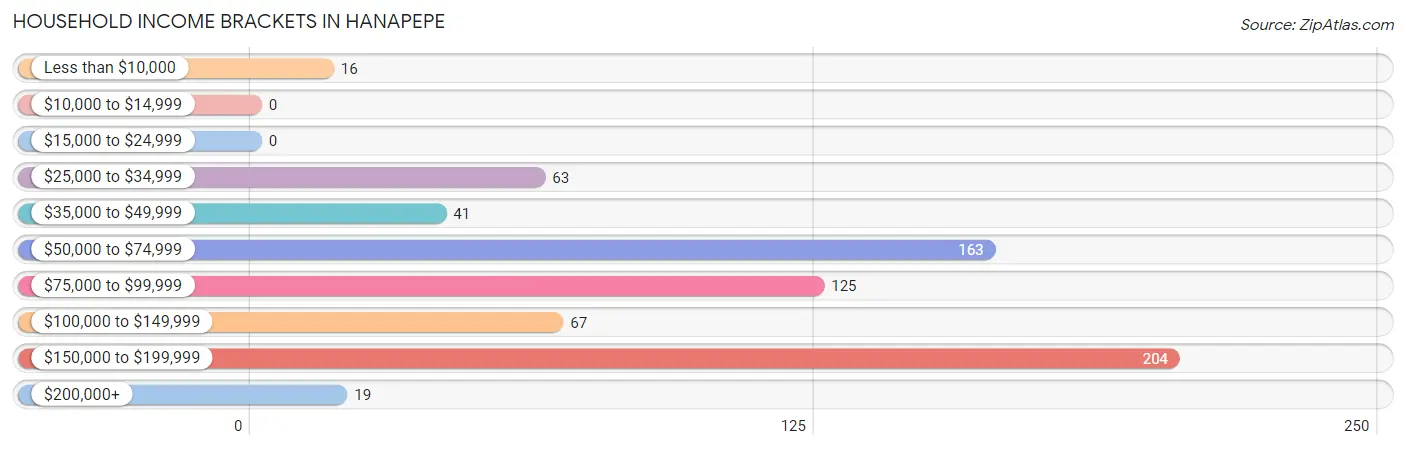
| Income Bracket | # Households | % Households |
| Less than $10,000 | 16 | 2.3% |
| $10,000 to $14,999 | 0 | 0.0% |
| $15,000 to $24,999 | 0 | 0.0% |
| $25,000 to $34,999 | 63 | 9.0% |
| $35,000 to $49,999 | 41 | 5.9% |
| $50,000 to $74,999 | 163 | 23.4% |
| $75,000 to $99,999 | 125 | 17.9% |
| $100,000 to $149,999 | 67 | 9.6% |
| $150,000 to $199,999 | 204 | 29.2% |
| $200,000+ | 19 | 2.7% |
Household Income by Householder Age in Hanapepe
The median household income in Hanapepe is $88,385, with the highest median household income of $87,839 found in the 25 to 44 years age bracket for the primary householder. A total of 179 households (25.6%) fall into this category.
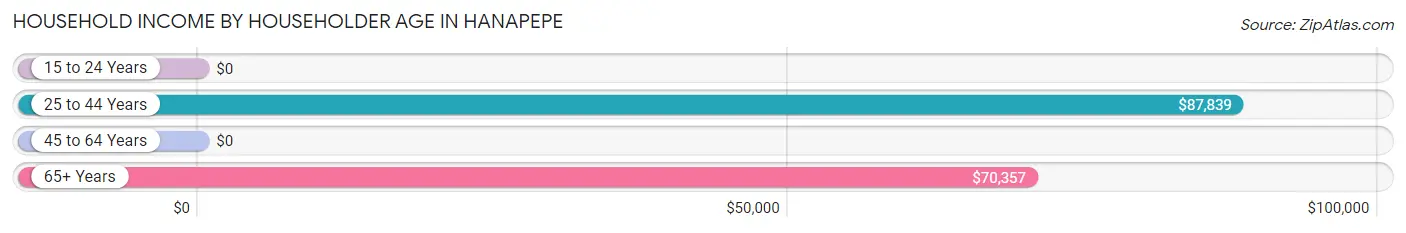
| Income Bracket | # Households | Median Income |
| 15 to 24 Years | 0 (0.0%) | $0 |
| 25 to 44 Years | 179 (25.6%) | $87,839 |
| 45 to 64 Years | 373 (53.4%) | $0 |
| 65+ Years | 146 (20.9%) | $70,357 |
| Total | 698 (100.0%) | $88,385 |
Poverty in Hanapepe
Income Below Poverty by Sex and Age in Hanapepe
With 5.4% poverty level for males and 1.5% for females among the residents of Hanapepe, 45 to 54 year old males and 55 to 64 year old females are the most vulnerable to poverty, with 20 males (17.2%) and 16 females (12.9%) in their respective age groups living below the poverty level.
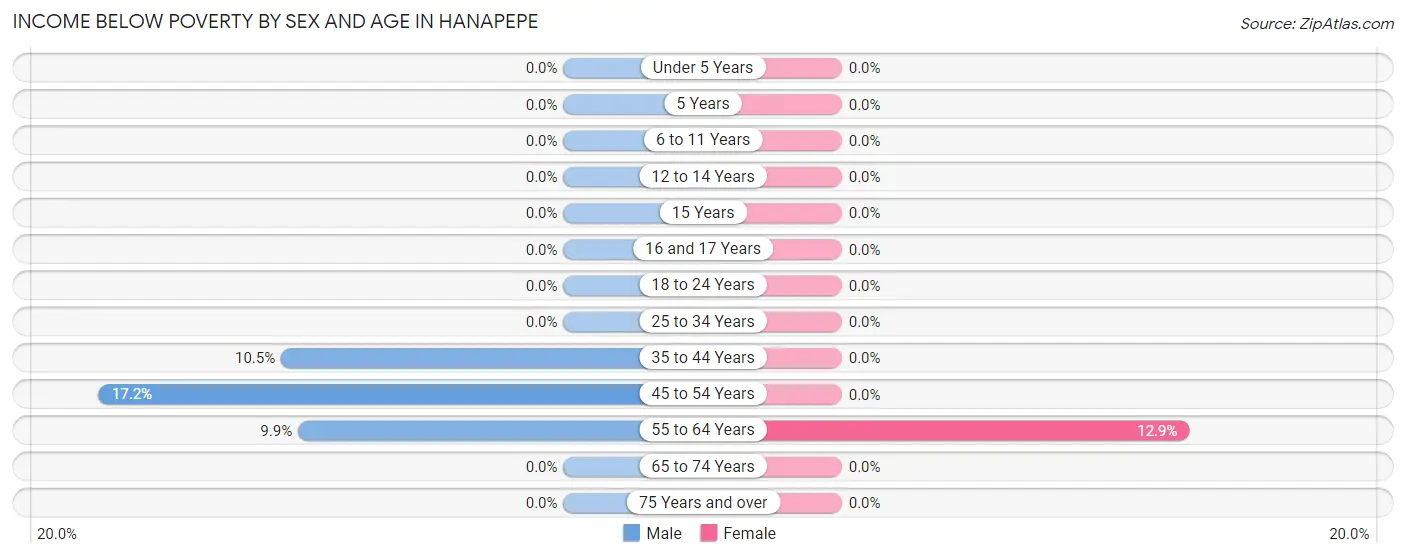
| Age Bracket | Male | Female |
| Under 5 Years | 0 (0.0%) | 0 (0.0%) |
| 5 Years | 0 (0.0%) | 0 (0.0%) |
| 6 to 11 Years | 0 (0.0%) | 0 (0.0%) |
| 12 to 14 Years | 0 (0.0%) | 0 (0.0%) |
| 15 Years | 0 (0.0%) | 0 (0.0%) |
| 16 and 17 Years | 0 (0.0%) | 0 (0.0%) |
| 18 to 24 Years | 0 (0.0%) | 0 (0.0%) |
| 25 to 34 Years | 0 (0.0%) | 0 (0.0%) |
| 35 to 44 Years | 24 (10.5%) | 0 (0.0%) |
| 45 to 54 Years | 20 (17.2%) | 0 (0.0%) |
| 55 to 64 Years | 20 (9.9%) | 16 (12.9%) |
| 65 to 74 Years | 0 (0.0%) | 0 (0.0%) |
| 75 Years and over | 0 (0.0%) | 0 (0.0%) |
| Total | 64 (5.4%) | 16 (1.5%) |
Income Above Poverty by Sex and Age in Hanapepe
According to the poverty statistics in Hanapepe, males aged under 5 years and females aged under 5 years are the age groups that are most secure financially, with 100.0% of males and 100.0% of females in these age groups living above the poverty line.
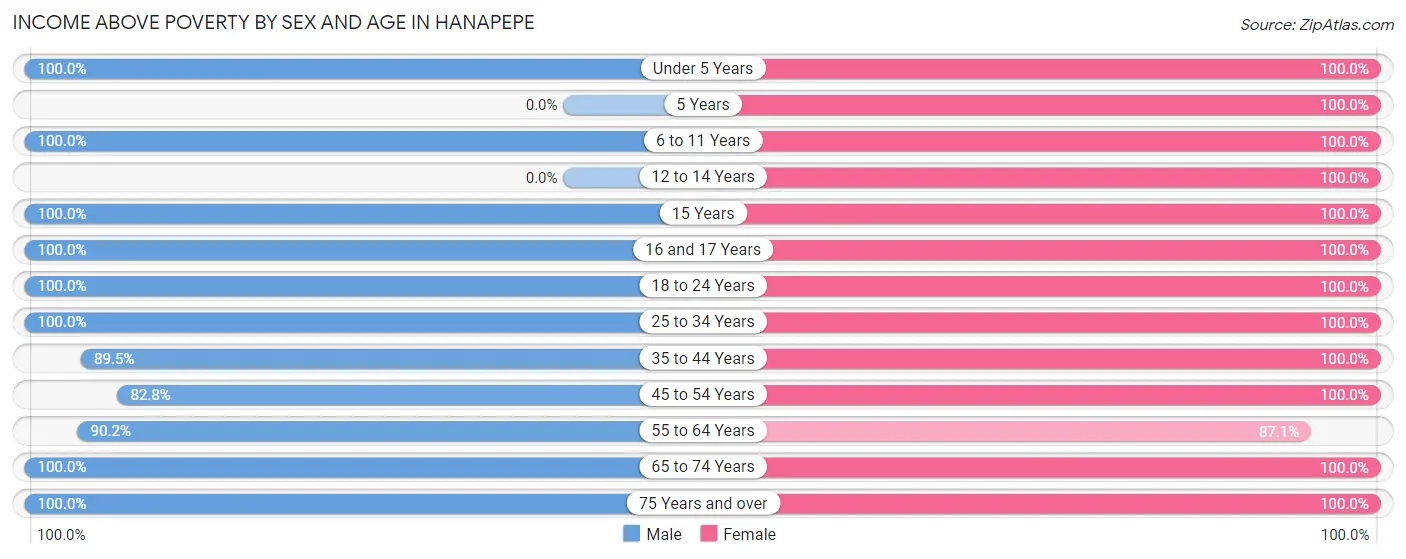
| Age Bracket | Male | Female |
| Under 5 Years | 19 (100.0%) | 48 (100.0%) |
| 5 Years | 0 (0.0%) | 18 (100.0%) |
| 6 to 11 Years | 57 (100.0%) | 45 (100.0%) |
| 12 to 14 Years | 0 (0.0%) | 49 (100.0%) |
| 15 Years | 11 (100.0%) | 31 (100.0%) |
| 16 and 17 Years | 36 (100.0%) | 6 (100.0%) |
| 18 to 24 Years | 19 (100.0%) | 56 (100.0%) |
| 25 to 34 Years | 277 (100.0%) | 259 (100.0%) |
| 35 to 44 Years | 205 (89.5%) | 105 (100.0%) |
| 45 to 54 Years | 96 (82.8%) | 138 (100.0%) |
| 55 to 64 Years | 183 (90.1%) | 108 (87.1%) |
| 65 to 74 Years | 97 (100.0%) | 72 (100.0%) |
| 75 Years and over | 124 (100.0%) | 103 (100.0%) |
| Total | 1,124 (94.6%) | 1,038 (98.5%) |
Income Below Poverty Among Married-Couple Families in Hanapepe
The poverty statistics for married-couple families in Hanapepe show that 4.2% or 16 of the total 385 families live below the poverty line. Families with no children have the highest poverty rate of 6.9%, comprising of 16 families. On the other hand, families with 1 or 2 children have the lowest poverty rate of 0.0%, which includes 0 families.
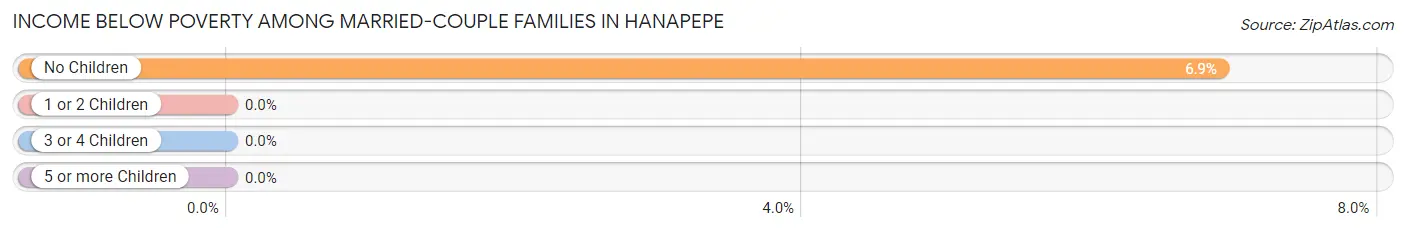
| Children | Above Poverty | Below Poverty |
| No Children | 216 (93.1%) | 16 (6.9%) |
| 1 or 2 Children | 136 (100.0%) | 0 (0.0%) |
| 3 or 4 Children | 17 (100.0%) | 0 (0.0%) |
| 5 or more Children | 0 (0.0%) | 0 (0.0%) |
| Total | 369 (95.8%) | 16 (4.2%) |
Income Below Poverty Among Single-Parent Households in Hanapepe
| Children | Single Father | Single Mother |
| No Children | 0 (0.0%) | 0 (0.0%) |
| 1 or 2 Children | 0 (0.0%) | 0 (0.0%) |
| 3 or 4 Children | 0 (0.0%) | 0 (0.0%) |
| 5 or more Children | 0 (0.0%) | 0 (0.0%) |
| Total | 0 (0.0%) | 0 (0.0%) |
Income Below Poverty Among Married-Couple vs Single-Parent Households in Hanapepe
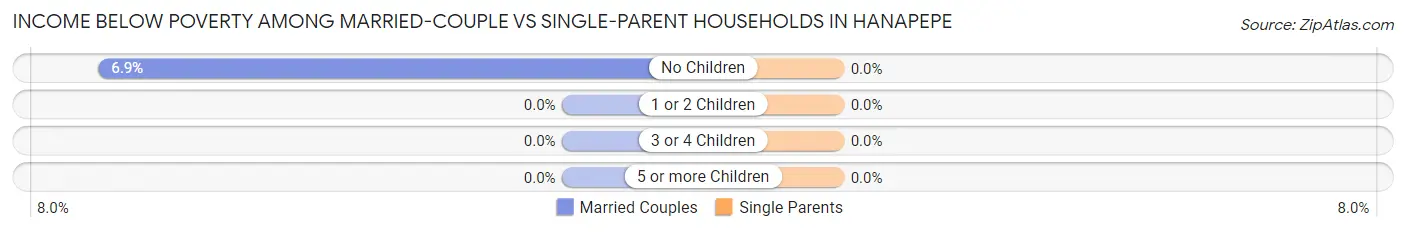
| Children | Married-Couple Families | Single-Parent Households |
| No Children | 16 (6.9%) | 0 (0.0%) |
| 1 or 2 Children | 0 (0.0%) | 0 (0.0%) |
| 3 or 4 Children | 0 (0.0%) | 0 (0.0%) |
| 5 or more Children | 0 (0.0%) | 0 (0.0%) |
| Total | 16 (4.2%) | 0 (0.0%) |
Race in Hanapepe
The most populous races in Hanapepe are Asian (1,108 | 49.4%), Two or more Races (423 | 18.9%), and Hawaiian / Pacific (377 | 16.8%).
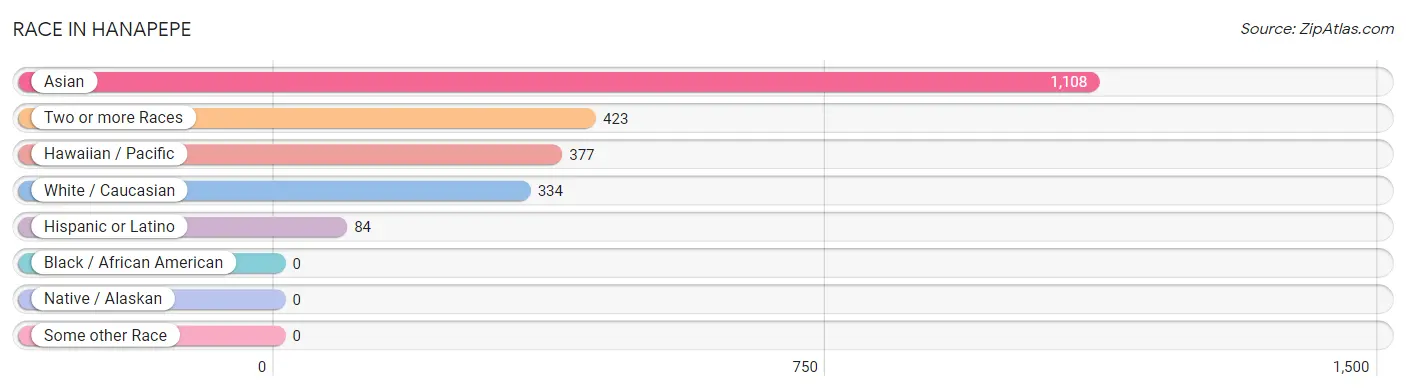
| Race | # Population | % Population |
| Asian | 1,108 | 49.4% |
| Black / African American | 0 | 0.0% |
| Hawaiian / Pacific | 377 | 16.8% |
| Hispanic or Latino | 84 | 3.7% |
| Native / Alaskan | 0 | 0.0% |
| White / Caucasian | 334 | 14.9% |
| Two or more Races | 423 | 18.9% |
| Some other Race | 0 | 0.0% |
| Total | 2,242 | 100.0% |
Ancestry in Hanapepe
The most populous ancestries reported in Hanapepe are Korean (1,127 | 50.3%), Native Hawaiian (679 | 30.3%), Bhutanese (422 | 18.8%), Indian (Asian) (262 | 11.7%), and Burmese (221 | 9.9%), together accounting for 120.9% of all Hanapepe residents.
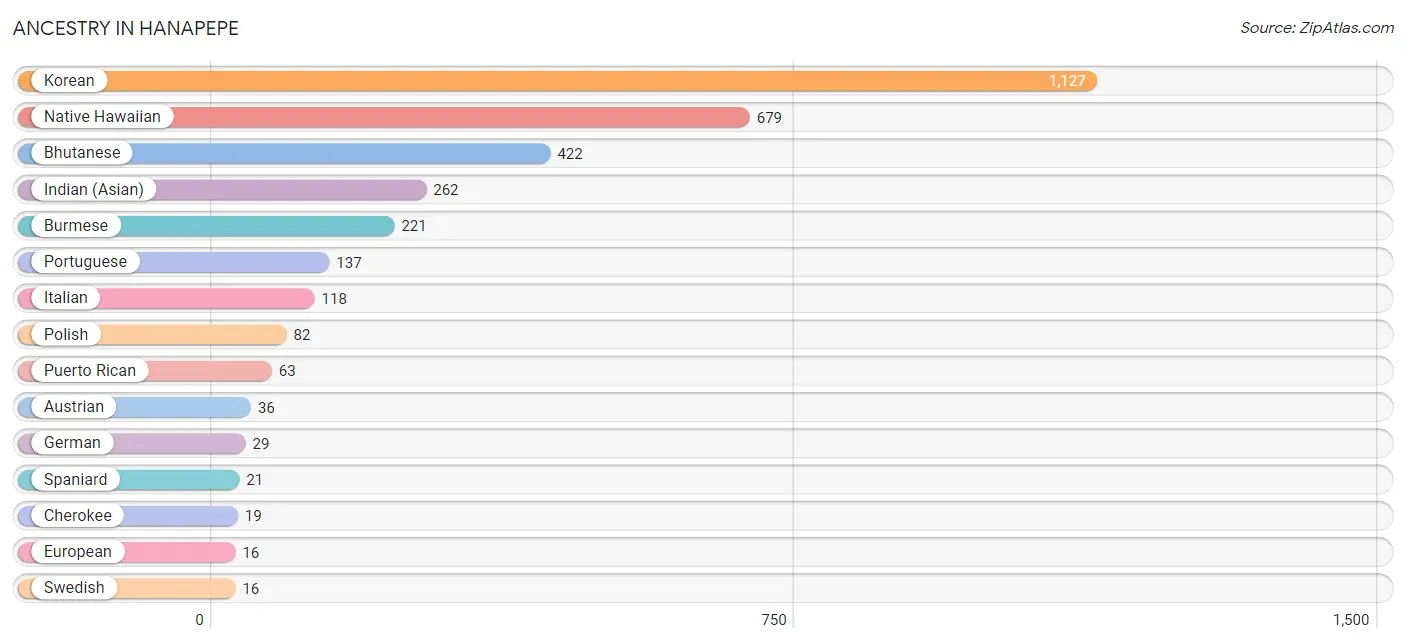
| Ancestry | # Population | % Population |
| Austrian | 36 | 1.6% |
| Bhutanese | 422 | 18.8% |
| Burmese | 221 | 9.9% |
| Cherokee | 19 | 0.9% |
| European | 16 | 0.7% |
| German | 29 | 1.3% |
| Indian (Asian) | 262 | 11.7% |
| Irish | 15 | 0.7% |
| Italian | 118 | 5.3% |
| Korean | 1,127 | 50.3% |
| Native Hawaiian | 679 | 30.3% |
| Polish | 82 | 3.7% |
| Portuguese | 137 | 6.1% |
| Puerto Rican | 63 | 2.8% |
| Spaniard | 21 | 0.9% |
| Swedish | 16 | 0.7% | View All 16 Rows |
Immigrants in Hanapepe
The most numerous immigrant groups reported in Hanapepe came from Asia (301 | 13.4%), Philippines (301 | 13.4%), and South Eastern Asia (301 | 13.4%), together accounting for 40.3% of all Hanapepe residents.
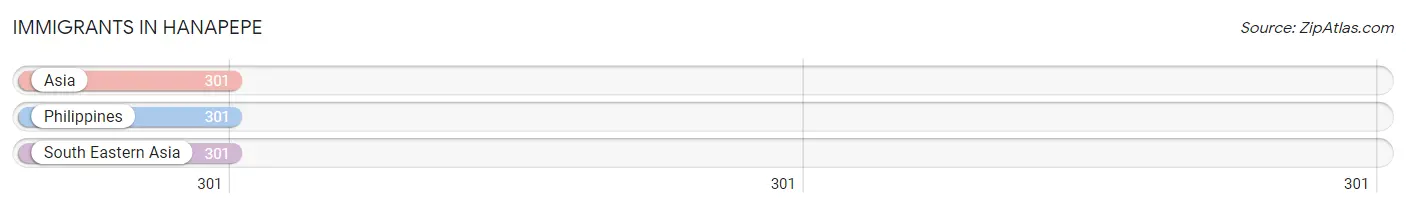
| Immigration Origin | # Population | % Population |
| Asia | 301 | 13.4% |
| Philippines | 301 | 13.4% |
| South Eastern Asia | 301 | 13.4% | View All 3 Rows |
Sex and Age in Hanapepe
Sex and Age in Hanapepe
The most populous age groups in Hanapepe are 40 to 44 Years (166 | 14.0%) for men and 30 to 34 Years (157 | 14.9%) for women.
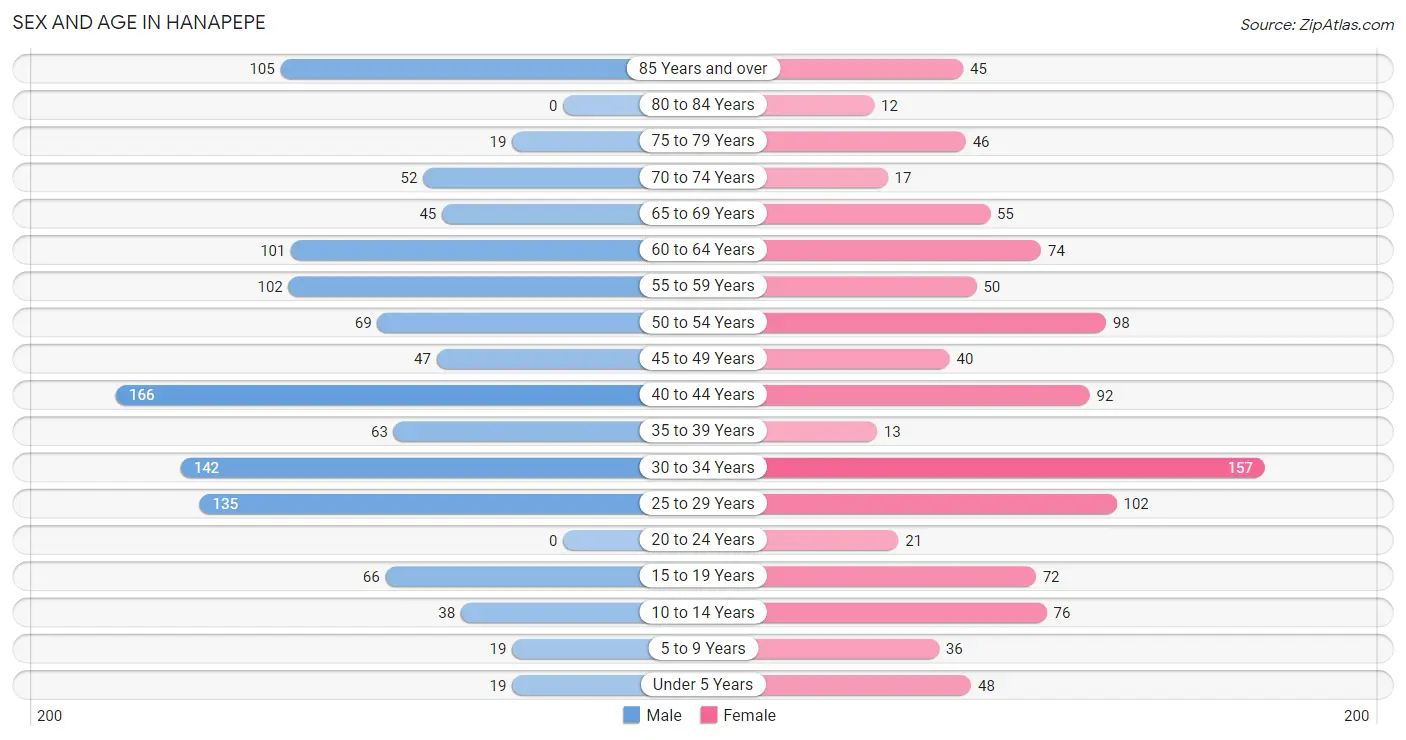
| Age Bracket | Male | Female |
| Under 5 Years | 19 (1.6%) | 48 (4.5%) |
| 5 to 9 Years | 19 (1.6%) | 36 (3.4%) |
| 10 to 14 Years | 38 (3.2%) | 76 (7.2%) |
| 15 to 19 Years | 66 (5.6%) | 72 (6.8%) |
| 20 to 24 Years | 0 (0.0%) | 21 (2.0%) |
| 25 to 29 Years | 135 (11.4%) | 102 (9.7%) |
| 30 to 34 Years | 142 (11.9%) | 157 (14.9%) |
| 35 to 39 Years | 63 (5.3%) | 13 (1.2%) |
| 40 to 44 Years | 166 (14.0%) | 92 (8.7%) |
| 45 to 49 Years | 47 (4.0%) | 40 (3.8%) |
| 50 to 54 Years | 69 (5.8%) | 98 (9.3%) |
| 55 to 59 Years | 102 (8.6%) | 50 (4.7%) |
| 60 to 64 Years | 101 (8.5%) | 74 (7.0%) |
| 65 to 69 Years | 45 (3.8%) | 55 (5.2%) |
| 70 to 74 Years | 52 (4.4%) | 17 (1.6%) |
| 75 to 79 Years | 19 (1.6%) | 46 (4.4%) |
| 80 to 84 Years | 0 (0.0%) | 12 (1.1%) |
| 85 Years and over | 105 (8.8%) | 45 (4.3%) |
| Total | 1,188 (100.0%) | 1,054 (100.0%) |
Families and Households in Hanapepe
Median Family Size in Hanapepe
The median family size in Hanapepe is 3.57 persons per family, with single female/mother families (79 | 14.2%) accounting for the largest median family size of 4.67 persons per family. On the other hand, single male/father families (93 | 16.7%) represent the smallest median family size with 2.43 persons per family.
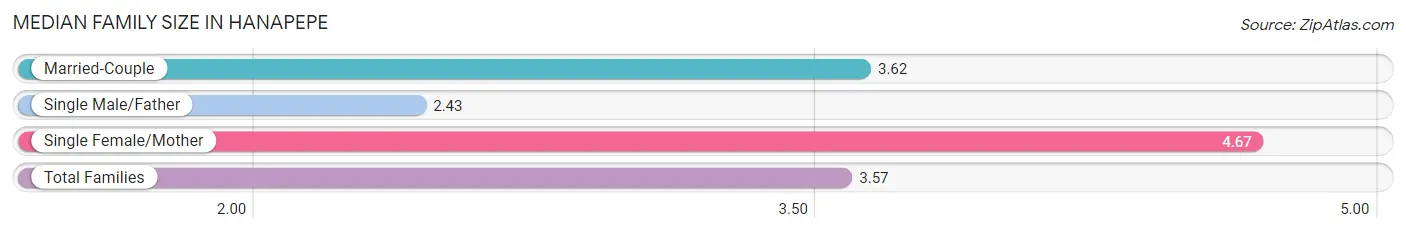
| Family Type | # Families | Family Size |
| Married-Couple | 385 (69.1%) | 3.62 |
| Single Male/Father | 93 (16.7%) | 2.43 |
| Single Female/Mother | 79 (14.2%) | 4.67 |
| Total Families | 557 (100.0%) | 3.57 |
Median Household Size in Hanapepe
The median household size in Hanapepe is 3.21 persons per household, with single female/mother households (79 | 11.3%) accounting for the largest median household size of 4.97 persons per household. non-family households (141 | 20.2%) represent the smallest median household size with 1.31 persons per household.
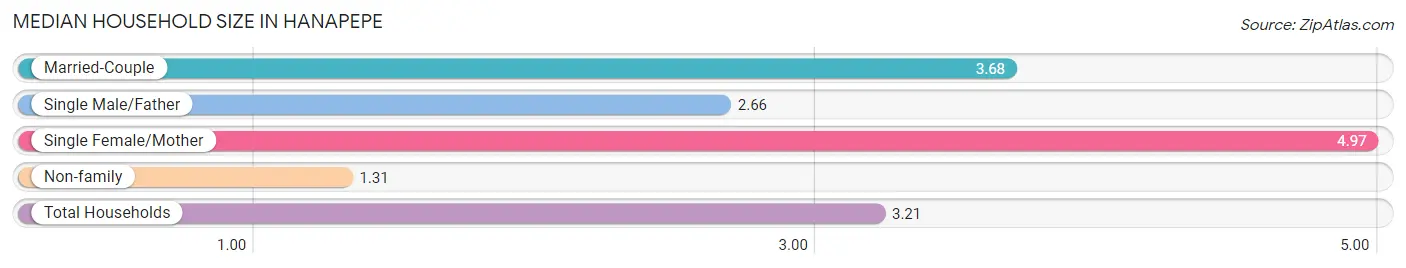
| Household Type | # Households | Household Size |
| Married-Couple | 385 (55.2%) | 3.68 |
| Single Male/Father | 93 (13.3%) | 2.66 |
| Single Female/Mother | 79 (11.3%) | 4.97 |
| Non-family | 141 (20.2%) | 1.31 |
| Total Households | 698 (100.0%) | 3.21 |
Household Size by Marriage Status in Hanapepe
Out of a total of 698 households in Hanapepe, 557 (79.8%) are family households, while 141 (20.2%) are nonfamily households. The most numerous type of family households are 3-person households, comprising 160, and the most common type of nonfamily households are 1-person households, comprising 105.
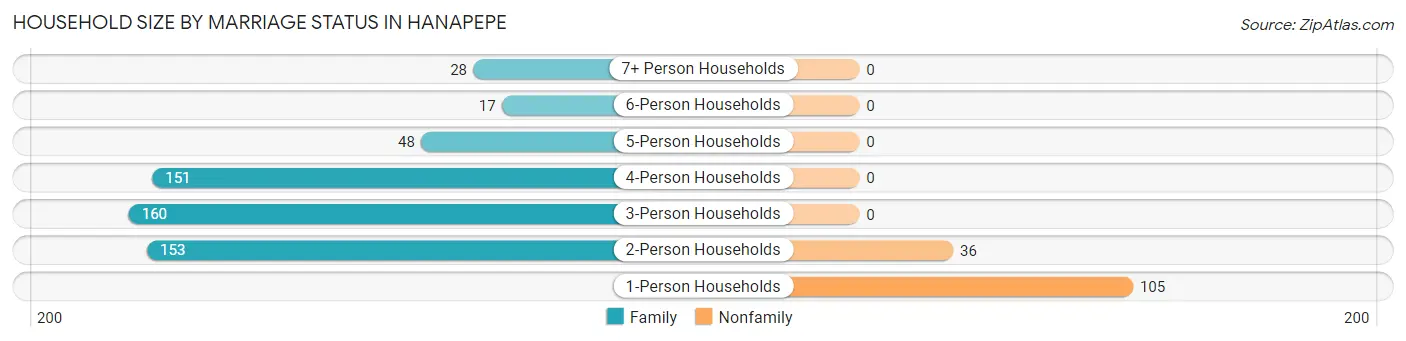
| Household Size | Family Households | Nonfamily Households |
| 1-Person Households | - | 105 (15.0%) |
| 2-Person Households | 153 (21.9%) | 36 (5.2%) |
| 3-Person Households | 160 (22.9%) | 0 (0.0%) |
| 4-Person Households | 151 (21.6%) | 0 (0.0%) |
| 5-Person Households | 48 (6.9%) | 0 (0.0%) |
| 6-Person Households | 17 (2.4%) | 0 (0.0%) |
| 7+ Person Households | 28 (4.0%) | 0 (0.0%) |
| Total | 557 (79.8%) | 141 (20.2%) |
Female Fertility in Hanapepe
Fertility by Age in Hanapepe
Average fertility rate in Hanapepe is 38.0 births per 1,000 women. Women in the age bracket of 15 to 19 years have the highest fertility rate with 264.0 births per 1,000 women. Women in the age bracket of 15 to 19 years acount for 100.0% of all women with births.
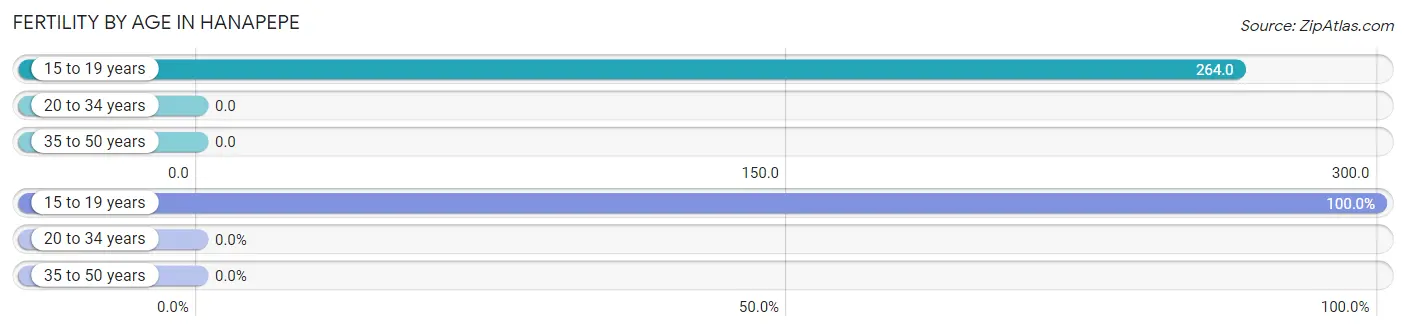
| Age Bracket | Women with Births | Births / 1,000 Women |
| 15 to 19 years | 19 (100.0%) | 264.0 |
| 20 to 34 years | 0 (0.0%) | 0.0 |
| 35 to 50 years | 0 (0.0%) | 0.0 |
| Total | 19 (100.0%) | 38.0 |
Fertility by Age by Marriage Status in Hanapepe
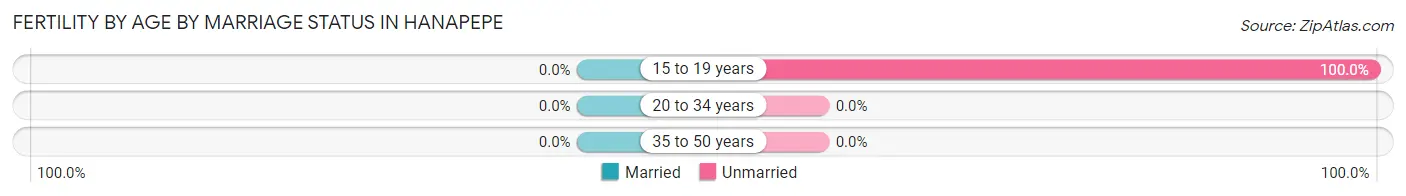
| Age Bracket | Married | Unmarried |
| 15 to 19 years | 0 (0.0%) | 19 (100.0%) |
| 20 to 34 years | 0 (0.0%) | 0 (0.0%) |
| 35 to 50 years | 0 (0.0%) | 0 (0.0%) |
| Total | 0 (0.0%) | 19 (100.0%) |
Fertility by Education in Hanapepe
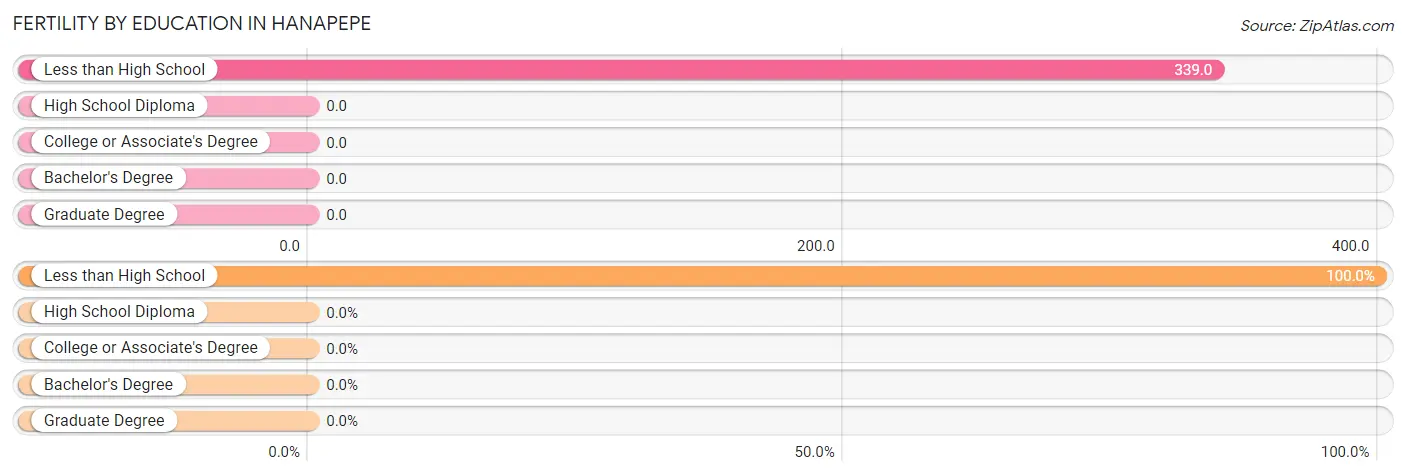
| Educational Attainment | Women with Births | Births / 1,000 Women |
| Less than High School | 19 (100.0%) | 339.0 |
| High School Diploma | 0 (0.0%) | 0.0 |
| College or Associate's Degree | 0 (0.0%) | 0.0 |
| Bachelor's Degree | 0 (0.0%) | 0.0 |
| Graduate Degree | 0 (0.0%) | 0.0 |
| Total | 19 (100.0%) | 38.0 |
Fertility by Education by Marriage Status in Hanapepe
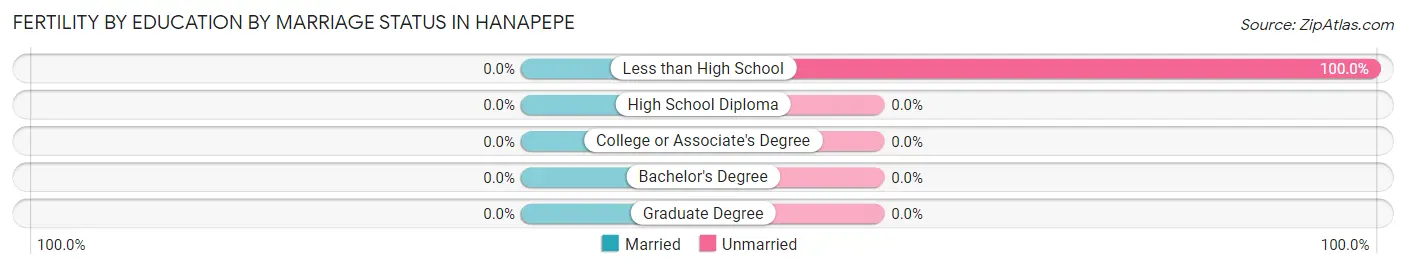
| Educational Attainment | Married | Unmarried |
| Less than High School | 0 (0.0%) | 19 (100.0%) |
| High School Diploma | 0 (0.0%) | 0 (0.0%) |
| College or Associate's Degree | 0 (0.0%) | 0 (0.0%) |
| Bachelor's Degree | 0 (0.0%) | 0 (0.0%) |
| Graduate Degree | 0 (0.0%) | 0 (0.0%) |
| Total | 0 (0.0%) | 19 (100.0%) |
Employment Characteristics in Hanapepe
Employment by Class of Employer in Hanapepe
Among the 1,228 employed individuals in Hanapepe, private company employees (710 | 57.8%), self-employed (not incorporated) (161 | 13.1%), and state government employees (156 | 12.7%) make up the most common classes of employment.
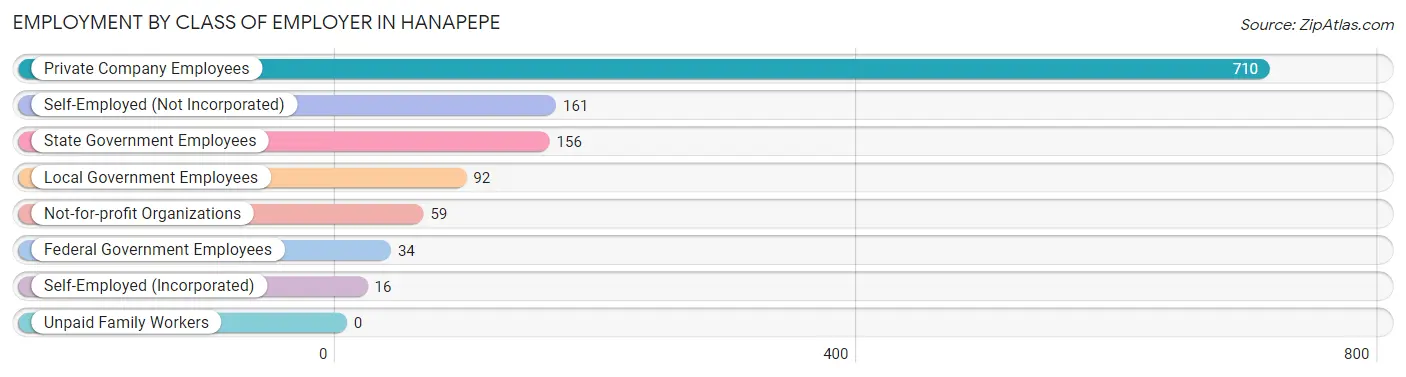
| Employer Class | # Employees | % Employees |
| Private Company Employees | 710 | 57.8% |
| Self-Employed (Incorporated) | 16 | 1.3% |
| Self-Employed (Not Incorporated) | 161 | 13.1% |
| Not-for-profit Organizations | 59 | 4.8% |
| Local Government Employees | 92 | 7.5% |
| State Government Employees | 156 | 12.7% |
| Federal Government Employees | 34 | 2.8% |
| Unpaid Family Workers | 0 | 0.0% |
| Total | 1,228 | 100.0% |
Employment Status by Age in Hanapepe
According to the labor force statistics for Hanapepe, out of the total population over 16 years of age (1,964), 68.6% or 1,347 individuals are in the labor force, with 6.5% or 88 of them unemployed. The age group with the highest labor force participation rate is 20 to 24 years, with 100.0% or 21 individuals in the labor force. Within the labor force, the 35 to 44 years age range has the highest percentage of unemployed individuals, with 17.1% or 47 of them being unemployed.
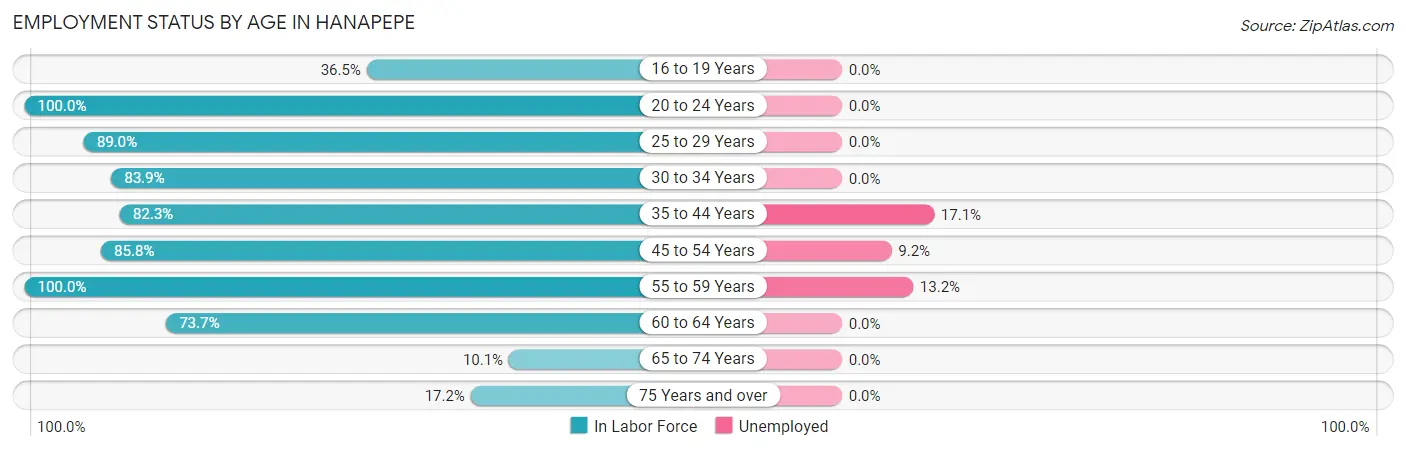
| Age Bracket | In Labor Force | Unemployed |
| 16 to 19 Years | 35 (36.5%) | 0 (0.0%) |
| 20 to 24 Years | 21 (100.0%) | 0 (0.0%) |
| 25 to 29 Years | 211 (89.0%) | 0 (0.0%) |
| 30 to 34 Years | 251 (83.9%) | 0 (0.0%) |
| 35 to 44 Years | 275 (82.3%) | 47 (17.1%) |
| 45 to 54 Years | 218 (85.8%) | 20 (9.2%) |
| 55 to 59 Years | 152 (100.0%) | 20 (13.2%) |
| 60 to 64 Years | 129 (73.7%) | 0 (0.0%) |
| 65 to 74 Years | 17 (10.1%) | 0 (0.0%) |
| 75 Years and over | 39 (17.2%) | 0 (0.0%) |
| Total | 1,347 (68.6%) | 88 (6.5%) |
Employment Status by Educational Attainment in Hanapepe
According to labor force statistics for Hanapepe, 85.2% of individuals (1,236) out of the total population between 25 and 64 years of age (1,451) are in the labor force, with 7.0% or 87 of them being unemployed. The group with the highest labor force participation rate are those with the educational attainment of less than high school, with 100.0% or 10 individuals in the labor force. Within the labor force, individuals with high school diploma education have the highest percentage of unemployment, with 10.9% or 65 of them being unemployed.
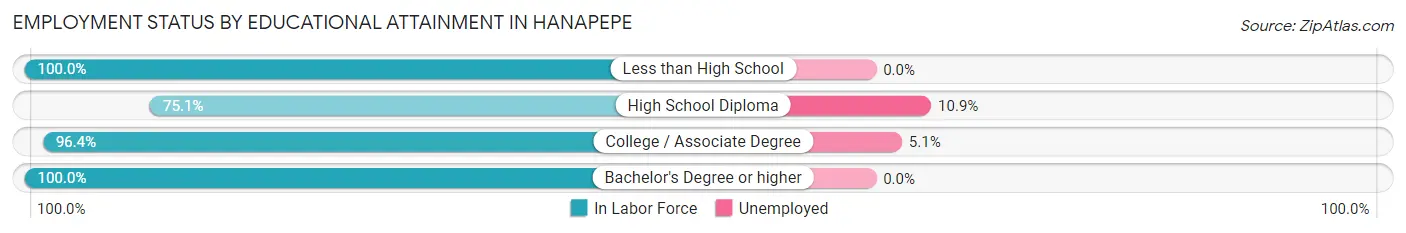
| Educational Attainment | In Labor Force | Unemployed |
| Less than High School | 10 (100.0%) | 0 (0.0%) |
| High School Diploma | 599 (75.1%) | 87 (10.9%) |
| College / Associate Degree | 432 (96.4%) | 23 (5.1%) |
| Bachelor's Degree or higher | 195 (100.0%) | 0 (0.0%) |
| Total | 1,236 (85.2%) | 102 (7.0%) |
Employment Occupations by Sex in Hanapepe
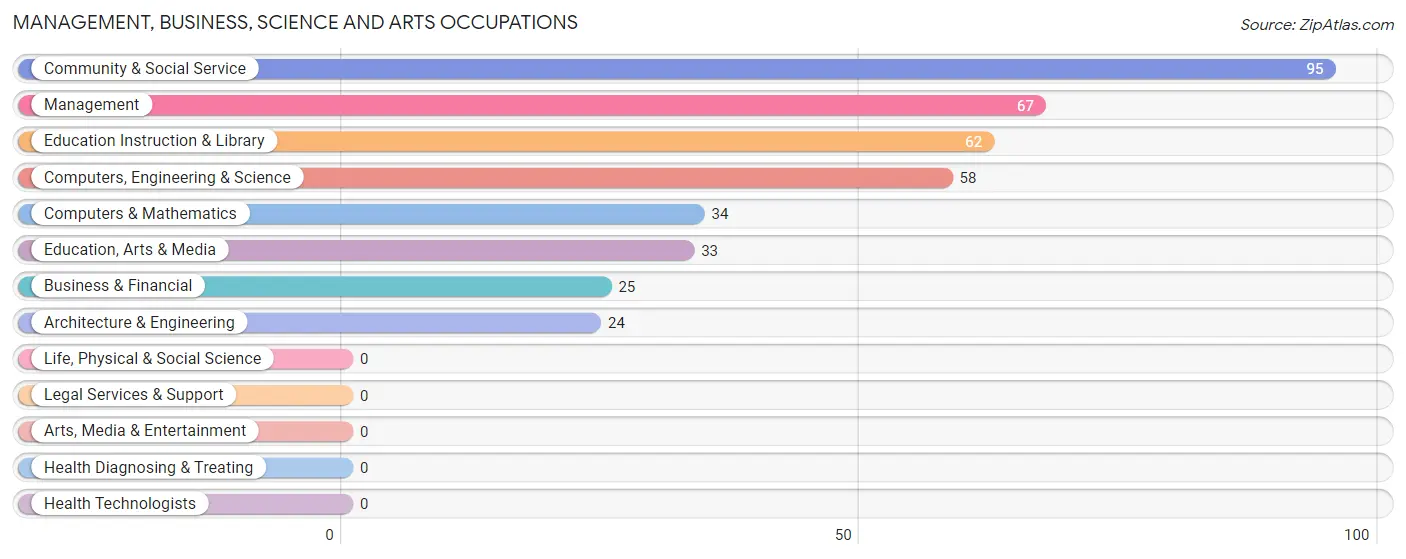
Management, Business, Science and Arts Occupations
The most common Management, Business, Science and Arts occupations in Hanapepe are Community & Social Service (95 | 7.5%), Management (67 | 5.3%), Education Instruction & Library (62 | 4.9%), Computers, Engineering & Science (58 | 4.6%), and Computers & Mathematics (34 | 2.7%).
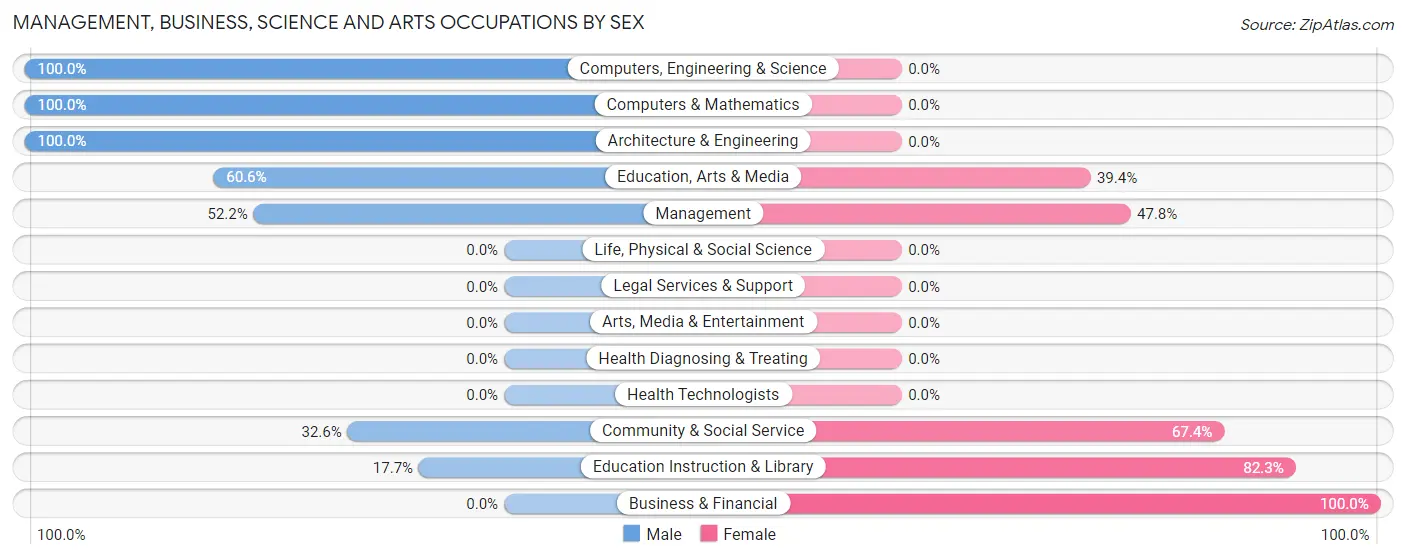
Management, Business, Science and Arts Occupations by Sex
Within the Management, Business, Science and Arts occupations in Hanapepe, the most male-oriented occupations are Computers, Engineering & Science (100.0%), Computers & Mathematics (100.0%), and Architecture & Engineering (100.0%), while the most female-oriented occupations are Business & Financial (100.0%), Education Instruction & Library (82.3%), and Community & Social Service (67.4%).
| Occupation | Male | Female |
| Management | 35 (52.2%) | 32 (47.8%) |
| Business & Financial | 0 (0.0%) | 25 (100.0%) |
| Computers, Engineering & Science | 58 (100.0%) | 0 (0.0%) |
| Computers & Mathematics | 34 (100.0%) | 0 (0.0%) |
| Architecture & Engineering | 24 (100.0%) | 0 (0.0%) |
| Life, Physical & Social Science | 0 (0.0%) | 0 (0.0%) |
| Community & Social Service | 31 (32.6%) | 64 (67.4%) |
| Education, Arts & Media | 20 (60.6%) | 13 (39.4%) |
| Legal Services & Support | 0 (0.0%) | 0 (0.0%) |
| Education Instruction & Library | 11 (17.7%) | 51 (82.3%) |
| Arts, Media & Entertainment | 0 (0.0%) | 0 (0.0%) |
| Health Diagnosing & Treating | 0 (0.0%) | 0 (0.0%) |
| Health Technologists | 0 (0.0%) | 0 (0.0%) |
| Total (Category) | 124 (50.6%) | 121 (49.4%) |
| Total (Overall) | 712 (56.5%) | 549 (43.5%) |
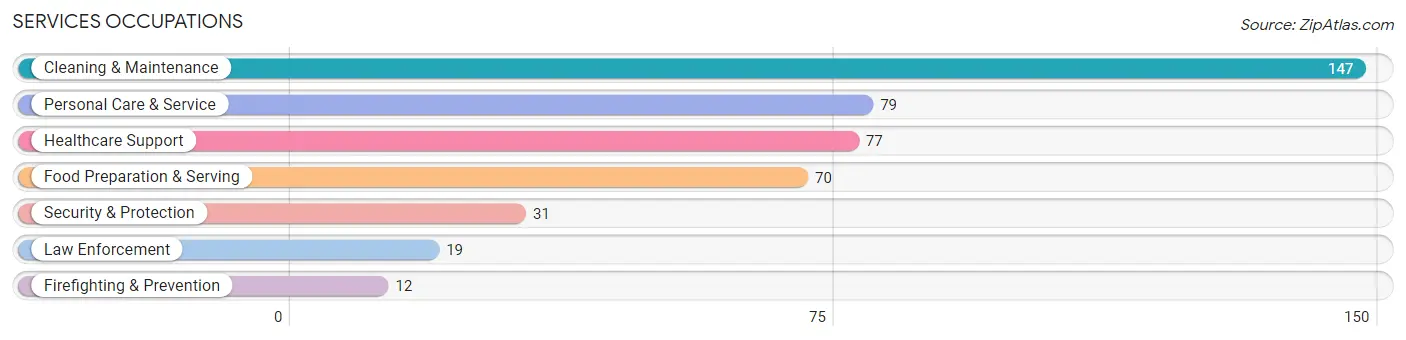
Services Occupations
The most common Services occupations in Hanapepe are Cleaning & Maintenance (147 | 11.7%), Personal Care & Service (79 | 6.3%), Healthcare Support (77 | 6.1%), Food Preparation & Serving (70 | 5.6%), and Security & Protection (31 | 2.5%).
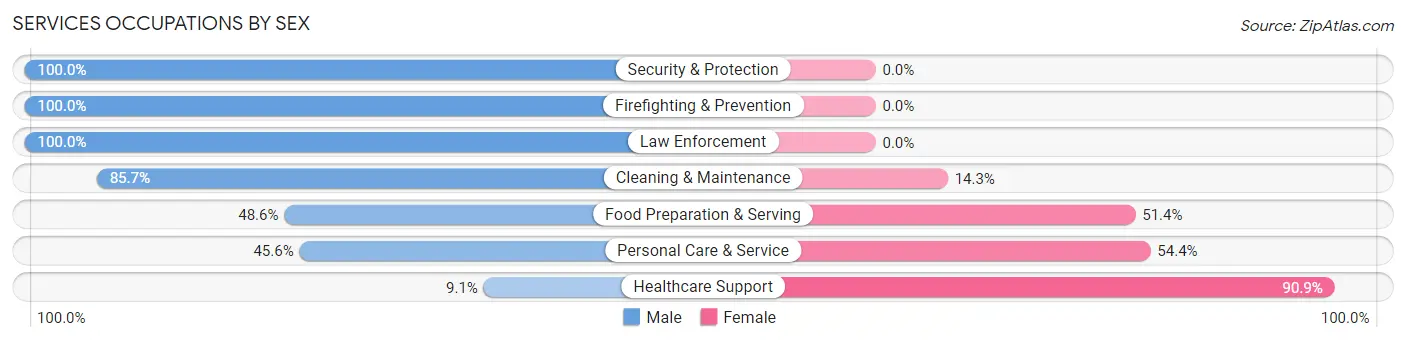
Services Occupations by Sex
Within the Services occupations in Hanapepe, the most male-oriented occupations are Security & Protection (100.0%), Firefighting & Prevention (100.0%), and Law Enforcement (100.0%), while the most female-oriented occupations are Healthcare Support (90.9%), Personal Care & Service (54.4%), and Food Preparation & Serving (51.4%).
| Occupation | Male | Female |
| Healthcare Support | 7 (9.1%) | 70 (90.9%) |
| Security & Protection | 31 (100.0%) | 0 (0.0%) |
| Firefighting & Prevention | 12 (100.0%) | 0 (0.0%) |
| Law Enforcement | 19 (100.0%) | 0 (0.0%) |
| Food Preparation & Serving | 34 (48.6%) | 36 (51.4%) |
| Cleaning & Maintenance | 126 (85.7%) | 21 (14.3%) |
| Personal Care & Service | 36 (45.6%) | 43 (54.4%) |
| Total (Category) | 234 (57.9%) | 170 (42.1%) |
| Total (Overall) | 712 (56.5%) | 549 (43.5%) |
Sales and Office Occupations
The most common Sales and Office occupations in Hanapepe are Office & Administration (149 | 11.8%), and Sales & Related (30 | 2.4%).
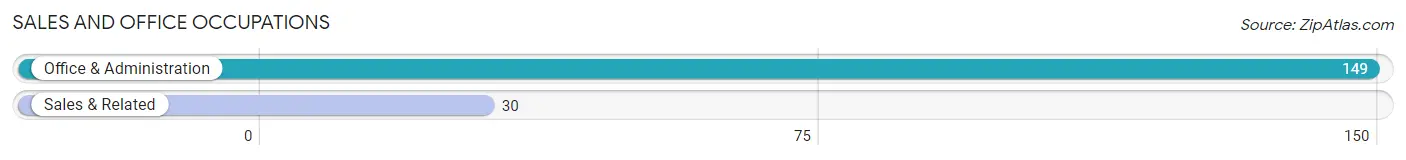
Sales and Office Occupations by Sex
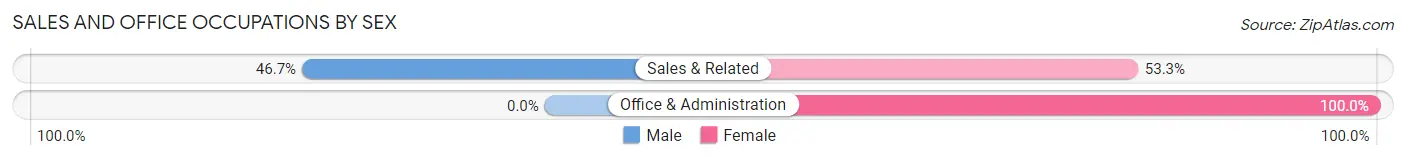
| Occupation | Male | Female |
| Sales & Related | 14 (46.7%) | 16 (53.3%) |
| Office & Administration | 0 (0.0%) | 149 (100.0%) |
| Total (Category) | 14 (7.8%) | 165 (92.2%) |
| Total (Overall) | 712 (56.5%) | 549 (43.5%) |
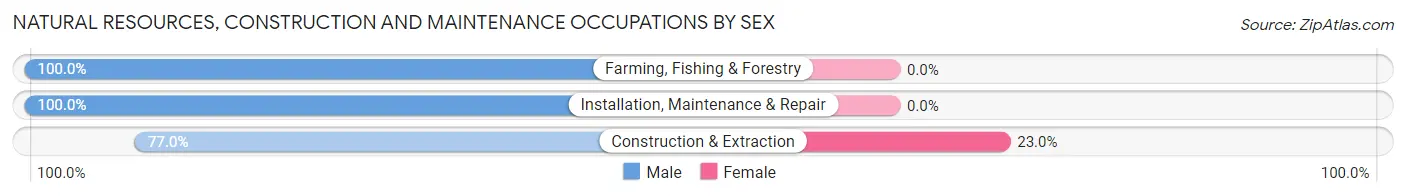
Natural Resources, Construction and Maintenance Occupations
The most common Natural Resources, Construction and Maintenance occupations in Hanapepe are Construction & Extraction (74 | 5.9%), Farming, Fishing & Forestry (21 | 1.7%), and Installation, Maintenance & Repair (20 | 1.6%).

Natural Resources, Construction and Maintenance Occupations by Sex
| Occupation | Male | Female |
| Farming, Fishing & Forestry | 21 (100.0%) | 0 (0.0%) |
| Construction & Extraction | 57 (77.0%) | 17 (23.0%) |
| Installation, Maintenance & Repair | 20 (100.0%) | 0 (0.0%) |
| Total (Category) | 98 (85.2%) | 17 (14.8%) |
| Total (Overall) | 712 (56.5%) | 549 (43.5%) |
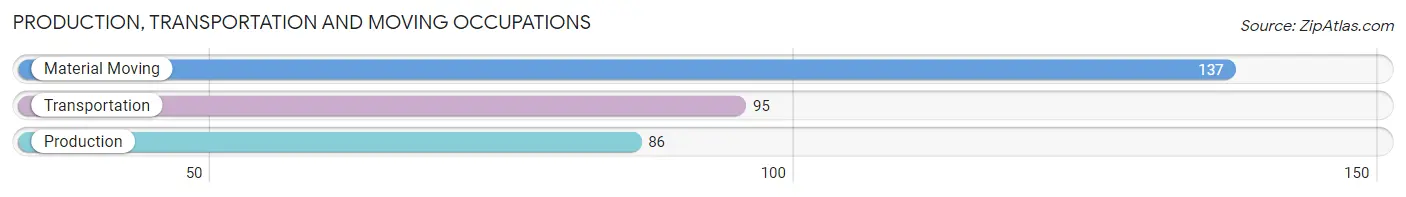
Production, Transportation and Moving Occupations
The most common Production, Transportation and Moving occupations in Hanapepe are Material Moving (137 | 10.9%), Transportation (95 | 7.5%), and Production (86 | 6.8%).
Production, Transportation and Moving Occupations by Sex
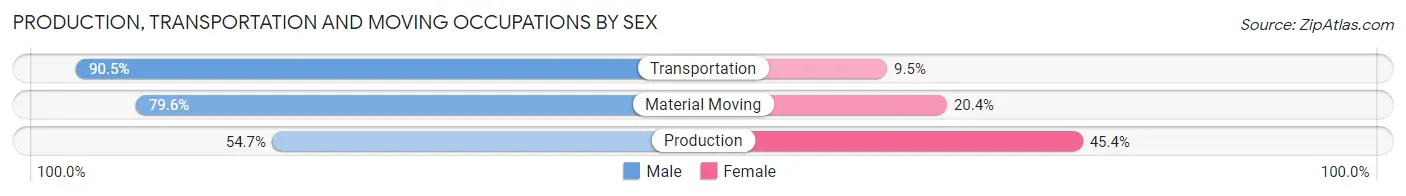
| Occupation | Male | Female |
| Production | 47 (54.6%) | 39 (45.4%) |
| Transportation | 86 (90.5%) | 9 (9.5%) |
| Material Moving | 109 (79.6%) | 28 (20.4%) |
| Total (Category) | 242 (76.1%) | 76 (23.9%) |
| Total (Overall) | 712 (56.5%) | 549 (43.5%) |
Employment Industries by Sex in Hanapepe
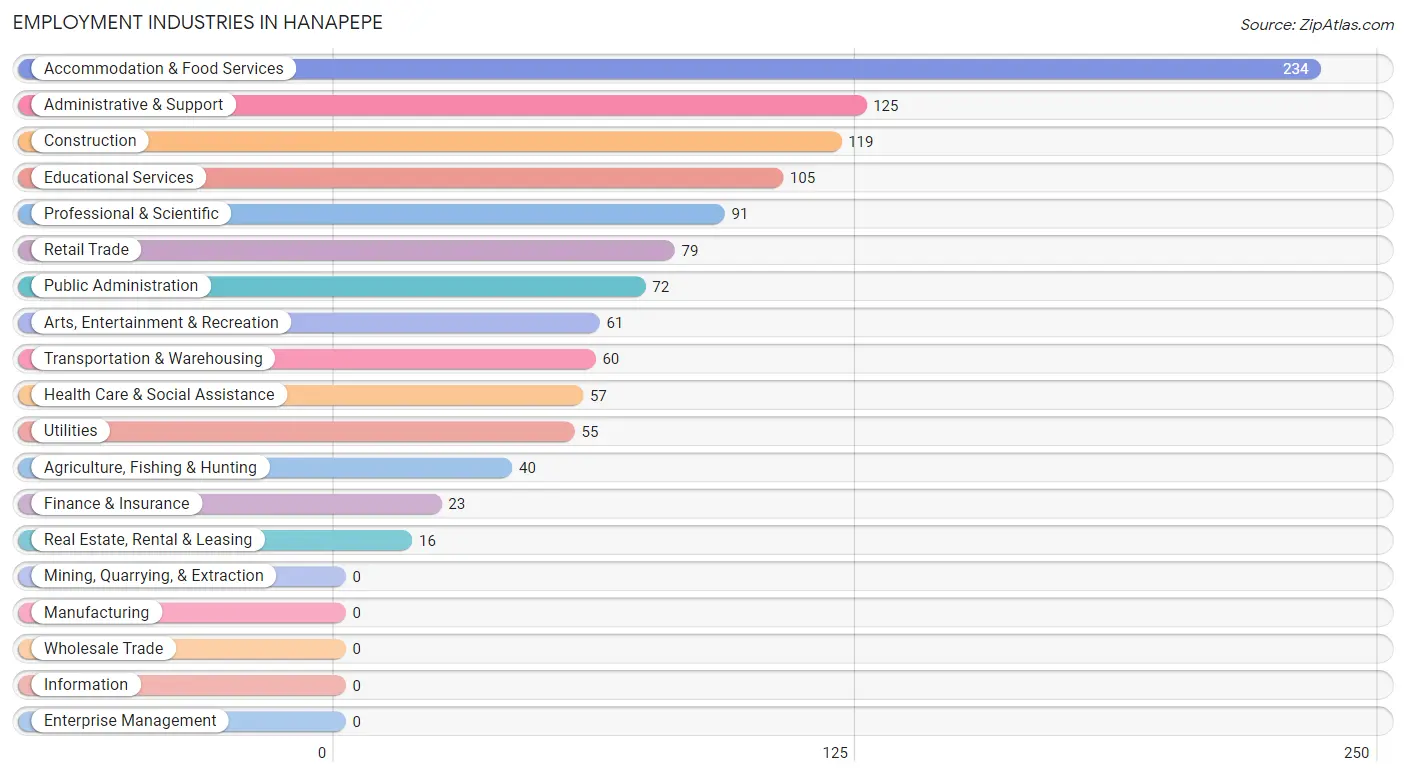
Employment Industries in Hanapepe
The major employment industries in Hanapepe include Accommodation & Food Services (234 | 18.6%), Administrative & Support (125 | 9.9%), Construction (119 | 9.4%), Educational Services (105 | 8.3%), and Professional & Scientific (91 | 7.2%).
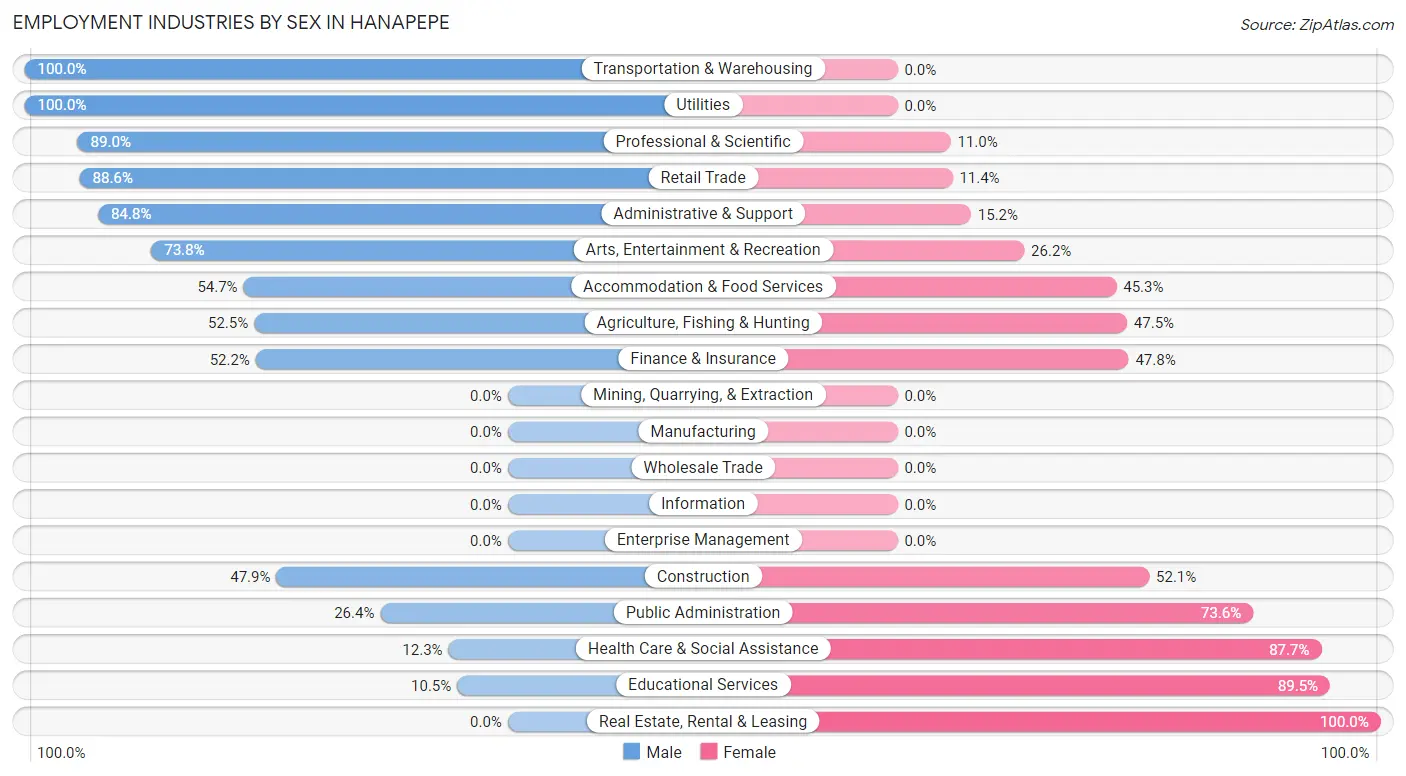
Employment Industries by Sex in Hanapepe
The Hanapepe industries that see more men than women are Transportation & Warehousing (100.0%), Utilities (100.0%), and Professional & Scientific (89.0%), whereas the industries that tend to have a higher number of women are Real Estate, Rental & Leasing (100.0%), Educational Services (89.5%), and Health Care & Social Assistance (87.7%).
| Industry | Male | Female |
| Agriculture, Fishing & Hunting | 21 (52.5%) | 19 (47.5%) |
| Mining, Quarrying, & Extraction | 0 (0.0%) | 0 (0.0%) |
| Construction | 57 (47.9%) | 62 (52.1%) |
| Manufacturing | 0 (0.0%) | 0 (0.0%) |
| Wholesale Trade | 0 (0.0%) | 0 (0.0%) |
| Retail Trade | 70 (88.6%) | 9 (11.4%) |
| Transportation & Warehousing | 60 (100.0%) | 0 (0.0%) |
| Utilities | 55 (100.0%) | 0 (0.0%) |
| Information | 0 (0.0%) | 0 (0.0%) |
| Finance & Insurance | 12 (52.2%) | 11 (47.8%) |
| Real Estate, Rental & Leasing | 0 (0.0%) | 16 (100.0%) |
| Professional & Scientific | 81 (89.0%) | 10 (11.0%) |
| Enterprise Management | 0 (0.0%) | 0 (0.0%) |
| Administrative & Support | 106 (84.8%) | 19 (15.2%) |
| Educational Services | 11 (10.5%) | 94 (89.5%) |
| Health Care & Social Assistance | 7 (12.3%) | 50 (87.7%) |
| Arts, Entertainment & Recreation | 45 (73.8%) | 16 (26.2%) |
| Accommodation & Food Services | 128 (54.7%) | 106 (45.3%) |
| Public Administration | 19 (26.4%) | 53 (73.6%) |
| Total | 712 (56.5%) | 549 (43.5%) |
Education in Hanapepe
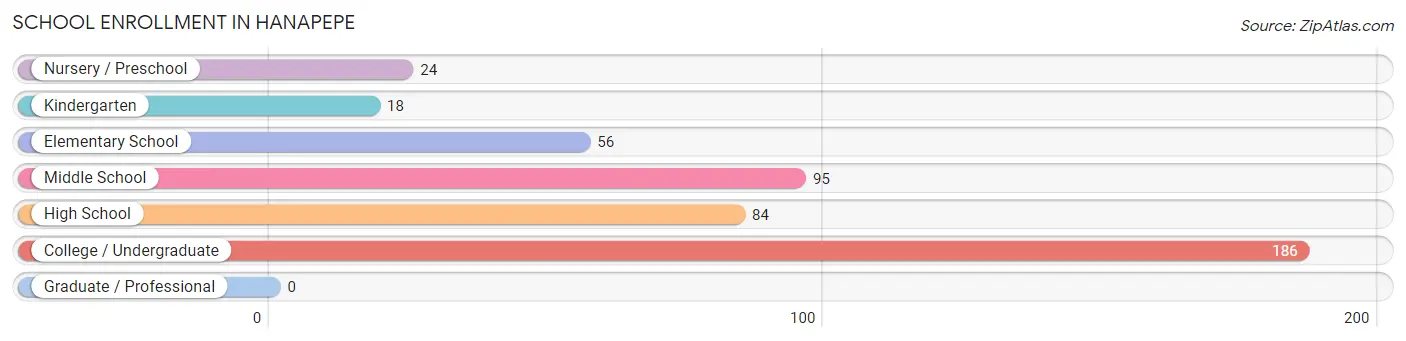
School Enrollment in Hanapepe
The most common levels of schooling among the 463 students in Hanapepe are college / undergraduate (186 | 40.2%), middle school (95 | 20.5%), and high school (84 | 18.1%).
| School Level | # Students | % Students |
| Nursery / Preschool | 24 | 5.2% |
| Kindergarten | 18 | 3.9% |
| Elementary School | 56 | 12.1% |
| Middle School | 95 | 20.5% |
| High School | 84 | 18.1% |
| College / Undergraduate | 186 | 40.2% |
| Graduate / Professional | 0 | 0.0% |
| Total | 463 | 100.0% |
School Enrollment by Age by Funding Source in Hanapepe
Out of a total of 463 students who are enrolled in schools in Hanapepe, 42 (9.1%) attend a private institution, while the remaining 421 (90.9%) are enrolled in public schools. The age group of 3 to 4 year olds has the highest likelihood of being enrolled in private schools, with 24 (100.0% in the age bracket) enrolled. Conversely, the age group of 10 to 14 year olds has the lowest likelihood of being enrolled in a private school, with 114 (100.0% in the age bracket) attending a public institution.
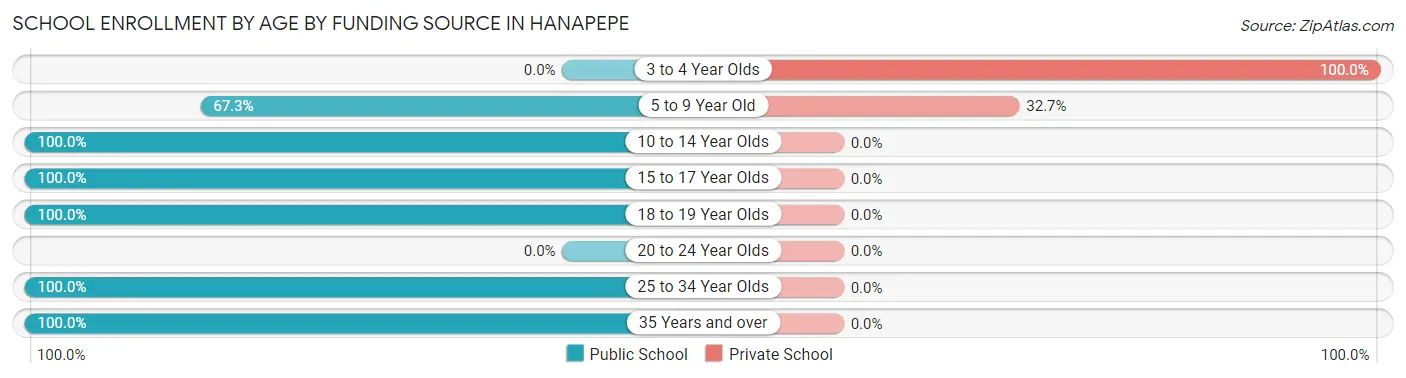
| Age Bracket | Public School | Private School |
| 3 to 4 Year Olds | 0 (0.0%) | 24 (100.0%) |
| 5 to 9 Year Old | 37 (67.3%) | 18 (32.7%) |
| 10 to 14 Year Olds | 114 (100.0%) | 0 (0.0%) |
| 15 to 17 Year Olds | 84 (100.0%) | 0 (0.0%) |
| 18 to 19 Year Olds | 23 (100.0%) | 0 (0.0%) |
| 20 to 24 Year Olds | 0 (0.0%) | 0 (0.0%) |
| 25 to 34 Year Olds | 137 (100.0%) | 0 (0.0%) |
| 35 Years and over | 26 (100.0%) | 0 (0.0%) |
| Total | 421 (90.9%) | 42 (9.1%) |
Educational Attainment by Field of Study in Hanapepe
Education (91 | 31.8%), social sciences (55 | 19.2%), arts & humanities (36 | 12.6%), engineering (24 | 8.4%), and multidisciplinary studies (20 | 7.0%) are the most common fields of study among 286 individuals in Hanapepe who have obtained a bachelor's degree or higher.
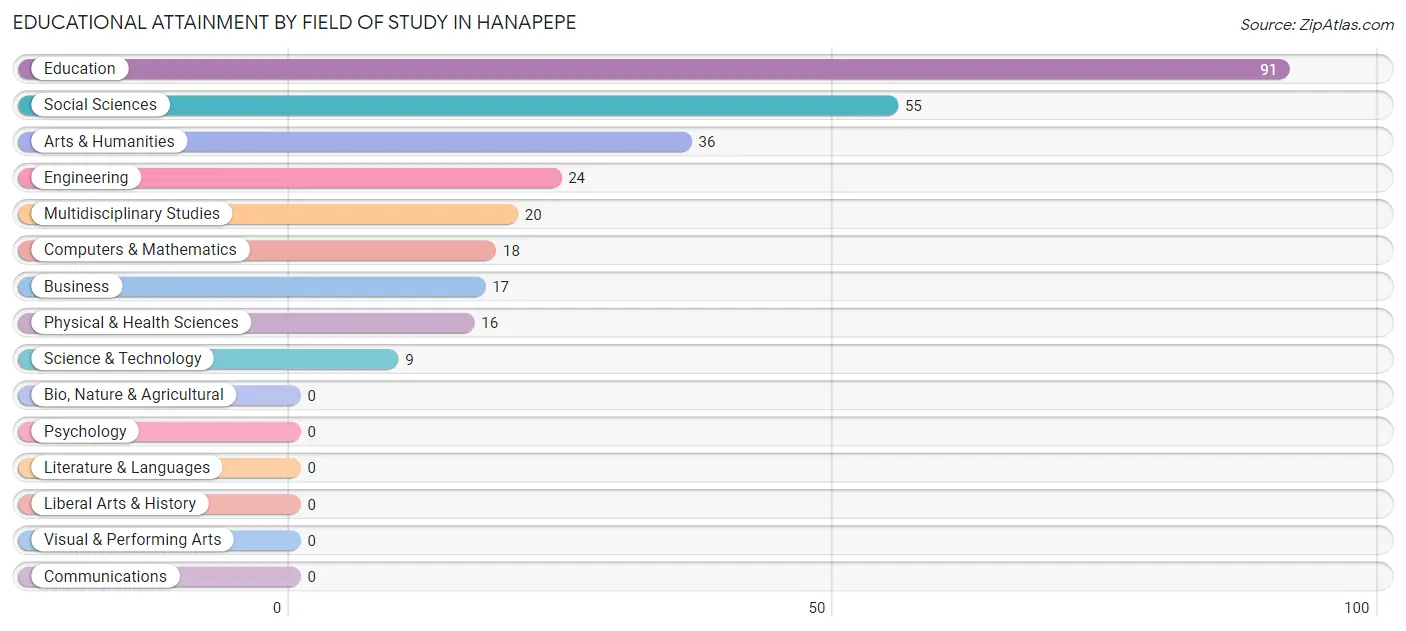
| Field of Study | # Graduates | % Graduates |
| Computers & Mathematics | 18 | 6.3% |
| Bio, Nature & Agricultural | 0 | 0.0% |
| Physical & Health Sciences | 16 | 5.6% |
| Psychology | 0 | 0.0% |
| Social Sciences | 55 | 19.2% |
| Engineering | 24 | 8.4% |
| Multidisciplinary Studies | 20 | 7.0% |
| Science & Technology | 9 | 3.2% |
| Business | 17 | 5.9% |
| Education | 91 | 31.8% |
| Literature & Languages | 0 | 0.0% |
| Liberal Arts & History | 0 | 0.0% |
| Visual & Performing Arts | 0 | 0.0% |
| Communications | 0 | 0.0% |
| Arts & Humanities | 36 | 12.6% |
| Total | 286 | 100.0% |
Transportation & Commute in Hanapepe
Vehicle Availability by Sex in Hanapepe
The most prevalent vehicle ownership categories in Hanapepe are males with 3 vehicles (170, accounting for 23.9%) and females with 3 vehicles (97, making up 33.0%).
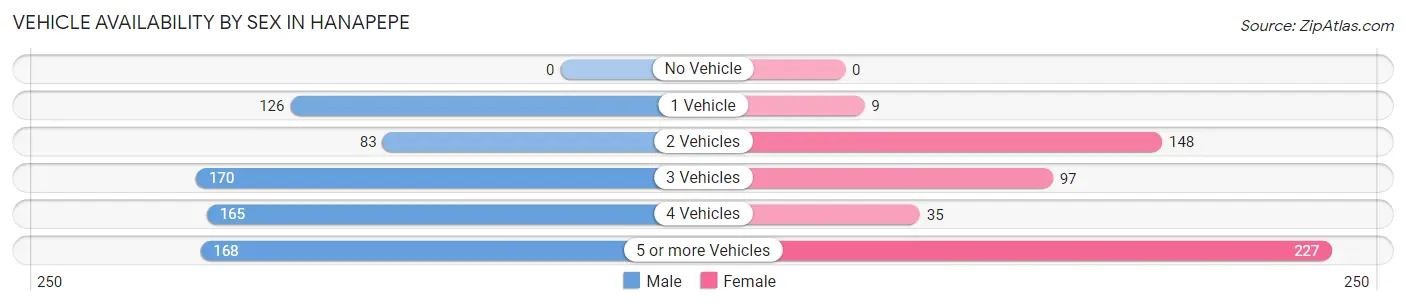
| Vehicles Available | Male | Female |
| No Vehicle | 0 (0.0%) | 0 (0.0%) |
| 1 Vehicle | 126 (17.7%) | 9 (1.7%) |
| 2 Vehicles | 83 (11.7%) | 148 (28.7%) |
| 3 Vehicles | 170 (23.9%) | 97 (18.8%) |
| 4 Vehicles | 165 (23.2%) | 35 (6.8%) |
| 5 or more Vehicles | 168 (23.6%) | 227 (44.0%) |
| Total | 712 (100.0%) | 516 (100.0%) |
Commute Time in Hanapepe
The most frequently occuring commute durations in Hanapepe are 30 to 34 minutes (388 commuters, 31.9%), 5 to 9 minutes (208 commuters, 17.1%), and 15 to 19 minutes (166 commuters, 13.6%).
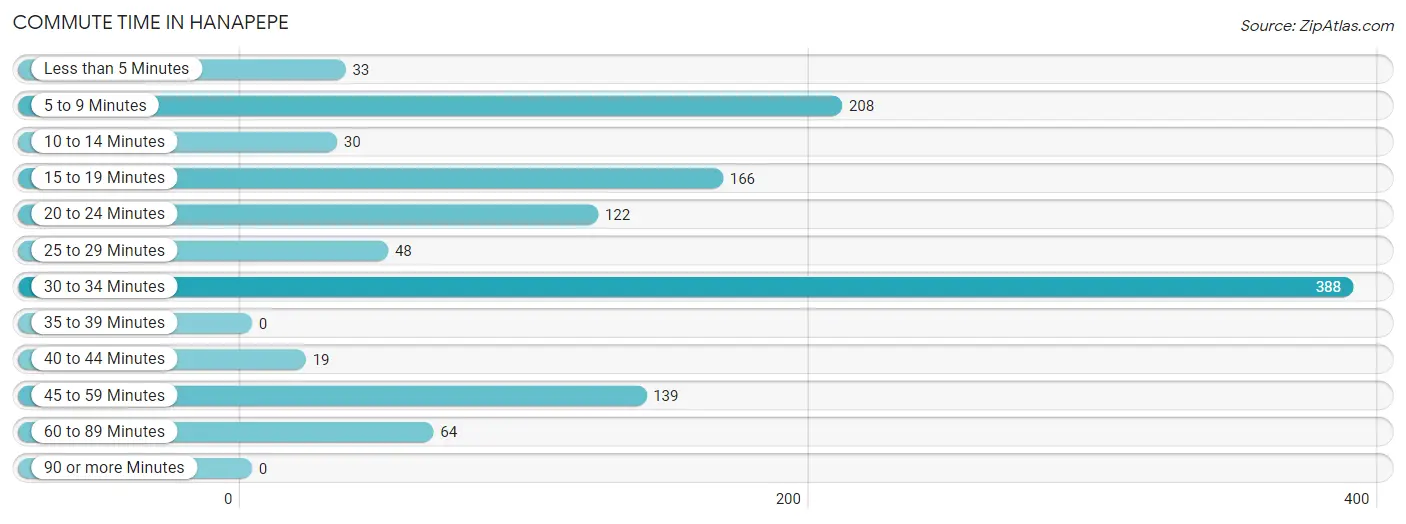
| Commute Time | # Commuters | % Commuters |
| Less than 5 Minutes | 33 | 2.7% |
| 5 to 9 Minutes | 208 | 17.1% |
| 10 to 14 Minutes | 30 | 2.5% |
| 15 to 19 Minutes | 166 | 13.6% |
| 20 to 24 Minutes | 122 | 10.0% |
| 25 to 29 Minutes | 48 | 3.9% |
| 30 to 34 Minutes | 388 | 31.9% |
| 35 to 39 Minutes | 0 | 0.0% |
| 40 to 44 Minutes | 19 | 1.6% |
| 45 to 59 Minutes | 139 | 11.4% |
| 60 to 89 Minutes | 64 | 5.3% |
| 90 or more Minutes | 0 | 0.0% |
Commute Time by Sex in Hanapepe
The most common commute times in Hanapepe are 30 to 34 minutes (289 commuters, 41.2%) for males and 5 to 9 minutes (146 commuters, 28.3%) for females.
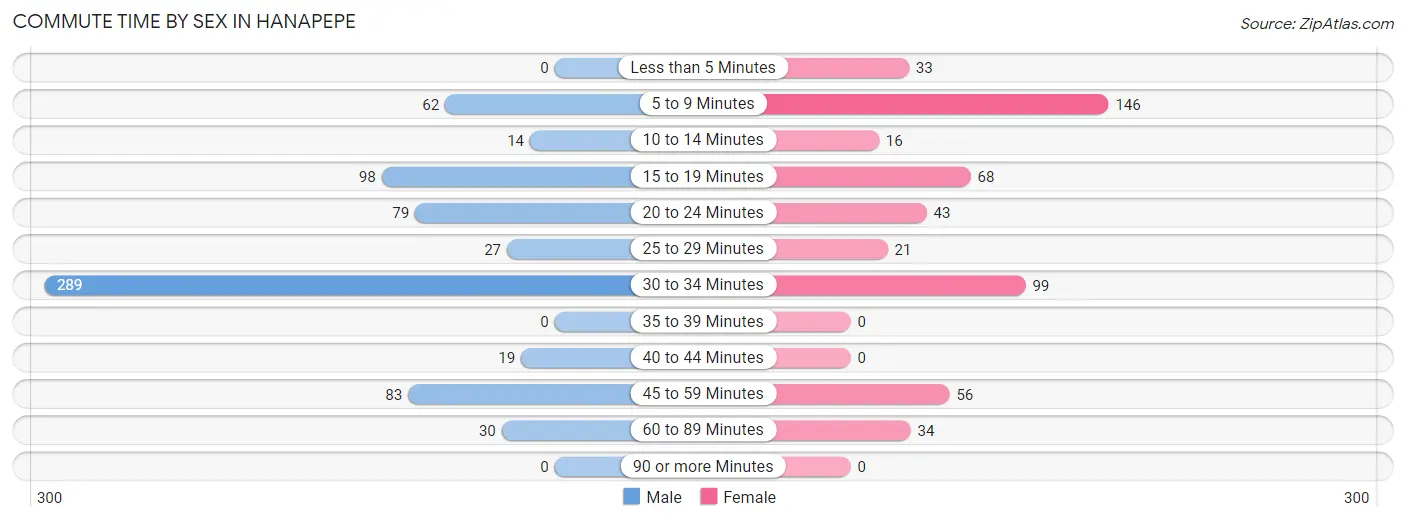
| Commute Time | Male | Female |
| Less than 5 Minutes | 0 (0.0%) | 33 (6.4%) |
| 5 to 9 Minutes | 62 (8.8%) | 146 (28.3%) |
| 10 to 14 Minutes | 14 (2.0%) | 16 (3.1%) |
| 15 to 19 Minutes | 98 (14.0%) | 68 (13.2%) |
| 20 to 24 Minutes | 79 (11.3%) | 43 (8.3%) |
| 25 to 29 Minutes | 27 (3.8%) | 21 (4.1%) |
| 30 to 34 Minutes | 289 (41.2%) | 99 (19.2%) |
| 35 to 39 Minutes | 0 (0.0%) | 0 (0.0%) |
| 40 to 44 Minutes | 19 (2.7%) | 0 (0.0%) |
| 45 to 59 Minutes | 83 (11.8%) | 56 (10.8%) |
| 60 to 89 Minutes | 30 (4.3%) | 34 (6.6%) |
| 90 or more Minutes | 0 (0.0%) | 0 (0.0%) |
Time of Departure to Work by Sex in Hanapepe
The most frequent times of departure to work in Hanapepe are 6:00 AM to 6:29 AM (168, 24.0%) for males and 6:30 AM to 6:59 AM (123, 23.8%) for females.
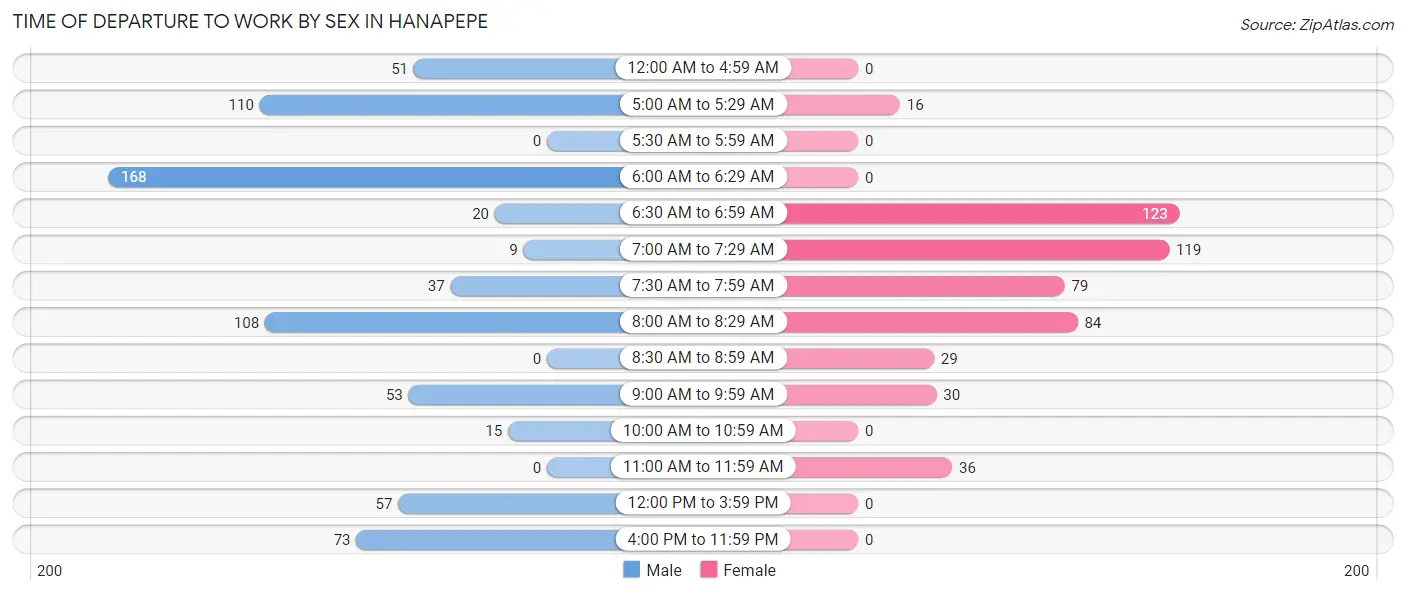
| Time of Departure | Male | Female |
| 12:00 AM to 4:59 AM | 51 (7.3%) | 0 (0.0%) |
| 5:00 AM to 5:29 AM | 110 (15.7%) | 16 (3.1%) |
| 5:30 AM to 5:59 AM | 0 (0.0%) | 0 (0.0%) |
| 6:00 AM to 6:29 AM | 168 (24.0%) | 0 (0.0%) |
| 6:30 AM to 6:59 AM | 20 (2.9%) | 123 (23.8%) |
| 7:00 AM to 7:29 AM | 9 (1.3%) | 119 (23.1%) |
| 7:30 AM to 7:59 AM | 37 (5.3%) | 79 (15.3%) |
| 8:00 AM to 8:29 AM | 108 (15.4%) | 84 (16.3%) |
| 8:30 AM to 8:59 AM | 0 (0.0%) | 29 (5.6%) |
| 9:00 AM to 9:59 AM | 53 (7.6%) | 30 (5.8%) |
| 10:00 AM to 10:59 AM | 15 (2.1%) | 0 (0.0%) |
| 11:00 AM to 11:59 AM | 0 (0.0%) | 36 (7.0%) |
| 12:00 PM to 3:59 PM | 57 (8.1%) | 0 (0.0%) |
| 4:00 PM to 11:59 PM | 73 (10.4%) | 0 (0.0%) |
| Total | 701 (100.0%) | 516 (100.0%) |
Housing Occupancy in Hanapepe
Occupancy by Ownership in Hanapepe
Of the total 698 dwellings in Hanapepe, owner-occupied units account for 504 (72.2%), while renter-occupied units make up 194 (27.8%).
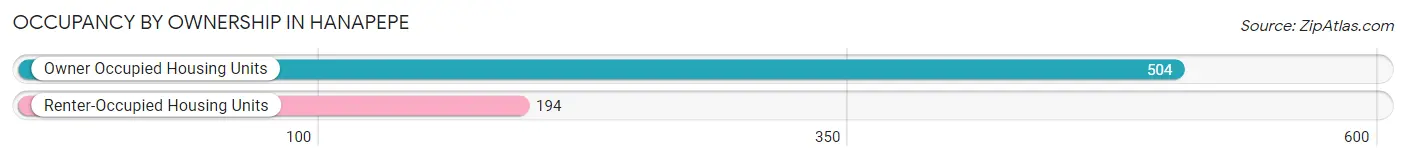
| Occupancy | # Housing Units | % Housing Units |
| Owner Occupied Housing Units | 504 | 72.2% |
| Renter-Occupied Housing Units | 194 | 27.8% |
| Total Occupied Housing Units | 698 | 100.0% |
Occupancy by Household Size in Hanapepe
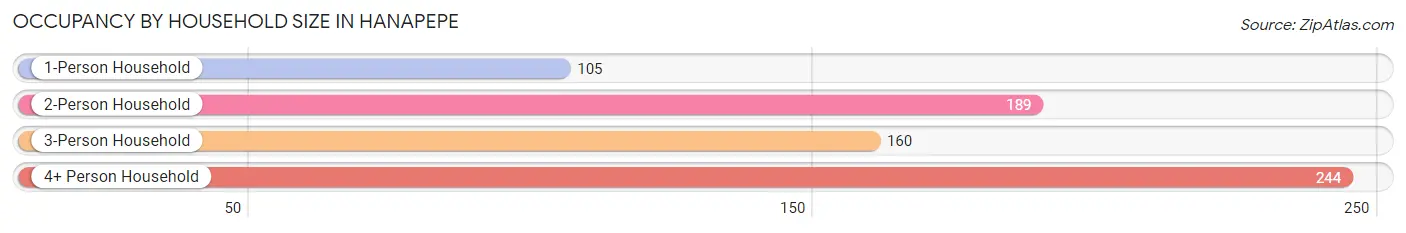
| Household Size | # Housing Units | % Housing Units |
| 1-Person Household | 105 | 15.0% |
| 2-Person Household | 189 | 27.1% |
| 3-Person Household | 160 | 22.9% |
| 4+ Person Household | 244 | 35.0% |
| Total Housing Units | 698 | 100.0% |
Occupancy by Ownership by Household Size in Hanapepe
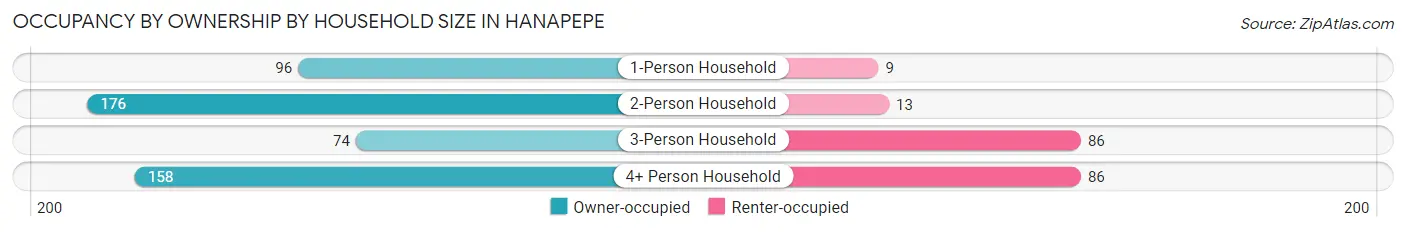
| Household Size | Owner-occupied | Renter-occupied |
| 1-Person Household | 96 (91.4%) | 9 (8.6%) |
| 2-Person Household | 176 (93.1%) | 13 (6.9%) |
| 3-Person Household | 74 (46.3%) | 86 (53.7%) |
| 4+ Person Household | 158 (64.7%) | 86 (35.2%) |
| Total Housing Units | 504 (72.2%) | 194 (27.8%) |
Occupancy by Educational Attainment in Hanapepe
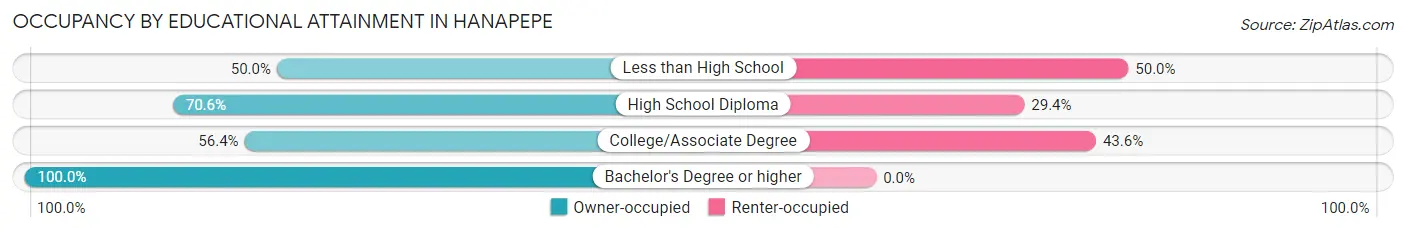
| Household Size | Owner-occupied | Renter-occupied |
| Less than High School | 17 (50.0%) | 17 (50.0%) |
| High School Diploma | 238 (70.6%) | 99 (29.4%) |
| College/Associate Degree | 101 (56.4%) | 78 (43.6%) |
| Bachelor's Degree or higher | 148 (100.0%) | 0 (0.0%) |
Occupancy by Age of Householder in Hanapepe
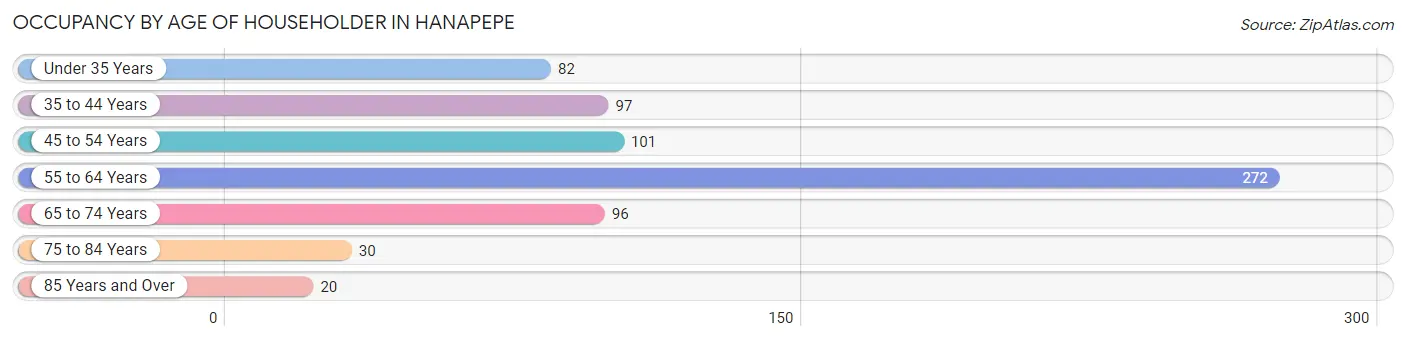
| Age Bracket | # Households | % Households |
| Under 35 Years | 82 | 11.7% |
| 35 to 44 Years | 97 | 13.9% |
| 45 to 54 Years | 101 | 14.5% |
| 55 to 64 Years | 272 | 39.0% |
| 65 to 74 Years | 96 | 13.8% |
| 75 to 84 Years | 30 | 4.3% |
| 85 Years and Over | 20 | 2.9% |
| Total | 698 | 100.0% |
Housing Finances in Hanapepe
Median Income by Occupancy in Hanapepe
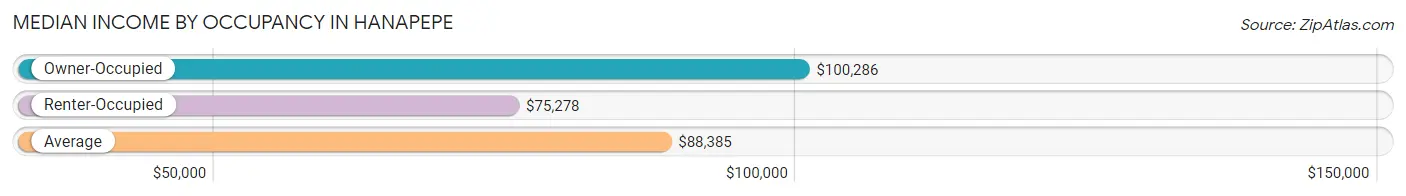
| Occupancy Type | # Households | Median Income |
| Owner-Occupied | 504 (72.2%) | $100,286 |
| Renter-Occupied | 194 (27.8%) | $75,278 |
| Average | 698 (100.0%) | $88,385 |
Occupancy by Householder Income Bracket in Hanapepe
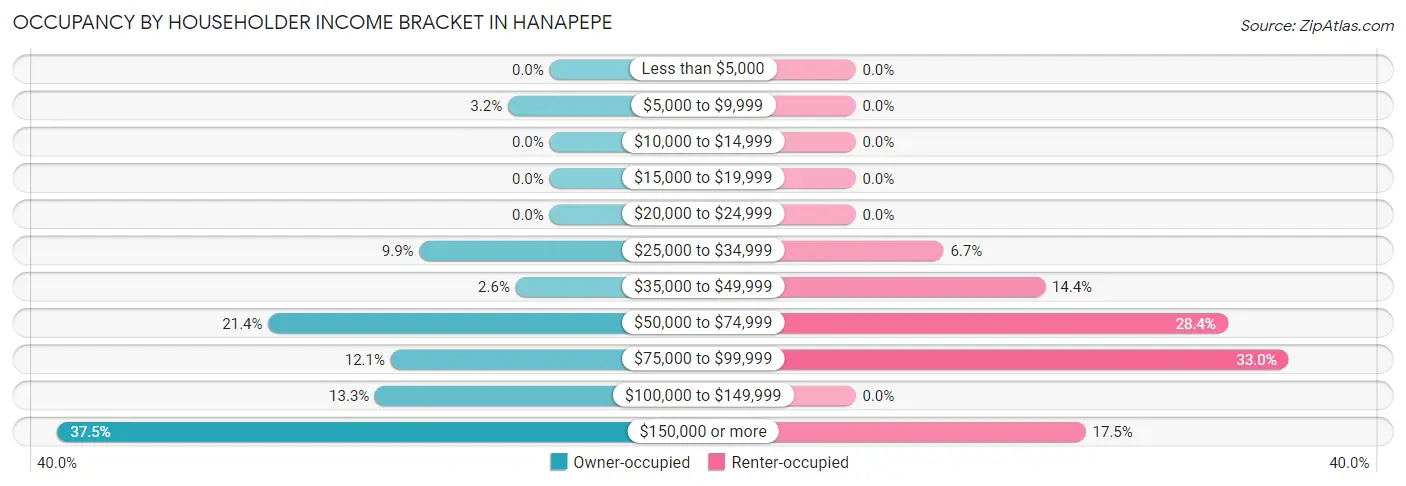
| Income Bracket | Owner-occupied | Renter-occupied |
| Less than $5,000 | 0 (0.0%) | 0 (0.0%) |
| $5,000 to $9,999 | 16 (3.2%) | 0 (0.0%) |
| $10,000 to $14,999 | 0 (0.0%) | 0 (0.0%) |
| $15,000 to $19,999 | 0 (0.0%) | 0 (0.0%) |
| $20,000 to $24,999 | 0 (0.0%) | 0 (0.0%) |
| $25,000 to $34,999 | 50 (9.9%) | 13 (6.7%) |
| $35,000 to $49,999 | 13 (2.6%) | 28 (14.4%) |
| $50,000 to $74,999 | 108 (21.4%) | 55 (28.3%) |
| $75,000 to $99,999 | 61 (12.1%) | 64 (33.0%) |
| $100,000 to $149,999 | 67 (13.3%) | 0 (0.0%) |
| $150,000 or more | 189 (37.5%) | 34 (17.5%) |
| Total | 504 (100.0%) | 194 (100.0%) |
Monthly Housing Cost Tiers in Hanapepe
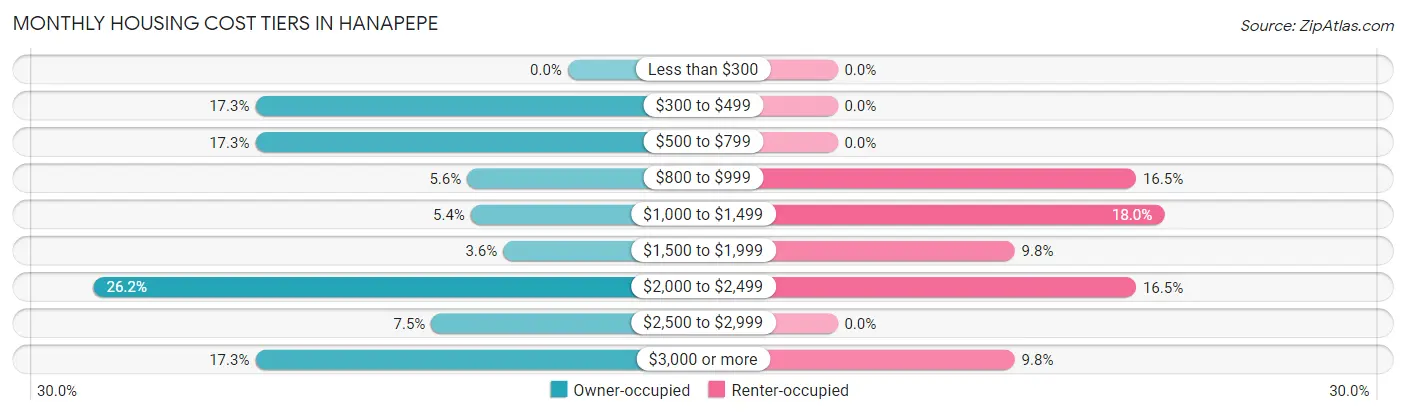
| Monthly Cost | Owner-occupied | Renter-occupied |
| Less than $300 | 0 (0.0%) | 0 (0.0%) |
| $300 to $499 | 87 (17.3%) | 0 (0.0%) |
| $500 to $799 | 87 (17.3%) | 0 (0.0%) |
| $800 to $999 | 28 (5.6%) | 32 (16.5%) |
| $1,000 to $1,499 | 27 (5.4%) | 35 (18.0%) |
| $1,500 to $1,999 | 18 (3.6%) | 19 (9.8%) |
| $2,000 to $2,499 | 132 (26.2%) | 32 (16.5%) |
| $2,500 to $2,999 | 38 (7.5%) | 0 (0.0%) |
| $3,000 or more | 87 (17.3%) | 19 (9.8%) |
| Total | 504 (100.0%) | 194 (100.0%) |
Physical Housing Characteristics in Hanapepe
Housing Structures in Hanapepe
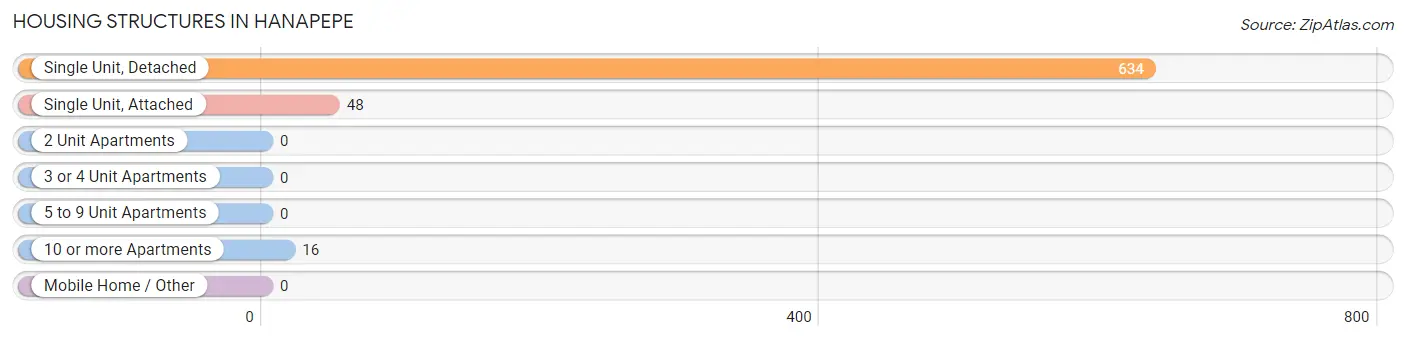
| Structure Type | # Housing Units | % Housing Units |
| Single Unit, Detached | 634 | 90.8% |
| Single Unit, Attached | 48 | 6.9% |
| 2 Unit Apartments | 0 | 0.0% |
| 3 or 4 Unit Apartments | 0 | 0.0% |
| 5 to 9 Unit Apartments | 0 | 0.0% |
| 10 or more Apartments | 16 | 2.3% |
| Mobile Home / Other | 0 | 0.0% |
| Total | 698 | 100.0% |
Housing Structures by Occupancy in Hanapepe
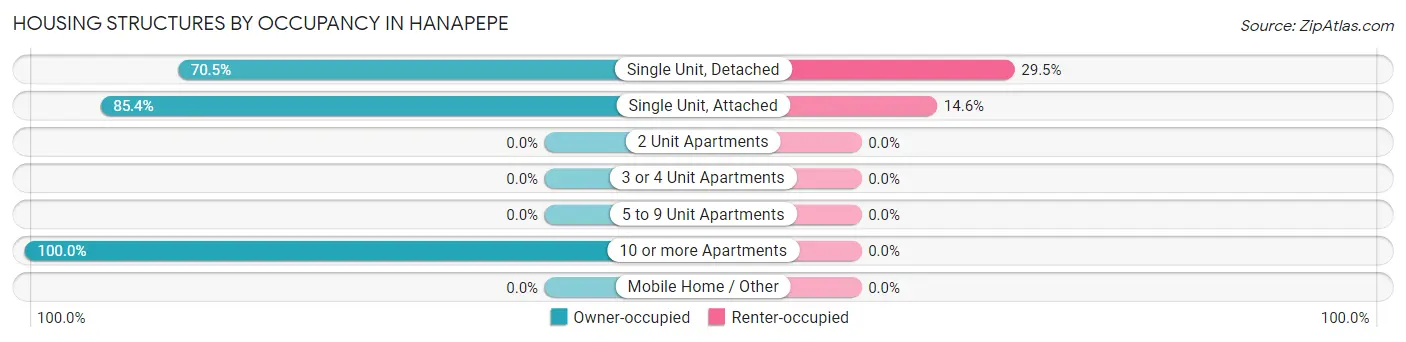
| Structure Type | Owner-occupied | Renter-occupied |
| Single Unit, Detached | 447 (70.5%) | 187 (29.5%) |
| Single Unit, Attached | 41 (85.4%) | 7 (14.6%) |
| 2 Unit Apartments | 0 (0.0%) | 0 (0.0%) |
| 3 or 4 Unit Apartments | 0 (0.0%) | 0 (0.0%) |
| 5 to 9 Unit Apartments | 0 (0.0%) | 0 (0.0%) |
| 10 or more Apartments | 16 (100.0%) | 0 (0.0%) |
| Mobile Home / Other | 0 (0.0%) | 0 (0.0%) |
| Total | 504 (72.2%) | 194 (27.8%) |
Housing Structures by Number of Rooms in Hanapepe
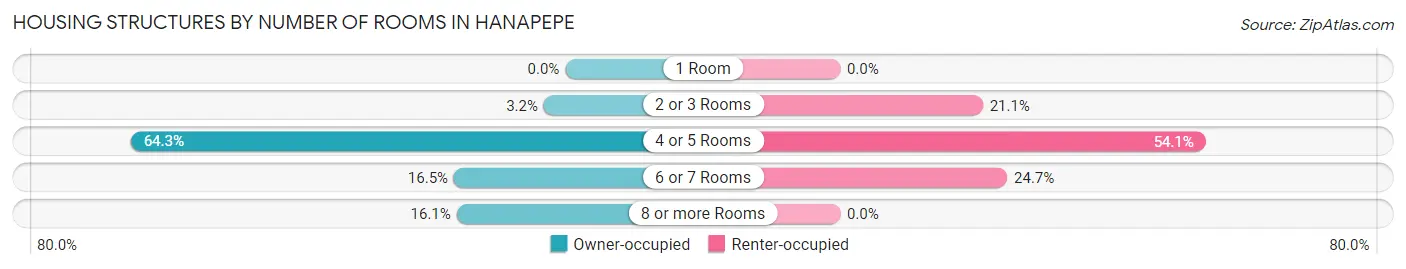
| Number of Rooms | Owner-occupied | Renter-occupied |
| 1 Room | 0 (0.0%) | 0 (0.0%) |
| 2 or 3 Rooms | 16 (3.2%) | 41 (21.1%) |
| 4 or 5 Rooms | 324 (64.3%) | 105 (54.1%) |
| 6 or 7 Rooms | 83 (16.5%) | 48 (24.7%) |
| 8 or more Rooms | 81 (16.1%) | 0 (0.0%) |
| Total | 504 (100.0%) | 194 (100.0%) |
Housing Structure by Heating Type in Hanapepe
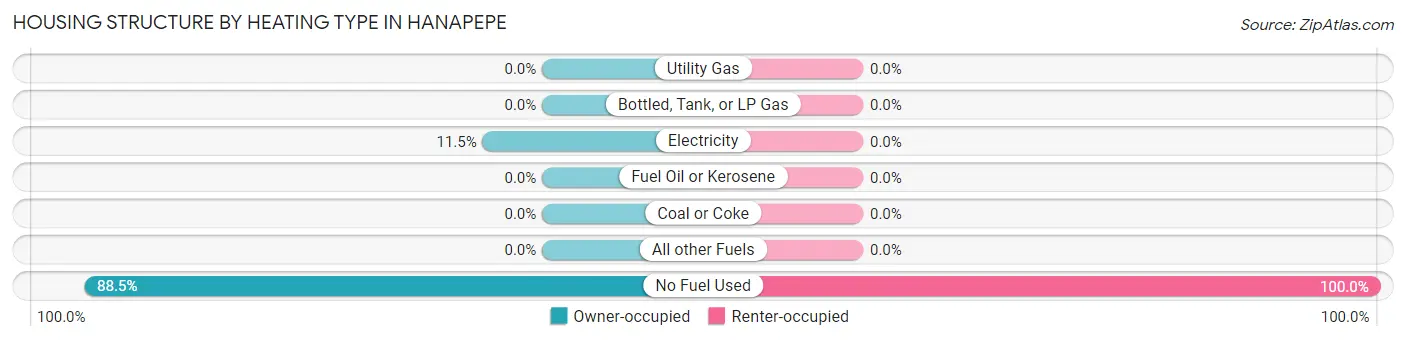
| Heating Type | Owner-occupied | Renter-occupied |
| Utility Gas | 0 (0.0%) | 0 (0.0%) |
| Bottled, Tank, or LP Gas | 0 (0.0%) | 0 (0.0%) |
| Electricity | 58 (11.5%) | 0 (0.0%) |
| Fuel Oil or Kerosene | 0 (0.0%) | 0 (0.0%) |
| Coal or Coke | 0 (0.0%) | 0 (0.0%) |
| All other Fuels | 0 (0.0%) | 0 (0.0%) |
| No Fuel Used | 446 (88.5%) | 194 (100.0%) |
| Total | 504 (100.0%) | 194 (100.0%) |
Household Vehicle Usage in Hanapepe
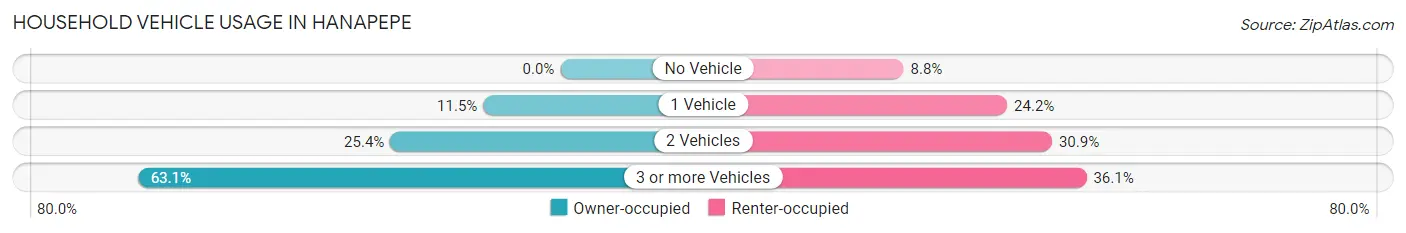
| Vehicles per Household | Owner-occupied | Renter-occupied |
| No Vehicle | 0 (0.0%) | 17 (8.8%) |
| 1 Vehicle | 58 (11.5%) | 47 (24.2%) |
| 2 Vehicles | 128 (25.4%) | 60 (30.9%) |
| 3 or more Vehicles | 318 (63.1%) | 70 (36.1%) |
| Total | 504 (100.0%) | 194 (100.0%) |
Real Estate & Mortgages in Hanapepe
Real Estate and Mortgage Overview in Hanapepe
| Characteristic | Without Mortgage | With Mortgage |
| Housing Units | 167 | 337 |
| Median Property Value | $684,700 | $637,400 |
| Median Household Income | - | - |
| Monthly Housing Costs | $495 | $87 |
| Real Estate Taxes | $1,380 | $37 |
Property Value by Mortgage Status in Hanapepe
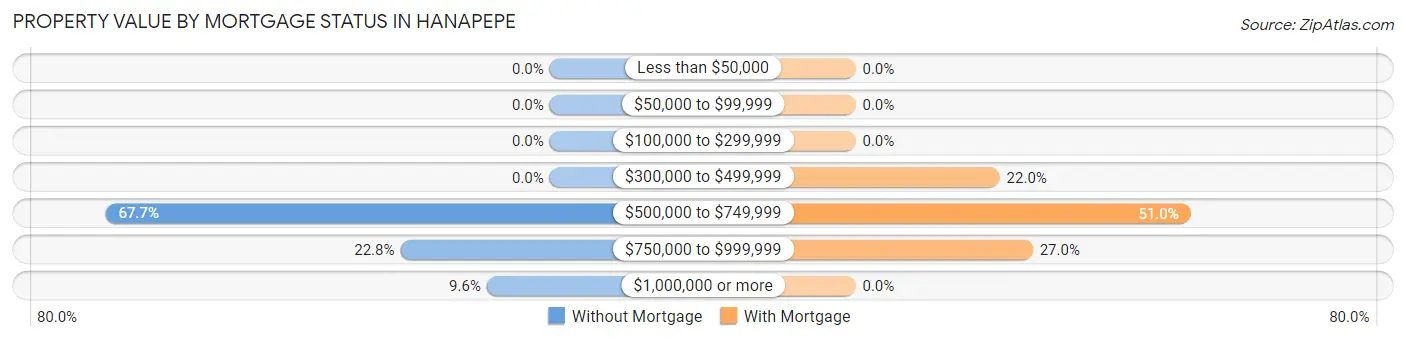
| Property Value | Without Mortgage | With Mortgage |
| Less than $50,000 | 0 (0.0%) | 0 (0.0%) |
| $50,000 to $99,999 | 0 (0.0%) | 0 (0.0%) |
| $100,000 to $299,999 | 0 (0.0%) | 0 (0.0%) |
| $300,000 to $499,999 | 0 (0.0%) | 74 (22.0%) |
| $500,000 to $749,999 | 113 (67.7%) | 172 (51.0%) |
| $750,000 to $999,999 | 38 (22.8%) | 91 (27.0%) |
| $1,000,000 or more | 16 (9.6%) | 0 (0.0%) |
| Total | 167 (100.0%) | 337 (100.0%) |
Household Income by Mortgage Status in Hanapepe
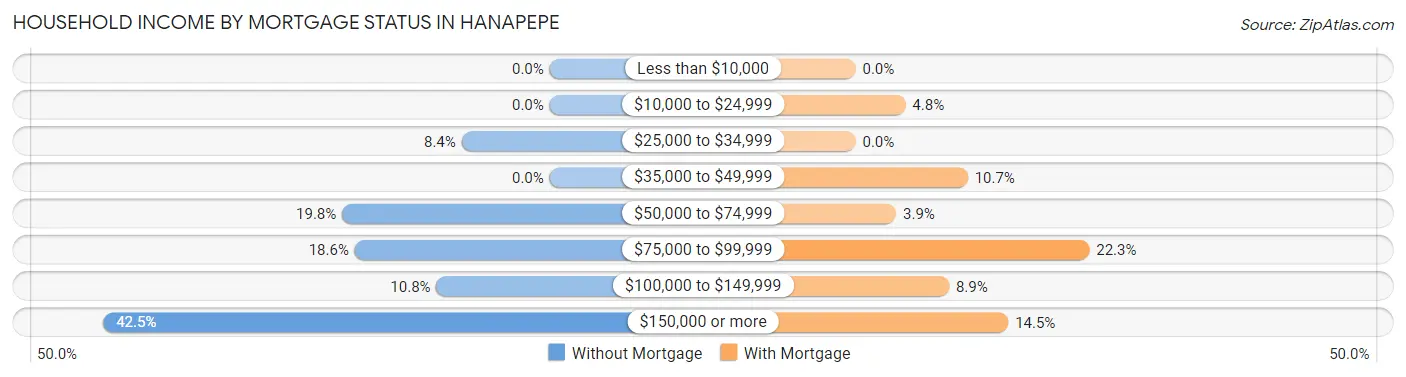
| Household Income | Without Mortgage | With Mortgage |
| Less than $10,000 | 0 (0.0%) | 0 (0.0%) |
| $10,000 to $24,999 | 0 (0.0%) | 16 (4.8%) |
| $25,000 to $34,999 | 14 (8.4%) | 0 (0.0%) |
| $35,000 to $49,999 | 0 (0.0%) | 36 (10.7%) |
| $50,000 to $74,999 | 33 (19.8%) | 13 (3.9%) |
| $75,000 to $99,999 | 31 (18.6%) | 75 (22.3%) |
| $100,000 to $149,999 | 18 (10.8%) | 30 (8.9%) |
| $150,000 or more | 71 (42.5%) | 49 (14.5%) |
| Total | 167 (100.0%) | 337 (100.0%) |
Property Value to Household Income Ratio in Hanapepe
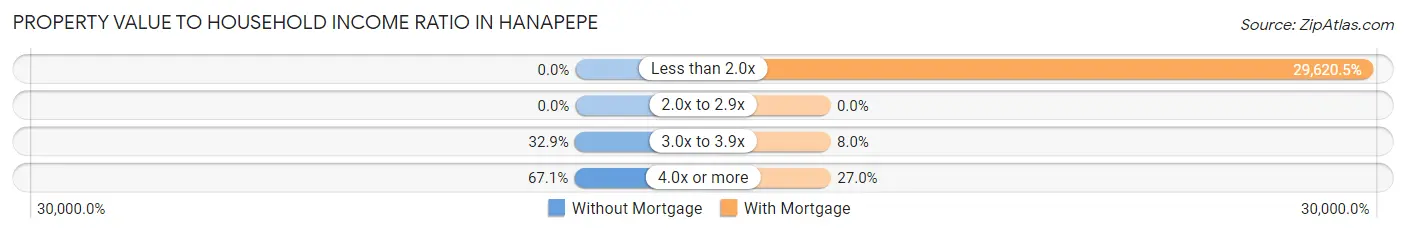
| Value-to-Income Ratio | Without Mortgage | With Mortgage |
| Less than 2.0x | 0 (0.0%) | 99,821 (29,620.5%) |
| 2.0x to 2.9x | 0 (0.0%) | 0 (0.0%) |
| 3.0x to 3.9x | 55 (32.9%) | 27 (8.0%) |
| 4.0x or more | 112 (67.1%) | 91 (27.0%) |
| Total | 167 (100.0%) | 337 (100.0%) |
Real Estate Taxes by Mortgage Status in Hanapepe
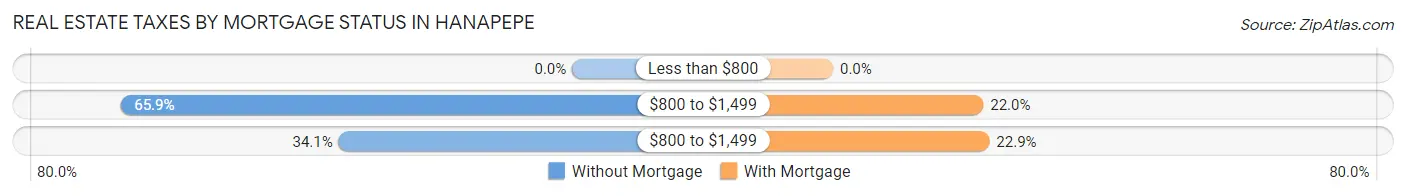
| Property Taxes | Without Mortgage | With Mortgage |
| Less than $800 | 0 (0.0%) | 0 (0.0%) |
| $800 to $1,499 | 110 (65.9%) | 74 (22.0%) |
| $800 to $1,499 | 57 (34.1%) | 77 (22.9%) |
| Total | 167 (100.0%) | 337 (100.0%) |
Health & Disability in Hanapepe
Health Insurance Coverage by Age in Hanapepe
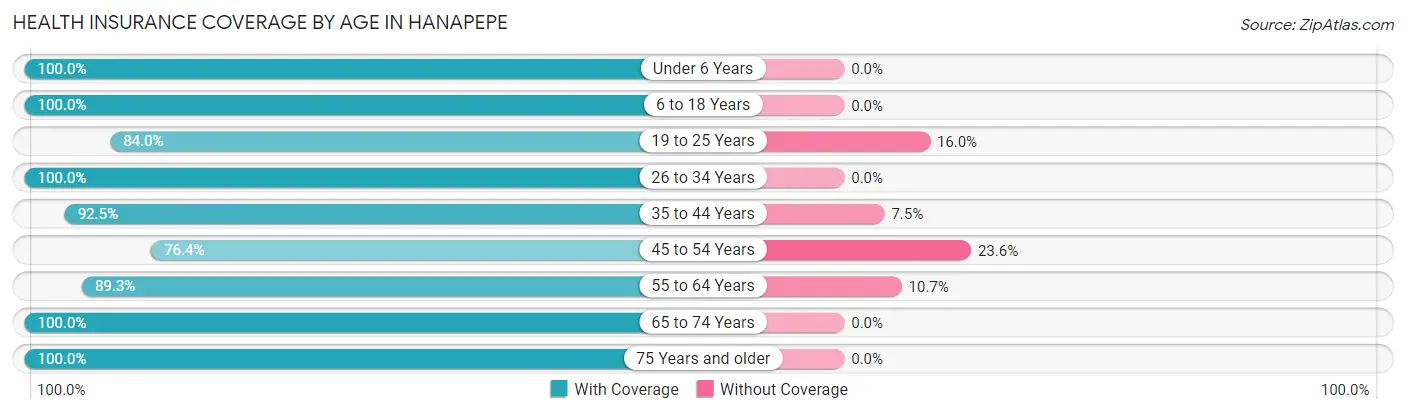
| Age Bracket | With Coverage | Without Coverage |
| Under 6 Years | 85 (100.0%) | 0 (0.0%) |
| 6 to 18 Years | 235 (100.0%) | 0 (0.0%) |
| 19 to 25 Years | 100 (84.0%) | 19 (16.0%) |
| 26 to 34 Years | 492 (100.0%) | 0 (0.0%) |
| 35 to 44 Years | 309 (92.5%) | 25 (7.5%) |
| 45 to 54 Years | 194 (76.4%) | 60 (23.6%) |
| 55 to 64 Years | 292 (89.3%) | 35 (10.7%) |
| 65 to 74 Years | 169 (100.0%) | 0 (0.0%) |
| 75 Years and older | 227 (100.0%) | 0 (0.0%) |
| Total | 2,103 (93.8%) | 139 (6.2%) |
Health Insurance Coverage by Citizenship Status in Hanapepe
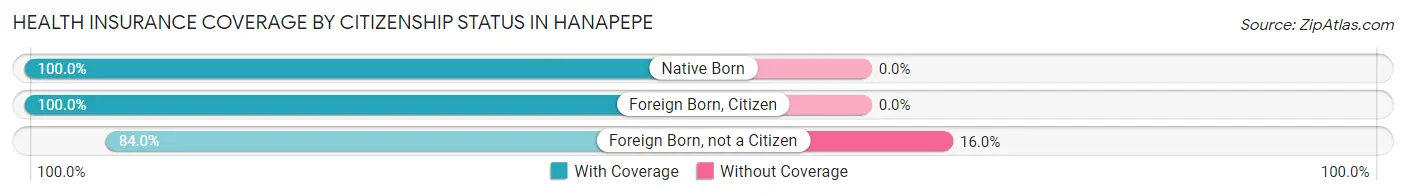
| Citizenship Status | With Coverage | Without Coverage |
| Native Born | 85 (100.0%) | 0 (0.0%) |
| Foreign Born, Citizen | 235 (100.0%) | 0 (0.0%) |
| Foreign Born, not a Citizen | 100 (84.0%) | 19 (16.0%) |
Health Insurance Coverage by Household Income in Hanapepe
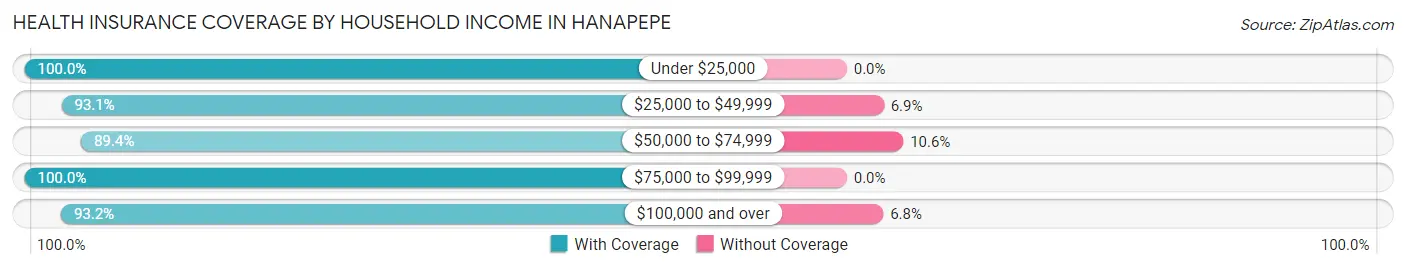
| Household Income | With Coverage | Without Coverage |
| Under $25,000 | 36 (100.0%) | 0 (0.0%) |
| $25,000 to $49,999 | 256 (93.1%) | 19 (6.9%) |
| $50,000 to $74,999 | 347 (89.4%) | 41 (10.6%) |
| $75,000 to $99,999 | 384 (100.0%) | 0 (0.0%) |
| $100,000 and over | 1,080 (93.2%) | 79 (6.8%) |
Public vs Private Health Insurance Coverage by Age in Hanapepe
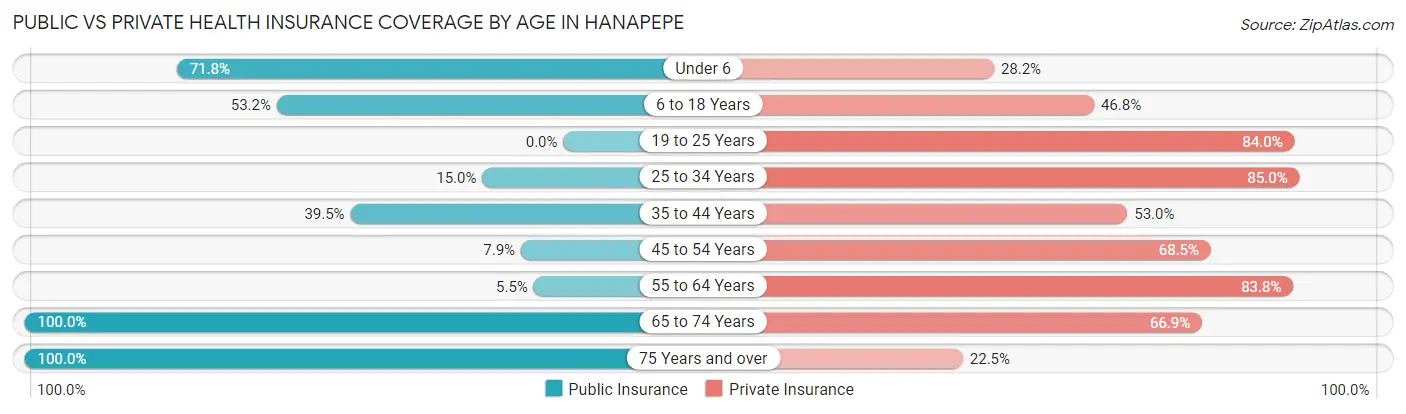
| Age Bracket | Public Insurance | Private Insurance |
| Under 6 | 61 (71.8%) | 24 (28.2%) |
| 6 to 18 Years | 125 (53.2%) | 110 (46.8%) |
| 19 to 25 Years | 0 (0.0%) | 100 (84.0%) |
| 25 to 34 Years | 74 (15.0%) | 418 (85.0%) |
| 35 to 44 Years | 132 (39.5%) | 177 (53.0%) |
| 45 to 54 Years | 20 (7.9%) | 174 (68.5%) |
| 55 to 64 Years | 18 (5.5%) | 274 (83.8%) |
| 65 to 74 Years | 169 (100.0%) | 113 (66.9%) |
| 75 Years and over | 227 (100.0%) | 51 (22.5%) |
| Total | 826 (36.8%) | 1,441 (64.3%) |
Disability Status by Sex by Age in Hanapepe
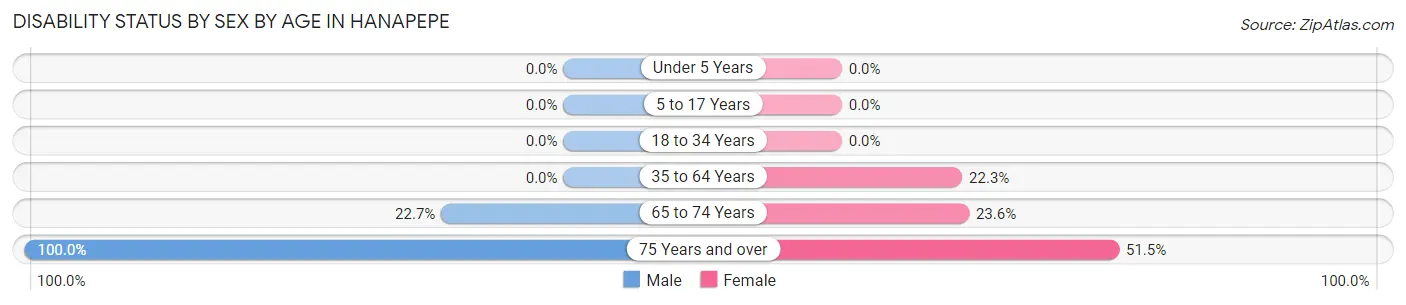
| Age Bracket | Male | Female |
| Under 5 Years | 0 (0.0%) | 0 (0.0%) |
| 5 to 17 Years | 0 (0.0%) | 0 (0.0%) |
| 18 to 34 Years | 0 (0.0%) | 0 (0.0%) |
| 35 to 64 Years | 0 (0.0%) | 82 (22.3%) |
| 65 to 74 Years | 22 (22.7%) | 17 (23.6%) |
| 75 Years and over | 124 (100.0%) | 53 (51.5%) |
Disability Class by Sex by Age in Hanapepe
Disability Class: Hearing Difficulty
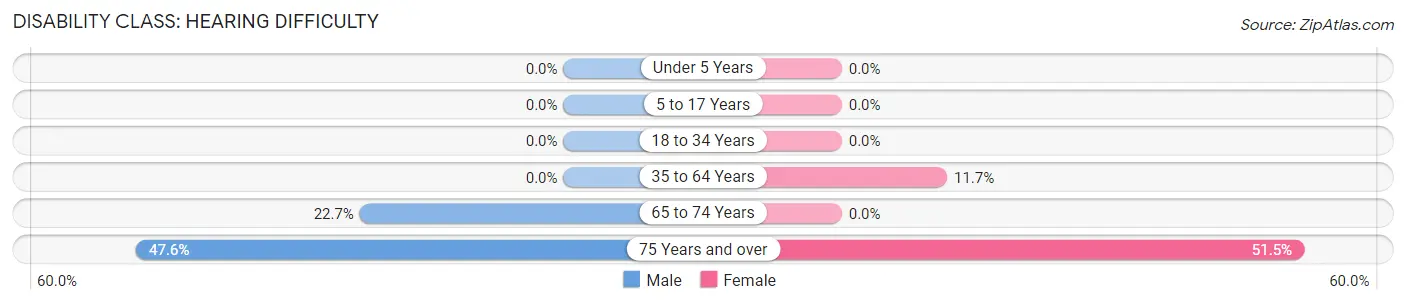
| Age Bracket | Male | Female |
| Under 5 Years | 0 (0.0%) | 0 (0.0%) |
| 5 to 17 Years | 0 (0.0%) | 0 (0.0%) |
| 18 to 34 Years | 0 (0.0%) | 0 (0.0%) |
| 35 to 64 Years | 0 (0.0%) | 43 (11.7%) |
| 65 to 74 Years | 22 (22.7%) | 0 (0.0%) |
| 75 Years and over | 59 (47.6%) | 53 (51.5%) |
Disability Class: Vision Difficulty
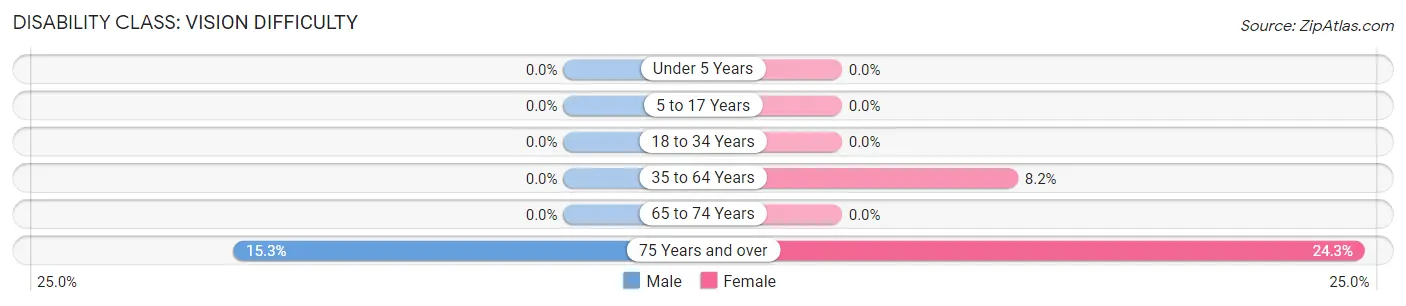
| Age Bracket | Male | Female |
| Under 5 Years | 0 (0.0%) | 0 (0.0%) |
| 5 to 17 Years | 0 (0.0%) | 0 (0.0%) |
| 18 to 34 Years | 0 (0.0%) | 0 (0.0%) |
| 35 to 64 Years | 0 (0.0%) | 30 (8.2%) |
| 65 to 74 Years | 0 (0.0%) | 0 (0.0%) |
| 75 Years and over | 19 (15.3%) | 25 (24.3%) |
Disability Class: Cognitive Difficulty
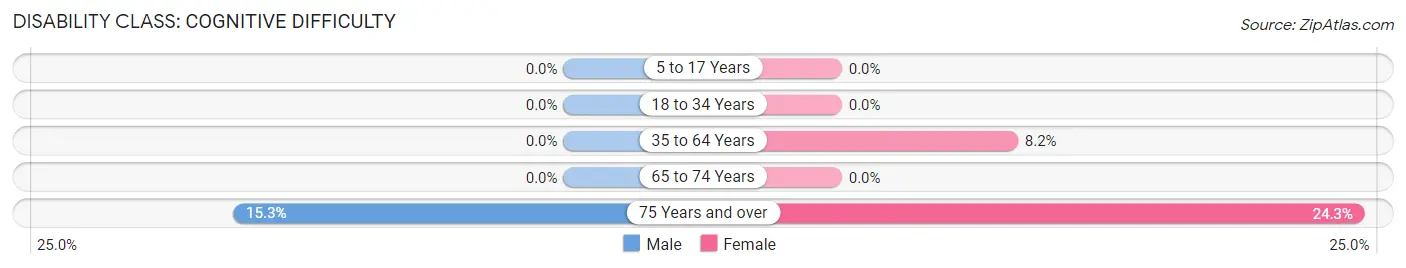
| Age Bracket | Male | Female |
| 5 to 17 Years | 0 (0.0%) | 0 (0.0%) |
| 18 to 34 Years | 0 (0.0%) | 0 (0.0%) |
| 35 to 64 Years | 0 (0.0%) | 30 (8.2%) |
| 65 to 74 Years | 0 (0.0%) | 0 (0.0%) |
| 75 Years and over | 19 (15.3%) | 25 (24.3%) |
Disability Class: Ambulatory Difficulty
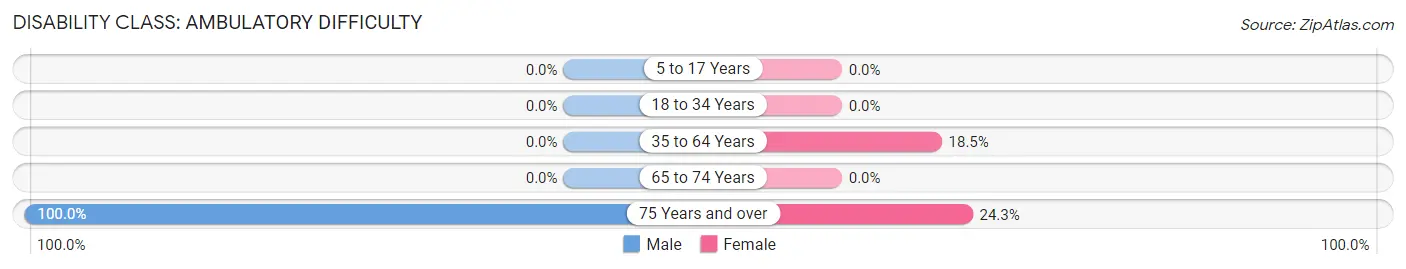
| Age Bracket | Male | Female |
| 5 to 17 Years | 0 (0.0%) | 0 (0.0%) |
| 18 to 34 Years | 0 (0.0%) | 0 (0.0%) |
| 35 to 64 Years | 0 (0.0%) | 68 (18.5%) |
| 65 to 74 Years | 0 (0.0%) | 0 (0.0%) |
| 75 Years and over | 124 (100.0%) | 25 (24.3%) |
Disability Class: Self-Care Difficulty
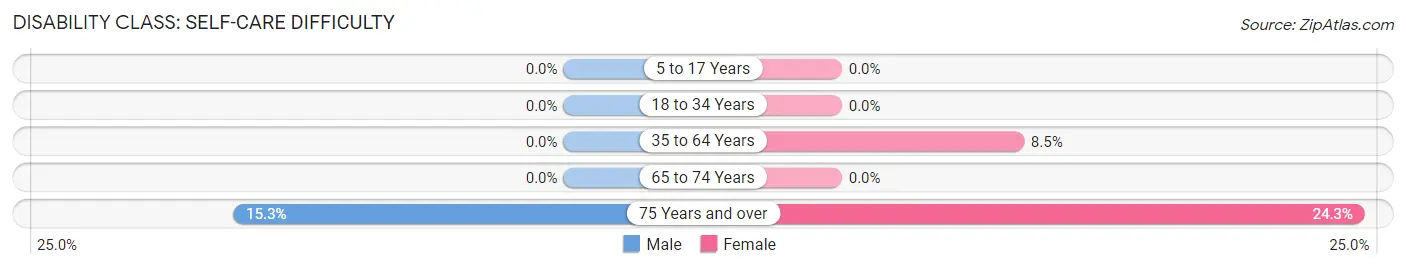
| Age Bracket | Male | Female |
| 5 to 17 Years | 0 (0.0%) | 0 (0.0%) |
| 18 to 34 Years | 0 (0.0%) | 0 (0.0%) |
| 35 to 64 Years | 0 (0.0%) | 31 (8.5%) |
| 65 to 74 Years | 0 (0.0%) | 0 (0.0%) |
| 75 Years and over | 19 (15.3%) | 25 (24.3%) |
Technology Access in Hanapepe
Computing Device Access in Hanapepe
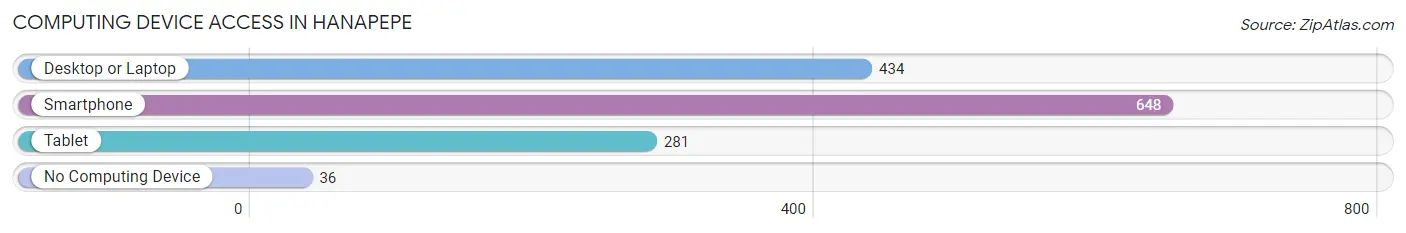
| Device Type | # Households | % Households |
| Desktop or Laptop | 434 | 62.2% |
| Smartphone | 648 | 92.8% |
| Tablet | 281 | 40.3% |
| No Computing Device | 36 | 5.2% |
| Total | 698 | 100.0% |
Internet Access in Hanapepe
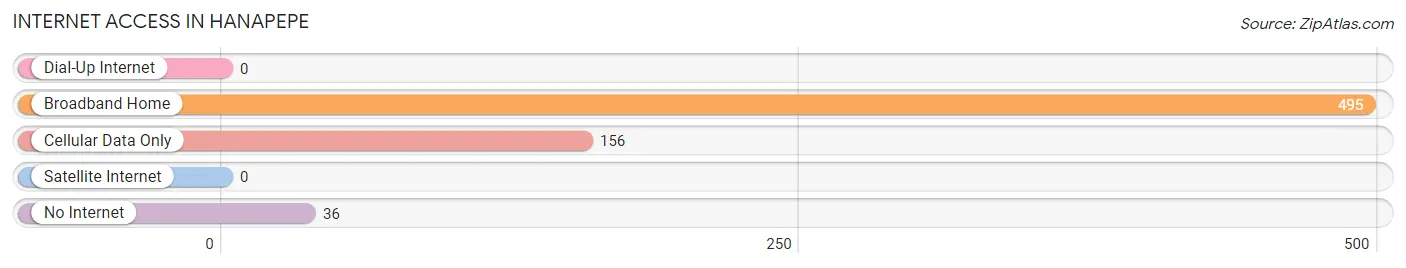
| Internet Type | # Households | % Households |
| Dial-Up Internet | 0 | 0.0% |
| Broadband Home | 495 | 70.9% |
| Cellular Data Only | 156 | 22.4% |
| Satellite Internet | 0 | 0.0% |
| No Internet | 36 | 5.2% |
| Total | 698 | 100.0% |
Hanapepe Summary
Hanapepe is a small town located on the island of Kauai in the state of Hawaii. It is situated on the south side of the island, about 15 miles west of the city of Lihue. The town has a population of approximately 2,000 people and is known for its historic buildings, lush tropical landscape, and vibrant culture.
History
Hanapepe was founded in 1810 by a group of Hawaiian settlers. The town was originally called Hanapepepa, which means “crushed bay” in Hawaiian. The name was derived from the fact that the bay was once filled with sand and rocks, making it difficult to navigate.
In the late 1800s, Hanapepe became a major port for the sugar industry. The town was home to several sugar plantations, and the harbor was used to transport sugar to the mainland. The town also served as a major trading center for the island, and was home to a variety of businesses, including a general store, a blacksmith, and a post office.
In the early 1900s, Hanapepe experienced a period of decline as the sugar industry moved away from the island. The town was largely abandoned until the 1950s, when it was rediscovered by tourists and began to experience a resurgence. Today, Hanapepe is a popular tourist destination, known for its historic buildings, lush tropical landscape, and vibrant culture.
Geography
Hanapepe is located on the south side of the island of Kauai, about 15 miles west of the city of Lihue. The town is situated on the banks of the Hanapepe River, which flows into the Pacific Ocean. The town is surrounded by lush tropical vegetation, including palm trees, banana trees, and other tropical plants.
The climate in Hanapepe is tropical, with temperatures ranging from the mid-70s to the mid-80s throughout the year. The town receives an average of about 20 inches of rain per year, with most of the rain falling during the winter months.
Economy
The economy of Hanapepe is largely based on tourism. The town is home to several hotels, restaurants, and other tourist attractions, including the Hanapepe Valley Lookout, which offers stunning views of the surrounding landscape. The town is also home to several art galleries, which feature works by local artists.
In addition to tourism, Hanapepe is home to several small businesses, including a general store, a post office, and a blacksmith. The town is also home to a number of agricultural operations, including a banana plantation and a macadamia nut farm.
Demographics
As of the 2010 census, the population of Hanapepe was 2,000. The town is predominantly white, with a small percentage of Asian and Native Hawaiian residents. The median household income in Hanapepe is $50,000, and the median home value is $400,000.
Hanapepe is a vibrant and diverse community, with a rich cultural heritage. The town is home to a variety of festivals and events throughout the year, including the Hanapepe Art Walk, which features works by local artists, and the Hanapepe Music Festival, which features live music from local and international performers.
Common Questions
What is Per Capita Income in Hanapepe?
Per Capita income in Hanapepe is $35,474.
What is the Median Family Income in Hanapepe?
Median Family Income in Hanapepe is $99,583.
What is the Median Household income in Hanapepe?
Median Household Income in Hanapepe is $88,385.
What is Income or Wage Gap in Hanapepe?
Income or Wage Gap in Hanapepe is 45.2%.
Women in Hanapepe earn 54.8 cents for every dollar earned by a man.
What is Inequality or Gini Index in Hanapepe?
Inequality or Gini Index in Hanapepe is 0.32.
What is the Total Population of Hanapepe?
Total Population of Hanapepe is 2,242.
What is the Total Male Population of Hanapepe?
Total Male Population of Hanapepe is 1,188.
What is the Total Female Population of Hanapepe?
Total Female Population of Hanapepe is 1,054.
What is the Ratio of Males per 100 Females in Hanapepe?
There are 112.71 Males per 100 Females in Hanapepe.
What is the Ratio of Females per 100 Males in Hanapepe?
There are 88.72 Females per 100 Males in Hanapepe.
What is the Median Population Age in Hanapepe?
Median Population Age in Hanapepe is 43.1 Years.
What is the Average Family Size in Hanapepe
Average Family Size in Hanapepe is 3.6 People.
What is the Average Household Size in Hanapepe
Average Household Size in Hanapepe is 3.2 People.
How Large is the Labor Force in Hanapepe?
There are 1,347 People in the Labor Forcein in Hanapepe.
What is the Percentage of People in the Labor Force in Hanapepe?
68.6% of People are in the Labor Force in Hanapepe.
What is the Unemployment Rate in Hanapepe?
Unemployment Rate in Hanapepe is 6.5%.