Zip Codes with the Highest Percentage of Population Employed in Security & Protection in Hawaii
RELATED REPORTS & OPTIONS
Security & Protection
Hawaii
Compare Zip Codes
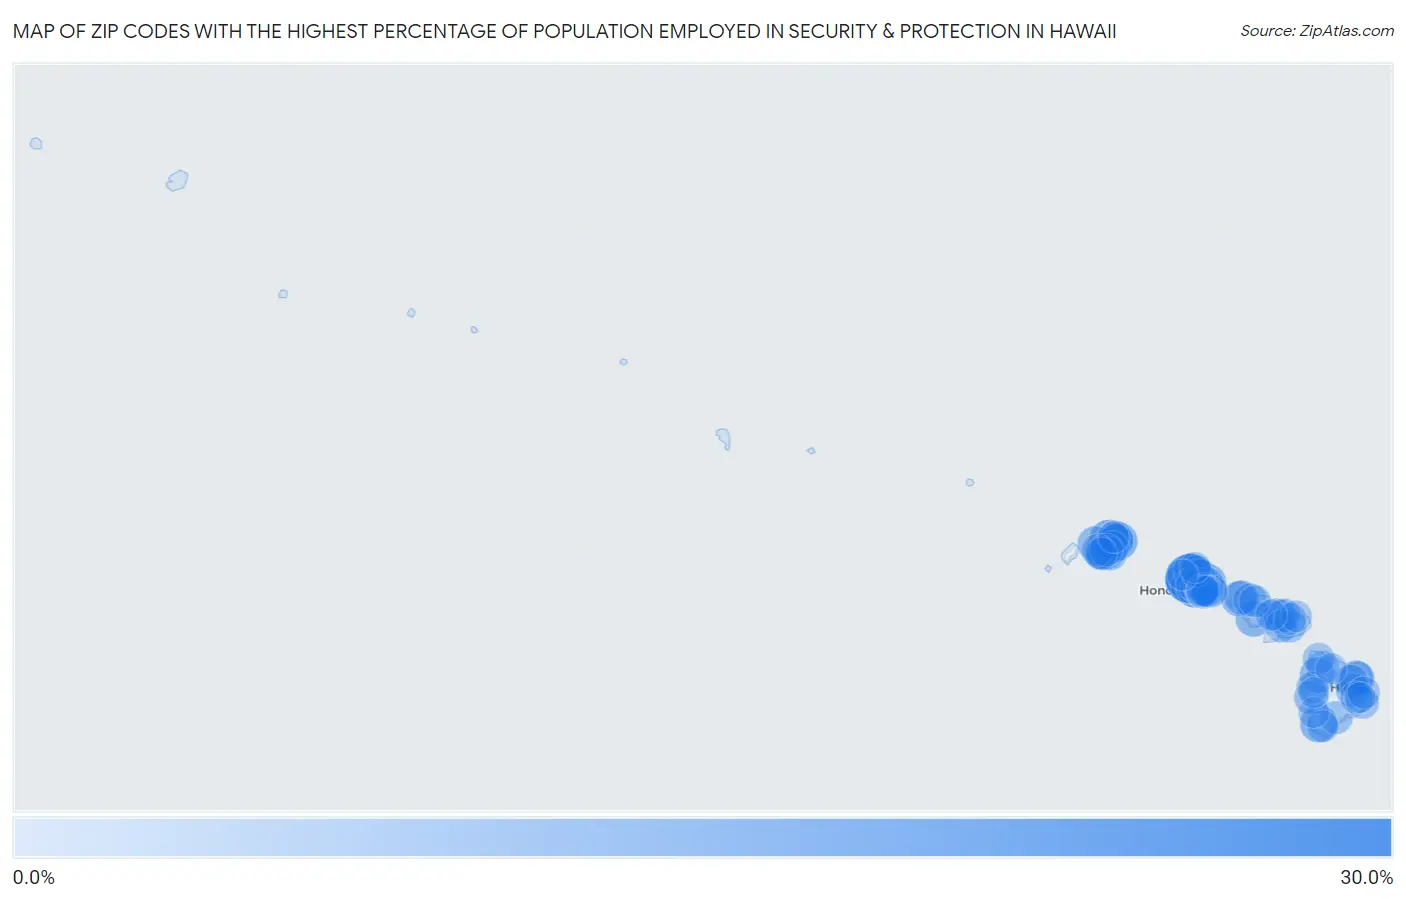
Map of Zip Codes with the Highest Percentage of Population Employed in Security & Protection in Hawaii
0.0%
30.0%
Zip Codes with the Highest Percentage of Population Employed in Security & Protection in Hawaii
| Zip Code | % Employed | vs State | vs National | |
| 1. | 96857 | 27.2% | 3.4%(+23.9)#1 | 2.1%(+25.1)#114 |
| 2. | 96860 | 13.7% | 3.4%(+10.3)#2 | 2.1%(+11.5)#435 |
| 3. | 96722 | 10.7% | 3.4%(+7.31)#3 | 2.1%(+8.54)#678 |
| 4. | 96751 | 10.1% | 3.4%(+6.71)#4 | 2.1%(+7.94)#757 |
| 5. | 96863 | 9.8% | 3.4%(+6.43)#5 | 2.1%(+7.66)#793 |
| 6. | 96737 | 9.6% | 3.4%(+6.25)#6 | 2.1%(+7.48)#814 |
| 7. | 96703 | 8.1% | 3.4%(+4.71)#7 | 2.1%(+5.94)#1,135 |
| 8. | 96763 | 8.0% | 3.4%(+4.67)#8 | 2.1%(+5.89)#1,152 |
| 9. | 96738 | 7.4% | 3.4%(+4.00)#9 | 2.1%(+5.23)#1,371 |
| 10. | 96770 | 6.8% | 3.4%(+3.42)#10 | 2.1%(+4.64)#1,635 |
| 11. | 96752 | 6.6% | 3.4%(+3.20)#11 | 2.1%(+4.42)#1,759 |
| 12. | 96746 | 6.5% | 3.4%(+3.11)#12 | 2.1%(+4.34)#1,788 |
| 13. | 96750 | 5.5% | 3.4%(+2.16)#13 | 2.1%(+3.38)#2,429 |
| 14. | 96792 | 5.5% | 3.4%(+2.10)#14 | 2.1%(+3.32)#2,477 |
| 15. | 96729 | 5.4% | 3.4%(+2.06)#15 | 2.1%(+3.28)#2,507 |
| 16. | 96783 | 5.4% | 3.4%(+2.00)#16 | 2.1%(+3.23)#2,561 |
| 17. | 96728 | 5.3% | 3.4%(+1.89)#17 | 2.1%(+3.11)#2,664 |
| 18. | 96795 | 5.2% | 3.4%(+1.78)#18 | 2.1%(+3.01)#2,751 |
| 19. | 96786 | 4.8% | 3.4%(+1.46)#19 | 2.1%(+2.68)#3,133 |
| 20. | 96782 | 4.7% | 3.4%(+1.31)#20 | 2.1%(+2.54)#3,324 |
| 21. | 96720 | 4.5% | 3.4%(+1.15)#21 | 2.1%(+2.37)#3,580 |
| 22. | 96757 | 4.4% | 3.4%(+1.06)#22 | 2.1%(+2.29)#3,717 |
| 23. | 96789 | 4.4% | 3.4%(+1.04)#23 | 2.1%(+2.27)#3,751 |
| 24. | 96743 | 4.4% | 3.4%(+0.991)#24 | 2.1%(+2.22)#3,837 |
| 25. | 96730 | 4.3% | 3.4%(+0.934)#25 | 2.1%(+2.16)#3,929 |
| 26. | 96765 | 4.3% | 3.4%(+0.881)#26 | 2.1%(+2.11)#4,015 |
| 27. | 96756 | 4.2% | 3.4%(+0.811)#27 | 2.1%(+2.04)#4,148 |
| 28. | 96712 | 4.2% | 3.4%(+0.783)#28 | 2.1%(+2.01)#4,201 |
| 29. | 96707 | 4.1% | 3.4%(+0.714)#29 | 2.1%(+1.94)#4,324 |
| 30. | 96706 | 4.0% | 3.4%(+0.615)#30 | 2.1%(+1.84)#4,516 |
| 31. | 96781 | 4.0% | 3.4%(+0.607)#31 | 2.1%(+1.83)#4,533 |
| 32. | 96793 | 3.9% | 3.4%(+0.508)#32 | 2.1%(+1.73)#4,726 |
| 33. | 96732 | 3.8% | 3.4%(+0.387)#33 | 2.1%(+1.61)#5,000 |
| 34. | 96705 | 3.7% | 3.4%(+0.280)#34 | 2.1%(+1.51)#5,263 |
| 35. | 96777 | 3.6% | 3.4%(+0.268)#35 | 2.1%(+1.49)#5,302 |
| 36. | 96766 | 3.6% | 3.4%(+0.218)#36 | 2.1%(+1.44)#5,411 |
| 37. | 96747 | 3.6% | 3.4%(+0.205)#37 | 2.1%(+1.43)#5,456 |
| 38. | 96744 | 3.6% | 3.4%(+0.197)#38 | 2.1%(+1.42)#5,481 |
| 39. | 96779 | 3.5% | 3.4%(+0.136)#39 | 2.1%(+1.36)#5,641 |
| 40. | 96819 | 3.4% | 3.4%(+0.060)#40 | 2.1%(+1.29)#5,836 |
| 41. | 96778 | 3.4% | 3.4%(+0.028)#41 | 2.1%(+1.25)#5,926 |
| 42. | 96741 | 3.3% | 3.4%(-0.073)#42 | 2.1%(+1.15)#6,238 |
| 43. | 96818 | 3.3% | 3.4%(-0.107)#43 | 2.1%(+1.12)#6,353 |
| 44. | 96734 | 3.2% | 3.4%(-0.141)#44 | 2.1%(+1.09)#6,446 |
| 45. | 96797 | 3.2% | 3.4%(-0.141)#45 | 2.1%(+1.09)#6,447 |
| 46. | 96817 | 3.2% | 3.4%(-0.164)#46 | 2.1%(+1.06)#6,517 |
| 47. | 96825 | 3.1% | 3.4%(-0.232)#47 | 2.1%(+0.994)#6,725 |
| 48. | 96790 | 3.1% | 3.4%(-0.253)#48 | 2.1%(+0.973)#6,811 |
| 49. | 96771 | 3.0% | 3.4%(-0.369)#49 | 2.1%(+0.857)#7,208 |
| 50. | 96753 | 3.0% | 3.4%(-0.421)#50 | 2.1%(+0.806)#7,410 |
| 51. | 96796 | 2.8% | 3.4%(-0.540)#51 | 2.1%(+0.686)#7,940 |
| 52. | 96701 | 2.8% | 3.4%(-0.584)#52 | 2.1%(+0.643)#8,146 |
| 53. | 96815 | 2.8% | 3.4%(-0.598)#53 | 2.1%(+0.629)#8,214 |
| 54. | 96716 | 2.7% | 3.4%(-0.655)#54 | 2.1%(+0.571)#8,443 |
| 55. | 96822 | 2.6% | 3.4%(-0.730)#55 | 2.1%(+0.497)#8,793 |
| 56. | 96814 | 2.6% | 3.4%(-0.798)#56 | 2.1%(+0.428)#9,119 |
| 57. | 96717 | 2.6% | 3.4%(-0.821)#57 | 2.1%(+0.405)#9,233 |
| 58. | 96749 | 2.6% | 3.4%(-0.822)#58 | 2.1%(+0.405)#9,235 |
| 59. | 96740 | 2.4% | 3.4%(-0.976)#59 | 2.1%(+0.251)#10,057 |
| 60. | 96768 | 2.3% | 3.4%(-1.04)#60 | 2.1%(+0.190)#10,404 |
| 61. | 96755 | 2.3% | 3.4%(-1.05)#61 | 2.1%(+0.176)#10,500 |
| 62. | 96826 | 2.3% | 3.4%(-1.09)#62 | 2.1%(+0.136)#10,738 |
| 63. | 96748 | 2.2% | 3.4%(-1.19)#63 | 2.1%(+0.038)#11,334 |
| 64. | 96813 | 2.2% | 3.4%(-1.20)#64 | 2.1%(+0.025)#11,426 |
| 65. | 96772 | 2.1% | 3.4%(-1.23)#65 | 2.1%(-0.005)#11,613 |
| 66. | 96762 | 2.0% | 3.4%(-1.37)#66 | 2.1%(-0.141)#12,511 |
| 67. | 96708 | 1.7% | 3.4%(-1.64)#67 | 2.1%(-0.413)#14,419 |
| 68. | 96821 | 1.7% | 3.4%(-1.65)#68 | 2.1%(-0.427)#14,521 |
| 69. | 96816 | 1.5% | 3.4%(-1.84)#69 | 2.1%(-0.614)#15,912 |
| 70. | 96761 | 1.5% | 3.4%(-1.91)#70 | 2.1%(-0.685)#16,465 |
| 71. | 96731 | 1.2% | 3.4%(-2.20)#71 | 2.1%(-0.970)#18,682 |
| 72. | 96727 | 1.1% | 3.4%(-2.26)#72 | 2.1%(-1.03)#19,179 |
| 73. | 96754 | 1.1% | 3.4%(-2.29)#73 | 2.1%(-1.06)#19,395 |
| 74. | 96791 | 1.1% | 3.4%(-2.32)#74 | 2.1%(-1.09)#19,619 |
| 75. | 96704 | 0.80% | 3.4%(-2.57)#75 | 2.1%(-1.35)#21,393 |
| 76. | 96760 | 0.58% | 3.4%(-2.80)#76 | 2.1%(-1.57)#22,795 |
| 77. | 96725 | 0.49% | 3.4%(-2.88)#77 | 2.1%(-1.65)#23,266 |
1
Common Questions
What are the Top 10 Zip Codes with the Highest Percentage of Population Employed in Security & Protection in Hawaii?
Top 10 Zip Codes with the Highest Percentage of Population Employed in Security & Protection in Hawaii are:
What zip code has the Highest Percentage of Population Employed in Security & Protection in Hawaii?
96857 has the Highest Percentage of Population Employed in Security & Protection in Hawaii with 27.2%.
What is the Percentage of Population Employed in Security & Protection in the State of Hawaii?
Percentage of Population Employed in Security & Protection in Hawaii is 3.4%.
What is the Percentage of Population Employed in Security & Protection in the United States?
Percentage of Population Employed in Security & Protection in the United States is 2.1%.