Fern Acres, HI Map & Demographics
Fern Acres Map
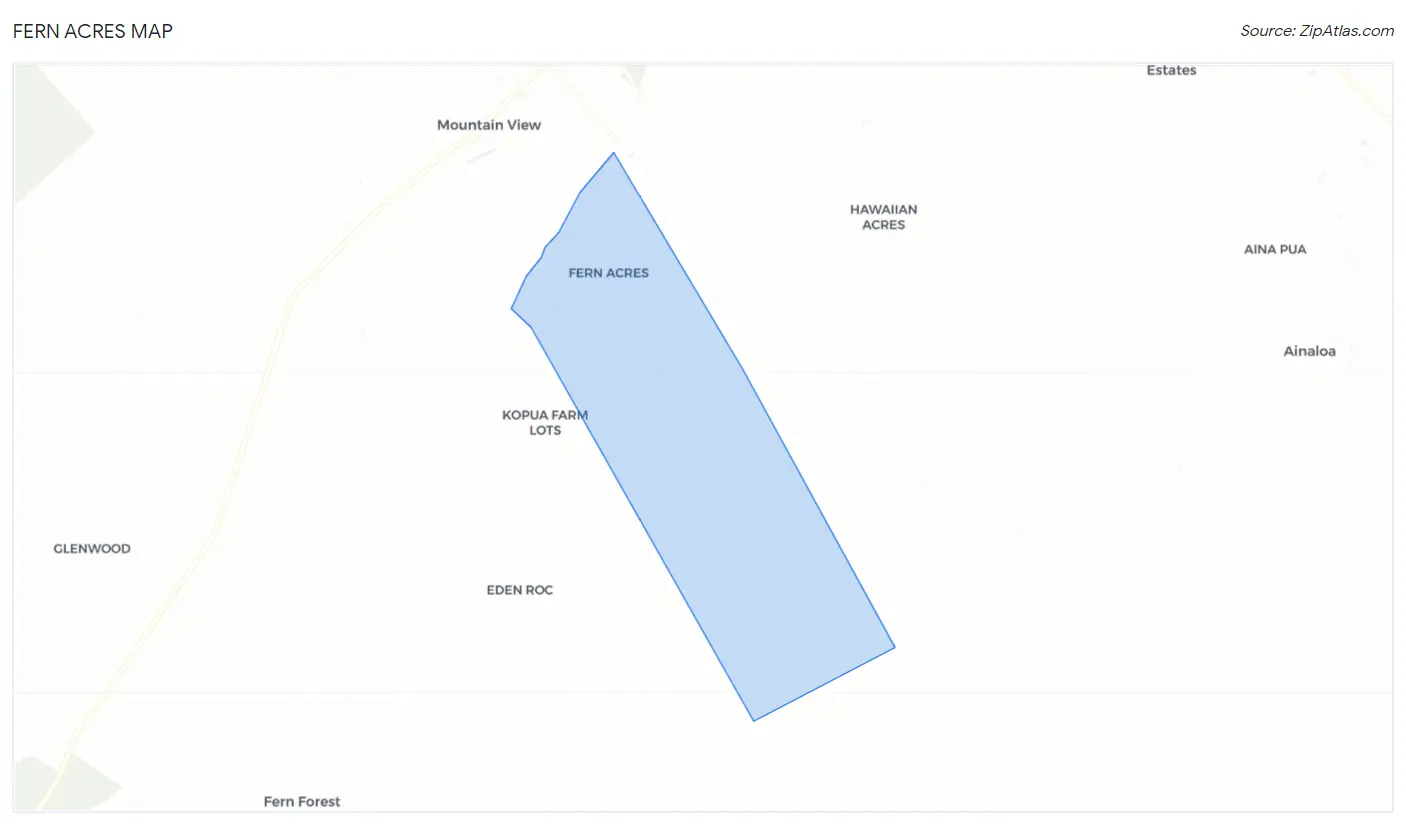
Fern Acres Overview
$23,201
PER CAPITA INCOME
$52,361
AVG FAMILY INCOME
$48,125
AVG HOUSEHOLD INCOME
20.9%
WAGE / INCOME GAP [ % ]
79.1¢/ $1
WAGE / INCOME GAP [ $ ]
0.42
INEQUALITY / GINI INDEX
1,781
TOTAL POPULATION
913
MALE POPULATION
868
FEMALE POPULATION
105.18
MALES / 100 FEMALES
95.07
FEMALES / 100 MALES
48.0
MEDIAN AGE
3.2
AVG FAMILY SIZE
2.8
AVG HOUSEHOLD SIZE
739
LABOR FORCE [ PEOPLE ]
47.9%
PERCENT IN LABOR FORCE
17.1%
UNEMPLOYMENT RATE
Income in Fern Acres
Income Overview in Fern Acres
Per Capita Income in Fern Acres is $23,201, while median incomes of families and households are $52,361 and $48,125 respectively.
| Characteristic | Number | Measure |
| Per Capita Income | 1,781 | $23,201 |
| Median Family Income | 431 | $52,361 |
| Mean Family Income | 431 | $68,492 |
| Median Household Income | 630 | $48,125 |
| Mean Household Income | 630 | $62,949 |
| Income Deficit | 431 | $0 |
| Wage / Income Gap (%) | 1,781 | 20.91% |
| Wage / Income Gap ($) | 1,781 | 79.09¢ per $1 |
| Gini / Inequality Index | 1,781 | 0.42 |
Earnings by Sex in Fern Acres
Average Earnings in Fern Acres are $34,098, $28,355 for men and $35,852 for women, a difference of 20.9%.
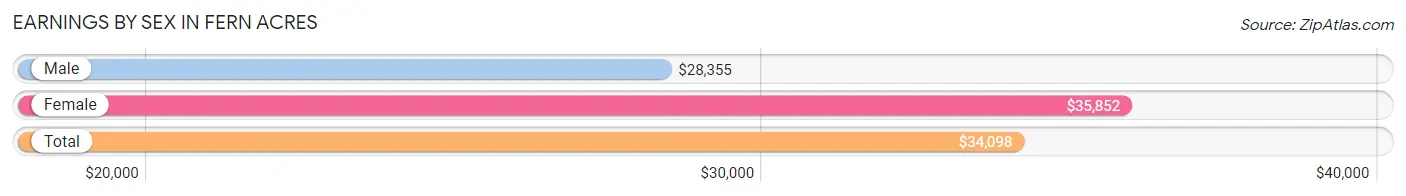
| Sex | Number | Average Earnings |
| Male | 395 (51.6%) | $28,355 |
| Female | 370 (48.4%) | $35,852 |
| Total | 765 (100.0%) | $34,098 |
Earnings by Sex by Income Bracket in Fern Acres
The most common earnings brackets in Fern Acres are $25,000 to $29,999 for men (56 | 14.2%) and $30,000 to $34,999 for women (66 | 17.8%).
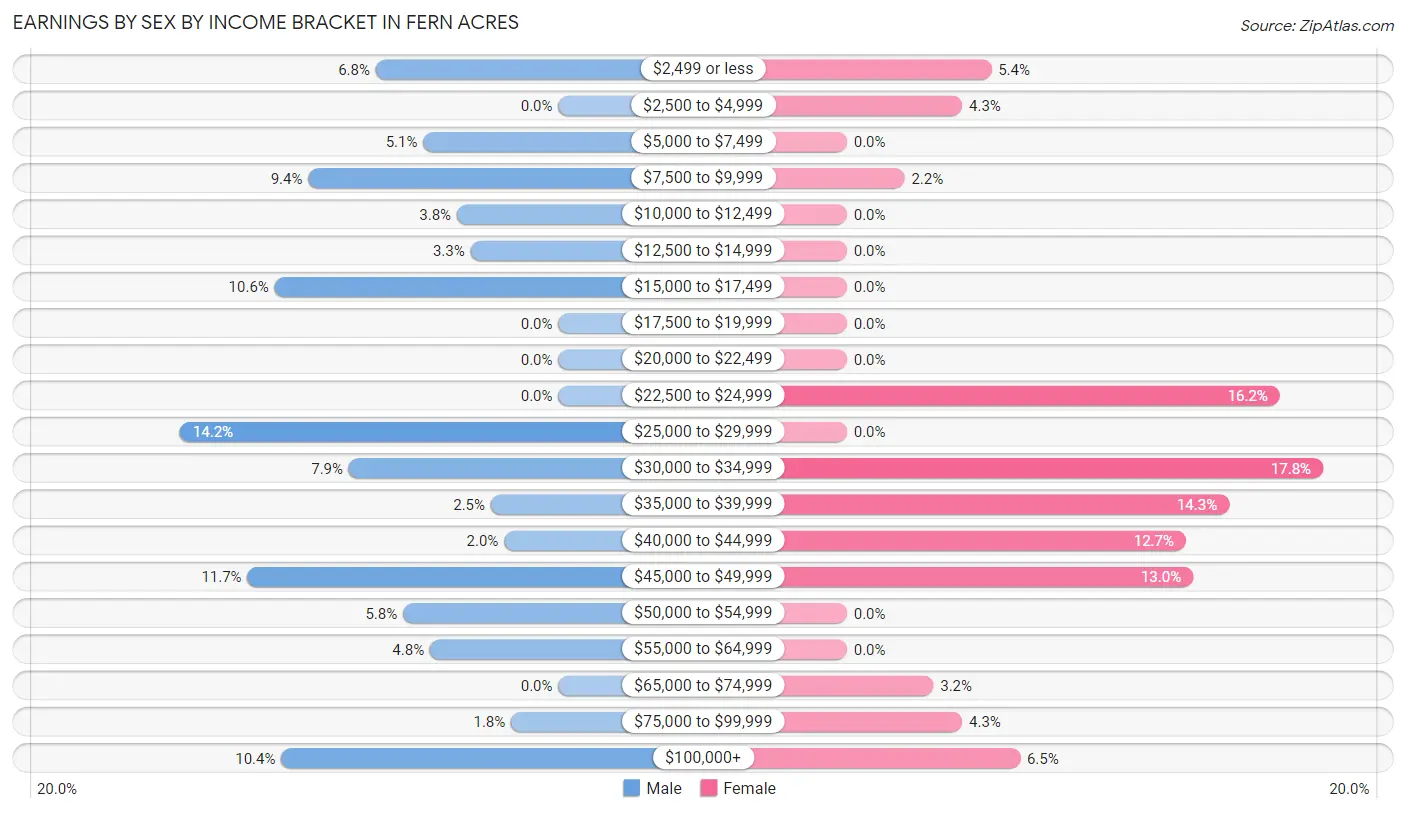
| Income | Male | Female |
| $2,499 or less | 27 (6.8%) | 20 (5.4%) |
| $2,500 to $4,999 | 0 (0.0%) | 16 (4.3%) |
| $5,000 to $7,499 | 20 (5.1%) | 0 (0.0%) |
| $7,500 to $9,999 | 37 (9.4%) | 8 (2.2%) |
| $10,000 to $12,499 | 15 (3.8%) | 0 (0.0%) |
| $12,500 to $14,999 | 13 (3.3%) | 0 (0.0%) |
| $15,000 to $17,499 | 42 (10.6%) | 0 (0.0%) |
| $17,500 to $19,999 | 0 (0.0%) | 0 (0.0%) |
| $20,000 to $22,499 | 0 (0.0%) | 0 (0.0%) |
| $22,500 to $24,999 | 0 (0.0%) | 60 (16.2%) |
| $25,000 to $29,999 | 56 (14.2%) | 0 (0.0%) |
| $30,000 to $34,999 | 31 (7.9%) | 66 (17.8%) |
| $35,000 to $39,999 | 10 (2.5%) | 53 (14.3%) |
| $40,000 to $44,999 | 8 (2.0%) | 47 (12.7%) |
| $45,000 to $49,999 | 46 (11.7%) | 48 (13.0%) |
| $50,000 to $54,999 | 23 (5.8%) | 0 (0.0%) |
| $55,000 to $64,999 | 19 (4.8%) | 0 (0.0%) |
| $65,000 to $74,999 | 0 (0.0%) | 12 (3.2%) |
| $75,000 to $99,999 | 7 (1.8%) | 16 (4.3%) |
| $100,000+ | 41 (10.4%) | 24 (6.5%) |
| Total | 395 (100.0%) | 370 (100.0%) |
Earnings by Sex by Educational Attainment in Fern Acres
Average earnings in Fern Acres are $33,750 for men and $39,722 for women, a difference of 15.0%. Men with an educational attainment of college or associate's degree enjoy the highest average annual earnings of $34,417, while those with high school diploma education earn the least with $27,027. Women with an educational attainment of high school diploma earn the most with the average annual earnings of $48,162, while those with bachelor's degree education have the smallest earnings of $23,804.

| Educational Attainment | Male Income | Female Income |
| Less than High School | - | - |
| High School Diploma | $27,027 | $48,162 |
| College or Associate's Degree | $34,417 | $42,115 |
| Bachelor's Degree | - | - |
| Graduate Degree | - | - |
| Total | $33,750 | $39,722 |
Family Income in Fern Acres
Family Income Brackets in Fern Acres
According to the Fern Acres family income data, there are 101 families falling into the $35,000 to $49,999 income range, which is the most common income bracket and makes up 23.4% of all families.
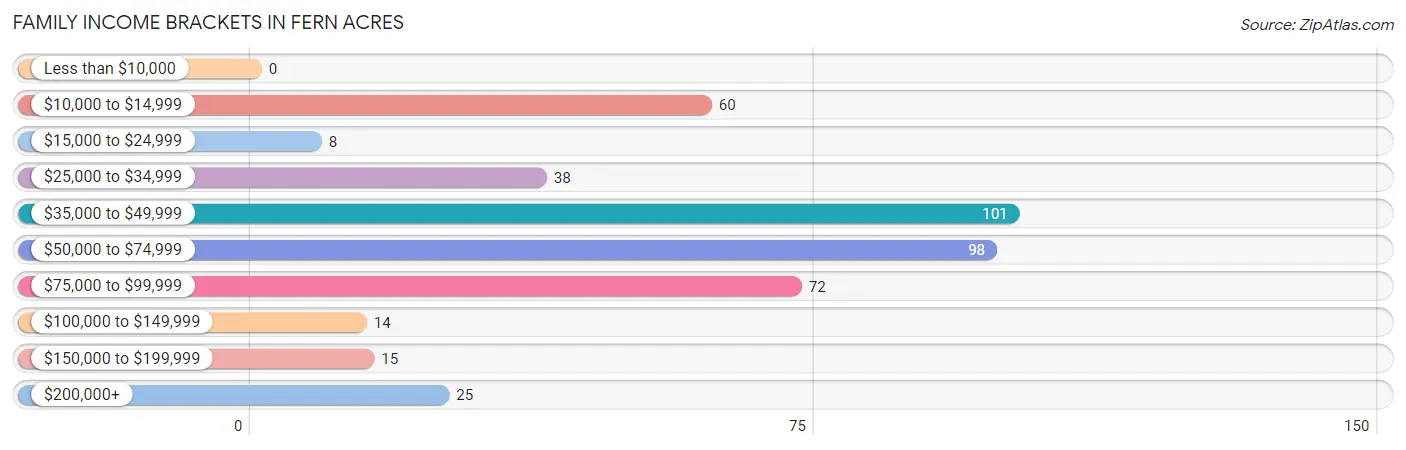
| Income Bracket | # Families | % Families |
| Less than $10,000 | 0 | 0.0% |
| $10,000 to $14,999 | 60 | 13.9% |
| $15,000 to $24,999 | 8 | 1.9% |
| $25,000 to $34,999 | 38 | 8.8% |
| $35,000 to $49,999 | 101 | 23.4% |
| $50,000 to $74,999 | 98 | 22.7% |
| $75,000 to $99,999 | 72 | 16.7% |
| $100,000 to $149,999 | 14 | 3.2% |
| $150,000 to $199,999 | 15 | 3.5% |
| $200,000+ | 25 | 5.8% |
Family Income by Famaliy Size in Fern Acres
4-person families (60 | 13.9%) account for the highest median family income in Fern Acres with $82,000 per family, while 4-person families (60 | 13.9%) have the highest median income of $20,500 per family member.
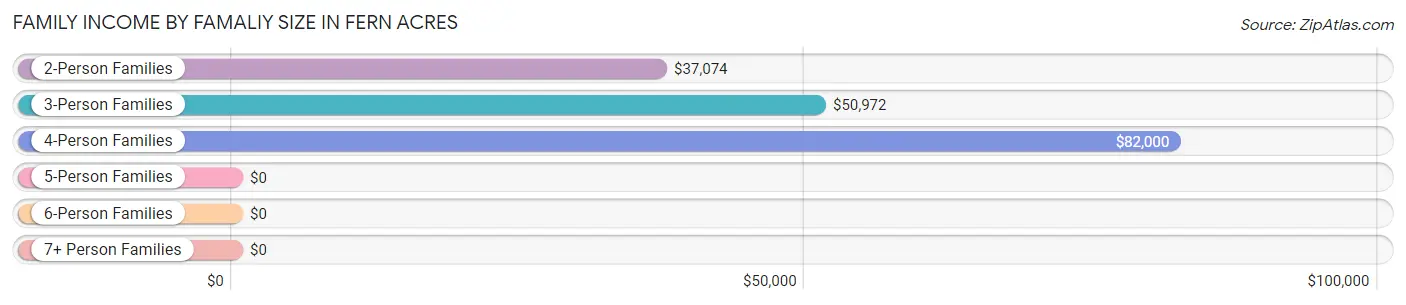
| Income Bracket | # Families | Median Income |
| 2-Person Families | 259 (60.1%) | $37,074 |
| 3-Person Families | 65 (15.1%) | $50,972 |
| 4-Person Families | 60 (13.9%) | $82,000 |
| 5-Person Families | 25 (5.8%) | $0 |
| 6-Person Families | 0 (0.0%) | $0 |
| 7+ Person Families | 22 (5.1%) | $0 |
| Total | 431 (100.0%) | $52,361 |
Family Income by Number of Earners in Fern Acres
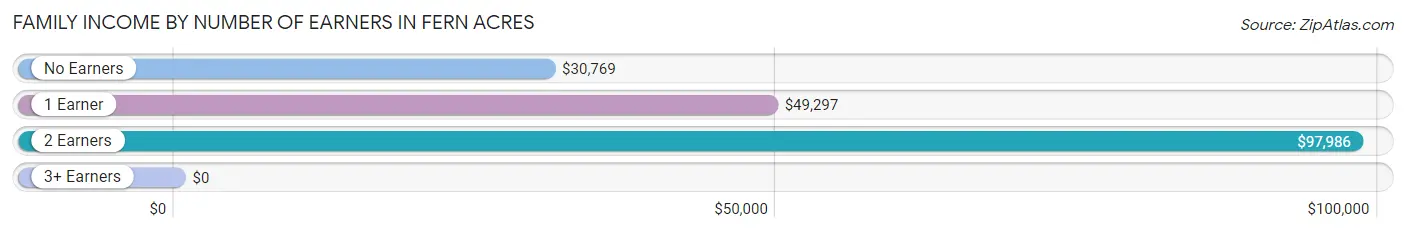
| Number of Earners | # Families | Median Income |
| No Earners | 66 (15.3%) | $30,769 |
| 1 Earner | 227 (52.7%) | $49,297 |
| 2 Earners | 120 (27.8%) | $97,986 |
| 3+ Earners | 18 (4.2%) | $0 |
| Total | 431 (100.0%) | $52,361 |
Household Income in Fern Acres
Household Income Brackets in Fern Acres
With 149 households falling in the category, the $50,000 to $74,999 income range is the most frequent in Fern Acres, accounting for 23.6% of all households. In contrast, only 15 households (2.4%) fall into the $150,000 to $199,999 income bracket, making it the least populous group.
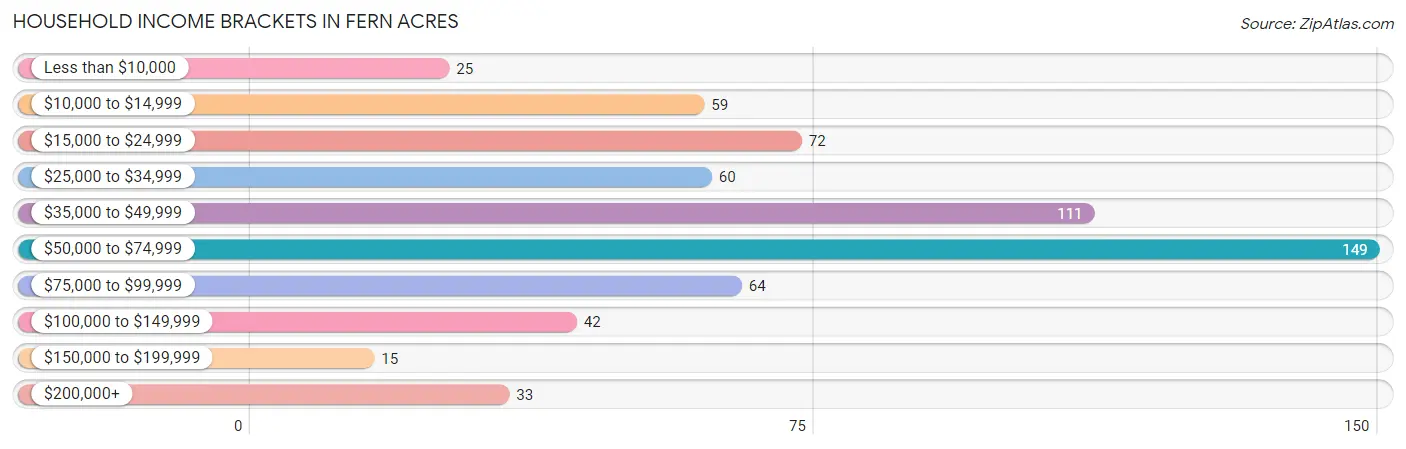
| Income Bracket | # Households | % Households |
| Less than $10,000 | 25 | 4.0% |
| $10,000 to $14,999 | 59 | 9.4% |
| $15,000 to $24,999 | 72 | 11.4% |
| $25,000 to $34,999 | 60 | 9.5% |
| $35,000 to $49,999 | 111 | 17.6% |
| $50,000 to $74,999 | 149 | 23.7% |
| $75,000 to $99,999 | 64 | 10.2% |
| $100,000 to $149,999 | 42 | 6.7% |
| $150,000 to $199,999 | 15 | 2.4% |
| $200,000+ | 33 | 5.2% |
Household Income by Householder Age in Fern Acres
The median household income in Fern Acres is $48,125, with the highest median household income of $63,542 found in the 45 to 64 years age bracket for the primary householder. A total of 265 households (42.1%) fall into this category. Meanwhile, the 15 to 24 years age bracket for the primary householder has the lowest median household income of $0, with 10 households (1.6%) in this group.
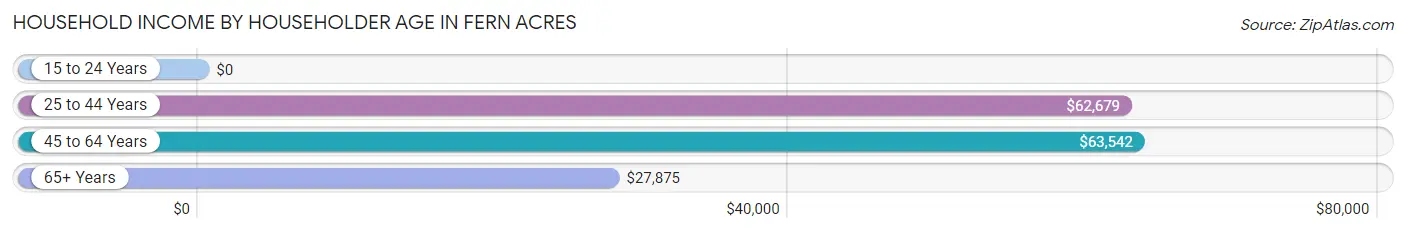
| Income Bracket | # Households | Median Income |
| 15 to 24 Years | 10 (1.6%) | $0 |
| 25 to 44 Years | 130 (20.6%) | $62,679 |
| 45 to 64 Years | 265 (42.1%) | $63,542 |
| 65+ Years | 225 (35.7%) | $27,875 |
| Total | 630 (100.0%) | $48,125 |
Poverty in Fern Acres
Income Below Poverty by Sex and Age in Fern Acres
With 12.6% poverty level for males and 13.3% for females among the residents of Fern Acres, 65 to 74 year old males and 75 year old and over females are the most vulnerable to poverty, with 53 males (46.5%) and 16 females (32.7%) in their respective age groups living below the poverty level.
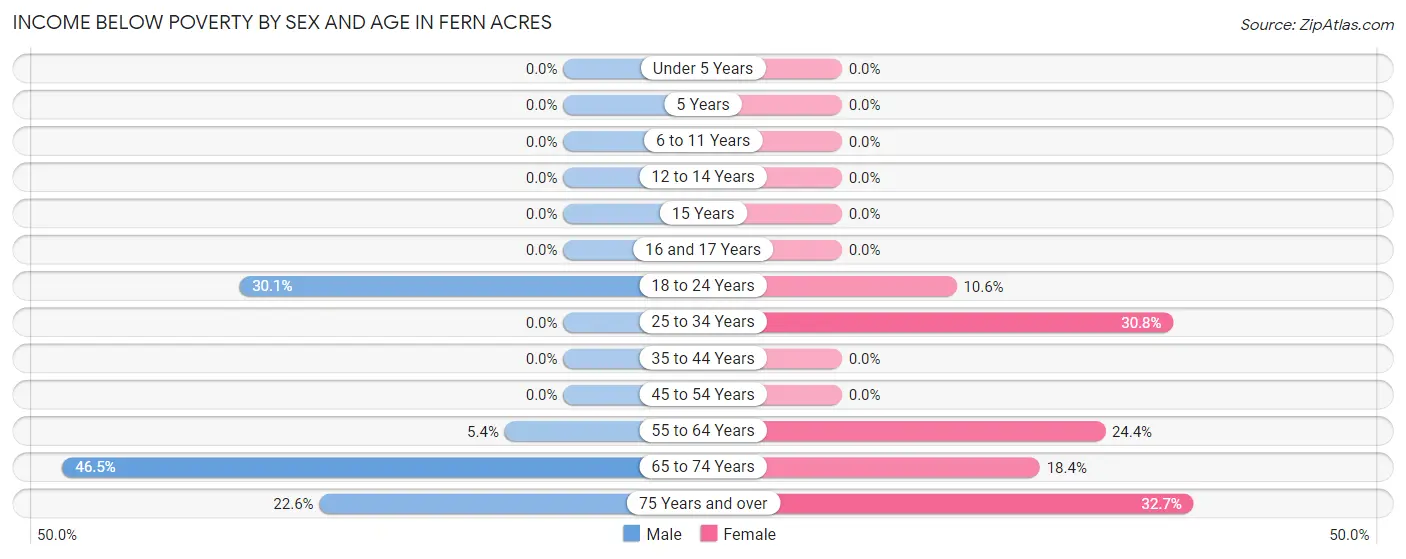
| Age Bracket | Male | Female |
| Under 5 Years | 0 (0.0%) | 0 (0.0%) |
| 5 Years | 0 (0.0%) | 0 (0.0%) |
| 6 to 11 Years | 0 (0.0%) | 0 (0.0%) |
| 12 to 14 Years | 0 (0.0%) | 0 (0.0%) |
| 15 Years | 0 (0.0%) | 0 (0.0%) |
| 16 and 17 Years | 0 (0.0%) | 0 (0.0%) |
| 18 to 24 Years | 37 (30.1%) | 10 (10.6%) |
| 25 to 34 Years | 0 (0.0%) | 40 (30.8%) |
| 35 to 44 Years | 0 (0.0%) | 0 (0.0%) |
| 45 to 54 Years | 0 (0.0%) | 0 (0.0%) |
| 55 to 64 Years | 13 (5.4%) | 21 (24.4%) |
| 65 to 74 Years | 53 (46.5%) | 27 (18.4%) |
| 75 Years and over | 12 (22.6%) | 16 (32.7%) |
| Total | 115 (12.6%) | 114 (13.3%) |
Income Above Poverty by Sex and Age in Fern Acres
According to the poverty statistics in Fern Acres, males aged under 5 years and females aged under 5 years are the age groups that are most secure financially, with 100.0% of males and 100.0% of females in these age groups living above the poverty line.
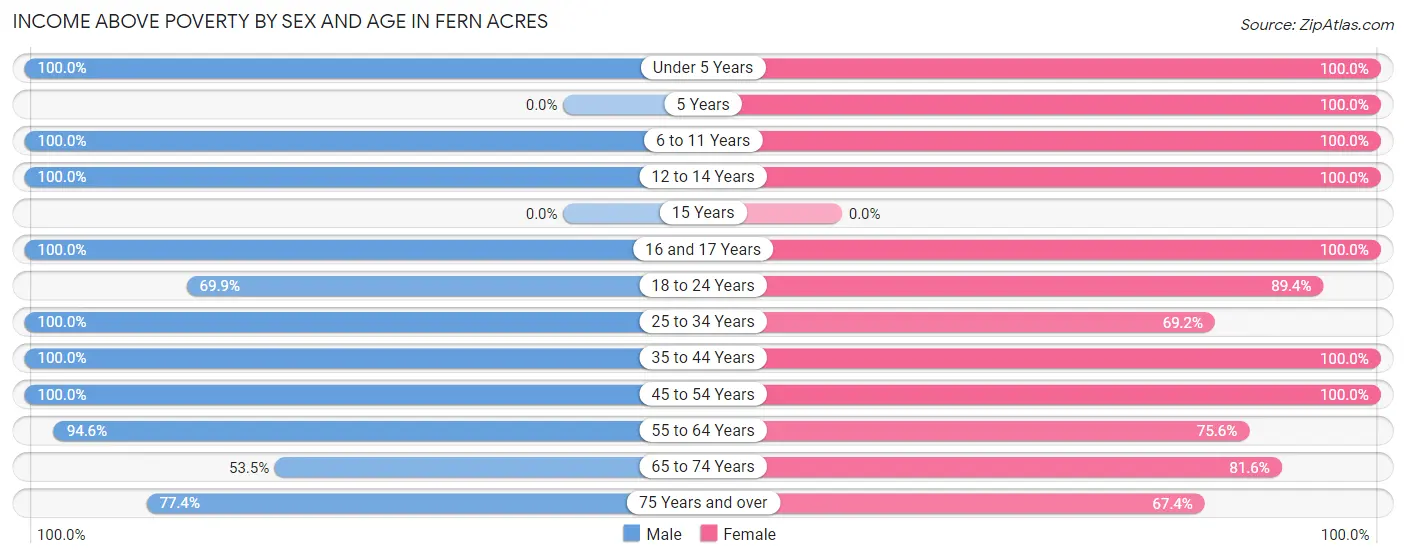
| Age Bracket | Male | Female |
| Under 5 Years | 37 (100.0%) | 50 (100.0%) |
| 5 Years | 0 (0.0%) | 11 (100.0%) |
| 6 to 11 Years | 15 (100.0%) | 52 (100.0%) |
| 12 to 14 Years | 35 (100.0%) | 28 (100.0%) |
| 15 Years | 0 (0.0%) | 0 (0.0%) |
| 16 and 17 Years | 18 (100.0%) | 15 (100.0%) |
| 18 to 24 Years | 86 (69.9%) | 84 (89.4%) |
| 25 to 34 Years | 30 (100.0%) | 90 (69.2%) |
| 35 to 44 Years | 105 (100.0%) | 116 (100.0%) |
| 45 to 54 Years | 144 (100.0%) | 80 (100.0%) |
| 55 to 64 Years | 226 (94.6%) | 65 (75.6%) |
| 65 to 74 Years | 61 (53.5%) | 120 (81.6%) |
| 75 Years and over | 41 (77.4%) | 33 (67.3%) |
| Total | 798 (87.4%) | 744 (86.7%) |
Income Below Poverty Among Married-Couple Families in Fern Acres
The poverty statistics for married-couple families in Fern Acres show that 18.2% or 50 of the total 275 families live below the poverty line. Families with no children have the highest poverty rate of 26.6%, comprising of 50 families. On the other hand, families with 1 or 2 children have the lowest poverty rate of 0.0%, which includes 0 families.
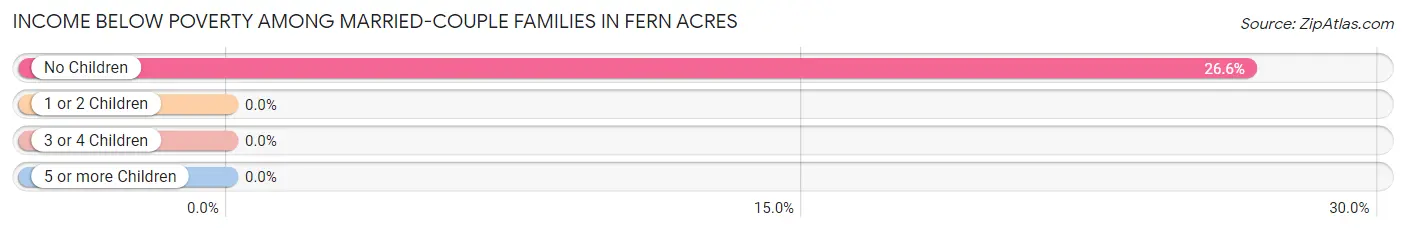
| Children | Above Poverty | Below Poverty |
| No Children | 138 (73.4%) | 50 (26.6%) |
| 1 or 2 Children | 78 (100.0%) | 0 (0.0%) |
| 3 or 4 Children | 0 (0.0%) | 0 (0.0%) |
| 5 or more Children | 9 (100.0%) | 0 (0.0%) |
| Total | 225 (81.8%) | 50 (18.2%) |
Income Below Poverty Among Single-Parent Households in Fern Acres
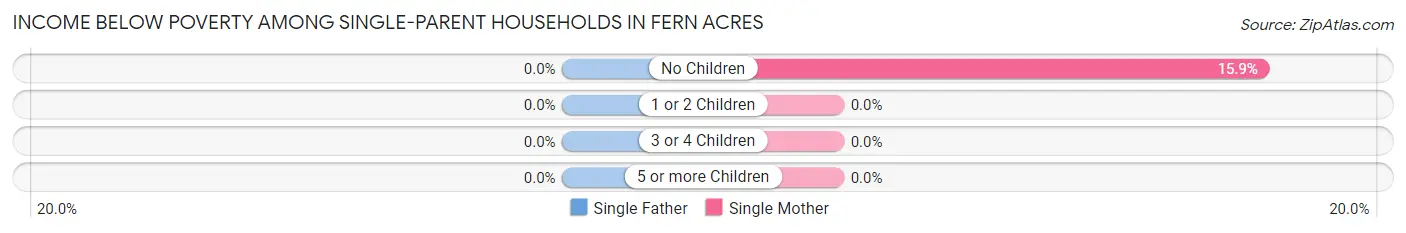
| Children | Single Father | Single Mother |
| No Children | 0 (0.0%) | 10 (15.9%) |
| 1 or 2 Children | 0 (0.0%) | 0 (0.0%) |
| 3 or 4 Children | 0 (0.0%) | 0 (0.0%) |
| 5 or more Children | 0 (0.0%) | 0 (0.0%) |
| Total | 0 (0.0%) | 10 (10.2%) |
Income Below Poverty Among Married-Couple vs Single-Parent Households in Fern Acres
The poverty data for Fern Acres shows that 50 of the married-couple family households (18.2%) and 10 of the single-parent households (6.4%) are living below the poverty level. Within the married-couple family households, those with no children have the highest poverty rate, with 50 households (26.6%) falling below the poverty line. Among the single-parent households, those with no children have the highest poverty rate, with 10 household (9.3%) living below poverty.
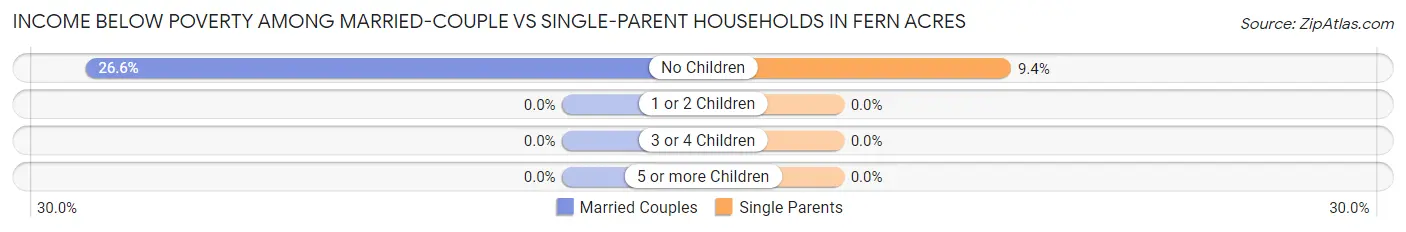
| Children | Married-Couple Families | Single-Parent Households |
| No Children | 50 (26.6%) | 10 (9.3%) |
| 1 or 2 Children | 0 (0.0%) | 0 (0.0%) |
| 3 or 4 Children | 0 (0.0%) | 0 (0.0%) |
| 5 or more Children | 0 (0.0%) | 0 (0.0%) |
| Total | 50 (18.2%) | 10 (6.4%) |
Race in Fern Acres
The most populous races in Fern Acres are Two or more Races (730 | 41.0%), White / Caucasian (708 | 39.8%), and Hispanic or Latino (329 | 18.5%).
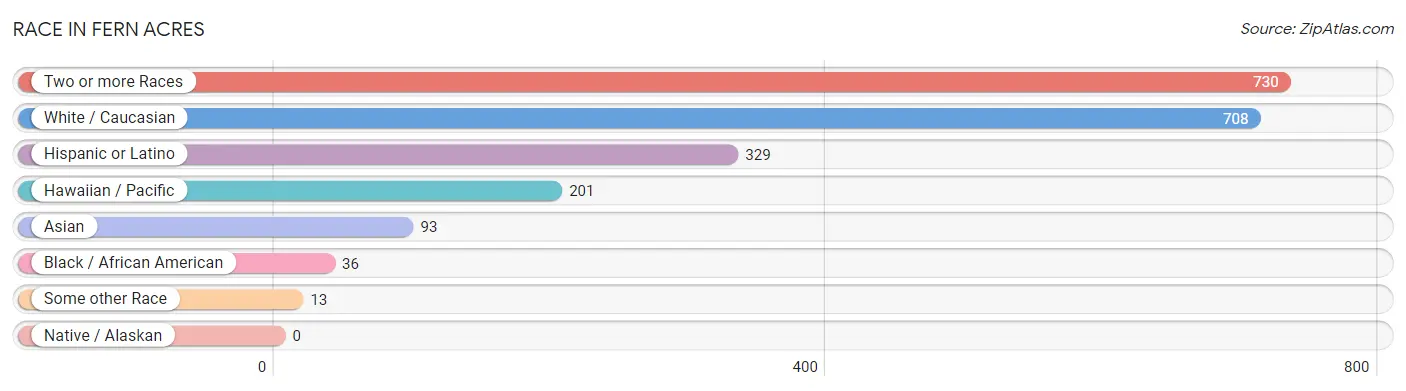
| Race | # Population | % Population |
| Asian | 93 | 5.2% |
| Black / African American | 36 | 2.0% |
| Hawaiian / Pacific | 201 | 11.3% |
| Hispanic or Latino | 329 | 18.5% |
| Native / Alaskan | 0 | 0.0% |
| White / Caucasian | 708 | 39.8% |
| Two or more Races | 730 | 41.0% |
| Some other Race | 13 | 0.7% |
| Total | 1,781 | 100.0% |
Ancestry in Fern Acres
The most populous ancestries reported in Fern Acres are Native Hawaiian (742 | 41.7%), Indian (Asian) (398 | 22.4%), Puerto Rican (268 | 15.0%), German (242 | 13.6%), and Portuguese (219 | 12.3%), together accounting for 105.0% of all Fern Acres residents.
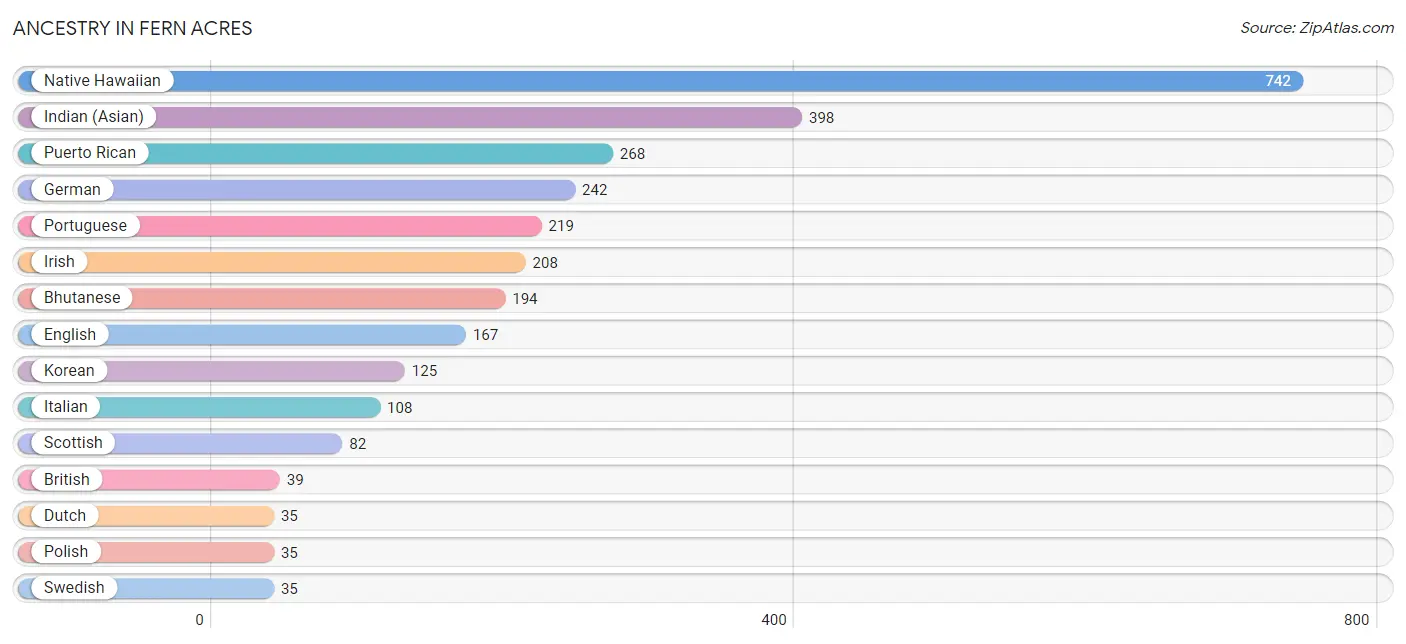
| Ancestry | # Population | % Population |
| African | 9 | 0.5% |
| Bhutanese | 194 | 10.9% |
| British | 39 | 2.2% |
| Burmese | 16 | 0.9% |
| Cherokee | 8 | 0.4% |
| Chinese | 12 | 0.7% |
| Cuban | 21 | 1.2% |
| Dutch | 35 | 2.0% |
| English | 167 | 9.4% |
| European | 29 | 1.6% |
| French | 8 | 0.4% |
| German | 242 | 13.6% |
| Indian (Asian) | 398 | 22.4% |
| Irish | 208 | 11.7% |
| Italian | 108 | 6.1% |
| Korean | 125 | 7.0% |
| Lithuanian | 16 | 0.9% |
| Native Hawaiian | 742 | 41.7% |
| Norwegian | 16 | 0.9% |
| Polish | 35 | 2.0% |
| Portuguese | 219 | 12.3% |
| Potawatomi | 18 | 1.0% |
| Puerto Rican | 268 | 15.0% |
| Russian | 32 | 1.8% |
| Samoan | 7 | 0.4% |
| Scandinavian | 25 | 1.4% |
| Scotch-Irish | 16 | 0.9% |
| Scottish | 82 | 4.6% |
| Spaniard | 13 | 0.7% |
| Spanish | 27 | 1.5% |
| Sri Lankan | 13 | 0.7% |
| Subsaharan African | 9 | 0.5% |
| Swedish | 35 | 2.0% |
| Welsh | 8 | 0.4% | View All 34 Rows |
Immigrants in Fern Acres
The most numerous immigrant groups reported in Fern Acres came from Canada (28 | 1.6%), Asia (25 | 1.4%), Micronesia (23 | 1.3%), Oceania (23 | 1.3%), and Caribbean (21 | 1.2%), together accounting for 6.7% of all Fern Acres residents.
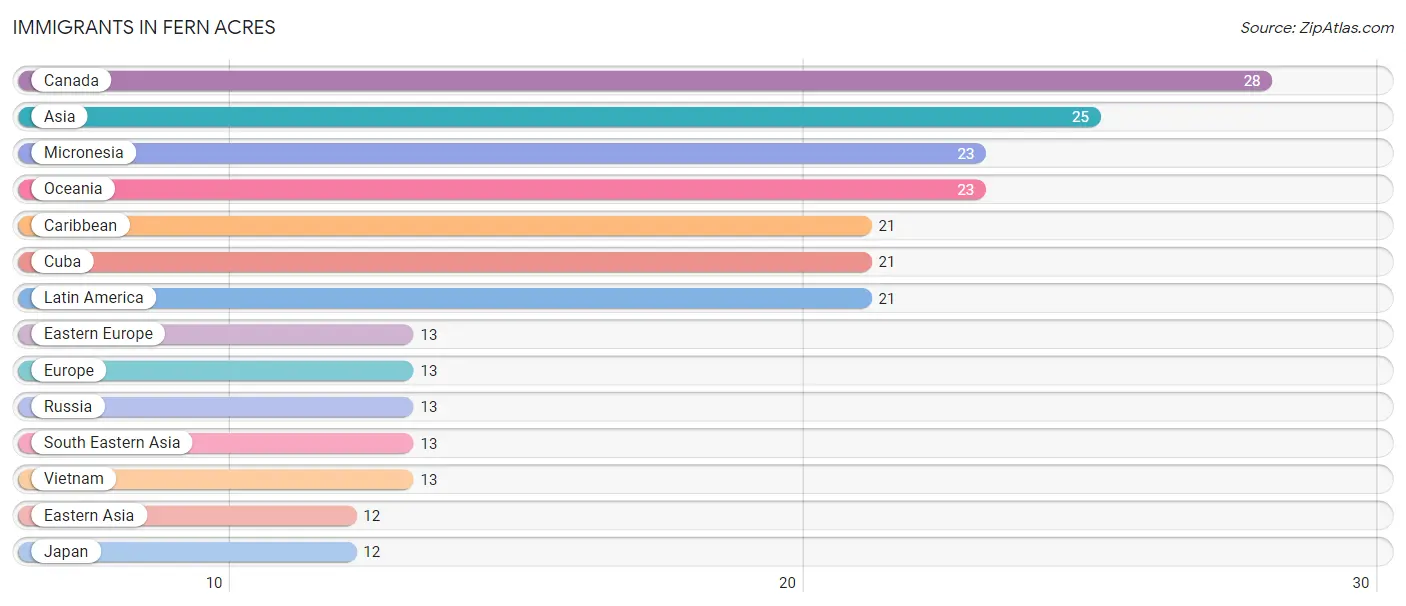
| Immigration Origin | # Population | % Population |
| Asia | 25 | 1.4% |
| Canada | 28 | 1.6% |
| Caribbean | 21 | 1.2% |
| Cuba | 21 | 1.2% |
| Eastern Asia | 12 | 0.7% |
| Eastern Europe | 13 | 0.7% |
| Europe | 13 | 0.7% |
| Japan | 12 | 0.7% |
| Latin America | 21 | 1.2% |
| Micronesia | 23 | 1.3% |
| Oceania | 23 | 1.3% |
| Russia | 13 | 0.7% |
| South Eastern Asia | 13 | 0.7% |
| Vietnam | 13 | 0.7% | View All 14 Rows |
Sex and Age in Fern Acres
Sex and Age in Fern Acres
The most populous age groups in Fern Acres are 55 to 59 Years (121 | 13.3%) for men and 35 to 39 Years (96 | 11.1%) for women.
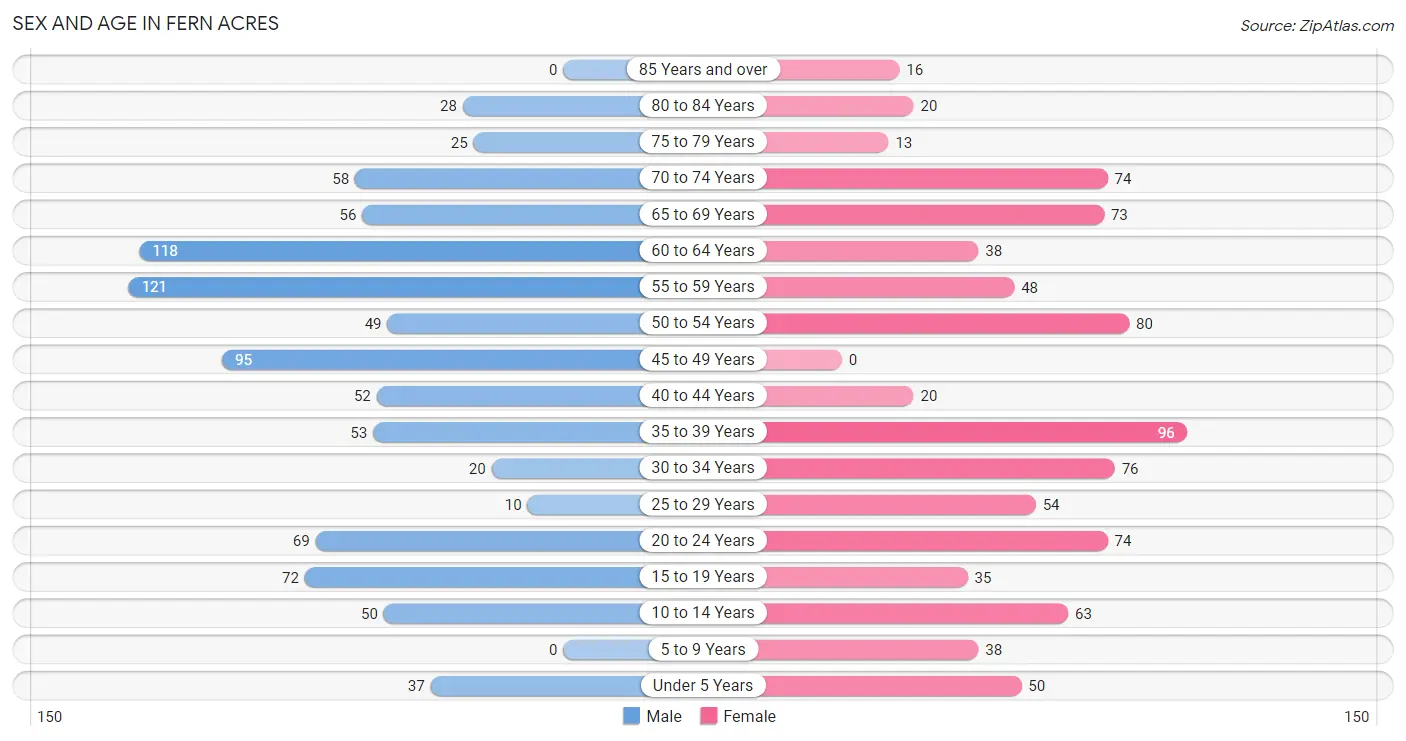
| Age Bracket | Male | Female |
| Under 5 Years | 37 (4.1%) | 50 (5.8%) |
| 5 to 9 Years | 0 (0.0%) | 38 (4.4%) |
| 10 to 14 Years | 50 (5.5%) | 63 (7.3%) |
| 15 to 19 Years | 72 (7.9%) | 35 (4.0%) |
| 20 to 24 Years | 69 (7.6%) | 74 (8.5%) |
| 25 to 29 Years | 10 (1.1%) | 54 (6.2%) |
| 30 to 34 Years | 20 (2.2%) | 76 (8.8%) |
| 35 to 39 Years | 53 (5.8%) | 96 (11.1%) |
| 40 to 44 Years | 52 (5.7%) | 20 (2.3%) |
| 45 to 49 Years | 95 (10.4%) | 0 (0.0%) |
| 50 to 54 Years | 49 (5.4%) | 80 (9.2%) |
| 55 to 59 Years | 121 (13.3%) | 48 (5.5%) |
| 60 to 64 Years | 118 (12.9%) | 38 (4.4%) |
| 65 to 69 Years | 56 (6.1%) | 73 (8.4%) |
| 70 to 74 Years | 58 (6.4%) | 74 (8.5%) |
| 75 to 79 Years | 25 (2.7%) | 13 (1.5%) |
| 80 to 84 Years | 28 (3.1%) | 20 (2.3%) |
| 85 Years and over | 0 (0.0%) | 16 (1.8%) |
| Total | 913 (100.0%) | 868 (100.0%) |
Families and Households in Fern Acres
Median Family Size in Fern Acres
The median family size in Fern Acres is 3.20 persons per family, with single female/mother families (98 | 22.7%) accounting for the largest median family size of 4.3 persons per family. On the other hand, single male/father families (58 | 13.5%) represent the smallest median family size with 2.38 persons per family.
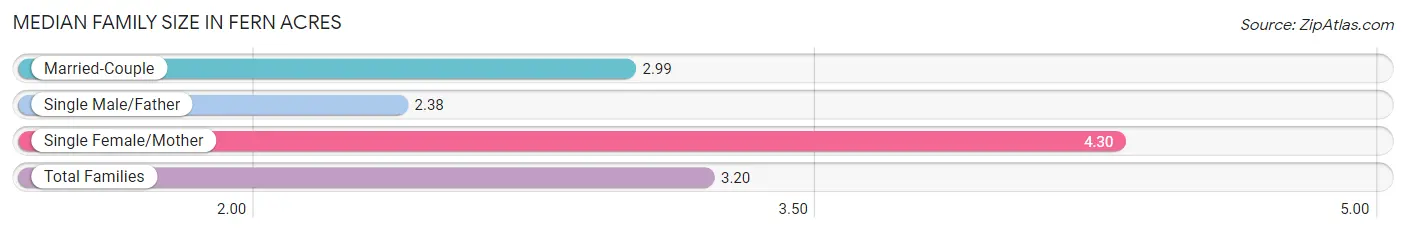
| Family Type | # Families | Family Size |
| Married-Couple | 275 (63.8%) | 2.99 |
| Single Male/Father | 58 (13.5%) | 2.38 |
| Single Female/Mother | 98 (22.7%) | 4.30 |
| Total Families | 431 (100.0%) | 3.20 |
Median Household Size in Fern Acres
The median household size in Fern Acres is 2.83 persons per household, with single female/mother households (98 | 15.6%) accounting for the largest median household size of 5.33 persons per household. non-family households (199 | 31.6%) represent the smallest median household size with 1.37 persons per household.
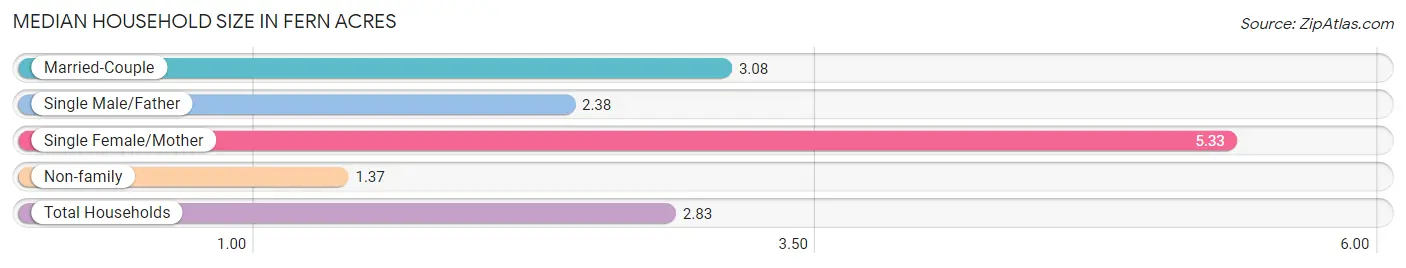
| Household Type | # Households | Household Size |
| Married-Couple | 275 (43.6%) | 3.08 |
| Single Male/Father | 58 (9.2%) | 2.38 |
| Single Female/Mother | 98 (15.6%) | 5.33 |
| Non-family | 199 (31.6%) | 1.37 |
| Total Households | 630 (100.0%) | 2.83 |
Household Size by Marriage Status in Fern Acres
Out of a total of 630 households in Fern Acres, 431 (68.4%) are family households, while 199 (31.6%) are nonfamily households. The most numerous type of family households are 2-person households, comprising 228, and the most common type of nonfamily households are 1-person households, comprising 150.
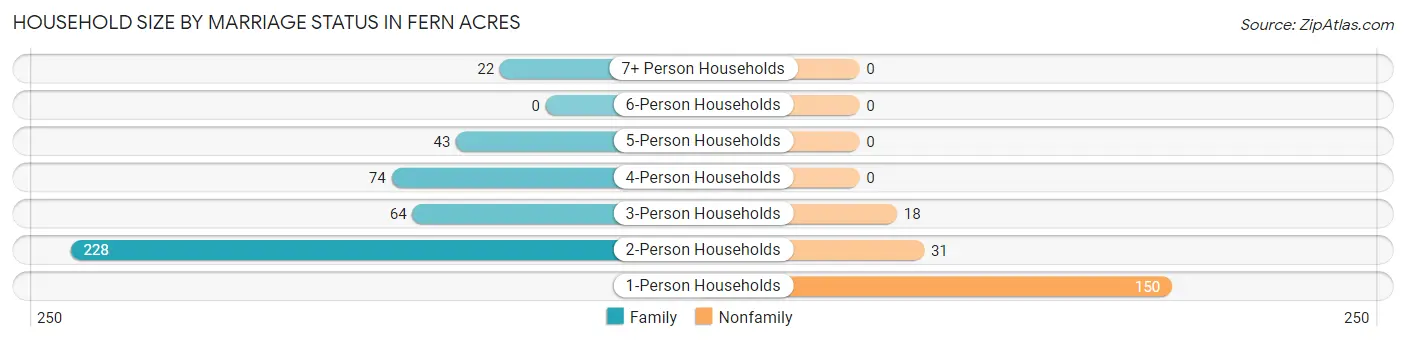
| Household Size | Family Households | Nonfamily Households |
| 1-Person Households | - | 150 (23.8%) |
| 2-Person Households | 228 (36.2%) | 31 (4.9%) |
| 3-Person Households | 64 (10.2%) | 18 (2.9%) |
| 4-Person Households | 74 (11.7%) | 0 (0.0%) |
| 5-Person Households | 43 (6.8%) | 0 (0.0%) |
| 6-Person Households | 0 (0.0%) | 0 (0.0%) |
| 7+ Person Households | 22 (3.5%) | 0 (0.0%) |
| Total | 431 (68.4%) | 199 (31.6%) |
Female Fertility in Fern Acres
Fertility by Age in Fern Acres
Average fertility rate in Fern Acres is 25.0 births per 1,000 women. Women in the age bracket of 20 to 34 years have the highest fertility rate with 44.0 births per 1,000 women. Women in the age bracket of 20 to 34 years acount for 100.0% of all women with births.
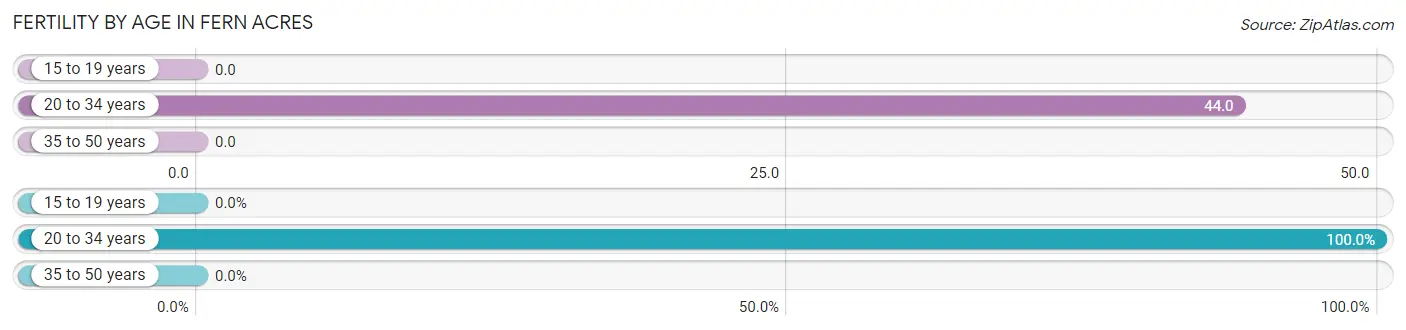
| Age Bracket | Women with Births | Births / 1,000 Women |
| 15 to 19 years | 0 (0.0%) | 0.0 |
| 20 to 34 years | 9 (100.0%) | 44.0 |
| 35 to 50 years | 0 (0.0%) | 0.0 |
| Total | 9 (100.0%) | 25.0 |
Fertility by Age by Marriage Status in Fern Acres
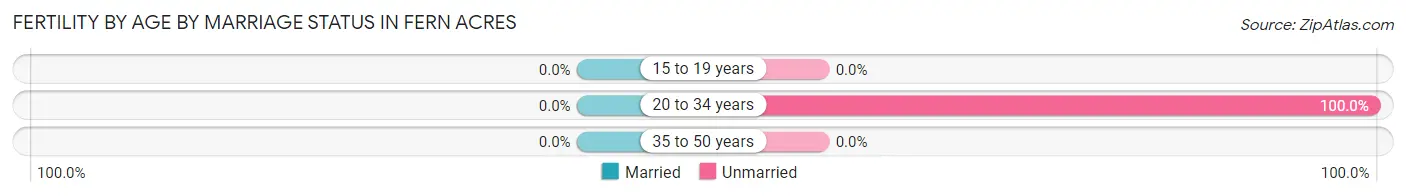
| Age Bracket | Married | Unmarried |
| 15 to 19 years | 0 (0.0%) | 0 (0.0%) |
| 20 to 34 years | 0 (0.0%) | 9 (100.0%) |
| 35 to 50 years | 0 (0.0%) | 0 (0.0%) |
| Total | 0 (0.0%) | 9 (100.0%) |
Fertility by Education in Fern Acres
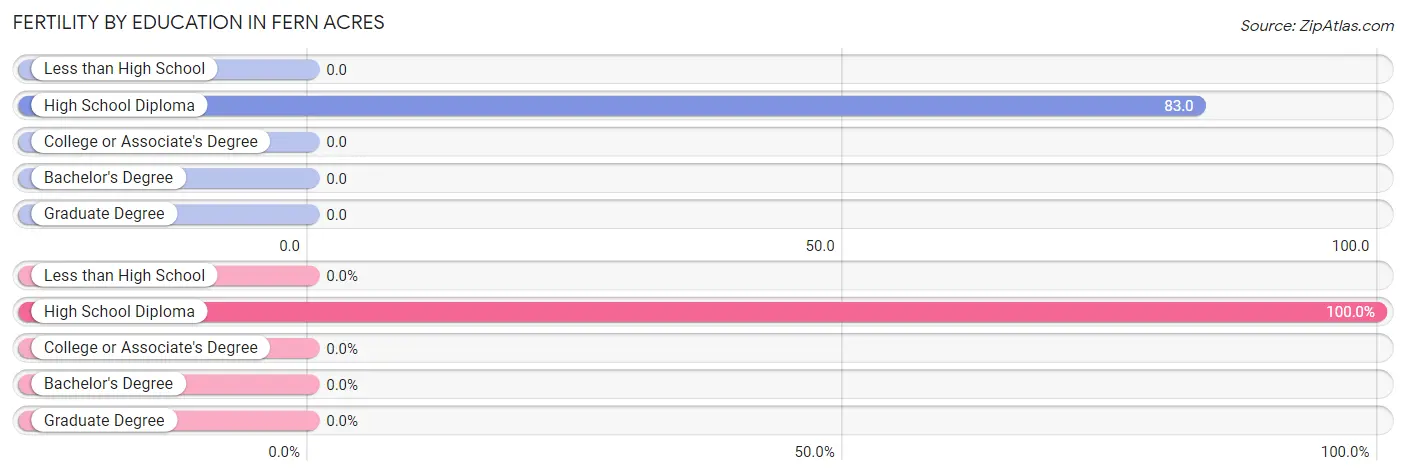
| Educational Attainment | Women with Births | Births / 1,000 Women |
| Less than High School | 0 (0.0%) | 0.0 |
| High School Diploma | 9 (100.0%) | 83.0 |
| College or Associate's Degree | 0 (0.0%) | 0.0 |
| Bachelor's Degree | 0 (0.0%) | 0.0 |
| Graduate Degree | 0 (0.0%) | 0.0 |
| Total | 9 (100.0%) | 25.0 |
Fertility by Education by Marriage Status in Fern Acres
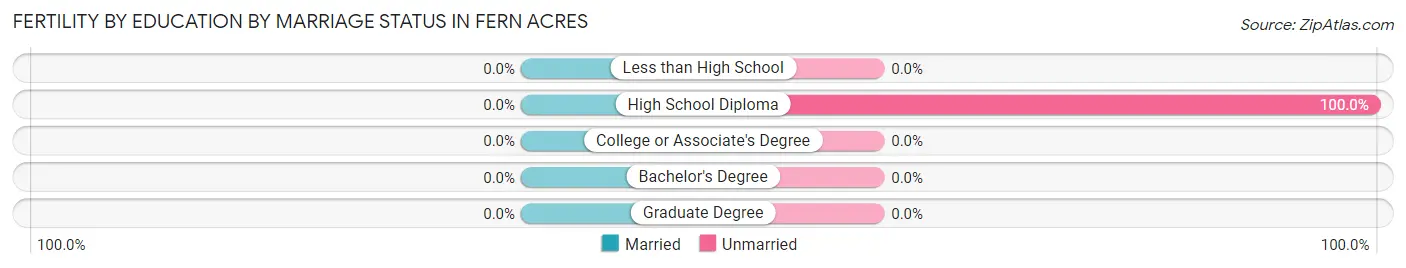
| Educational Attainment | Married | Unmarried |
| Less than High School | 0 (0.0%) | 0 (0.0%) |
| High School Diploma | 0 (0.0%) | 9 (100.0%) |
| College or Associate's Degree | 0 (0.0%) | 0 (0.0%) |
| Bachelor's Degree | 0 (0.0%) | 0 (0.0%) |
| Graduate Degree | 0 (0.0%) | 0 (0.0%) |
| Total | 0 (0.0%) | 9 (100.0%) |
Employment Characteristics in Fern Acres
Employment by Class of Employer in Fern Acres
Among the 578 employed individuals in Fern Acres, private company employees (397 | 68.7%), self-employed (not incorporated) (64 | 11.1%), and state government employees (29 | 5.0%) make up the most common classes of employment.
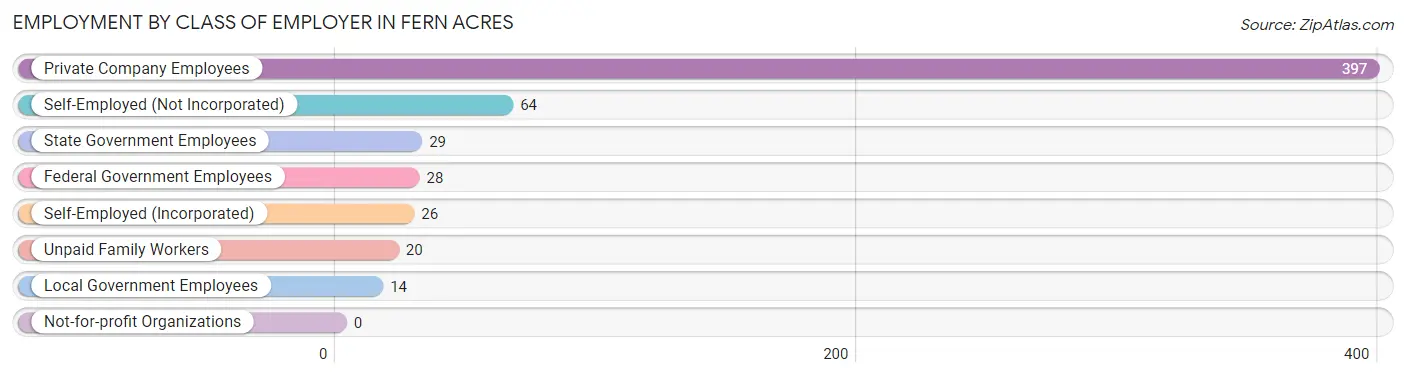
| Employer Class | # Employees | % Employees |
| Private Company Employees | 397 | 68.7% |
| Self-Employed (Incorporated) | 26 | 4.5% |
| Self-Employed (Not Incorporated) | 64 | 11.1% |
| Not-for-profit Organizations | 0 | 0.0% |
| Local Government Employees | 14 | 2.4% |
| State Government Employees | 29 | 5.0% |
| Federal Government Employees | 28 | 4.8% |
| Unpaid Family Workers | 20 | 3.5% |
| Total | 578 | 100.0% |
Employment Status by Age in Fern Acres
According to the labor force statistics for Fern Acres, out of the total population over 16 years of age (1,543), 47.9% or 739 individuals are in the labor force, with 17.1% or 126 of them unemployed. The age group with the highest labor force participation rate is 45 to 54 years, with 93.8% or 210 individuals in the labor force. Within the labor force, the 16 to 19 years age range has the highest percentage of unemployed individuals, with 100.0% or 74 of them being unemployed.
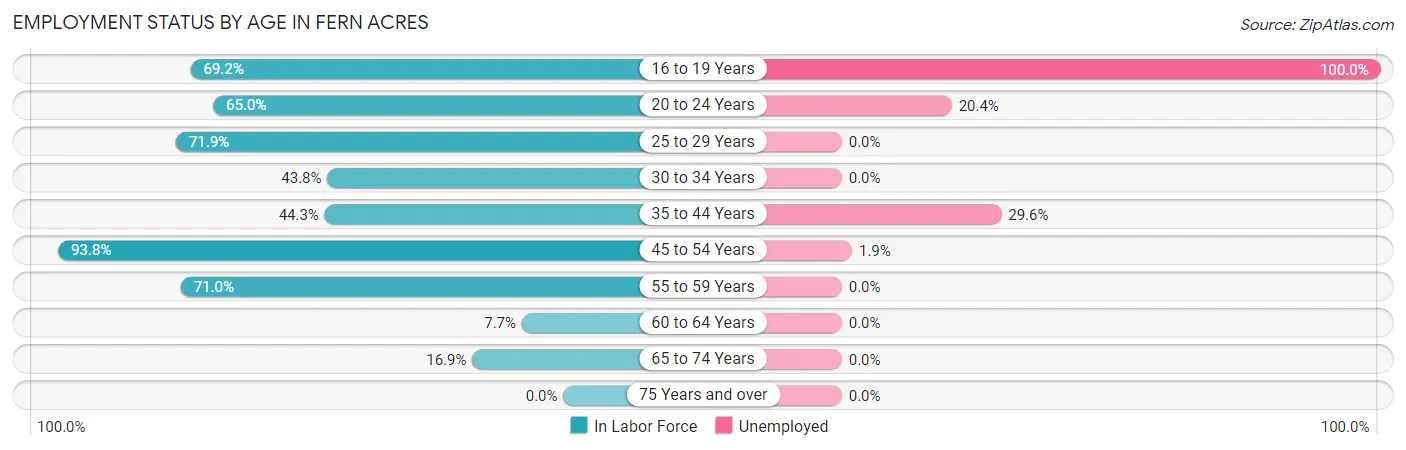
| Age Bracket | In Labor Force | Unemployed |
| 16 to 19 Years | 74 (69.2%) | 74 (100.0%) |
| 20 to 24 Years | 93 (65.0%) | 19 (20.4%) |
| 25 to 29 Years | 46 (71.9%) | 0 (0.0%) |
| 30 to 34 Years | 42 (43.8%) | 0 (0.0%) |
| 35 to 44 Years | 98 (44.3%) | 29 (29.6%) |
| 45 to 54 Years | 210 (93.8%) | 4 (1.9%) |
| 55 to 59 Years | 120 (71.0%) | 0 (0.0%) |
| 60 to 64 Years | 12 (7.7%) | 0 (0.0%) |
| 65 to 74 Years | 44 (16.9%) | 0 (0.0%) |
| 75 Years and over | 0 (0.0%) | 0 (0.0%) |
| Total | 739 (47.9%) | 126 (17.1%) |
Employment Status by Educational Attainment in Fern Acres
According to labor force statistics for Fern Acres, 56.8% of individuals (528) out of the total population between 25 and 64 years of age (930) are in the labor force, with 6.3% or 33 of them being unemployed. The group with the highest labor force participation rate are those with the educational attainment of college / associate degree, with 71.3% or 216 individuals in the labor force. Within the labor force, individuals with college / associate degree education have the highest percentage of unemployment, with 15.3% or 33 of them being unemployed.
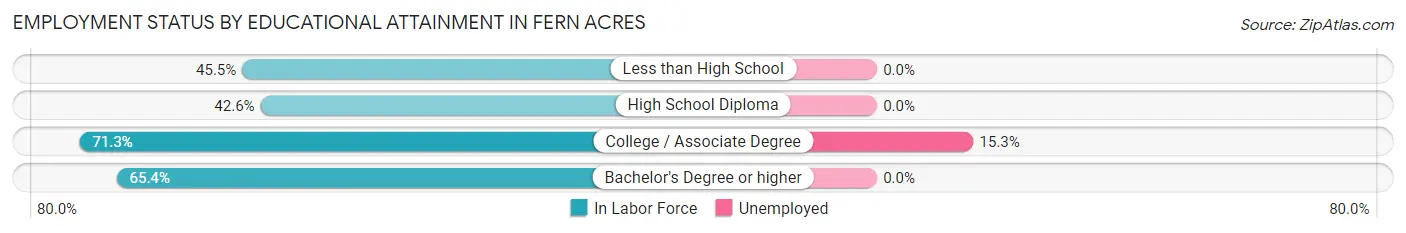
| Educational Attainment | In Labor Force | Unemployed |
| Less than High School | 30 (45.5%) | 0 (0.0%) |
| High School Diploma | 159 (42.6%) | 0 (0.0%) |
| College / Associate Degree | 216 (71.3%) | 46 (15.3%) |
| Bachelor's Degree or higher | 123 (65.4%) | 0 (0.0%) |
| Total | 528 (56.8%) | 59 (6.3%) |
Employment Occupations by Sex in Fern Acres
Management, Business, Science and Arts Occupations
The most common Management, Business, Science and Arts occupations in Fern Acres are Management (76 | 12.4%), Community & Social Service (29 | 4.7%), Education Instruction & Library (29 | 4.7%), Health Diagnosing & Treating (27 | 4.4%), and Health Technologists (27 | 4.4%).
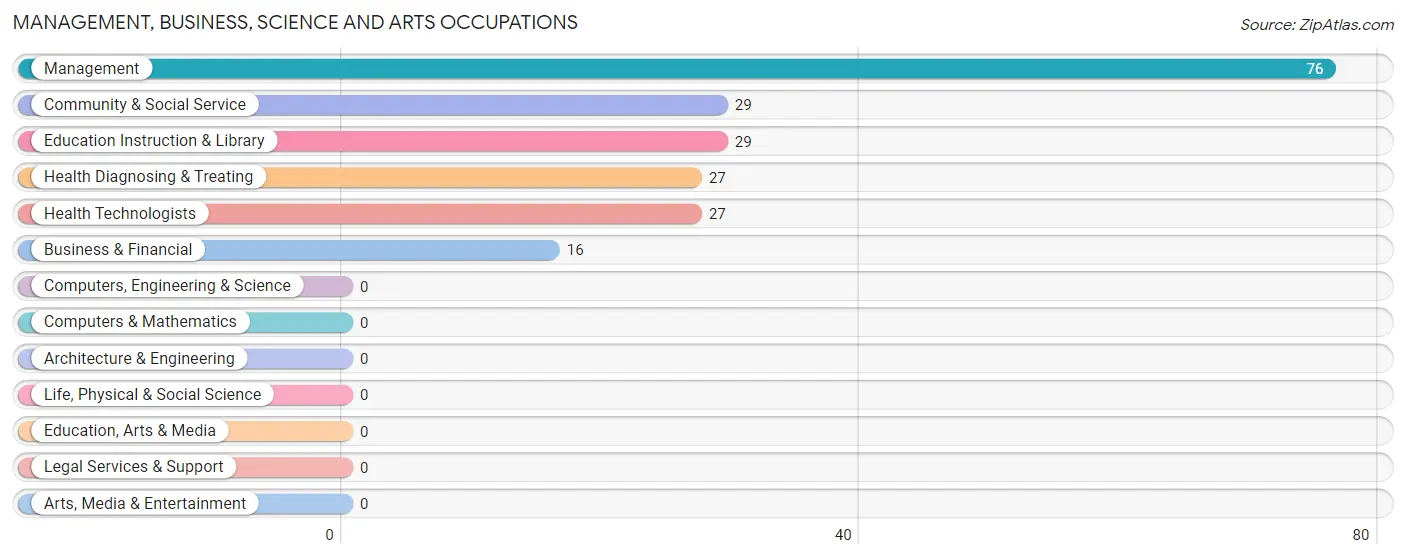
Management, Business, Science and Arts Occupations by Sex
Within the Management, Business, Science and Arts occupations in Fern Acres, the most male-oriented occupations are Community & Social Service (48.3%), Education Instruction & Library (48.3%), and Management (47.4%), while the most female-oriented occupations are Business & Financial (100.0%), Health Diagnosing & Treating (100.0%), and Health Technologists (100.0%).
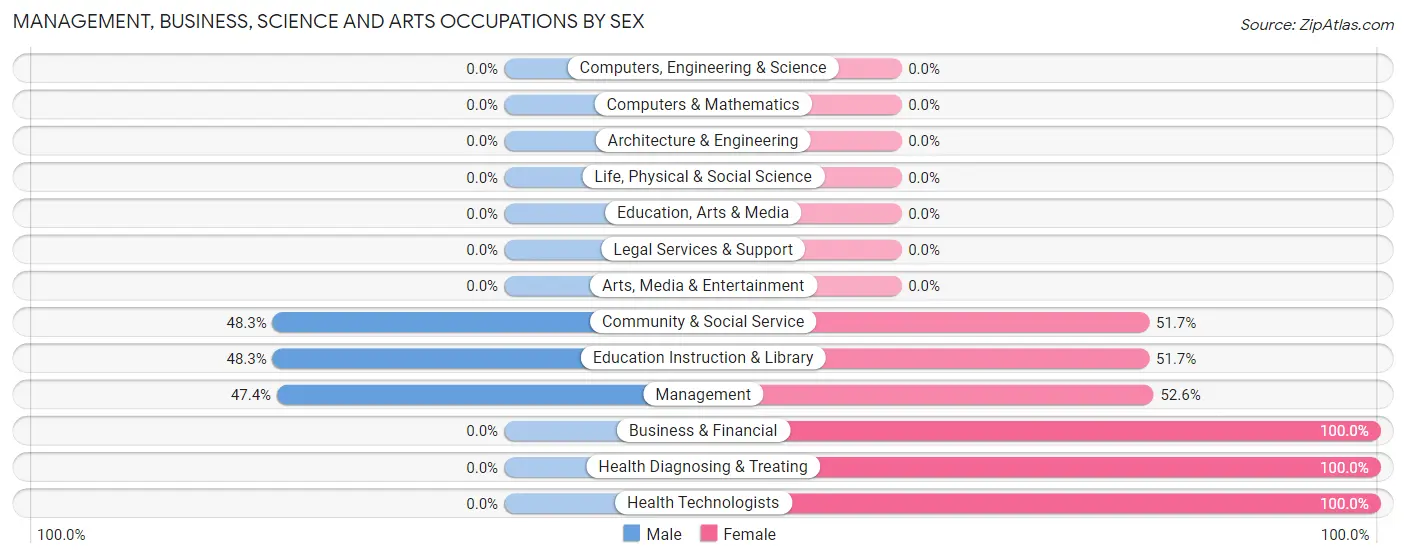
| Occupation | Male | Female |
| Management | 36 (47.4%) | 40 (52.6%) |
| Business & Financial | 0 (0.0%) | 16 (100.0%) |
| Computers, Engineering & Science | 0 (0.0%) | 0 (0.0%) |
| Computers & Mathematics | 0 (0.0%) | 0 (0.0%) |
| Architecture & Engineering | 0 (0.0%) | 0 (0.0%) |
| Life, Physical & Social Science | 0 (0.0%) | 0 (0.0%) |
| Community & Social Service | 14 (48.3%) | 15 (51.7%) |
| Education, Arts & Media | 0 (0.0%) | 0 (0.0%) |
| Legal Services & Support | 0 (0.0%) | 0 (0.0%) |
| Education Instruction & Library | 14 (48.3%) | 15 (51.7%) |
| Arts, Media & Entertainment | 0 (0.0%) | 0 (0.0%) |
| Health Diagnosing & Treating | 0 (0.0%) | 27 (100.0%) |
| Health Technologists | 0 (0.0%) | 27 (100.0%) |
| Total (Category) | 50 (33.8%) | 98 (66.2%) |
| Total (Overall) | 298 (48.6%) | 315 (51.4%) |
Services Occupations
The most common Services occupations in Fern Acres are Food Preparation & Serving (67 | 10.9%), Healthcare Support (30 | 4.9%), Security & Protection (15 | 2.5%), and Firefighting & Prevention (15 | 2.5%).
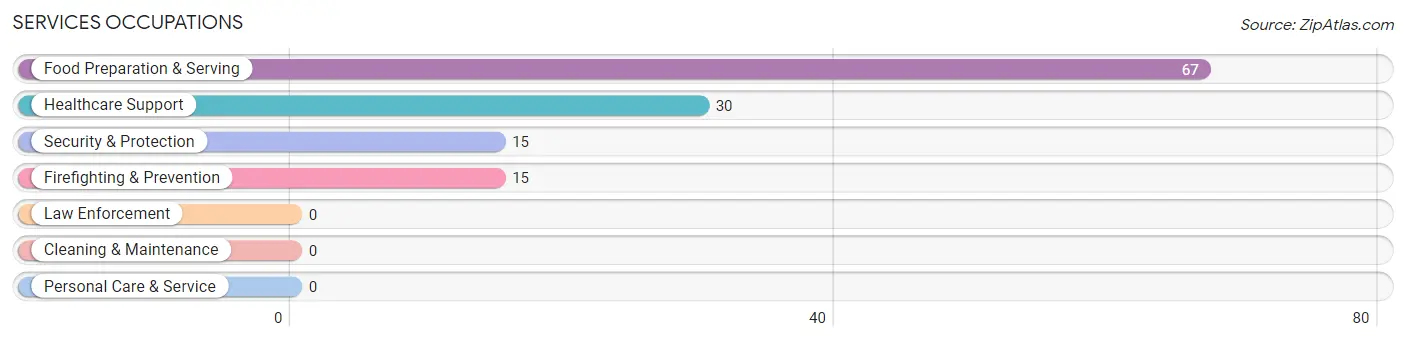
Services Occupations by Sex
Within the Services occupations in Fern Acres, the most male-oriented occupations are Security & Protection (100.0%), Firefighting & Prevention (100.0%), and Healthcare Support (70.0%), while the most female-oriented occupations are Food Preparation & Serving (76.1%), and Healthcare Support (30.0%).
| Occupation | Male | Female |
| Healthcare Support | 21 (70.0%) | 9 (30.0%) |
| Security & Protection | 15 (100.0%) | 0 (0.0%) |
| Firefighting & Prevention | 15 (100.0%) | 0 (0.0%) |
| Law Enforcement | 0 (0.0%) | 0 (0.0%) |
| Food Preparation & Serving | 16 (23.9%) | 51 (76.1%) |
| Cleaning & Maintenance | 0 (0.0%) | 0 (0.0%) |
| Personal Care & Service | 0 (0.0%) | 0 (0.0%) |
| Total (Category) | 52 (46.4%) | 60 (53.6%) |
| Total (Overall) | 298 (48.6%) | 315 (51.4%) |
Sales and Office Occupations
The most common Sales and Office occupations in Fern Acres are Office & Administration (78 | 12.7%), and Sales & Related (66 | 10.8%).
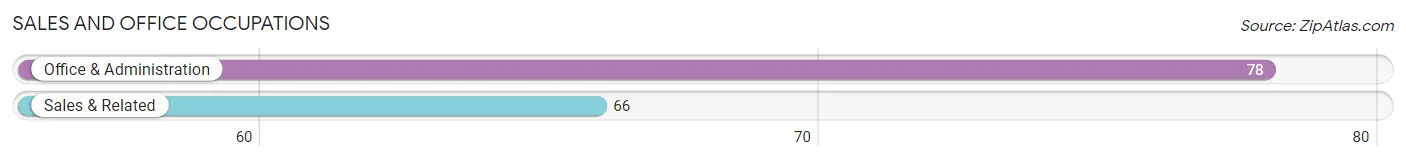
Sales and Office Occupations by Sex
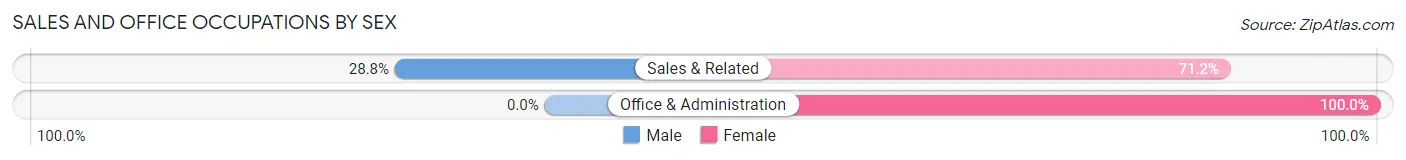
| Occupation | Male | Female |
| Sales & Related | 19 (28.8%) | 47 (71.2%) |
| Office & Administration | 0 (0.0%) | 78 (100.0%) |
| Total (Category) | 19 (13.2%) | 125 (86.8%) |
| Total (Overall) | 298 (48.6%) | 315 (51.4%) |
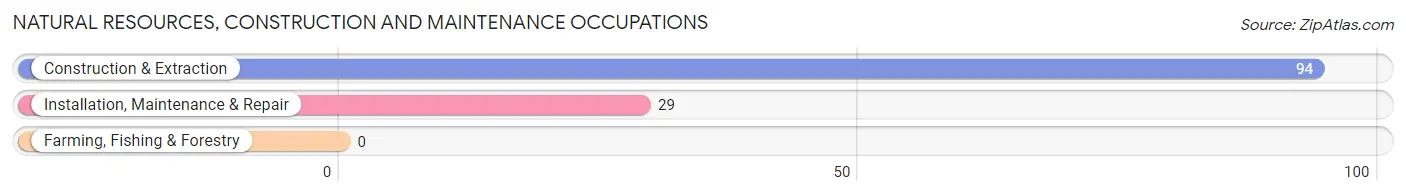
Natural Resources, Construction and Maintenance Occupations
The most common Natural Resources, Construction and Maintenance occupations in Fern Acres are Construction & Extraction (94 | 15.3%), and Installation, Maintenance & Repair (29 | 4.7%).
Natural Resources, Construction and Maintenance Occupations by Sex
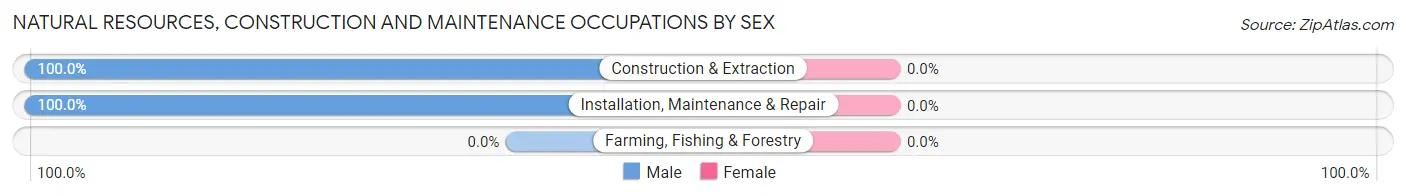
| Occupation | Male | Female |
| Farming, Fishing & Forestry | 0 (0.0%) | 0 (0.0%) |
| Construction & Extraction | 94 (100.0%) | 0 (0.0%) |
| Installation, Maintenance & Repair | 29 (100.0%) | 0 (0.0%) |
| Total (Category) | 123 (100.0%) | 0 (0.0%) |
| Total (Overall) | 298 (48.6%) | 315 (51.4%) |
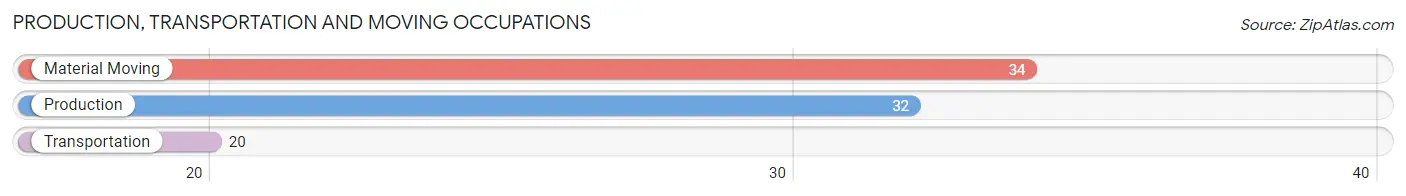
Production, Transportation and Moving Occupations
The most common Production, Transportation and Moving occupations in Fern Acres are Material Moving (34 | 5.6%), Production (32 | 5.2%), and Transportation (20 | 3.3%).
Production, Transportation and Moving Occupations by Sex
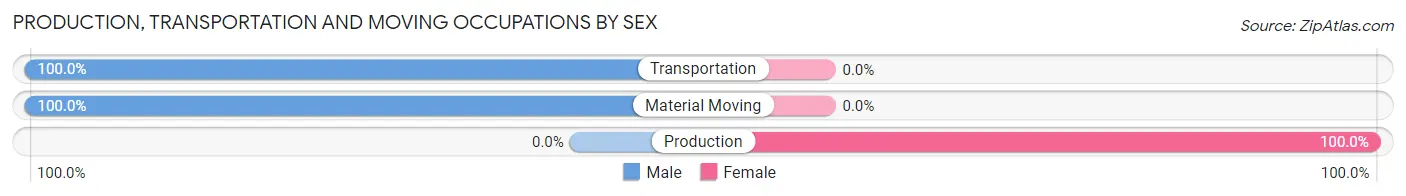
| Occupation | Male | Female |
| Production | 0 (0.0%) | 32 (100.0%) |
| Transportation | 20 (100.0%) | 0 (0.0%) |
| Material Moving | 34 (100.0%) | 0 (0.0%) |
| Total (Category) | 54 (62.8%) | 32 (37.2%) |
| Total (Overall) | 298 (48.6%) | 315 (51.4%) |
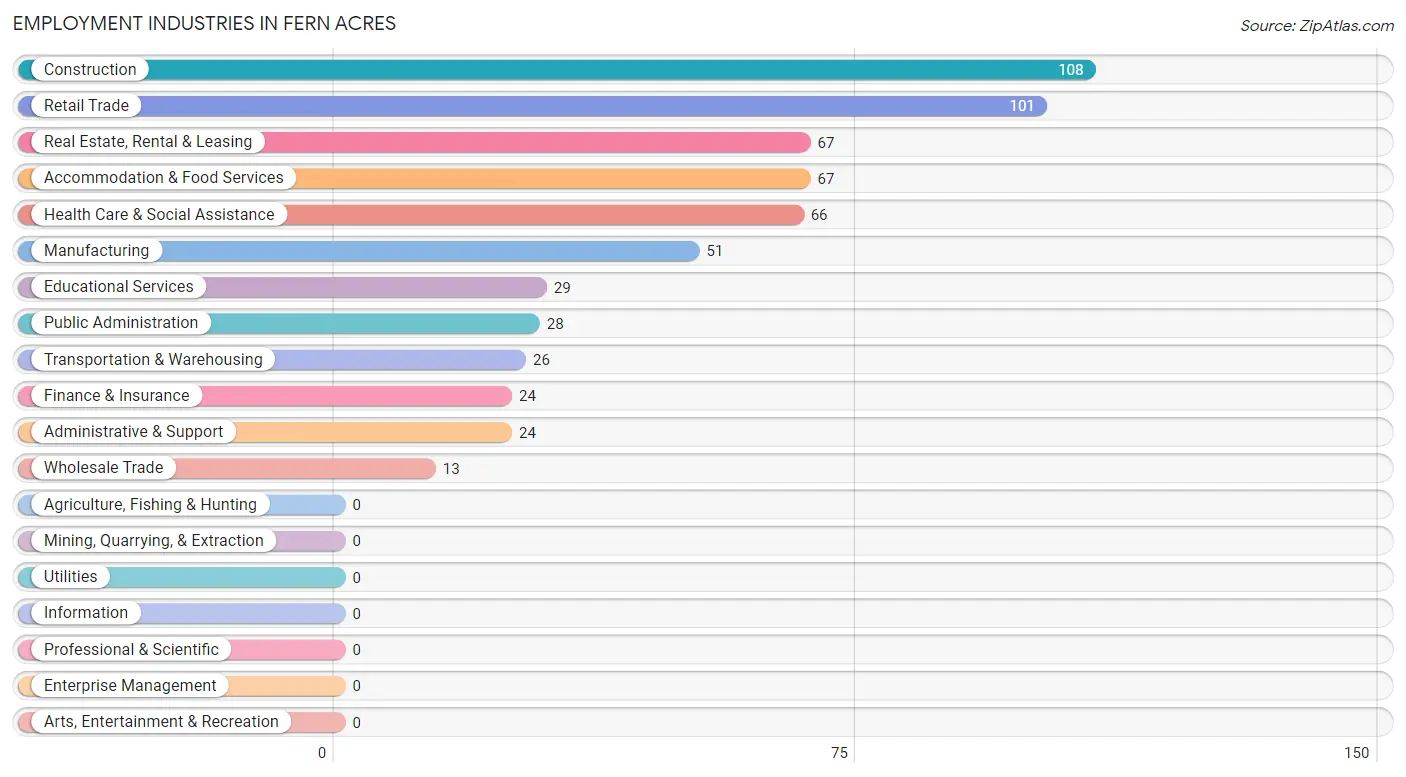
Employment Industries by Sex in Fern Acres
Employment Industries in Fern Acres
The major employment industries in Fern Acres include Construction (108 | 17.6%), Retail Trade (101 | 16.5%), Real Estate, Rental & Leasing (67 | 10.9%), Accommodation & Food Services (67 | 10.9%), and Health Care & Social Assistance (66 | 10.8%).
Employment Industries by Sex in Fern Acres
The Fern Acres industries that see more men than women are Construction (88.9%), Transportation & Warehousing (76.9%), and Retail Trade (67.3%), whereas the industries that tend to have a higher number of women are Wholesale Trade (100.0%), Finance & Insurance (100.0%), and Administrative & Support (100.0%).
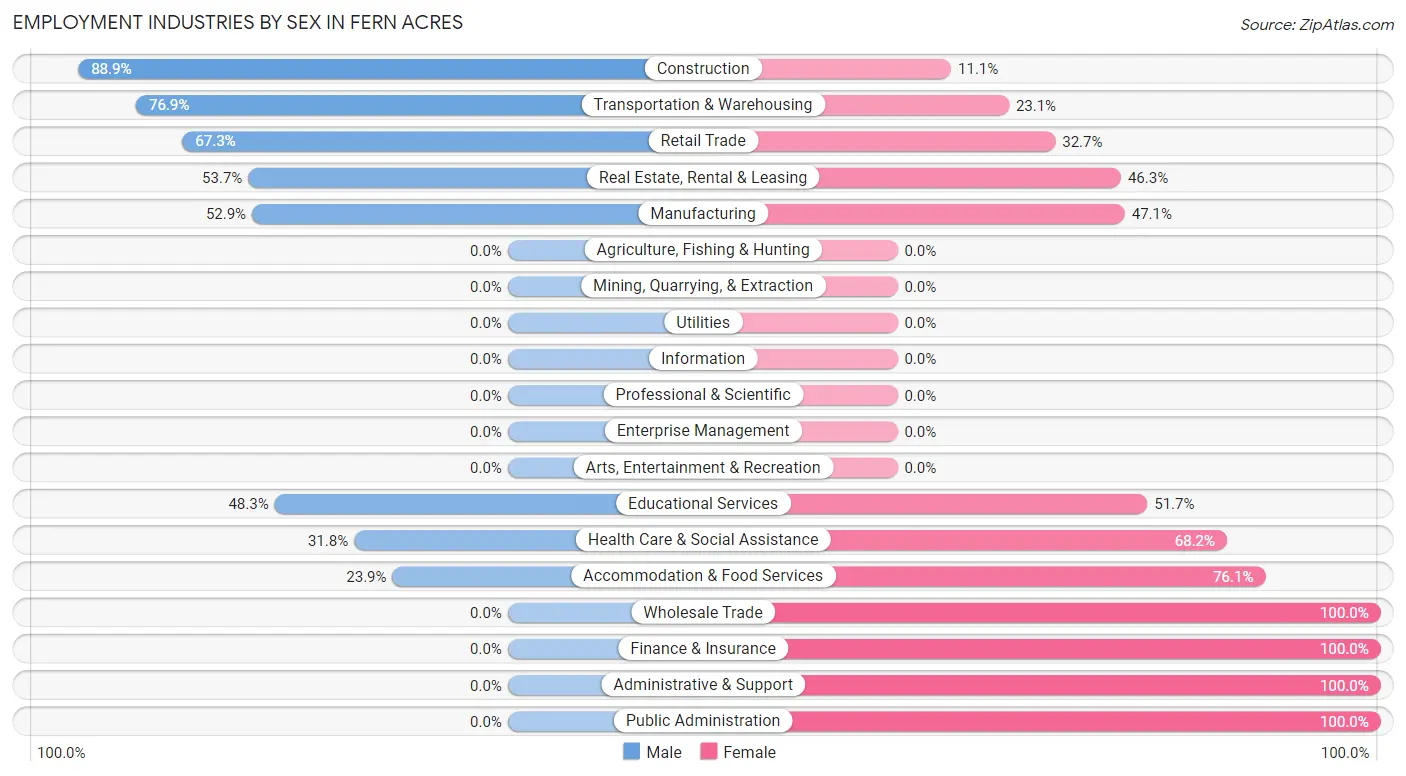
| Industry | Male | Female |
| Agriculture, Fishing & Hunting | 0 (0.0%) | 0 (0.0%) |
| Mining, Quarrying, & Extraction | 0 (0.0%) | 0 (0.0%) |
| Construction | 96 (88.9%) | 12 (11.1%) |
| Manufacturing | 27 (52.9%) | 24 (47.1%) |
| Wholesale Trade | 0 (0.0%) | 13 (100.0%) |
| Retail Trade | 68 (67.3%) | 33 (32.7%) |
| Transportation & Warehousing | 20 (76.9%) | 6 (23.1%) |
| Utilities | 0 (0.0%) | 0 (0.0%) |
| Information | 0 (0.0%) | 0 (0.0%) |
| Finance & Insurance | 0 (0.0%) | 24 (100.0%) |
| Real Estate, Rental & Leasing | 36 (53.7%) | 31 (46.3%) |
| Professional & Scientific | 0 (0.0%) | 0 (0.0%) |
| Enterprise Management | 0 (0.0%) | 0 (0.0%) |
| Administrative & Support | 0 (0.0%) | 24 (100.0%) |
| Educational Services | 14 (48.3%) | 15 (51.7%) |
| Health Care & Social Assistance | 21 (31.8%) | 45 (68.2%) |
| Arts, Entertainment & Recreation | 0 (0.0%) | 0 (0.0%) |
| Accommodation & Food Services | 16 (23.9%) | 51 (76.1%) |
| Public Administration | 0 (0.0%) | 28 (100.0%) |
| Total | 298 (48.6%) | 315 (51.4%) |
Education in Fern Acres
School Enrollment in Fern Acres
The most common levels of schooling among the 290 students in Fern Acres are middle school (82 | 28.3%), college / undergraduate (51 | 17.6%), and high school (49 | 16.9%).
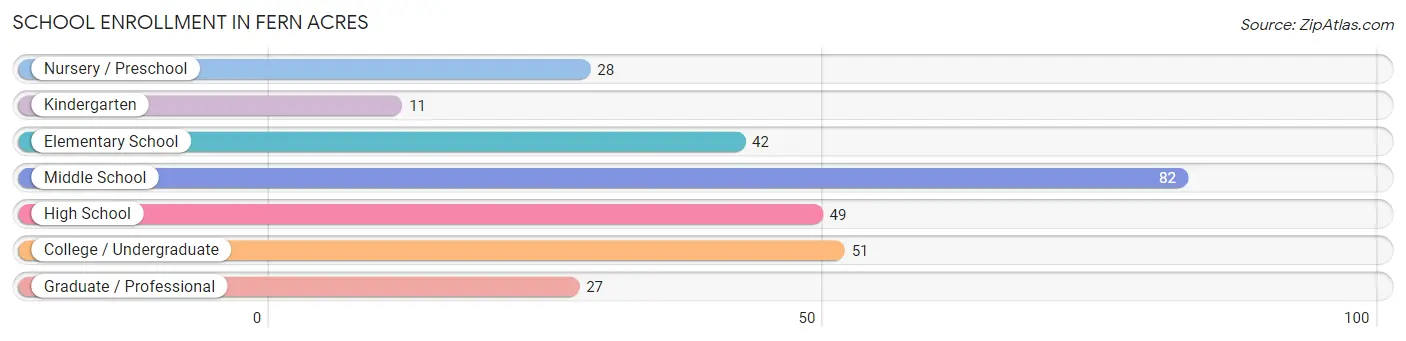
| School Level | # Students | % Students |
| Nursery / Preschool | 28 | 9.7% |
| Kindergarten | 11 | 3.8% |
| Elementary School | 42 | 14.5% |
| Middle School | 82 | 28.3% |
| High School | 49 | 16.9% |
| College / Undergraduate | 51 | 17.6% |
| Graduate / Professional | 27 | 9.3% |
| Total | 290 | 100.0% |
School Enrollment by Age by Funding Source in Fern Acres
Out of a total of 290 students who are enrolled in schools in Fern Acres, 53 (18.3%) attend a private institution, while the remaining 237 (81.7%) are enrolled in public schools. The age group of 3 to 4 year olds has the highest likelihood of being enrolled in private schools, with 16 (57.1% in the age bracket) enrolled. Conversely, the age group of 5 to 9 year old has the lowest likelihood of being enrolled in a private school, with 38 (100.0% in the age bracket) attending a public institution.
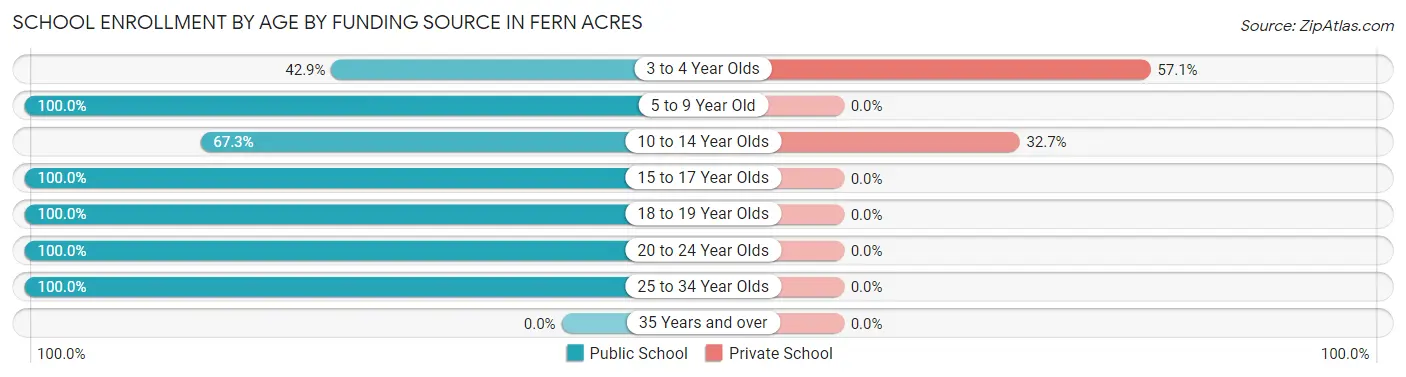
| Age Bracket | Public School | Private School |
| 3 to 4 Year Olds | 12 (42.9%) | 16 (57.1%) |
| 5 to 9 Year Old | 38 (100.0%) | 0 (0.0%) |
| 10 to 14 Year Olds | 76 (67.3%) | 37 (32.7%) |
| 15 to 17 Year Olds | 33 (100.0%) | 0 (0.0%) |
| 18 to 19 Year Olds | 17 (100.0%) | 0 (0.0%) |
| 20 to 24 Year Olds | 34 (100.0%) | 0 (0.0%) |
| 25 to 34 Year Olds | 27 (100.0%) | 0 (0.0%) |
| 35 Years and over | 0 (0.0%) | 0 (0.0%) |
| Total | 237 (81.7%) | 53 (18.3%) |
Educational Attainment by Field of Study in Fern Acres
Literature & languages (48 | 18.8%), visual & performing arts (44 | 17.2%), bio, nature & agricultural (33 | 12.9%), social sciences (28 | 10.9%), and science & technology (26 | 10.2%) are the most common fields of study among 256 individuals in Fern Acres who have obtained a bachelor's degree or higher.
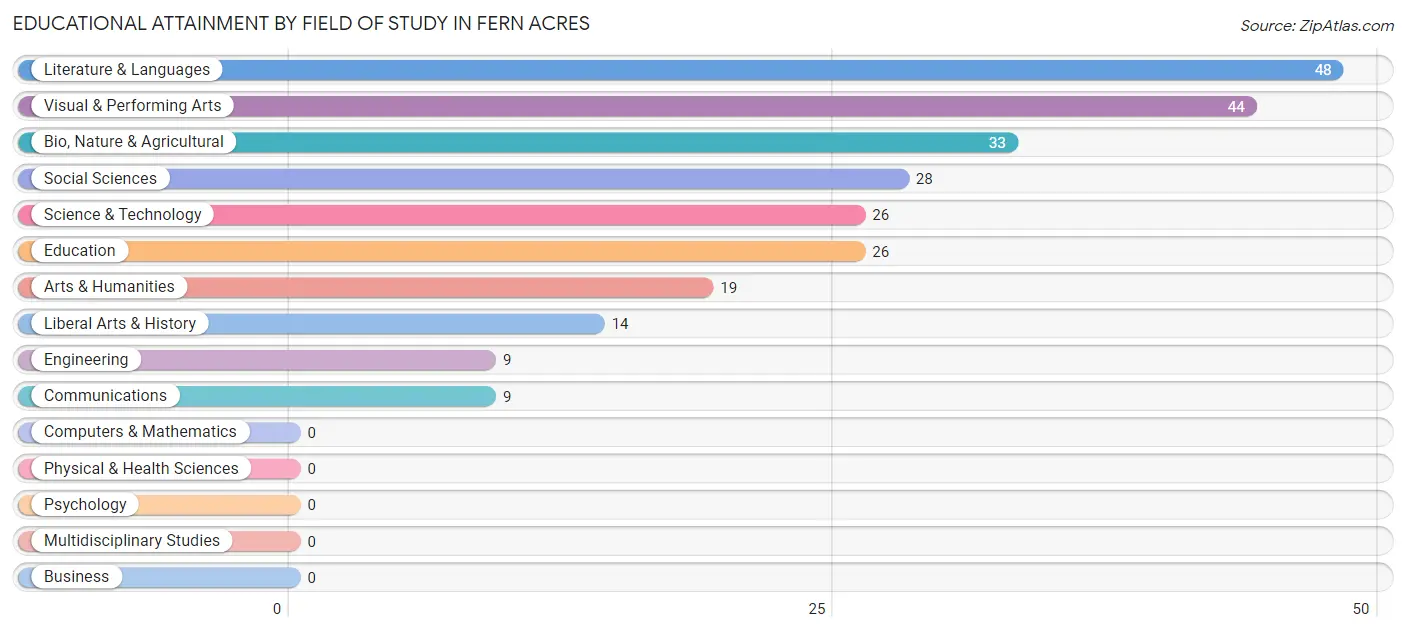
| Field of Study | # Graduates | % Graduates |
| Computers & Mathematics | 0 | 0.0% |
| Bio, Nature & Agricultural | 33 | 12.9% |
| Physical & Health Sciences | 0 | 0.0% |
| Psychology | 0 | 0.0% |
| Social Sciences | 28 | 10.9% |
| Engineering | 9 | 3.5% |
| Multidisciplinary Studies | 0 | 0.0% |
| Science & Technology | 26 | 10.2% |
| Business | 0 | 0.0% |
| Education | 26 | 10.2% |
| Literature & Languages | 48 | 18.8% |
| Liberal Arts & History | 14 | 5.5% |
| Visual & Performing Arts | 44 | 17.2% |
| Communications | 9 | 3.5% |
| Arts & Humanities | 19 | 7.4% |
| Total | 256 | 100.0% |
Transportation & Commute in Fern Acres
Vehicle Availability by Sex in Fern Acres
The most prevalent vehicle ownership categories in Fern Acres are males with 2 vehicles (101, accounting for 38.4%) and females with 2 vehicles (223, making up 32.1%).
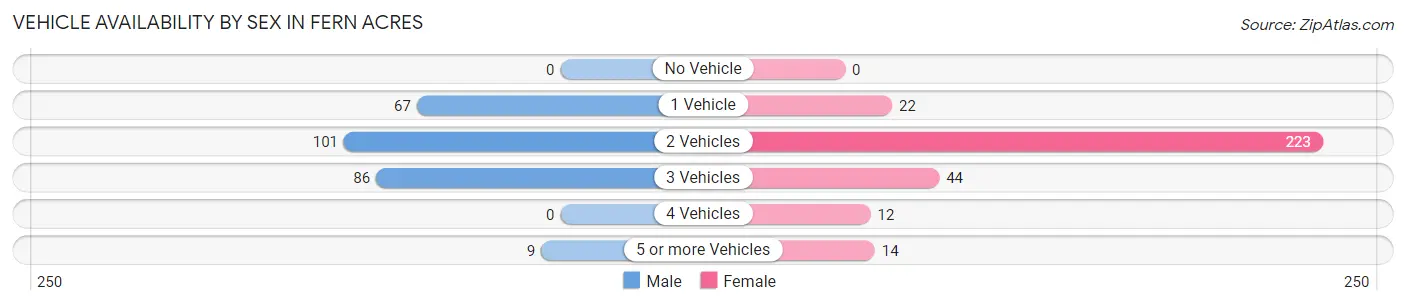
| Vehicles Available | Male | Female |
| No Vehicle | 0 (0.0%) | 0 (0.0%) |
| 1 Vehicle | 67 (25.5%) | 22 (7.0%) |
| 2 Vehicles | 101 (38.4%) | 223 (70.8%) |
| 3 Vehicles | 86 (32.7%) | 44 (14.0%) |
| 4 Vehicles | 0 (0.0%) | 12 (3.8%) |
| 5 or more Vehicles | 9 (3.4%) | 14 (4.4%) |
| Total | 263 (100.0%) | 315 (100.0%) |
Commute Time in Fern Acres
The most frequently occuring commute durations in Fern Acres are 30 to 34 minutes (126 commuters, 21.8%), 40 to 44 minutes (99 commuters, 17.1%), and 15 to 19 minutes (63 commuters, 10.9%).
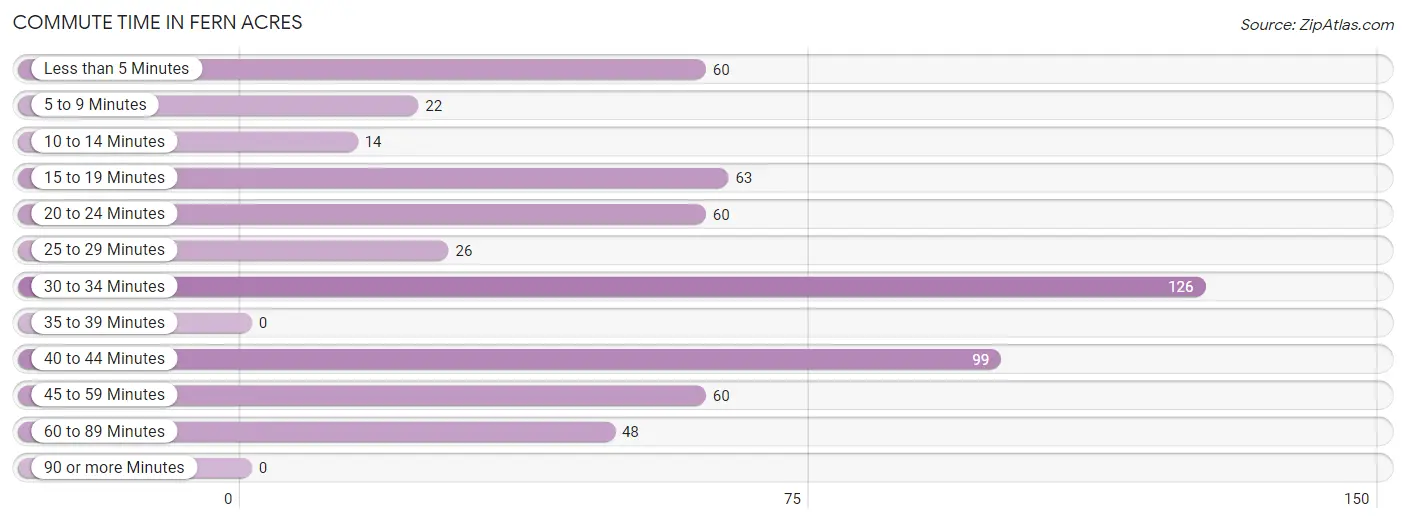
| Commute Time | # Commuters | % Commuters |
| Less than 5 Minutes | 60 | 10.4% |
| 5 to 9 Minutes | 22 | 3.8% |
| 10 to 14 Minutes | 14 | 2.4% |
| 15 to 19 Minutes | 63 | 10.9% |
| 20 to 24 Minutes | 60 | 10.4% |
| 25 to 29 Minutes | 26 | 4.5% |
| 30 to 34 Minutes | 126 | 21.8% |
| 35 to 39 Minutes | 0 | 0.0% |
| 40 to 44 Minutes | 99 | 17.1% |
| 45 to 59 Minutes | 60 | 10.4% |
| 60 to 89 Minutes | 48 | 8.3% |
| 90 or more Minutes | 0 | 0.0% |
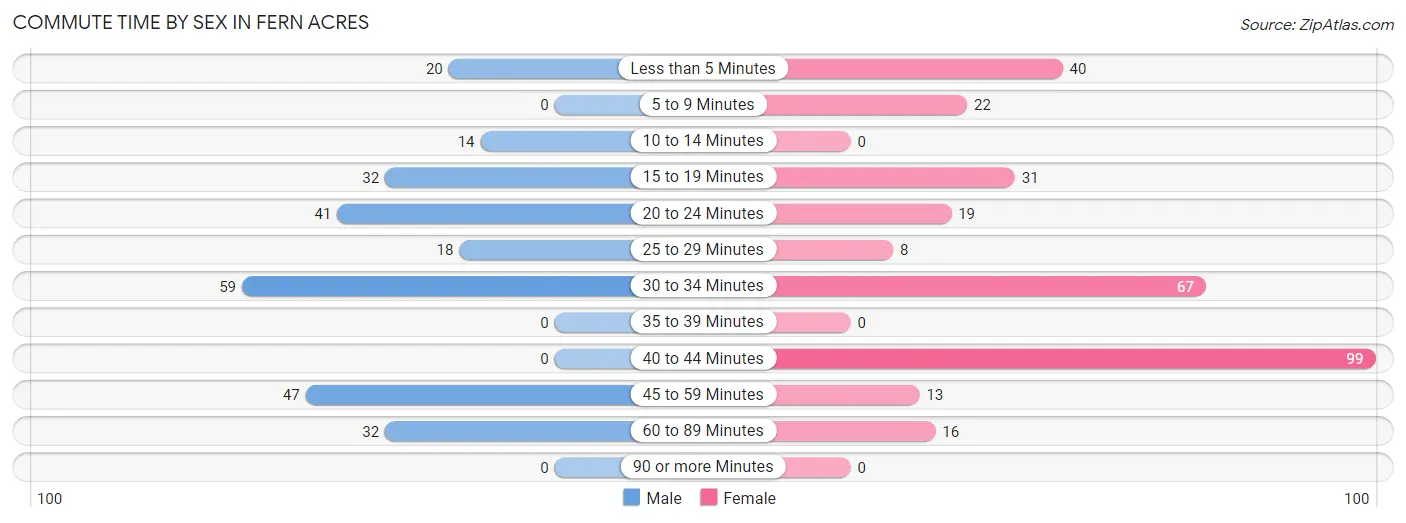
Commute Time by Sex in Fern Acres
The most common commute times in Fern Acres are 30 to 34 minutes (59 commuters, 22.4%) for males and 40 to 44 minutes (99 commuters, 31.4%) for females.
| Commute Time | Male | Female |
| Less than 5 Minutes | 20 (7.6%) | 40 (12.7%) |
| 5 to 9 Minutes | 0 (0.0%) | 22 (7.0%) |
| 10 to 14 Minutes | 14 (5.3%) | 0 (0.0%) |
| 15 to 19 Minutes | 32 (12.2%) | 31 (9.8%) |
| 20 to 24 Minutes | 41 (15.6%) | 19 (6.0%) |
| 25 to 29 Minutes | 18 (6.8%) | 8 (2.5%) |
| 30 to 34 Minutes | 59 (22.4%) | 67 (21.3%) |
| 35 to 39 Minutes | 0 (0.0%) | 0 (0.0%) |
| 40 to 44 Minutes | 0 (0.0%) | 99 (31.4%) |
| 45 to 59 Minutes | 47 (17.9%) | 13 (4.1%) |
| 60 to 89 Minutes | 32 (12.2%) | 16 (5.1%) |
| 90 or more Minutes | 0 (0.0%) | 0 (0.0%) |
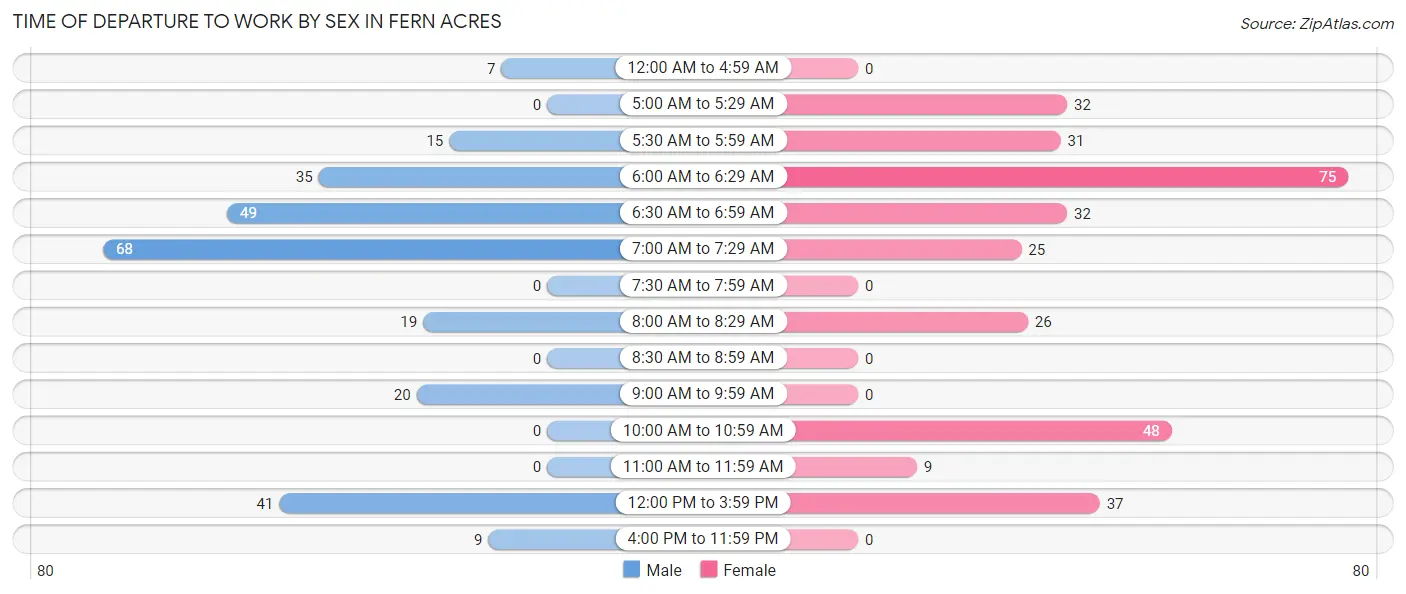
Time of Departure to Work by Sex in Fern Acres
The most frequent times of departure to work in Fern Acres are 7:00 AM to 7:29 AM (68, 25.9%) for males and 6:00 AM to 6:29 AM (75, 23.8%) for females.
| Time of Departure | Male | Female |
| 12:00 AM to 4:59 AM | 7 (2.7%) | 0 (0.0%) |
| 5:00 AM to 5:29 AM | 0 (0.0%) | 32 (10.2%) |
| 5:30 AM to 5:59 AM | 15 (5.7%) | 31 (9.8%) |
| 6:00 AM to 6:29 AM | 35 (13.3%) | 75 (23.8%) |
| 6:30 AM to 6:59 AM | 49 (18.6%) | 32 (10.2%) |
| 7:00 AM to 7:29 AM | 68 (25.9%) | 25 (7.9%) |
| 7:30 AM to 7:59 AM | 0 (0.0%) | 0 (0.0%) |
| 8:00 AM to 8:29 AM | 19 (7.2%) | 26 (8.3%) |
| 8:30 AM to 8:59 AM | 0 (0.0%) | 0 (0.0%) |
| 9:00 AM to 9:59 AM | 20 (7.6%) | 0 (0.0%) |
| 10:00 AM to 10:59 AM | 0 (0.0%) | 48 (15.2%) |
| 11:00 AM to 11:59 AM | 0 (0.0%) | 9 (2.9%) |
| 12:00 PM to 3:59 PM | 41 (15.6%) | 37 (11.7%) |
| 4:00 PM to 11:59 PM | 9 (3.4%) | 0 (0.0%) |
| Total | 263 (100.0%) | 315 (100.0%) |
Housing Occupancy in Fern Acres
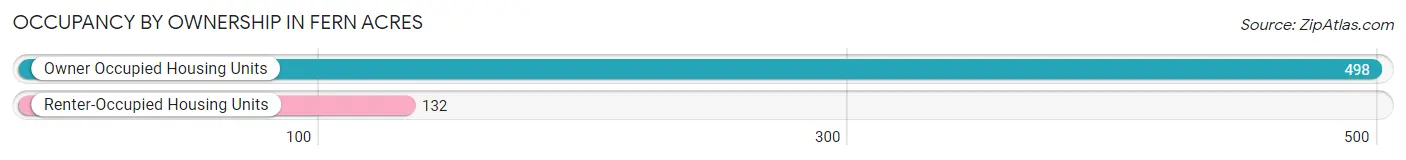
Occupancy by Ownership in Fern Acres
Of the total 630 dwellings in Fern Acres, owner-occupied units account for 498 (79.0%), while renter-occupied units make up 132 (20.9%).
| Occupancy | # Housing Units | % Housing Units |
| Owner Occupied Housing Units | 498 | 79.0% |
| Renter-Occupied Housing Units | 132 | 20.9% |
| Total Occupied Housing Units | 630 | 100.0% |
Occupancy by Household Size in Fern Acres
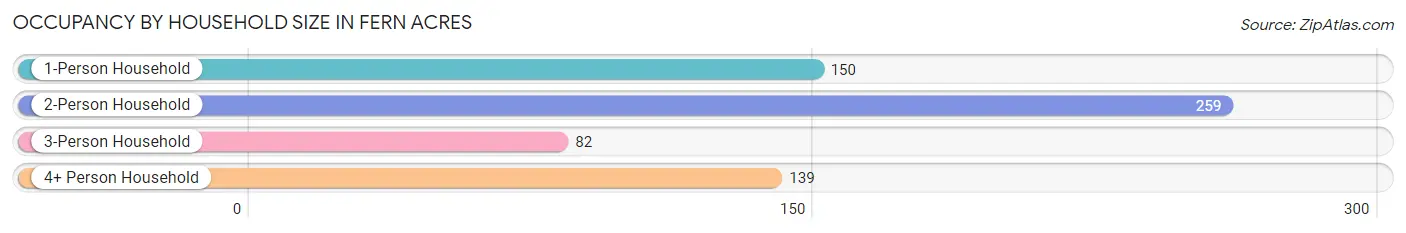
| Household Size | # Housing Units | % Housing Units |
| 1-Person Household | 150 | 23.8% |
| 2-Person Household | 259 | 41.1% |
| 3-Person Household | 82 | 13.0% |
| 4+ Person Household | 139 | 22.1% |
| Total Housing Units | 630 | 100.0% |
Occupancy by Ownership by Household Size in Fern Acres
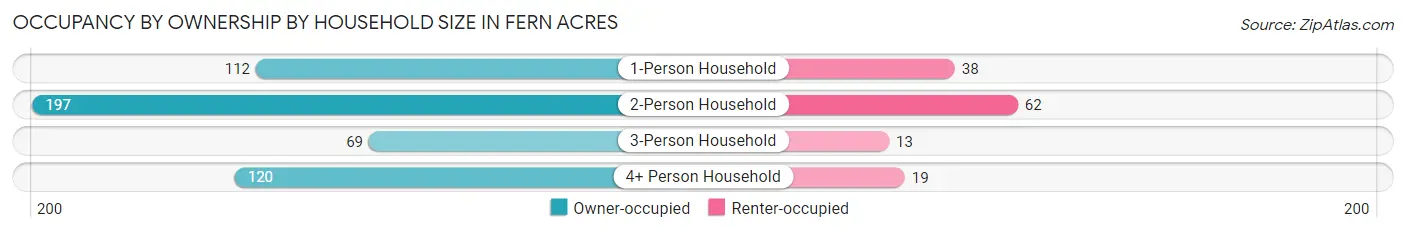
| Household Size | Owner-occupied | Renter-occupied |
| 1-Person Household | 112 (74.7%) | 38 (25.3%) |
| 2-Person Household | 197 (76.1%) | 62 (23.9%) |
| 3-Person Household | 69 (84.2%) | 13 (15.9%) |
| 4+ Person Household | 120 (86.3%) | 19 (13.7%) |
| Total Housing Units | 498 (79.0%) | 132 (20.9%) |
Occupancy by Educational Attainment in Fern Acres
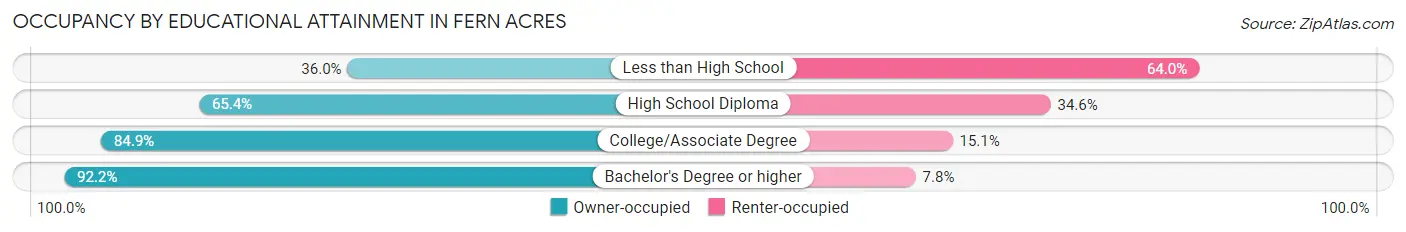
| Household Size | Owner-occupied | Renter-occupied |
| Less than High School | 9 (36.0%) | 16 (64.0%) |
| High School Diploma | 123 (65.4%) | 65 (34.6%) |
| College/Associate Degree | 213 (84.9%) | 38 (15.1%) |
| Bachelor's Degree or higher | 153 (92.2%) | 13 (7.8%) |
Occupancy by Age of Householder in Fern Acres
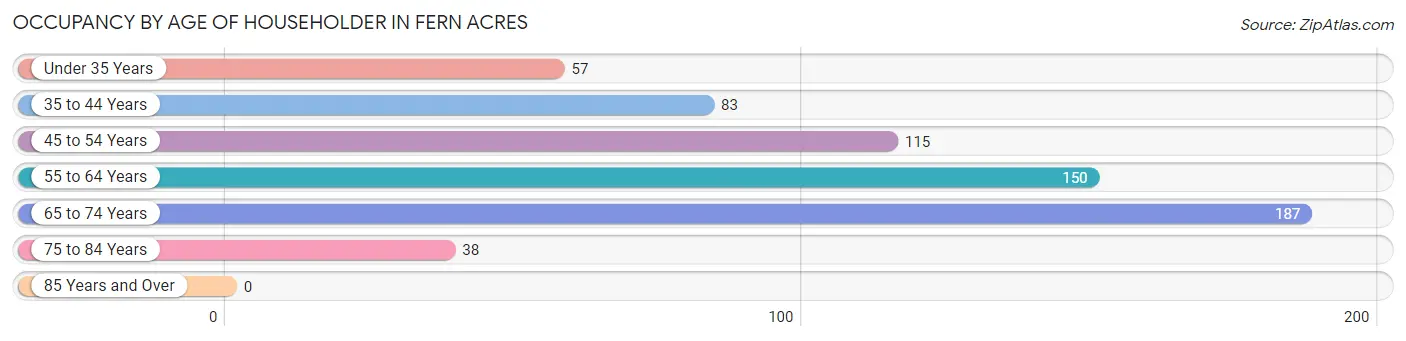
| Age Bracket | # Households | % Households |
| Under 35 Years | 57 | 9.0% |
| 35 to 44 Years | 83 | 13.2% |
| 45 to 54 Years | 115 | 18.2% |
| 55 to 64 Years | 150 | 23.8% |
| 65 to 74 Years | 187 | 29.7% |
| 75 to 84 Years | 38 | 6.0% |
| 85 Years and Over | 0 | 0.0% |
| Total | 630 | 100.0% |
Housing Finances in Fern Acres
Median Income by Occupancy in Fern Acres
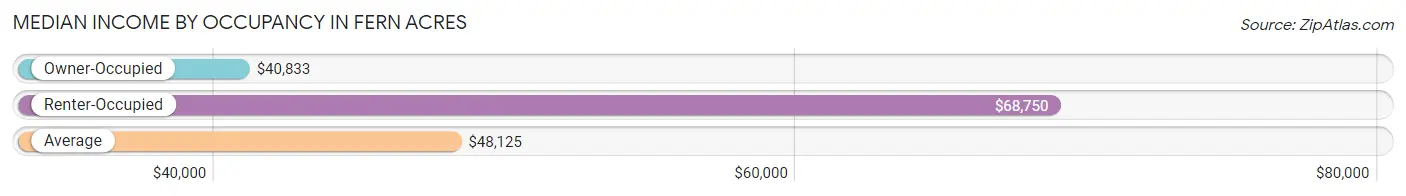
| Occupancy Type | # Households | Median Income |
| Owner-Occupied | 498 (79.0%) | $40,833 |
| Renter-Occupied | 132 (20.9%) | $68,750 |
| Average | 630 (100.0%) | $48,125 |
Occupancy by Householder Income Bracket in Fern Acres
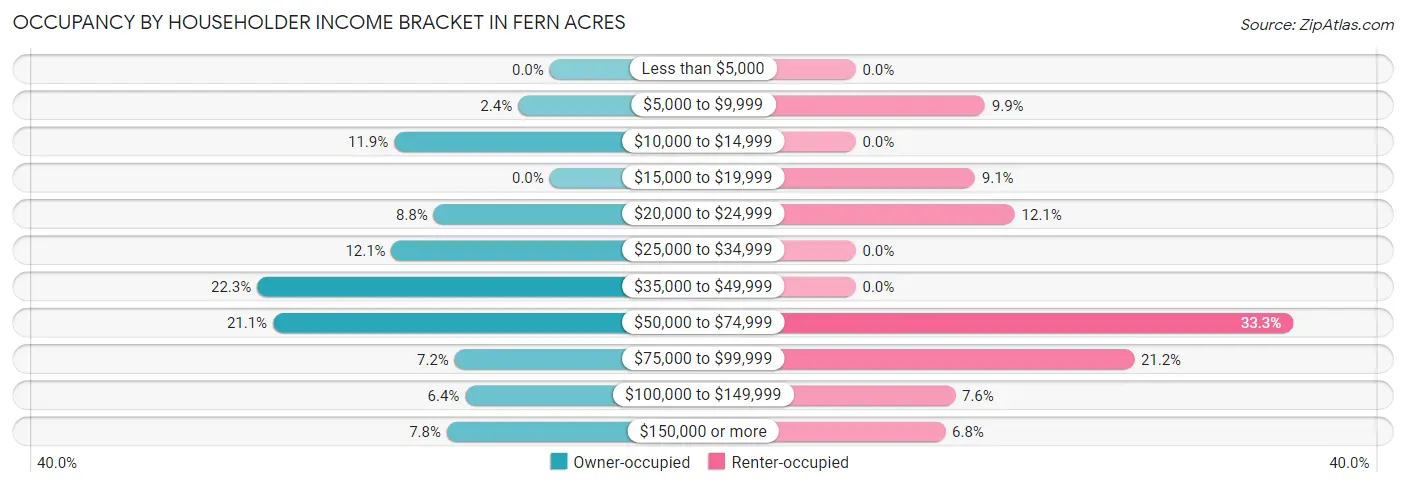
| Income Bracket | Owner-occupied | Renter-occupied |
| Less than $5,000 | 0 (0.0%) | 0 (0.0%) |
| $5,000 to $9,999 | 12 (2.4%) | 13 (9.9%) |
| $10,000 to $14,999 | 59 (11.8%) | 0 (0.0%) |
| $15,000 to $19,999 | 0 (0.0%) | 12 (9.1%) |
| $20,000 to $24,999 | 44 (8.8%) | 16 (12.1%) |
| $25,000 to $34,999 | 60 (12.0%) | 0 (0.0%) |
| $35,000 to $49,999 | 111 (22.3%) | 0 (0.0%) |
| $50,000 to $74,999 | 105 (21.1%) | 44 (33.3%) |
| $75,000 to $99,999 | 36 (7.2%) | 28 (21.2%) |
| $100,000 to $149,999 | 32 (6.4%) | 10 (7.6%) |
| $150,000 or more | 39 (7.8%) | 9 (6.8%) |
| Total | 498 (100.0%) | 132 (100.0%) |
Monthly Housing Cost Tiers in Fern Acres
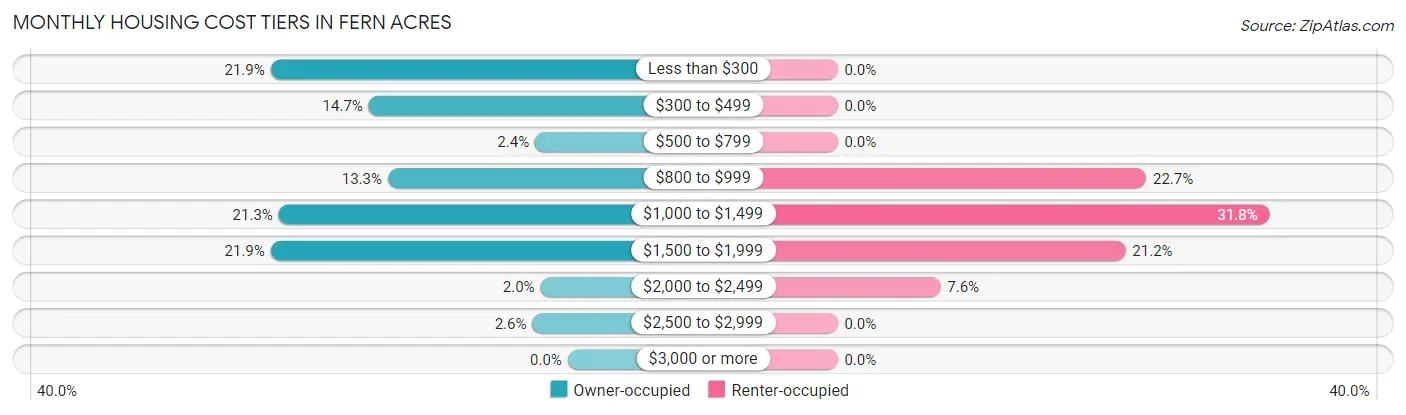
| Monthly Cost | Owner-occupied | Renter-occupied |
| Less than $300 | 109 (21.9%) | 0 (0.0%) |
| $300 to $499 | 73 (14.7%) | 0 (0.0%) |
| $500 to $799 | 12 (2.4%) | 0 (0.0%) |
| $800 to $999 | 66 (13.3%) | 30 (22.7%) |
| $1,000 to $1,499 | 106 (21.3%) | 42 (31.8%) |
| $1,500 to $1,999 | 109 (21.9%) | 28 (21.2%) |
| $2,000 to $2,499 | 10 (2.0%) | 10 (7.6%) |
| $2,500 to $2,999 | 13 (2.6%) | 0 (0.0%) |
| $3,000 or more | 0 (0.0%) | 0 (0.0%) |
| Total | 498 (100.0%) | 132 (100.0%) |
Physical Housing Characteristics in Fern Acres
Housing Structures in Fern Acres
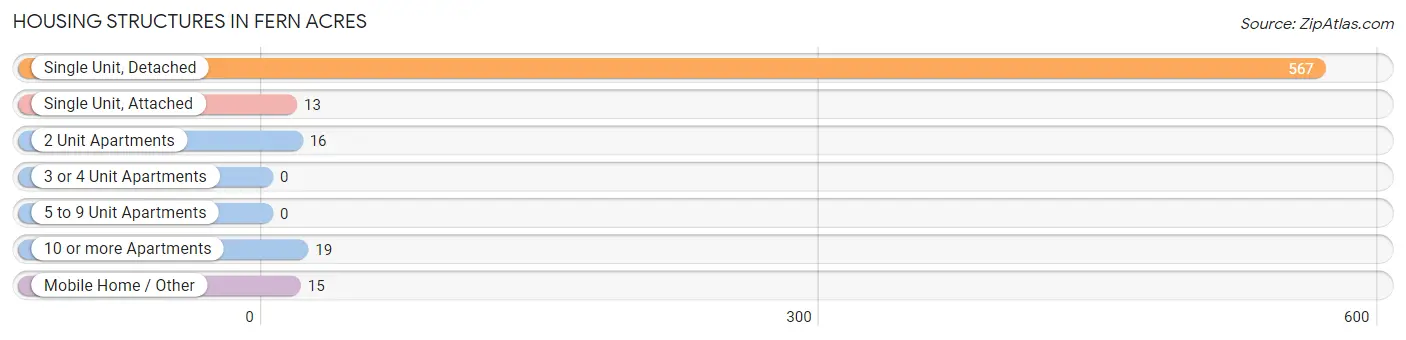
| Structure Type | # Housing Units | % Housing Units |
| Single Unit, Detached | 567 | 90.0% |
| Single Unit, Attached | 13 | 2.1% |
| 2 Unit Apartments | 16 | 2.5% |
| 3 or 4 Unit Apartments | 0 | 0.0% |
| 5 to 9 Unit Apartments | 0 | 0.0% |
| 10 or more Apartments | 19 | 3.0% |
| Mobile Home / Other | 15 | 2.4% |
| Total | 630 | 100.0% |
Housing Structures by Occupancy in Fern Acres
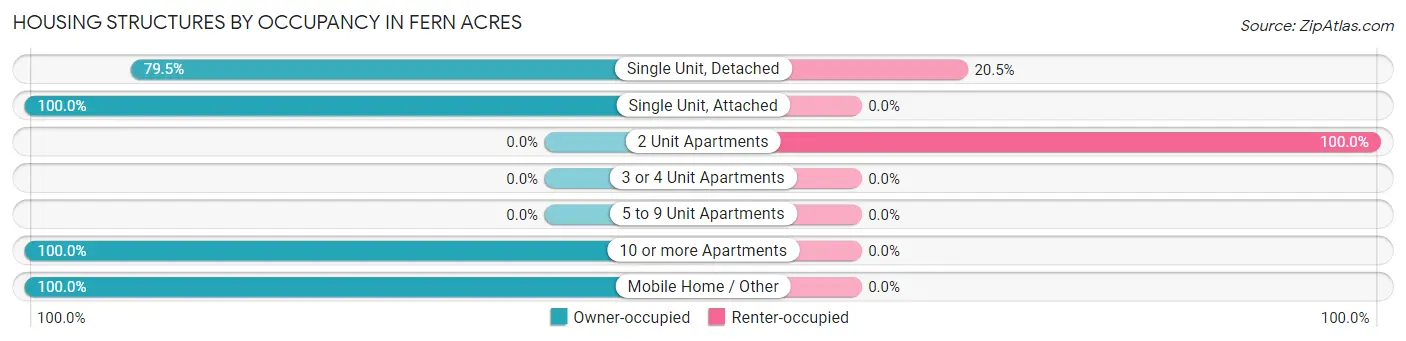
| Structure Type | Owner-occupied | Renter-occupied |
| Single Unit, Detached | 451 (79.5%) | 116 (20.5%) |
| Single Unit, Attached | 13 (100.0%) | 0 (0.0%) |
| 2 Unit Apartments | 0 (0.0%) | 16 (100.0%) |
| 3 or 4 Unit Apartments | 0 (0.0%) | 0 (0.0%) |
| 5 to 9 Unit Apartments | 0 (0.0%) | 0 (0.0%) |
| 10 or more Apartments | 19 (100.0%) | 0 (0.0%) |
| Mobile Home / Other | 15 (100.0%) | 0 (0.0%) |
| Total | 498 (79.0%) | 132 (20.9%) |
Housing Structures by Number of Rooms in Fern Acres
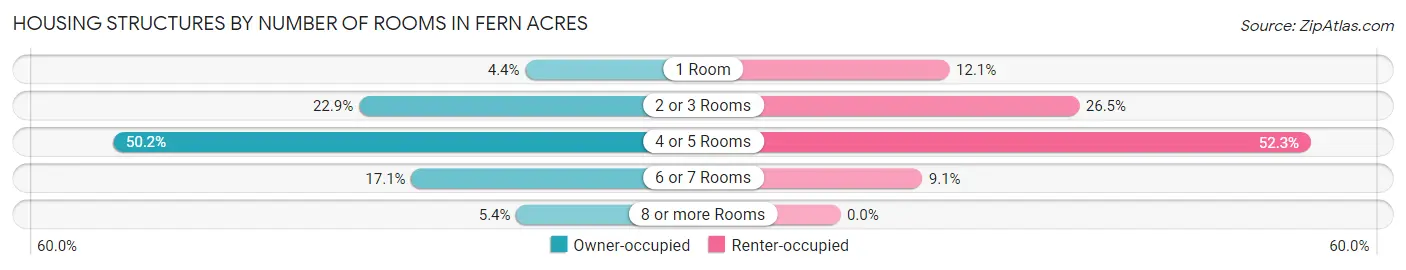
| Number of Rooms | Owner-occupied | Renter-occupied |
| 1 Room | 22 (4.4%) | 16 (12.1%) |
| 2 or 3 Rooms | 114 (22.9%) | 35 (26.5%) |
| 4 or 5 Rooms | 250 (50.2%) | 69 (52.3%) |
| 6 or 7 Rooms | 85 (17.1%) | 12 (9.1%) |
| 8 or more Rooms | 27 (5.4%) | 0 (0.0%) |
| Total | 498 (100.0%) | 132 (100.0%) |
Housing Structure by Heating Type in Fern Acres
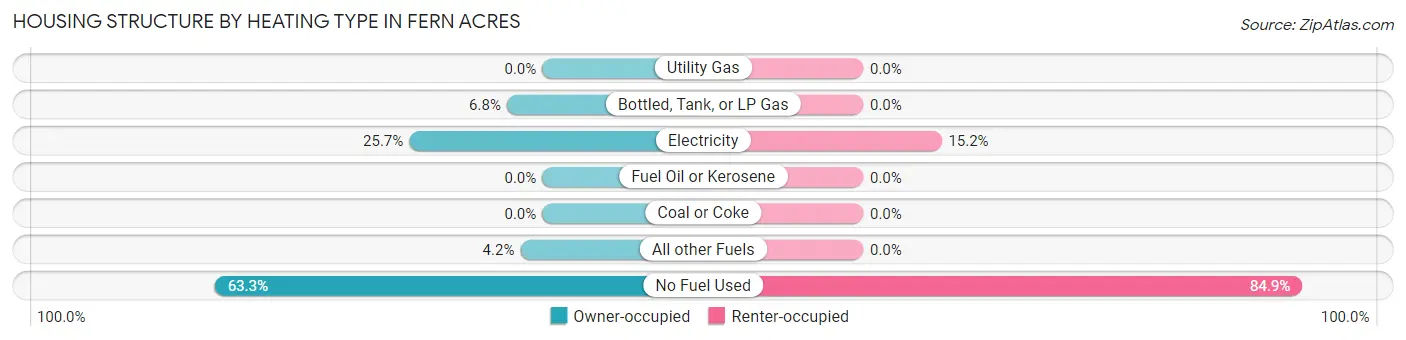
| Heating Type | Owner-occupied | Renter-occupied |
| Utility Gas | 0 (0.0%) | 0 (0.0%) |
| Bottled, Tank, or LP Gas | 34 (6.8%) | 0 (0.0%) |
| Electricity | 128 (25.7%) | 20 (15.1%) |
| Fuel Oil or Kerosene | 0 (0.0%) | 0 (0.0%) |
| Coal or Coke | 0 (0.0%) | 0 (0.0%) |
| All other Fuels | 21 (4.2%) | 0 (0.0%) |
| No Fuel Used | 315 (63.2%) | 112 (84.9%) |
| Total | 498 (100.0%) | 132 (100.0%) |
Household Vehicle Usage in Fern Acres
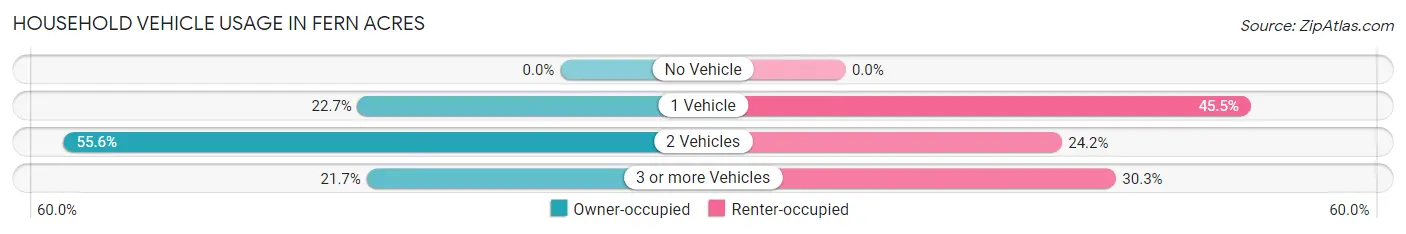
| Vehicles per Household | Owner-occupied | Renter-occupied |
| No Vehicle | 0 (0.0%) | 0 (0.0%) |
| 1 Vehicle | 113 (22.7%) | 60 (45.5%) |
| 2 Vehicles | 277 (55.6%) | 32 (24.2%) |
| 3 or more Vehicles | 108 (21.7%) | 40 (30.3%) |
| Total | 498 (100.0%) | 132 (100.0%) |
Real Estate & Mortgages in Fern Acres
Real Estate and Mortgage Overview in Fern Acres
| Characteristic | Without Mortgage | With Mortgage |
| Housing Units | 189 | 309 |
| Median Property Value | $258,000 | $249,600 |
| Median Household Income | $30,288 | $24 |
| Monthly Housing Costs | $215 | $0 |
| Real Estate Taxes | - | - |
Property Value by Mortgage Status in Fern Acres
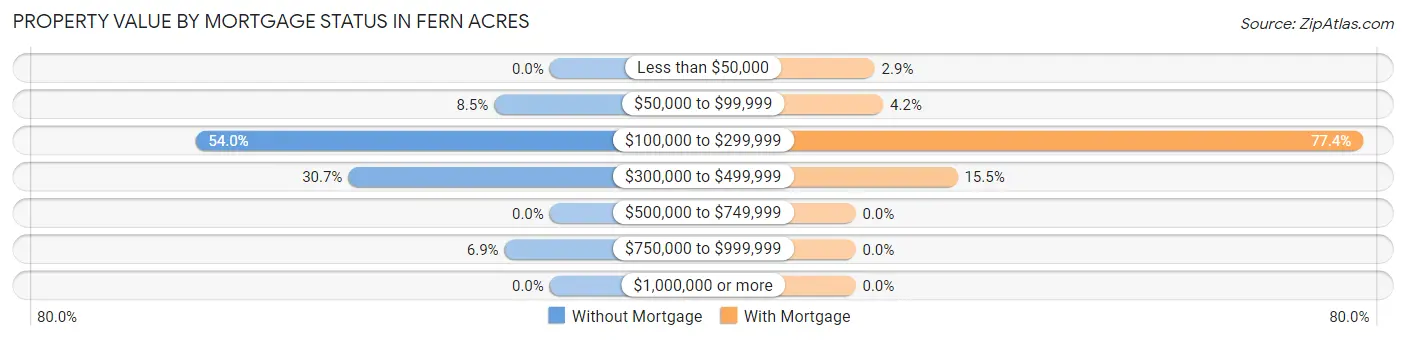
| Property Value | Without Mortgage | With Mortgage |
| Less than $50,000 | 0 (0.0%) | 9 (2.9%) |
| $50,000 to $99,999 | 16 (8.5%) | 13 (4.2%) |
| $100,000 to $299,999 | 102 (54.0%) | 239 (77.3%) |
| $300,000 to $499,999 | 58 (30.7%) | 48 (15.5%) |
| $500,000 to $749,999 | 0 (0.0%) | 0 (0.0%) |
| $750,000 to $999,999 | 13 (6.9%) | 0 (0.0%) |
| $1,000,000 or more | 0 (0.0%) | 0 (0.0%) |
| Total | 189 (100.0%) | 309 (100.0%) |
Household Income by Mortgage Status in Fern Acres
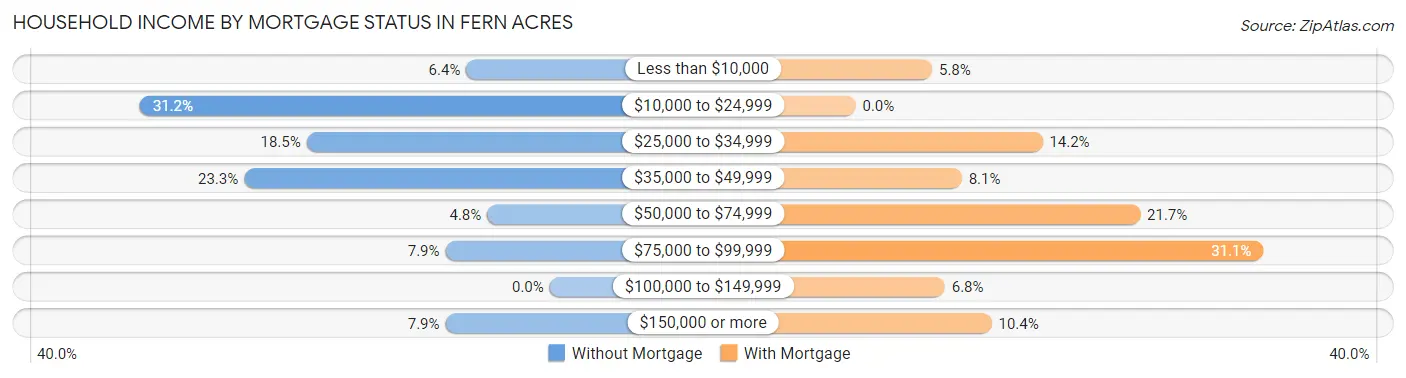
| Household Income | Without Mortgage | With Mortgage |
| Less than $10,000 | 12 (6.4%) | 18 (5.8%) |
| $10,000 to $24,999 | 59 (31.2%) | 0 (0.0%) |
| $25,000 to $34,999 | 35 (18.5%) | 44 (14.2%) |
| $35,000 to $49,999 | 44 (23.3%) | 25 (8.1%) |
| $50,000 to $74,999 | 9 (4.8%) | 67 (21.7%) |
| $75,000 to $99,999 | 15 (7.9%) | 96 (31.1%) |
| $100,000 to $149,999 | 0 (0.0%) | 21 (6.8%) |
| $150,000 or more | 15 (7.9%) | 32 (10.4%) |
| Total | 189 (100.0%) | 309 (100.0%) |
Property Value to Household Income Ratio in Fern Acres
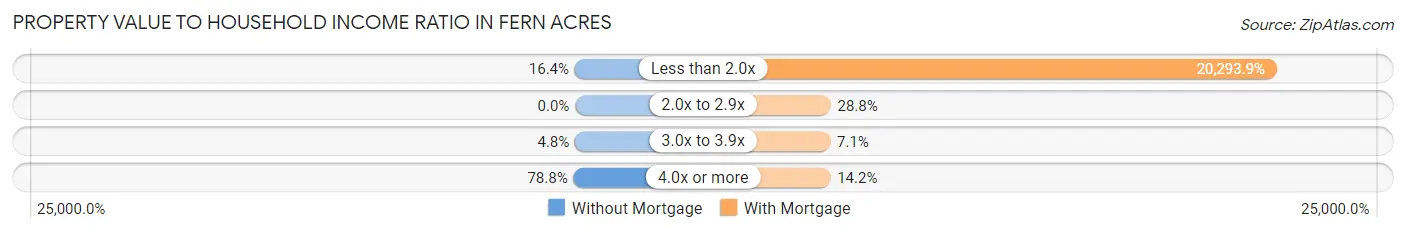
| Value-to-Income Ratio | Without Mortgage | With Mortgage |
| Less than 2.0x | 31 (16.4%) | 62,708 (20,293.9%) |
| 2.0x to 2.9x | 0 (0.0%) | 89 (28.8%) |
| 3.0x to 3.9x | 9 (4.8%) | 22 (7.1%) |
| 4.0x or more | 149 (78.8%) | 44 (14.2%) |
| Total | 189 (100.0%) | 309 (100.0%) |
Real Estate Taxes by Mortgage Status in Fern Acres
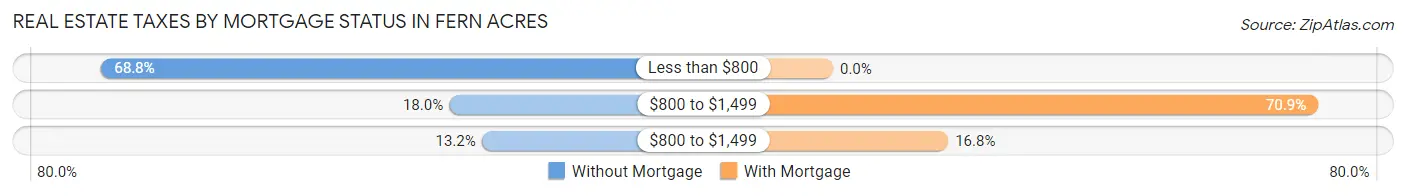
| Property Taxes | Without Mortgage | With Mortgage |
| Less than $800 | 130 (68.8%) | 0 (0.0%) |
| $800 to $1,499 | 34 (18.0%) | 219 (70.9%) |
| $800 to $1,499 | 25 (13.2%) | 52 (16.8%) |
| Total | 189 (100.0%) | 309 (100.0%) |
Health & Disability in Fern Acres
Health Insurance Coverage by Age in Fern Acres
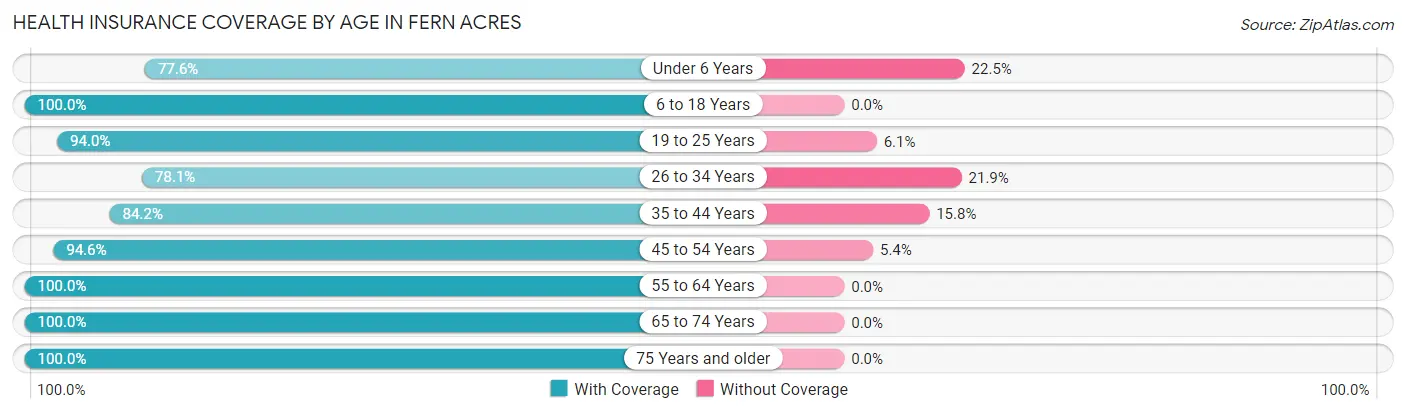
| Age Bracket | With Coverage | Without Coverage |
| Under 6 Years | 76 (77.5%) | 22 (22.5%) |
| 6 to 18 Years | 173 (100.0%) | 0 (0.0%) |
| 19 to 25 Years | 264 (94.0%) | 17 (6.0%) |
| 26 to 34 Years | 75 (78.1%) | 21 (21.9%) |
| 35 to 44 Years | 186 (84.2%) | 35 (15.8%) |
| 45 to 54 Years | 212 (94.6%) | 12 (5.4%) |
| 55 to 64 Years | 325 (100.0%) | 0 (0.0%) |
| 65 to 74 Years | 261 (100.0%) | 0 (0.0%) |
| 75 Years and older | 102 (100.0%) | 0 (0.0%) |
| Total | 1,674 (94.0%) | 107 (6.0%) |
Health Insurance Coverage by Citizenship Status in Fern Acres
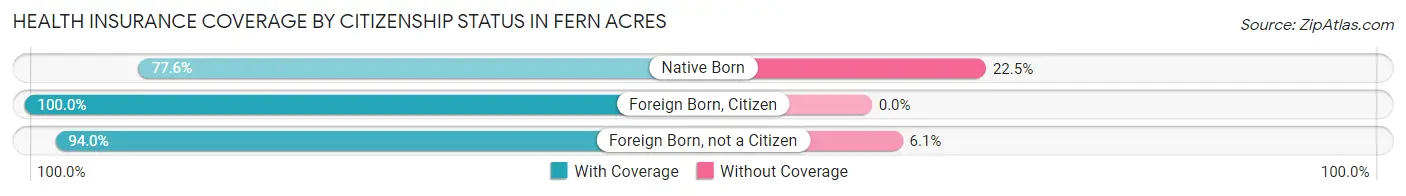
| Citizenship Status | With Coverage | Without Coverage |
| Native Born | 76 (77.5%) | 22 (22.5%) |
| Foreign Born, Citizen | 173 (100.0%) | 0 (0.0%) |
| Foreign Born, not a Citizen | 264 (94.0%) | 17 (6.0%) |
Health Insurance Coverage by Household Income in Fern Acres
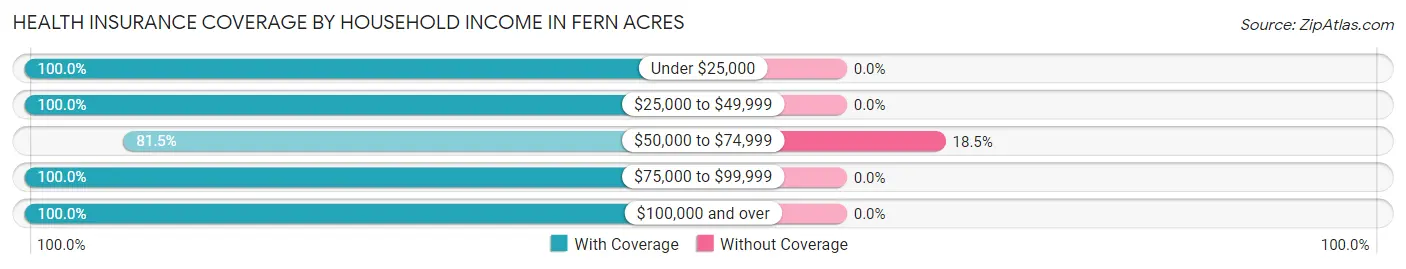
| Household Income | With Coverage | Without Coverage |
| Under $25,000 | 256 (100.0%) | 0 (0.0%) |
| $25,000 to $49,999 | 314 (100.0%) | 0 (0.0%) |
| $50,000 to $74,999 | 471 (81.5%) | 107 (18.5%) |
| $75,000 to $99,999 | 180 (100.0%) | 0 (0.0%) |
| $100,000 and over | 453 (100.0%) | 0 (0.0%) |
Public vs Private Health Insurance Coverage by Age in Fern Acres
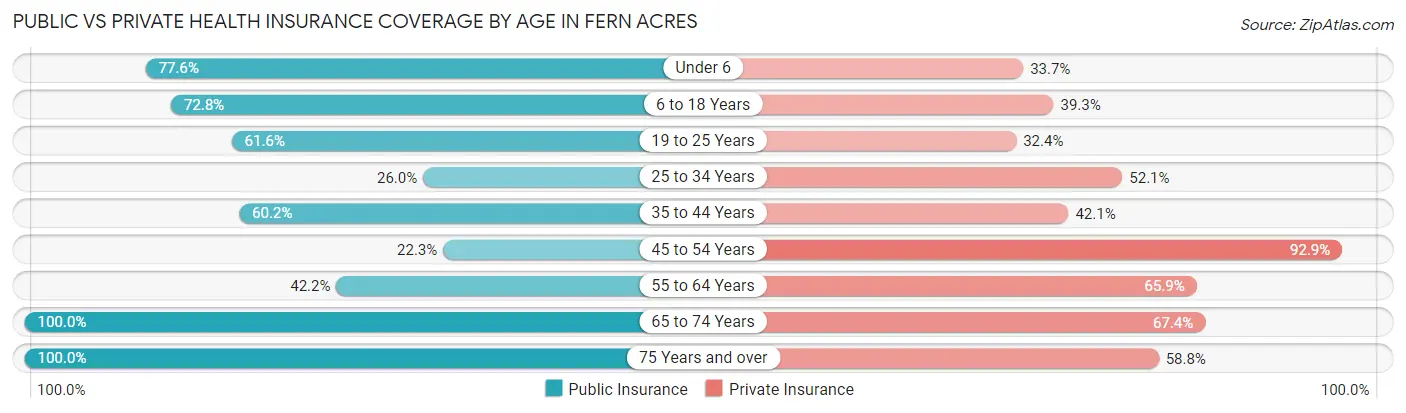
| Age Bracket | Public Insurance | Private Insurance |
| Under 6 | 76 (77.5%) | 33 (33.7%) |
| 6 to 18 Years | 126 (72.8%) | 68 (39.3%) |
| 19 to 25 Years | 173 (61.6%) | 91 (32.4%) |
| 25 to 34 Years | 25 (26.0%) | 50 (52.1%) |
| 35 to 44 Years | 133 (60.2%) | 93 (42.1%) |
| 45 to 54 Years | 50 (22.3%) | 208 (92.9%) |
| 55 to 64 Years | 137 (42.1%) | 214 (65.8%) |
| 65 to 74 Years | 261 (100.0%) | 176 (67.4%) |
| 75 Years and over | 102 (100.0%) | 60 (58.8%) |
| Total | 1,083 (60.8%) | 993 (55.8%) |
Disability Status by Sex by Age in Fern Acres
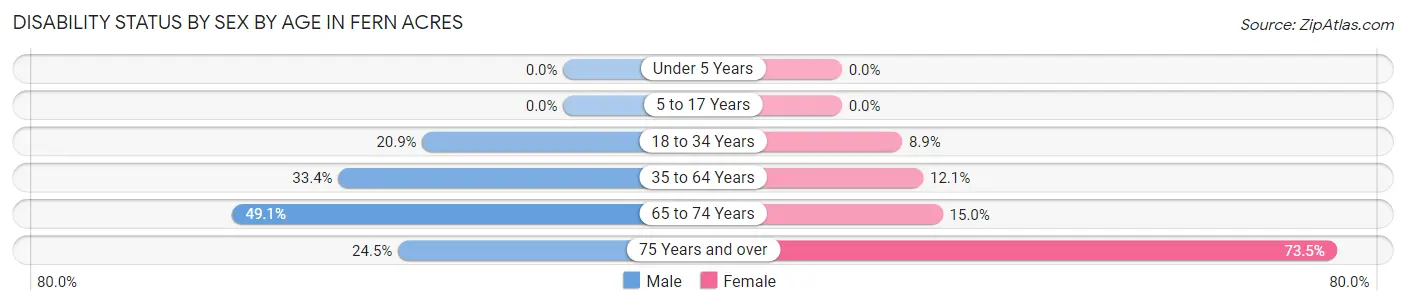
| Age Bracket | Male | Female |
| Under 5 Years | 0 (0.0%) | 0 (0.0%) |
| 5 to 17 Years | 0 (0.0%) | 0 (0.0%) |
| 18 to 34 Years | 32 (20.9%) | 20 (8.9%) |
| 35 to 64 Years | 163 (33.4%) | 34 (12.1%) |
| 65 to 74 Years | 56 (49.1%) | 22 (15.0%) |
| 75 Years and over | 13 (24.5%) | 36 (73.5%) |
Disability Class by Sex by Age in Fern Acres
Disability Class: Hearing Difficulty
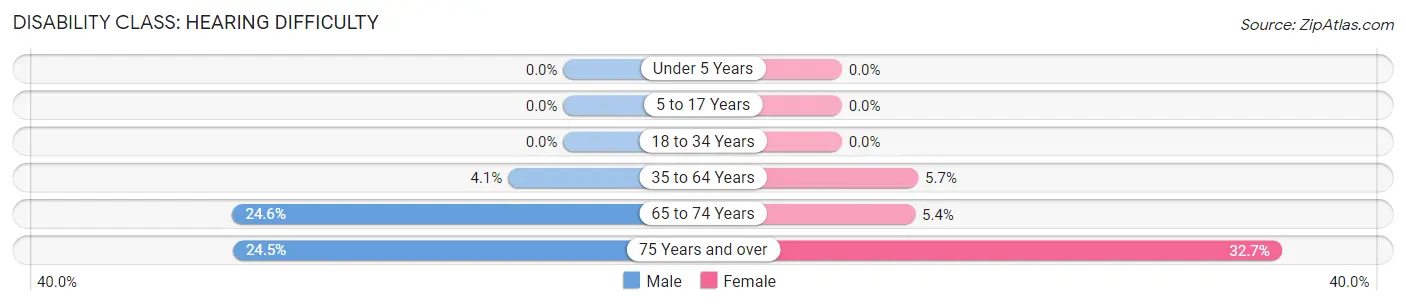
| Age Bracket | Male | Female |
| Under 5 Years | 0 (0.0%) | 0 (0.0%) |
| 5 to 17 Years | 0 (0.0%) | 0 (0.0%) |
| 18 to 34 Years | 0 (0.0%) | 0 (0.0%) |
| 35 to 64 Years | 20 (4.1%) | 16 (5.7%) |
| 65 to 74 Years | 28 (24.6%) | 8 (5.4%) |
| 75 Years and over | 13 (24.5%) | 16 (32.7%) |
Disability Class: Vision Difficulty
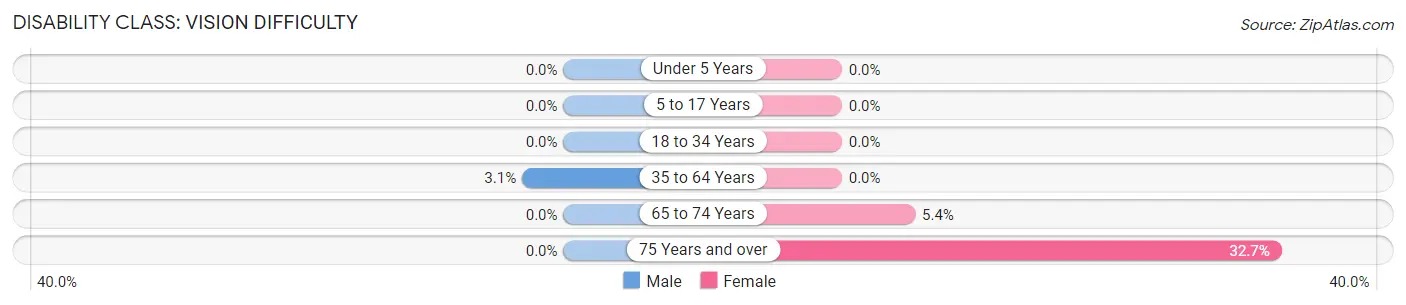
| Age Bracket | Male | Female |
| Under 5 Years | 0 (0.0%) | 0 (0.0%) |
| 5 to 17 Years | 0 (0.0%) | 0 (0.0%) |
| 18 to 34 Years | 0 (0.0%) | 0 (0.0%) |
| 35 to 64 Years | 15 (3.1%) | 0 (0.0%) |
| 65 to 74 Years | 0 (0.0%) | 8 (5.4%) |
| 75 Years and over | 0 (0.0%) | 16 (32.7%) |
Disability Class: Cognitive Difficulty
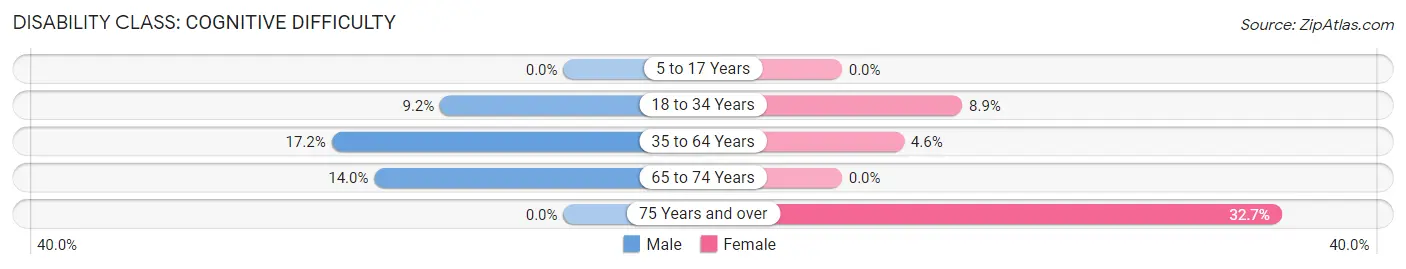
| Age Bracket | Male | Female |
| 5 to 17 Years | 0 (0.0%) | 0 (0.0%) |
| 18 to 34 Years | 14 (9.1%) | 20 (8.9%) |
| 35 to 64 Years | 84 (17.2%) | 13 (4.6%) |
| 65 to 74 Years | 16 (14.0%) | 0 (0.0%) |
| 75 Years and over | 0 (0.0%) | 16 (32.7%) |
Disability Class: Ambulatory Difficulty
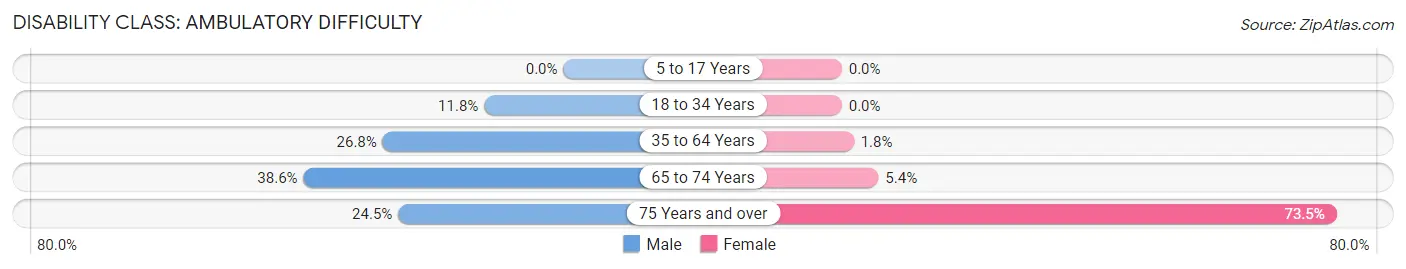
| Age Bracket | Male | Female |
| 5 to 17 Years | 0 (0.0%) | 0 (0.0%) |
| 18 to 34 Years | 18 (11.8%) | 0 (0.0%) |
| 35 to 64 Years | 131 (26.8%) | 5 (1.8%) |
| 65 to 74 Years | 44 (38.6%) | 8 (5.4%) |
| 75 Years and over | 13 (24.5%) | 36 (73.5%) |
Disability Class: Self-Care Difficulty
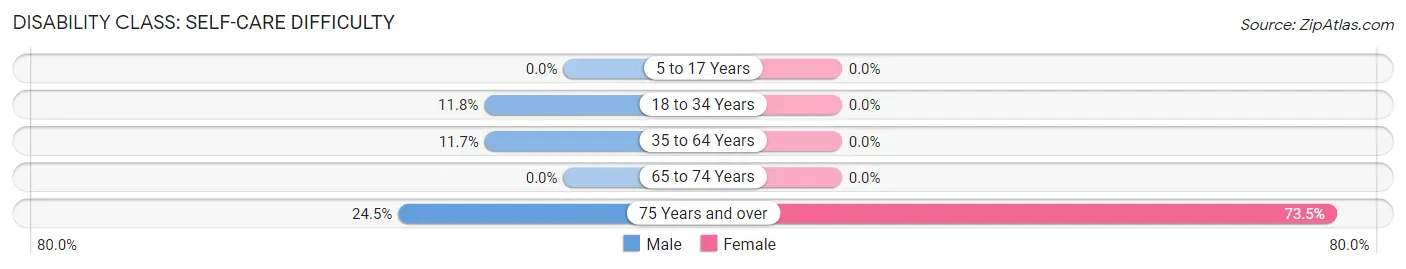
| Age Bracket | Male | Female |
| 5 to 17 Years | 0 (0.0%) | 0 (0.0%) |
| 18 to 34 Years | 18 (11.8%) | 0 (0.0%) |
| 35 to 64 Years | 57 (11.7%) | 0 (0.0%) |
| 65 to 74 Years | 0 (0.0%) | 0 (0.0%) |
| 75 Years and over | 13 (24.5%) | 36 (73.5%) |
Technology Access in Fern Acres
Computing Device Access in Fern Acres
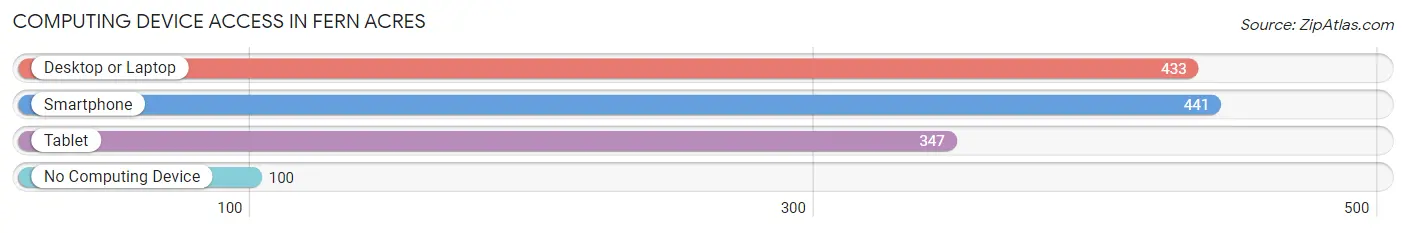
| Device Type | # Households | % Households |
| Desktop or Laptop | 433 | 68.7% |
| Smartphone | 441 | 70.0% |
| Tablet | 347 | 55.1% |
| No Computing Device | 100 | 15.9% |
| Total | 630 | 100.0% |
Internet Access in Fern Acres
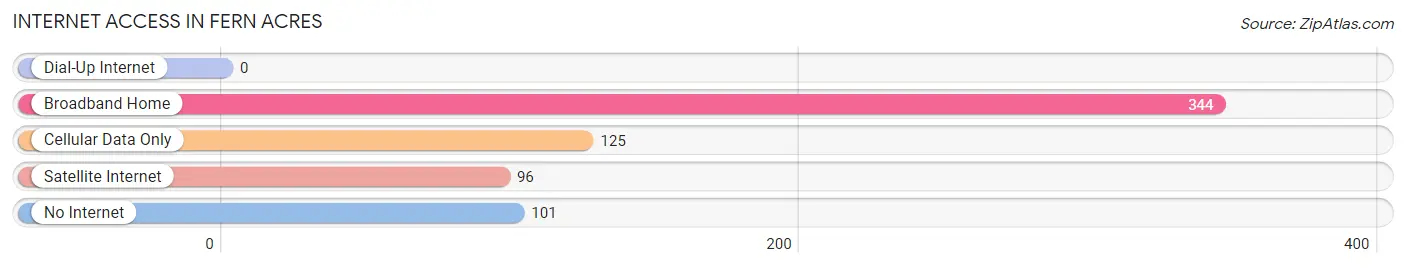
| Internet Type | # Households | % Households |
| Dial-Up Internet | 0 | 0.0% |
| Broadband Home | 344 | 54.6% |
| Cellular Data Only | 125 | 19.8% |
| Satellite Internet | 96 | 15.2% |
| No Internet | 101 | 16.0% |
| Total | 630 | 100.0% |
Fern Acres Summary
Fern Acres is an unincorporated community located in the Puna District of Hawaii County, Hawaii. It is located on the eastern side of the Big Island, about 10 miles south of Hilo. The community is situated in a rural area of the island, surrounded by lush tropical rainforest and the Pacific Ocean.
History
Fern Acres was founded in the late 1950s by a group of homesteaders who were looking for a place to settle and start a new life. The homesteaders were attracted to the area due to its fertile soil and abundant rainfall. The community was named after the abundance of ferns that grew in the area.
The first settlers of Fern Acres were mostly of Japanese descent, and the community quickly became a hub for Japanese culture and traditions. The community was also home to a number of small businesses, including a general store, a gas station, and a post office.
Geography
Fern Acres is located in the Puna District of Hawaii County, Hawaii. It is situated on the eastern side of the Big Island, about 10 miles south of Hilo. The community is surrounded by lush tropical rainforest and the Pacific Ocean. The area is known for its abundant rainfall and fertile soil, making it ideal for farming and agriculture.
The climate in Fern Acres is tropical, with temperatures ranging from the mid-70s to the mid-80s year-round. The area receives an average of about 150 inches of rain per year, making it one of the wettest places in the United States.
Economy
Fern Acres is a rural community with a largely agricultural economy. The area is known for its abundance of tropical fruits and vegetables, including papayas, bananas, and avocados. The community is also home to a number of small businesses, including a general store, a gas station, and a post office.
The area is also home to a number of tourist attractions, including the Fern Acres Golf Course, the Fern Acres Botanical Garden, and the Fern Acres Waterfall. These attractions draw visitors from all over the world, providing a boost to the local economy.
Demographics
As of the 2010 census, the population of Fern Acres was 1,845. The racial makeup of the community was 73.3% White, 0.7% African American, 0.3% Native American, 0.2% Asian, 0.1% Pacific Islander, and 24.4% from other races. The median household income was $37,917, and the median age was 44.
Fern Acres is a diverse community, with a mix of cultures and backgrounds. The community is home to a number of churches, including the Fern Acres United Methodist Church, the Fern Acres Baptist Church, and the Fern Acres Catholic Church. The community is also home to a number of schools, including the Fern Acres Elementary School and the Fern Acres High School.
Common Questions
What is Per Capita Income in Fern Acres?
Per Capita income in Fern Acres is $23,201.
What is the Median Family Income in Fern Acres?
Median Family Income in Fern Acres is $52,361.
What is the Median Household income in Fern Acres?
Median Household Income in Fern Acres is $48,125.
What is Income or Wage Gap in Fern Acres?
Income or Wage Gap in Fern Acres is 20.9%.
Women in Fern Acres earn 79.1 cents for every dollar earned by a man.
What is Inequality or Gini Index in Fern Acres?
Inequality or Gini Index in Fern Acres is 0.42.
What is the Total Population of Fern Acres?
Total Population of Fern Acres is 1,781.
What is the Total Male Population of Fern Acres?
Total Male Population of Fern Acres is 913.
What is the Total Female Population of Fern Acres?
Total Female Population of Fern Acres is 868.
What is the Ratio of Males per 100 Females in Fern Acres?
There are 105.18 Males per 100 Females in Fern Acres.
What is the Ratio of Females per 100 Males in Fern Acres?
There are 95.07 Females per 100 Males in Fern Acres.
What is the Median Population Age in Fern Acres?
Median Population Age in Fern Acres is 48.0 Years.
What is the Average Family Size in Fern Acres
Average Family Size in Fern Acres is 3.2 People.
What is the Average Household Size in Fern Acres
Average Household Size in Fern Acres is 2.8 People.
How Large is the Labor Force in Fern Acres?
There are 739 People in the Labor Forcein in Fern Acres.
What is the Percentage of People in the Labor Force in Fern Acres?
47.9% of People are in the Labor Force in Fern Acres.
What is the Unemployment Rate in Fern Acres?
Unemployment Rate in Fern Acres is 17.1%.