Wailua, HI Map & Demographics
Wailua Map
Wailua Overview
$38,828
PER CAPITA INCOME
$80,733
AVG FAMILY INCOME
$67,258
AVG HOUSEHOLD INCOME
15.6%
WAGE / INCOME GAP [ % ]
84.4¢/ $1
WAGE / INCOME GAP [ $ ]
0.45
INEQUALITY / GINI INDEX
2,438
TOTAL POPULATION
1,292
MALE POPULATION
1,146
FEMALE POPULATION
112.74
MALES / 100 FEMALES
88.70
FEMALES / 100 MALES
42.8
MEDIAN AGE
3.3
AVG FAMILY SIZE
2.7
AVG HOUSEHOLD SIZE
1,185
LABOR FORCE [ PEOPLE ]
60.8%
PERCENT IN LABOR FORCE
8.2%
UNEMPLOYMENT RATE
Income in Wailua
Income Overview in Wailua
Per Capita Income in Wailua is $38,828, while median incomes of families and households are $80,733 and $67,258 respectively.
| Characteristic | Number | Measure |
| Per Capita Income | 2,438 | $38,828 |
| Median Family Income | 573 | $80,733 |
| Mean Family Income | 573 | $102,853 |
| Median Household Income | 914 | $67,258 |
| Mean Household Income | 914 | $98,787 |
| Income Deficit | 573 | $0 |
| Wage / Income Gap (%) | 2,438 | 15.57% |
| Wage / Income Gap ($) | 2,438 | 84.43¢ per $1 |
| Gini / Inequality Index | 2,438 | 0.45 |
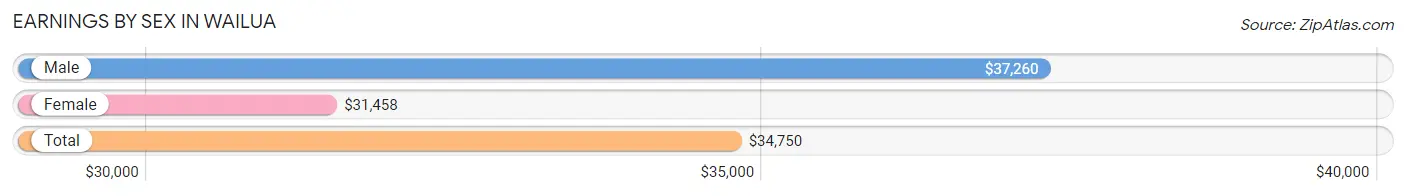
Earnings by Sex in Wailua
Average Earnings in Wailua are $34,750, $37,260 for men and $31,458 for women, a difference of 15.6%.
| Sex | Number | Average Earnings |
| Male | 743 (57.6%) | $37,260 |
| Female | 547 (42.4%) | $31,458 |
| Total | 1,290 (100.0%) | $34,750 |
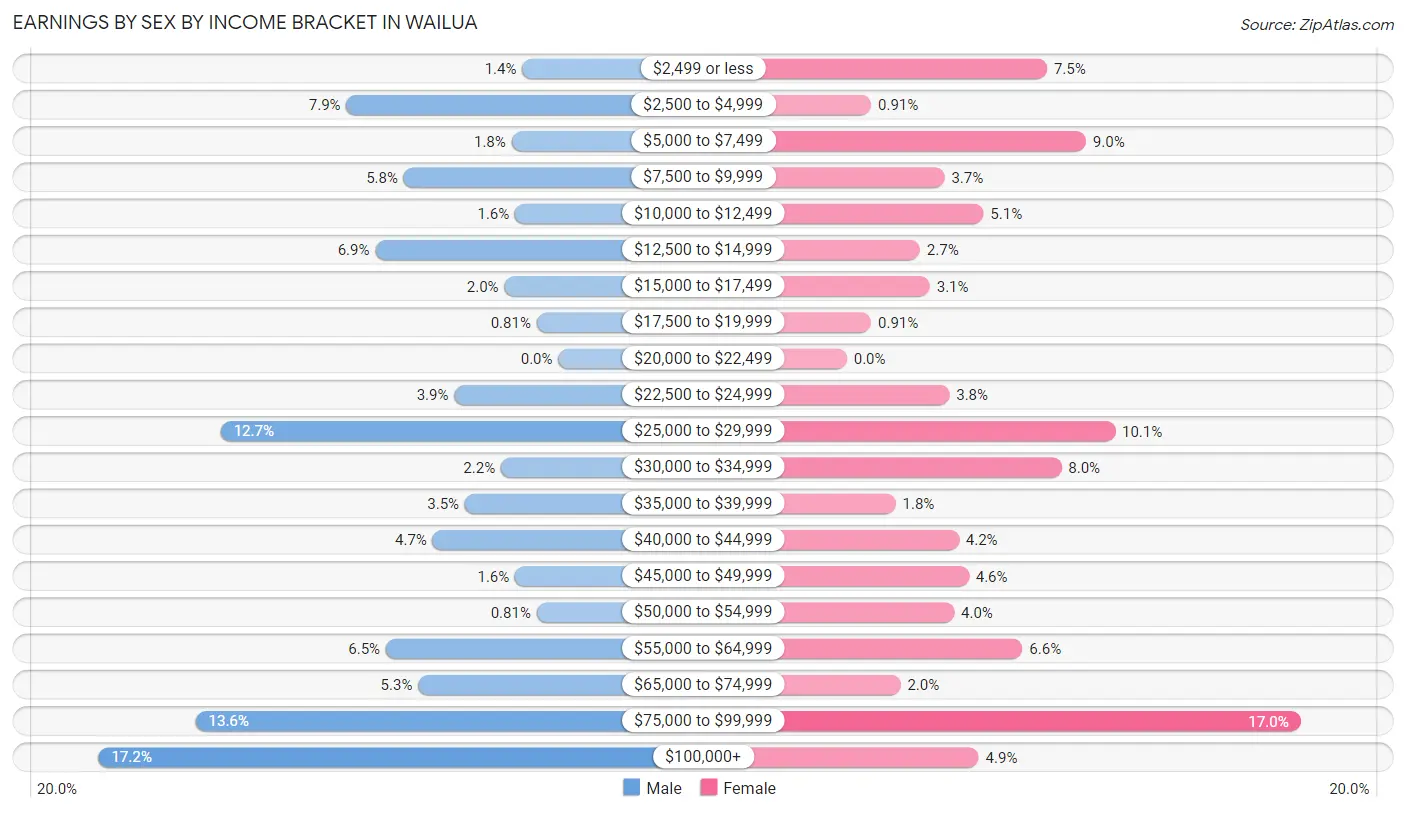
Earnings by Sex by Income Bracket in Wailua
The most common earnings brackets in Wailua are $100,000+ for men (128 | 17.2%) and $75,000 to $99,999 for women (93 | 17.0%).
| Income | Male | Female |
| $2,499 or less | 10 (1.3%) | 41 (7.5%) |
| $2,500 to $4,999 | 59 (7.9%) | 5 (0.9%) |
| $5,000 to $7,499 | 13 (1.8%) | 49 (9.0%) |
| $7,500 to $9,999 | 43 (5.8%) | 20 (3.7%) |
| $10,000 to $12,499 | 12 (1.6%) | 28 (5.1%) |
| $12,500 to $14,999 | 51 (6.9%) | 15 (2.7%) |
| $15,000 to $17,499 | 15 (2.0%) | 17 (3.1%) |
| $17,500 to $19,999 | 6 (0.8%) | 5 (0.9%) |
| $20,000 to $22,499 | 0 (0.0%) | 0 (0.0%) |
| $22,500 to $24,999 | 29 (3.9%) | 21 (3.8%) |
| $25,000 to $29,999 | 94 (12.7%) | 55 (10.1%) |
| $30,000 to $34,999 | 16 (2.1%) | 44 (8.0%) |
| $35,000 to $39,999 | 26 (3.5%) | 10 (1.8%) |
| $40,000 to $44,999 | 35 (4.7%) | 23 (4.2%) |
| $45,000 to $49,999 | 12 (1.6%) | 25 (4.6%) |
| $50,000 to $54,999 | 6 (0.8%) | 22 (4.0%) |
| $55,000 to $64,999 | 48 (6.5%) | 36 (6.6%) |
| $65,000 to $74,999 | 39 (5.2%) | 11 (2.0%) |
| $75,000 to $99,999 | 101 (13.6%) | 93 (17.0%) |
| $100,000+ | 128 (17.2%) | 27 (4.9%) |
| Total | 743 (100.0%) | 547 (100.0%) |
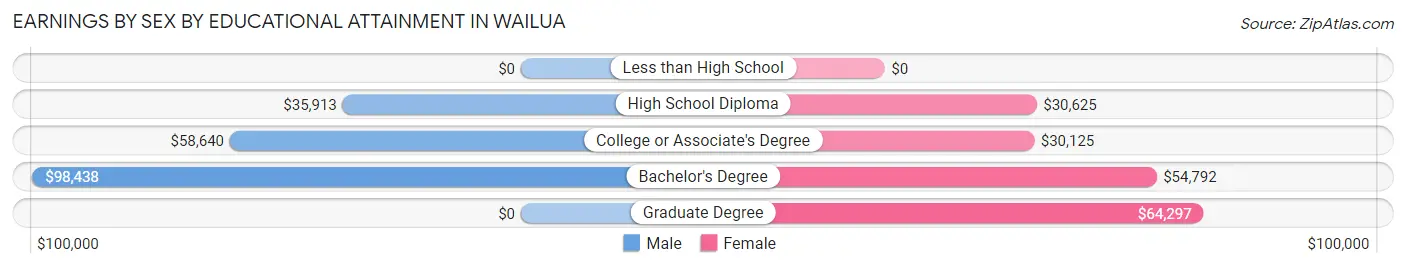
Earnings by Sex by Educational Attainment in Wailua
Average earnings in Wailua are $51,875 for men and $34,821 for women, a difference of 32.9%. Men with an educational attainment of bachelor's degree enjoy the highest average annual earnings of $98,438, while those with high school diploma education earn the least with $35,913. Women with an educational attainment of graduate degree earn the most with the average annual earnings of $64,297, while those with college or associate's degree education have the smallest earnings of $30,125.
| Educational Attainment | Male Income | Female Income |
| Less than High School | - | - |
| High School Diploma | $35,913 | $30,625 |
| College or Associate's Degree | $58,640 | $30,125 |
| Bachelor's Degree | $98,438 | $54,792 |
| Graduate Degree | - | - |
| Total | $51,875 | $34,821 |
Family Income in Wailua
Family Income Brackets in Wailua
According to the Wailua family income data, there are 125 families falling into the $50,000 to $74,999 income range, which is the most common income bracket and makes up 21.8% of all families.
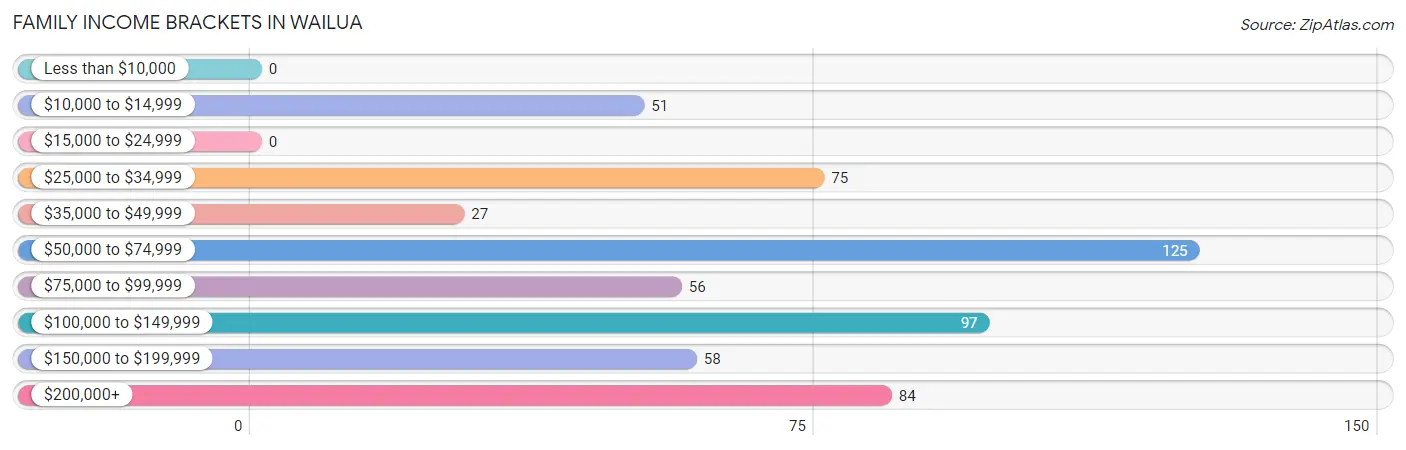
| Income Bracket | # Families | % Families |
| Less than $10,000 | 0 | 0.0% |
| $10,000 to $14,999 | 51 | 8.9% |
| $15,000 to $24,999 | 0 | 0.0% |
| $25,000 to $34,999 | 75 | 13.1% |
| $35,000 to $49,999 | 27 | 4.7% |
| $50,000 to $74,999 | 125 | 21.8% |
| $75,000 to $99,999 | 56 | 9.8% |
| $100,000 to $149,999 | 97 | 16.9% |
| $150,000 to $199,999 | 58 | 10.1% |
| $200,000+ | 84 | 14.7% |
Family Income by Famaliy Size in Wailua
4-person families (90 | 15.7%) account for the highest median family income in Wailua with $100,357 per family, while 2-person families (294 | 51.3%) have the highest median income of $29,728 per family member.
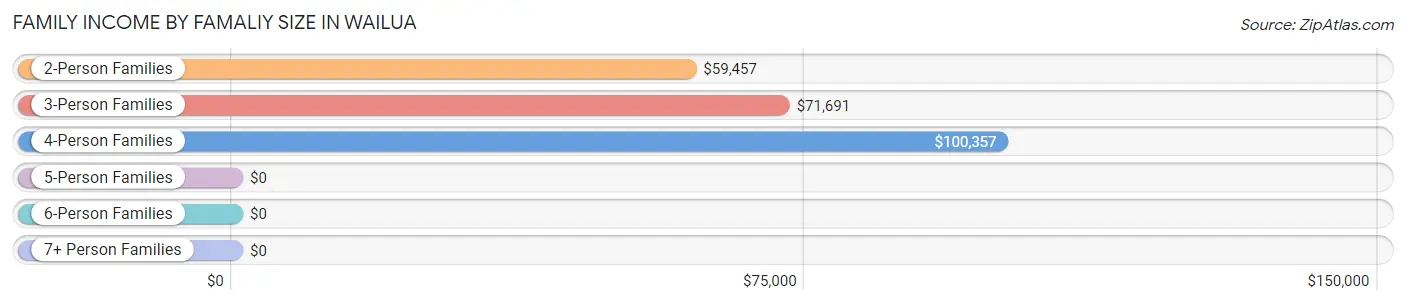
| Income Bracket | # Families | Median Income |
| 2-Person Families | 294 (51.3%) | $59,457 |
| 3-Person Families | 139 (24.3%) | $71,691 |
| 4-Person Families | 90 (15.7%) | $100,357 |
| 5-Person Families | 16 (2.8%) | $0 |
| 6-Person Families | 34 (5.9%) | $0 |
| 7+ Person Families | 0 (0.0%) | $0 |
| Total | 573 (100.0%) | $80,733 |
Family Income by Number of Earners in Wailua
The median family income in Wailua is $80,733, with families comprising 3+ earners (80) having the highest median family income of $218,889, while families with 1 earner (189) have the lowest median family income of $57,755, accounting for 14.0% and 33.0% of families, respectively.
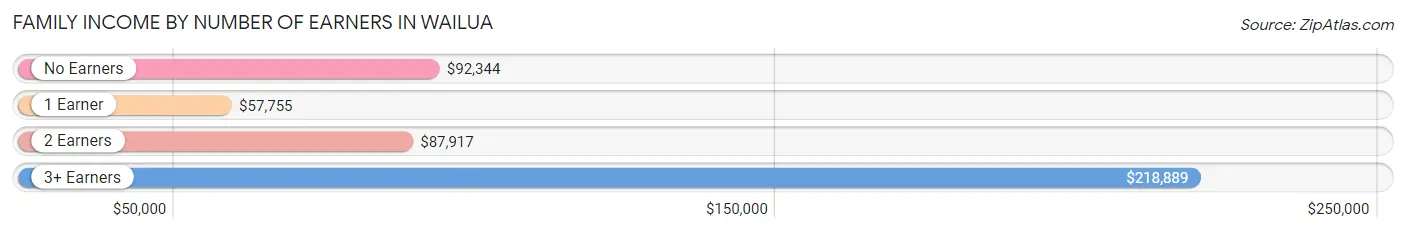
| Number of Earners | # Families | Median Income |
| No Earners | 69 (12.0%) | $92,344 |
| 1 Earner | 189 (33.0%) | $57,755 |
| 2 Earners | 235 (41.0%) | $87,917 |
| 3+ Earners | 80 (14.0%) | $218,889 |
| Total | 573 (100.0%) | $80,733 |
Household Income in Wailua
Household Income Brackets in Wailua
With 178 households falling in the category, the $50,000 to $74,999 income range is the most frequent in Wailua, accounting for 19.5% of all households. In contrast, only 28 households (3.1%) fall into the less than $10,000 income bracket, making it the least populous group.
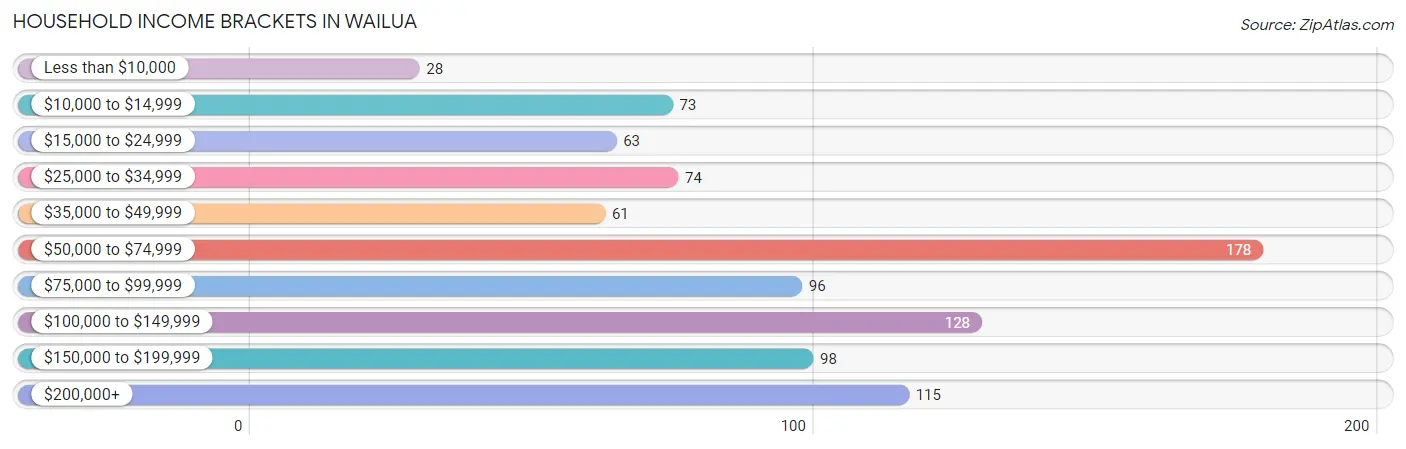
| Income Bracket | # Households | % Households |
| Less than $10,000 | 28 | 3.1% |
| $10,000 to $14,999 | 73 | 8.0% |
| $15,000 to $24,999 | 63 | 6.9% |
| $25,000 to $34,999 | 74 | 8.1% |
| $35,000 to $49,999 | 61 | 6.7% |
| $50,000 to $74,999 | 178 | 19.5% |
| $75,000 to $99,999 | 96 | 10.5% |
| $100,000 to $149,999 | 128 | 14.0% |
| $150,000 to $199,999 | 98 | 10.7% |
| $200,000+ | 115 | 12.6% |
Household Income by Householder Age in Wailua
The median household income in Wailua is $67,258, with the highest median household income of $98,264 found in the 25 to 44 years age bracket for the primary householder. A total of 252 households (27.6%) fall into this category. Meanwhile, the 15 to 24 years age bracket for the primary householder has the lowest median household income of $0, with 12 households (1.3%) in this group.
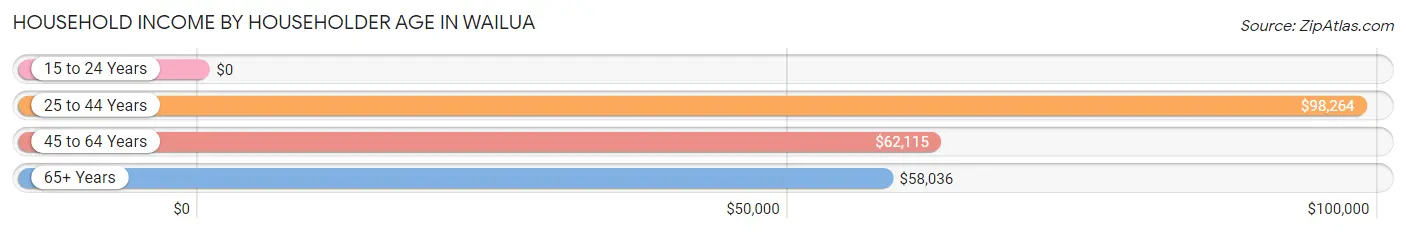
| Income Bracket | # Households | Median Income |
| 15 to 24 Years | 12 (1.3%) | $0 |
| 25 to 44 Years | 252 (27.6%) | $98,264 |
| 45 to 64 Years | 314 (34.4%) | $62,115 |
| 65+ Years | 336 (36.8%) | $58,036 |
| Total | 914 (100.0%) | $67,258 |
Poverty in Wailua
Income Below Poverty by Sex and Age in Wailua
With 15.9% poverty level for males and 13.4% for females among the residents of Wailua, 15 year old males and 15 year old females are the most vulnerable to poverty, with 11 males (100.0%) and 9 females (50.0%) in their respective age groups living below the poverty level.
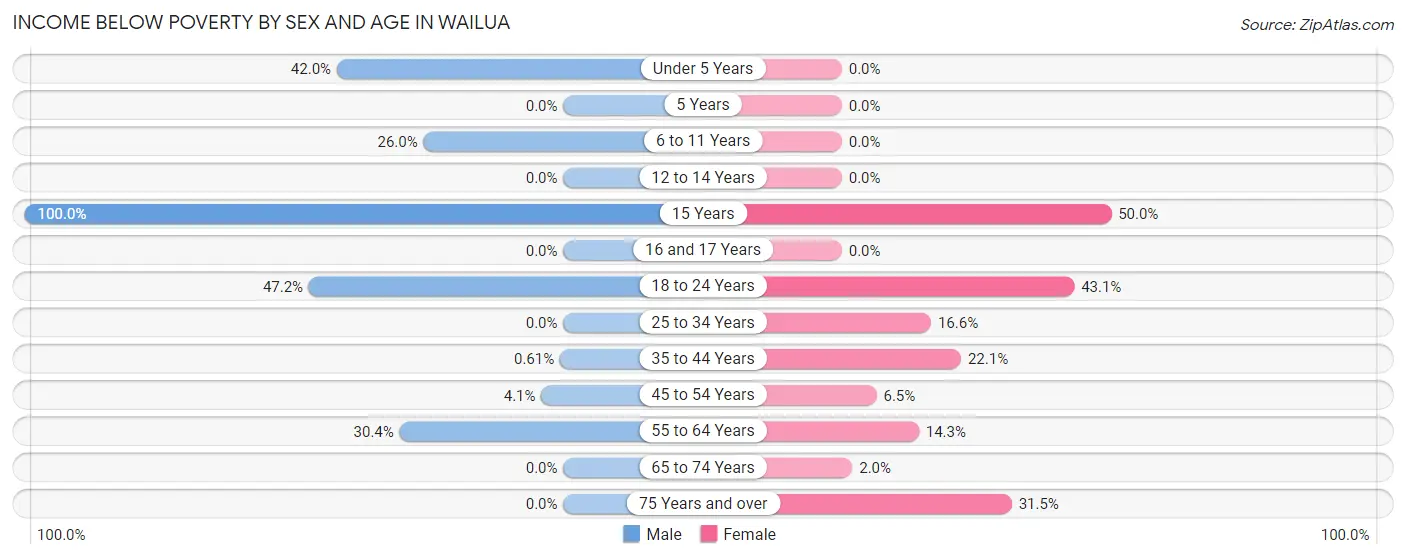
| Age Bracket | Male | Female |
| Under 5 Years | 29 (42.0%) | 0 (0.0%) |
| 5 Years | 0 (0.0%) | 0 (0.0%) |
| 6 to 11 Years | 48 (26.0%) | 0 (0.0%) |
| 12 to 14 Years | 0 (0.0%) | 0 (0.0%) |
| 15 Years | 11 (100.0%) | 9 (50.0%) |
| 16 and 17 Years | 0 (0.0%) | 0 (0.0%) |
| 18 to 24 Years | 51 (47.2%) | 22 (43.1%) |
| 25 to 34 Years | 0 (0.0%) | 27 (16.6%) |
| 35 to 44 Years | 1 (0.6%) | 25 (22.1%) |
| 45 to 54 Years | 4 (4.1%) | 6 (6.5%) |
| 55 to 64 Years | 62 (30.4%) | 18 (14.3%) |
| 65 to 74 Years | 0 (0.0%) | 5 (1.9%) |
| 75 Years and over | 0 (0.0%) | 41 (31.5%) |
| Total | 206 (15.9%) | 153 (13.4%) |
Income Above Poverty by Sex and Age in Wailua
According to the poverty statistics in Wailua, males aged 5 years and females aged under 5 years are the age groups that are most secure financially, with 100.0% of males and 100.0% of females in these age groups living above the poverty line.
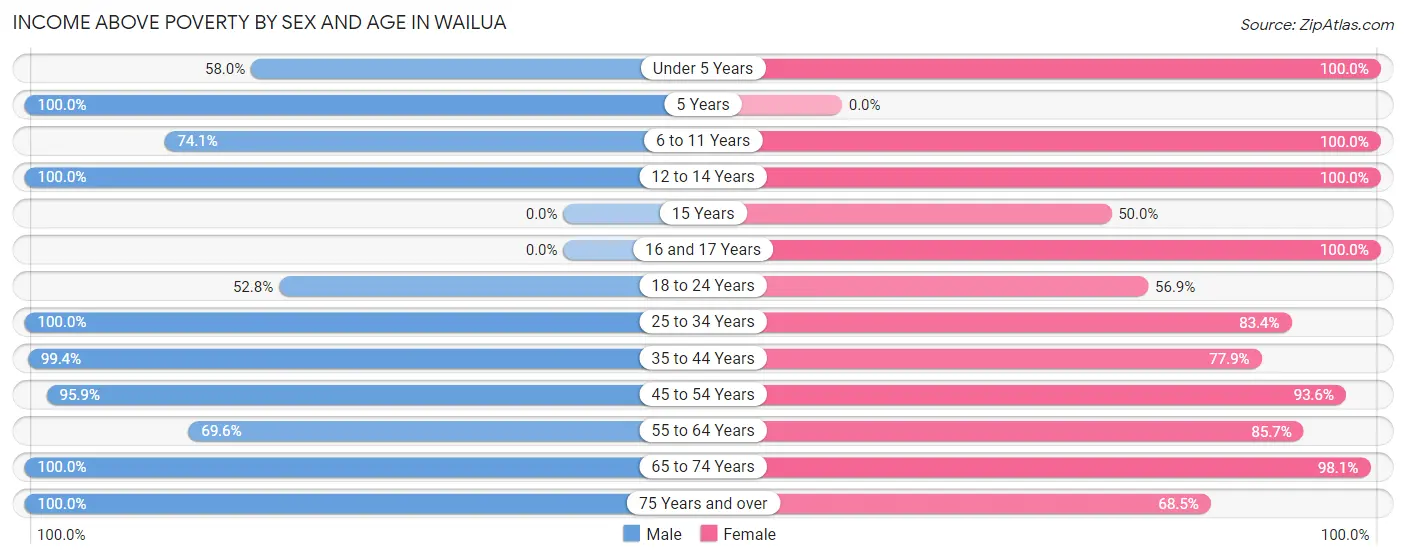
| Age Bracket | Male | Female |
| Under 5 Years | 40 (58.0%) | 9 (100.0%) |
| 5 Years | 16 (100.0%) | 0 (0.0%) |
| 6 to 11 Years | 137 (74.1%) | 114 (100.0%) |
| 12 to 14 Years | 6 (100.0%) | 61 (100.0%) |
| 15 Years | 0 (0.0%) | 9 (50.0%) |
| 16 and 17 Years | 0 (0.0%) | 12 (100.0%) |
| 18 to 24 Years | 57 (52.8%) | 29 (56.9%) |
| 25 to 34 Years | 177 (100.0%) | 136 (83.4%) |
| 35 to 44 Years | 164 (99.4%) | 88 (77.9%) |
| 45 to 54 Years | 94 (95.9%) | 87 (93.5%) |
| 55 to 64 Years | 142 (69.6%) | 108 (85.7%) |
| 65 to 74 Years | 141 (100.0%) | 251 (98.1%) |
| 75 Years and over | 112 (100.0%) | 89 (68.5%) |
| Total | 1,086 (84.1%) | 993 (86.7%) |
Income Below Poverty Among Married-Couple Families in Wailua
The poverty statistics for married-couple families in Wailua show that 1.7% or 6 of the total 358 families live below the poverty line. Families with no children have the highest poverty rate of 2.3%, comprising of 6 families. On the other hand, families with 1 or 2 children have the lowest poverty rate of 0.0%, which includes 0 families.
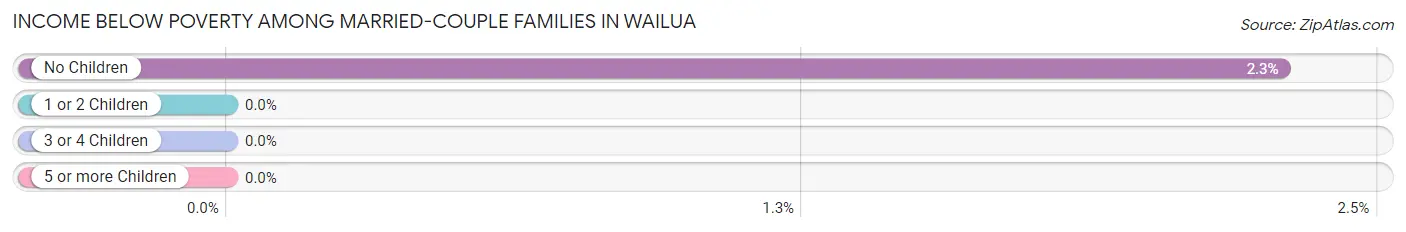
| Children | Above Poverty | Below Poverty |
| No Children | 256 (97.7%) | 6 (2.3%) |
| 1 or 2 Children | 64 (100.0%) | 0 (0.0%) |
| 3 or 4 Children | 32 (100.0%) | 0 (0.0%) |
| 5 or more Children | 0 (0.0%) | 0 (0.0%) |
| Total | 352 (98.3%) | 6 (1.7%) |
Income Below Poverty Among Single-Parent Households in Wailua
According to the poverty data in Wailua, 43.3% or 45 single-father households and 24.3% or 27 single-mother households are living below the poverty line. Among single-father households, those with no children have the highest poverty rate, with 33 households (78.6%) experiencing poverty. Likewise, among single-mother households, those with 1 or 2 children have the highest poverty rate, with 27 households (45.8%) falling below the poverty line.
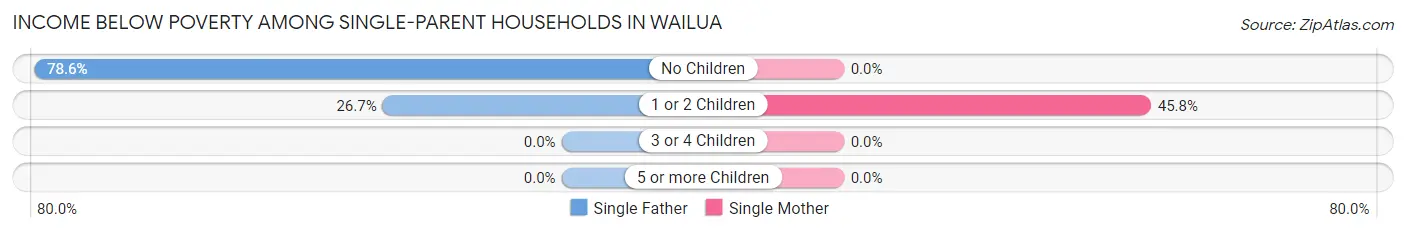
| Children | Single Father | Single Mother |
| No Children | 33 (78.6%) | 0 (0.0%) |
| 1 or 2 Children | 12 (26.7%) | 27 (45.8%) |
| 3 or 4 Children | 0 (0.0%) | 0 (0.0%) |
| 5 or more Children | 0 (0.0%) | 0 (0.0%) |
| Total | 45 (43.3%) | 27 (24.3%) |
Income Below Poverty Among Married-Couple vs Single-Parent Households in Wailua
The poverty data for Wailua shows that 6 of the married-couple family households (1.7%) and 72 of the single-parent households (33.5%) are living below the poverty level. Within the married-couple family households, those with no children have the highest poverty rate, with 6 households (2.3%) falling below the poverty line. Among the single-parent households, those with 1 or 2 children have the highest poverty rate, with 39 household (37.5%) living below poverty.
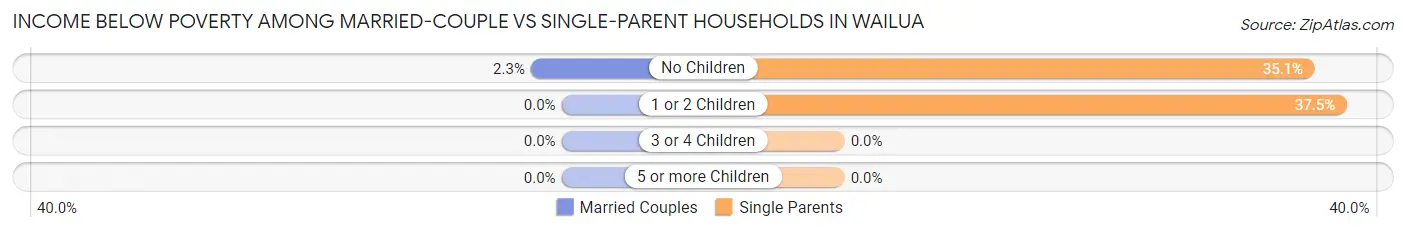
| Children | Married-Couple Families | Single-Parent Households |
| No Children | 6 (2.3%) | 33 (35.1%) |
| 1 or 2 Children | 0 (0.0%) | 39 (37.5%) |
| 3 or 4 Children | 0 (0.0%) | 0 (0.0%) |
| 5 or more Children | 0 (0.0%) | 0 (0.0%) |
| Total | 6 (1.7%) | 72 (33.5%) |
Race in Wailua
The most populous races in Wailua are White / Caucasian (919 | 37.7%), Two or more Races (827 | 33.9%), and Asian (565 | 23.2%).
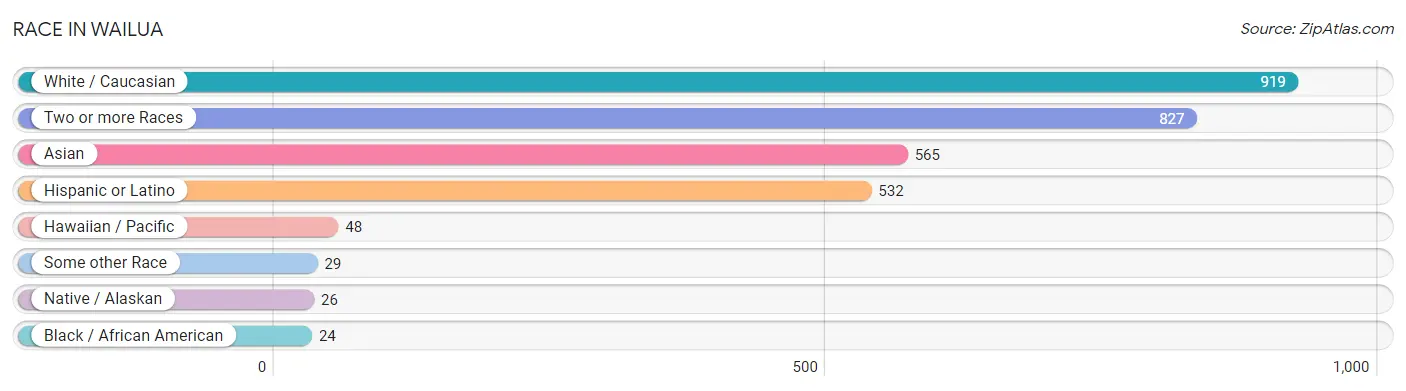
| Race | # Population | % Population |
| Asian | 565 | 23.2% |
| Black / African American | 24 | 1.0% |
| Hawaiian / Pacific | 48 | 2.0% |
| Hispanic or Latino | 532 | 21.8% |
| Native / Alaskan | 26 | 1.1% |
| White / Caucasian | 919 | 37.7% |
| Two or more Races | 827 | 33.9% |
| Some other Race | 29 | 1.2% |
| Total | 2,438 | 100.0% |
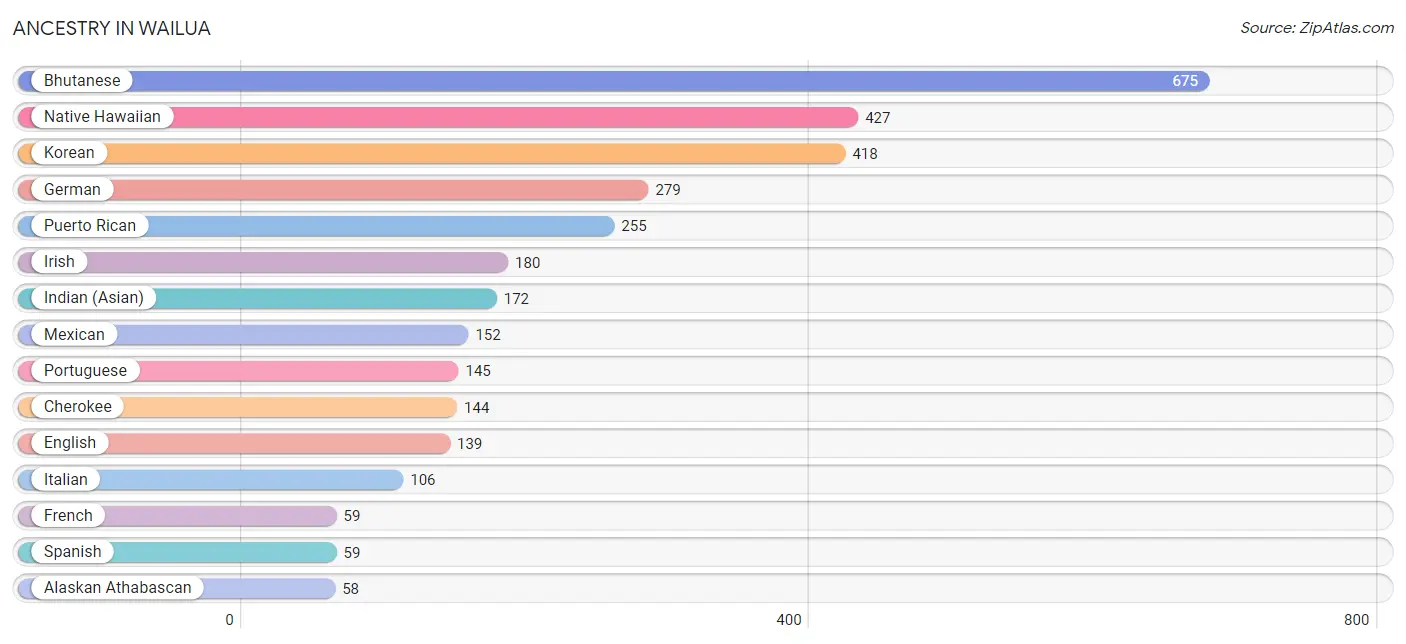
Ancestry in Wailua
The most populous ancestries reported in Wailua are Bhutanese (675 | 27.7%), Native Hawaiian (427 | 17.5%), Korean (418 | 17.2%), German (279 | 11.4%), and Puerto Rican (255 | 10.5%), together accounting for 84.3% of all Wailua residents.
| Ancestry | # Population | % Population |
| Alaskan Athabascan | 58 | 2.4% |
| American | 18 | 0.7% |
| Apache | 58 | 2.4% |
| Bhutanese | 675 | 27.7% |
| Brazilian | 18 | 0.7% |
| Central American | 5 | 0.2% |
| Cherokee | 144 | 5.9% |
| Chinese | 9 | 0.4% |
| Choctaw | 11 | 0.4% |
| Colombian | 39 | 1.6% |
| Danish | 17 | 0.7% |
| English | 139 | 5.7% |
| European | 13 | 0.5% |
| French | 59 | 2.4% |
| French Canadian | 25 | 1.0% |
| German | 279 | 11.4% |
| Greek | 38 | 1.6% |
| Haitian | 24 | 1.0% |
| Hungarian | 17 | 0.7% |
| Indian (Asian) | 172 | 7.0% |
| Irish | 180 | 7.4% |
| Iroquois | 12 | 0.5% |
| Italian | 106 | 4.3% |
| Korean | 418 | 17.2% |
| Menominee | 3 | 0.1% |
| Mexican | 152 | 6.2% |
| Mexican American Indian | 36 | 1.5% |
| Native Hawaiian | 427 | 17.5% |
| Navajo | 58 | 2.4% |
| Norwegian | 21 | 0.9% |
| Pakistani | 10 | 0.4% |
| Pima | 4 | 0.2% |
| Portuguese | 145 | 5.9% |
| Puerto Rican | 255 | 10.5% |
| Russian | 5 | 0.2% |
| Salvadoran | 5 | 0.2% |
| Scotch-Irish | 12 | 0.5% |
| Scottish | 6 | 0.3% |
| South American | 39 | 1.6% |
| Spaniard | 4 | 0.2% |
| Spanish | 59 | 2.4% |
| Spanish American | 18 | 0.7% |
| Swedish | 6 | 0.3% |
| Swiss | 9 | 0.4% |
| Tongan | 16 | 0.7% |
| Ukrainian | 5 | 0.2% |
| Welsh | 21 | 0.9% |
| Yuman | 3 | 0.1% | View All 48 Rows |
Immigrants in Wailua
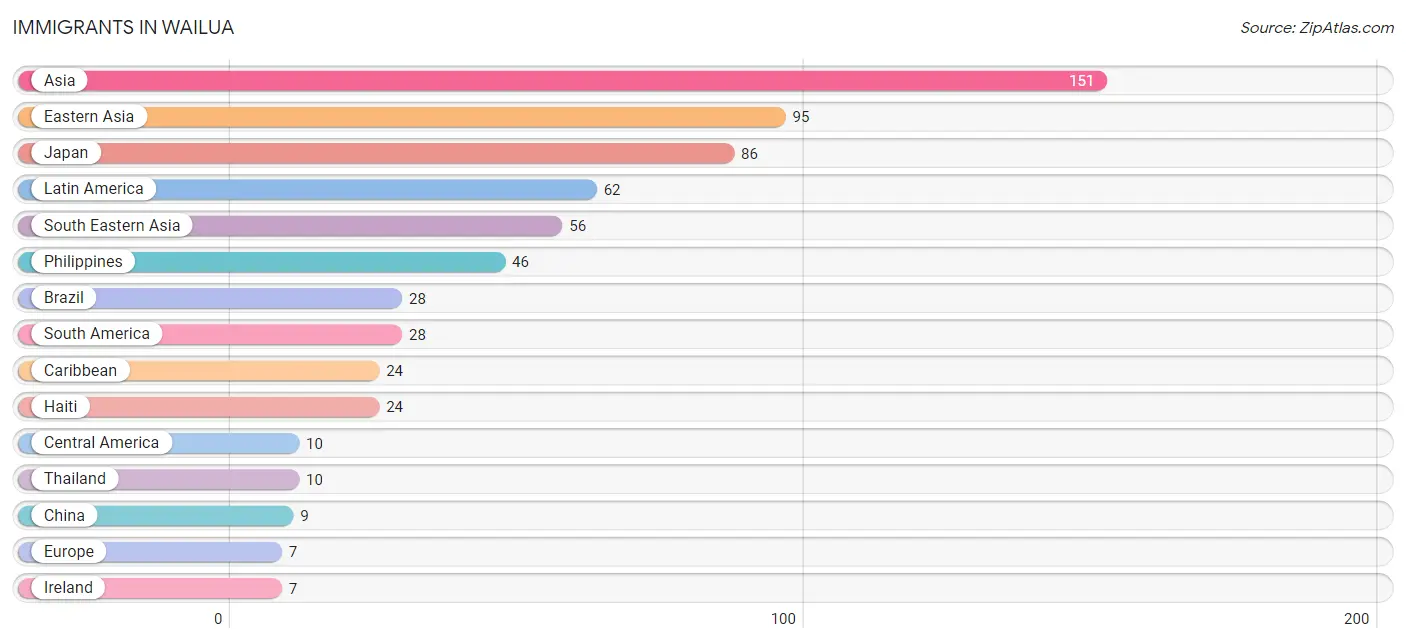
The most numerous immigrant groups reported in Wailua came from Asia (151 | 6.2%), Eastern Asia (95 | 3.9%), Japan (86 | 3.5%), Latin America (62 | 2.5%), and South Eastern Asia (56 | 2.3%), together accounting for 18.5% of all Wailua residents.
| Immigration Origin | # Population | % Population |
| Asia | 151 | 6.2% |
| Brazil | 28 | 1.1% |
| Caribbean | 24 | 1.0% |
| Central America | 10 | 0.4% |
| China | 9 | 0.4% |
| Eastern Asia | 95 | 3.9% |
| El Salvador | 5 | 0.2% |
| Europe | 7 | 0.3% |
| Haiti | 24 | 1.0% |
| Ireland | 7 | 0.3% |
| Japan | 86 | 3.5% |
| Latin America | 62 | 2.5% |
| Mexico | 5 | 0.2% |
| Northern Europe | 7 | 0.3% |
| Philippines | 46 | 1.9% |
| South America | 28 | 1.1% |
| South Eastern Asia | 56 | 2.3% |
| Thailand | 10 | 0.4% | View All 18 Rows |
Sex and Age in Wailua
Sex and Age in Wailua
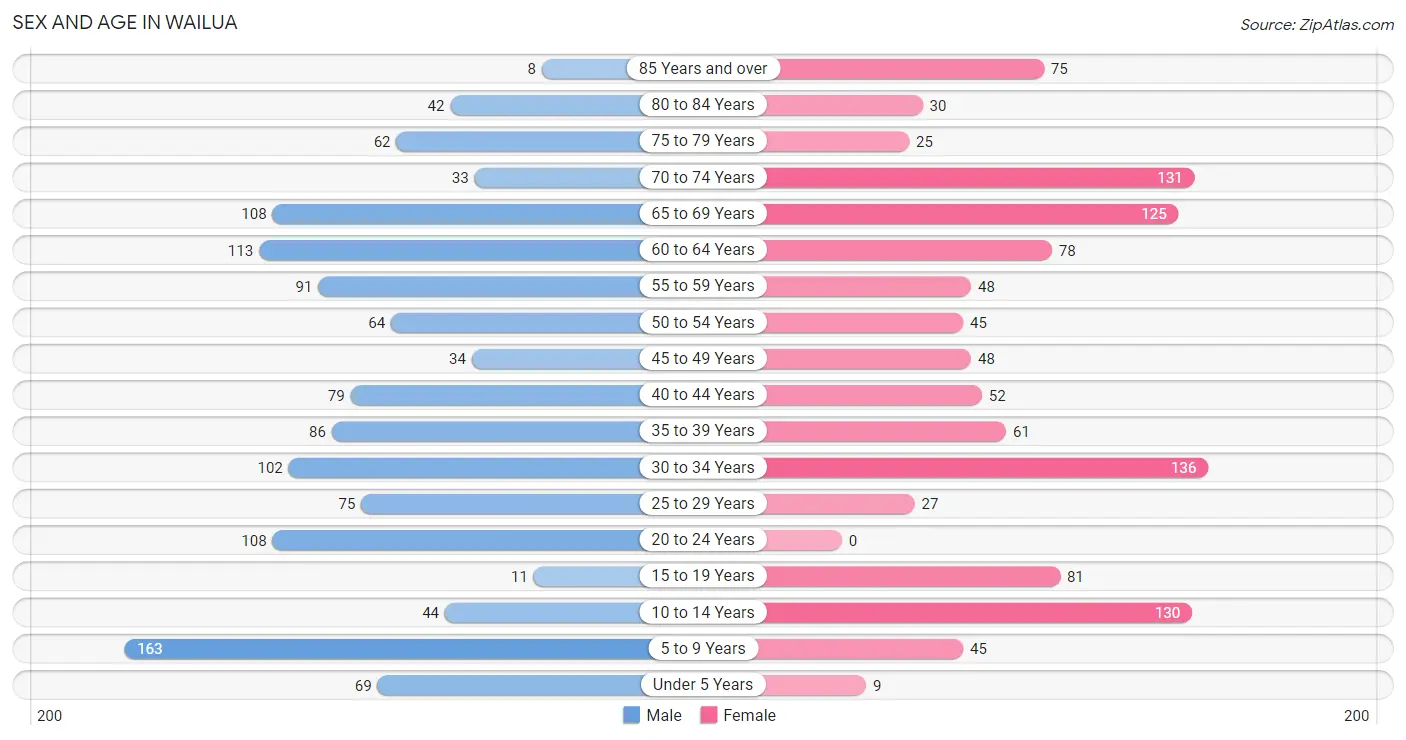
The most populous age groups in Wailua are 5 to 9 Years (163 | 12.6%) for men and 30 to 34 Years (136 | 11.9%) for women.
| Age Bracket | Male | Female |
| Under 5 Years | 69 (5.3%) | 9 (0.8%) |
| 5 to 9 Years | 163 (12.6%) | 45 (3.9%) |
| 10 to 14 Years | 44 (3.4%) | 130 (11.3%) |
| 15 to 19 Years | 11 (0.9%) | 81 (7.1%) |
| 20 to 24 Years | 108 (8.4%) | 0 (0.0%) |
| 25 to 29 Years | 75 (5.8%) | 27 (2.4%) |
| 30 to 34 Years | 102 (7.9%) | 136 (11.9%) |
| 35 to 39 Years | 86 (6.7%) | 61 (5.3%) |
| 40 to 44 Years | 79 (6.1%) | 52 (4.5%) |
| 45 to 49 Years | 34 (2.6%) | 48 (4.2%) |
| 50 to 54 Years | 64 (5.0%) | 45 (3.9%) |
| 55 to 59 Years | 91 (7.0%) | 48 (4.2%) |
| 60 to 64 Years | 113 (8.7%) | 78 (6.8%) |
| 65 to 69 Years | 108 (8.4%) | 125 (10.9%) |
| 70 to 74 Years | 33 (2.5%) | 131 (11.4%) |
| 75 to 79 Years | 62 (4.8%) | 25 (2.2%) |
| 80 to 84 Years | 42 (3.3%) | 30 (2.6%) |
| 85 Years and over | 8 (0.6%) | 75 (6.5%) |
| Total | 1,292 (100.0%) | 1,146 (100.0%) |
Families and Households in Wailua
Median Family Size in Wailua
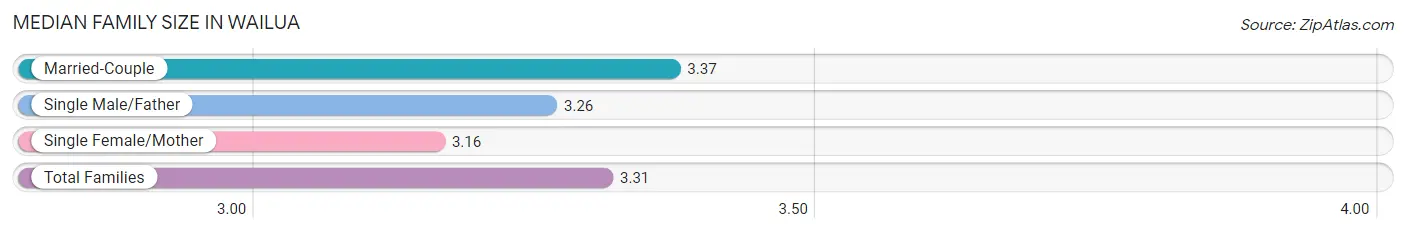
The median family size in Wailua is 3.31 persons per family, with married-couple families (358 | 62.5%) accounting for the largest median family size of 3.37 persons per family. On the other hand, single female/mother families (111 | 19.4%) represent the smallest median family size with 3.16 persons per family.
| Family Type | # Families | Family Size |
| Married-Couple | 358 (62.5%) | 3.37 |
| Single Male/Father | 104 (18.1%) | 3.26 |
| Single Female/Mother | 111 (19.4%) | 3.16 |
| Total Families | 573 (100.0%) | 3.31 |
Median Household Size in Wailua
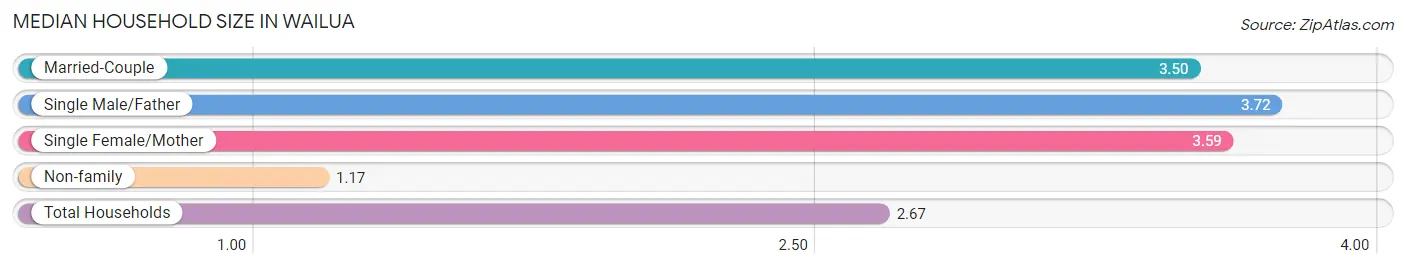
The median household size in Wailua is 2.67 persons per household, with single male/father households (104 | 11.4%) accounting for the largest median household size of 3.72 persons per household. non-family households (341 | 37.3%) represent the smallest median household size with 1.17 persons per household.
| Household Type | # Households | Household Size |
| Married-Couple | 358 (39.2%) | 3.50 |
| Single Male/Father | 104 (11.4%) | 3.72 |
| Single Female/Mother | 111 (12.1%) | 3.59 |
| Non-family | 341 (37.3%) | 1.17 |
| Total Households | 914 (100.0%) | 2.67 |
Household Size by Marriage Status in Wailua
Out of a total of 914 households in Wailua, 573 (62.7%) are family households, while 341 (37.3%) are nonfamily households. The most numerous type of family households are 2-person households, comprising 267, and the most common type of nonfamily households are 1-person households, comprising 283.
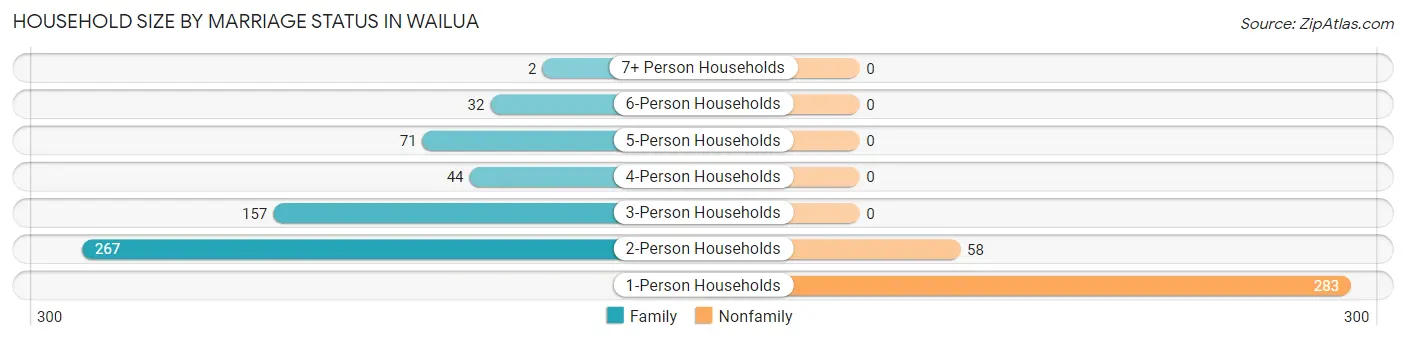
| Household Size | Family Households | Nonfamily Households |
| 1-Person Households | - | 283 (31.0%) |
| 2-Person Households | 267 (29.2%) | 58 (6.4%) |
| 3-Person Households | 157 (17.2%) | 0 (0.0%) |
| 4-Person Households | 44 (4.8%) | 0 (0.0%) |
| 5-Person Households | 71 (7.8%) | 0 (0.0%) |
| 6-Person Households | 32 (3.5%) | 0 (0.0%) |
| 7+ Person Households | 2 (0.2%) | 0 (0.0%) |
| Total | 573 (62.7%) | 341 (37.3%) |
Female Fertility in Wailua
Fertility by Age in Wailua
Average fertility rate in Wailua is 102.0 births per 1,000 women. Women in the age bracket of 20 to 34 years have the highest fertility rate with 264.0 births per 1,000 women. Women in the age bracket of 20 to 34 years acount for 100.0% of all women with births.
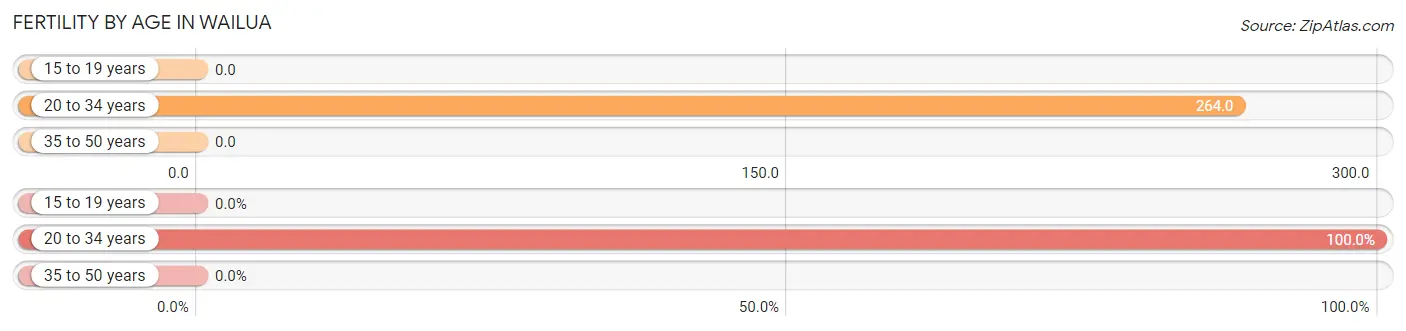
| Age Bracket | Women with Births | Births / 1,000 Women |
| 15 to 19 years | 0 (0.0%) | 0.0 |
| 20 to 34 years | 43 (100.0%) | 264.0 |
| 35 to 50 years | 0 (0.0%) | 0.0 |
| Total | 43 (100.0%) | 102.0 |
Fertility by Age by Marriage Status in Wailua
9.3% of women with births (43) in Wailua are married. The highest percentage of unmarried women with births falls into 20 to 34 years age bracket with 90.7% of them unmarried at the time of birth, while the lowest percentage of unmarried women with births belong to 20 to 34 years age bracket with 90.7% of them unmarried.
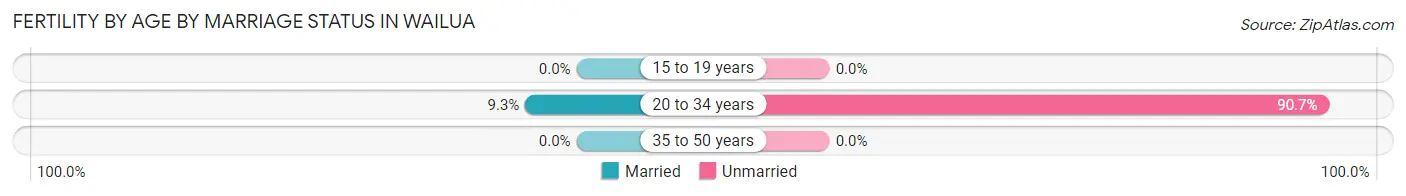
| Age Bracket | Married | Unmarried |
| 15 to 19 years | 0 (0.0%) | 0 (0.0%) |
| 20 to 34 years | 4 (9.3%) | 39 (90.7%) |
| 35 to 50 years | 0 (0.0%) | 0 (0.0%) |
| Total | 4 (9.3%) | 39 (90.7%) |
Fertility by Education in Wailua
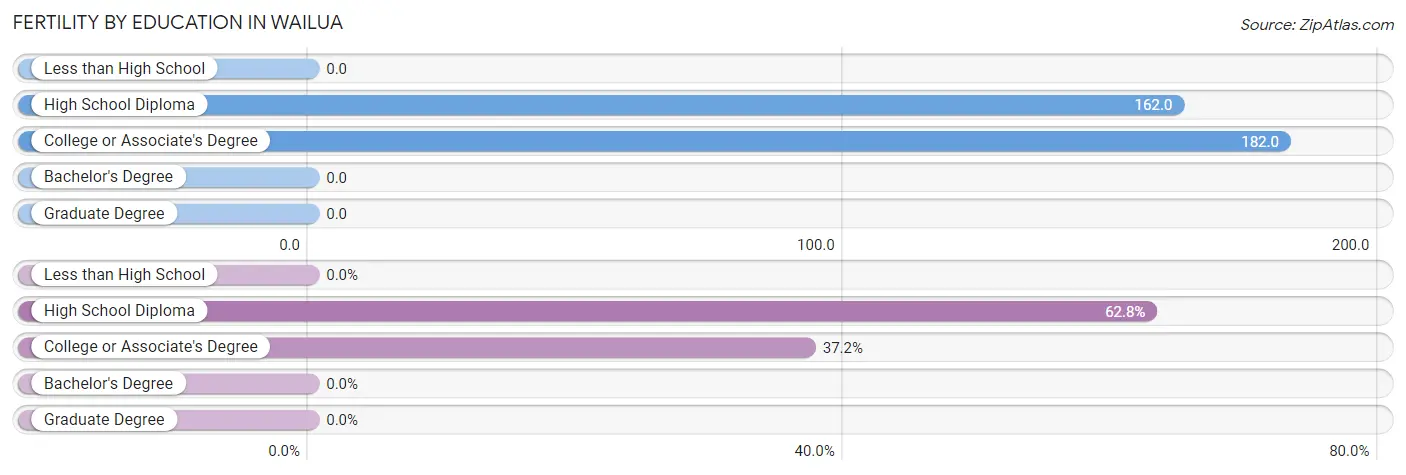
| Educational Attainment | Women with Births | Births / 1,000 Women |
| Less than High School | 0 (0.0%) | 0.0 |
| High School Diploma | 27 (62.8%) | 162.0 |
| College or Associate's Degree | 16 (37.2%) | 182.0 |
| Bachelor's Degree | 0 (0.0%) | 0.0 |
| Graduate Degree | 0 (0.0%) | 0.0 |
| Total | 43 (100.0%) | 102.0 |
Fertility by Education by Marriage Status in Wailua
90.7% of women with births in Wailua are unmarried. Women with the educational attainment of college or associate's degree are most likely to be married with 25.0% of them married at childbirth, while women with the educational attainment of high school diploma are least likely to be married with 100.0% of them unmarried at childbirth.
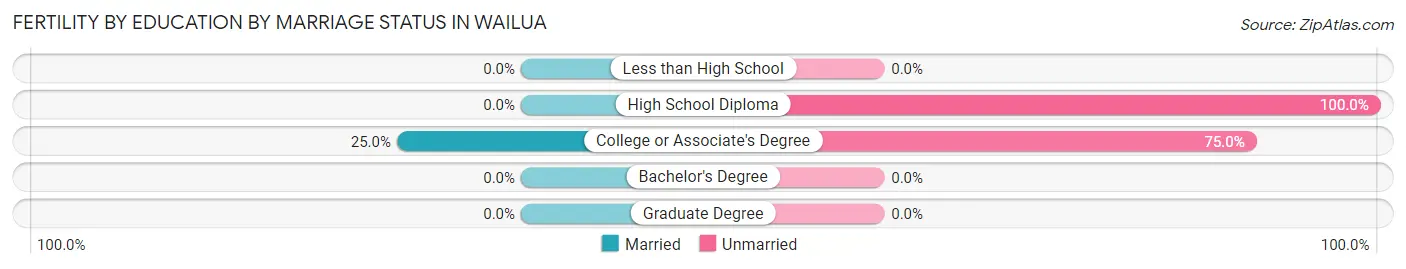
| Educational Attainment | Married | Unmarried |
| Less than High School | 0 (0.0%) | 0 (0.0%) |
| High School Diploma | 0 (0.0%) | 27 (100.0%) |
| College or Associate's Degree | 4 (25.0%) | 12 (75.0%) |
| Bachelor's Degree | 0 (0.0%) | 0 (0.0%) |
| Graduate Degree | 0 (0.0%) | 0 (0.0%) |
| Total | 4 (9.3%) | 39 (90.7%) |
Employment Characteristics in Wailua
Employment by Class of Employer in Wailua
Among the 1,059 employed individuals in Wailua, private company employees (618 | 58.4%), self-employed (not incorporated) (129 | 12.2%), and state government employees (98 | 9.2%) make up the most common classes of employment.
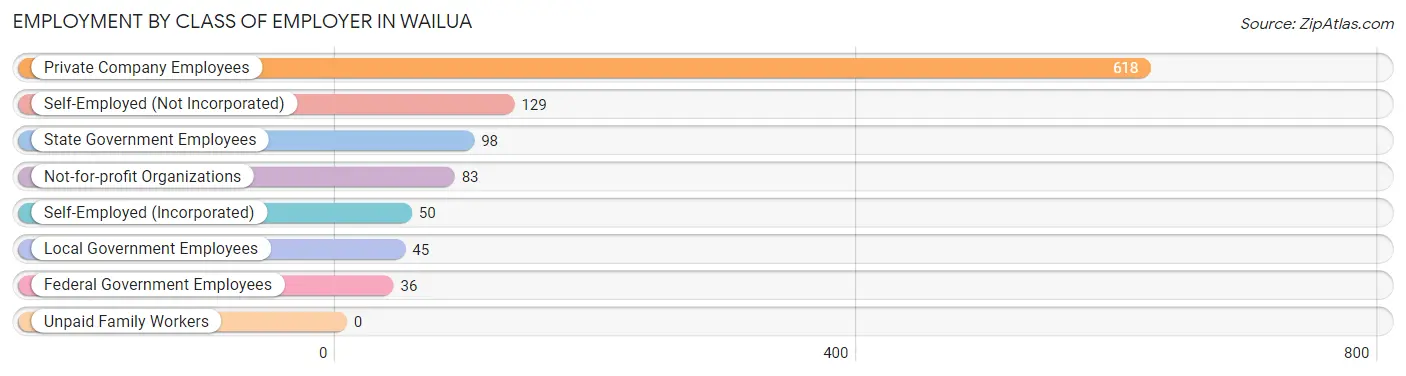
| Employer Class | # Employees | % Employees |
| Private Company Employees | 618 | 58.4% |
| Self-Employed (Incorporated) | 50 | 4.7% |
| Self-Employed (Not Incorporated) | 129 | 12.2% |
| Not-for-profit Organizations | 83 | 7.8% |
| Local Government Employees | 45 | 4.3% |
| State Government Employees | 98 | 9.2% |
| Federal Government Employees | 36 | 3.4% |
| Unpaid Family Workers | 0 | 0.0% |
| Total | 1,059 | 100.0% |
Employment Status by Age in Wailua
According to the labor force statistics for Wailua, out of the total population over 16 years of age (1,949), 60.8% or 1,185 individuals are in the labor force, with 8.2% or 97 of them unemployed. The age group with the highest labor force participation rate is 30 to 34 years, with 100.0% or 238 individuals in the labor force. Within the labor force, the 60 to 64 years age range has the highest percentage of unemployed individuals, with 33.9% or 42 of them being unemployed.
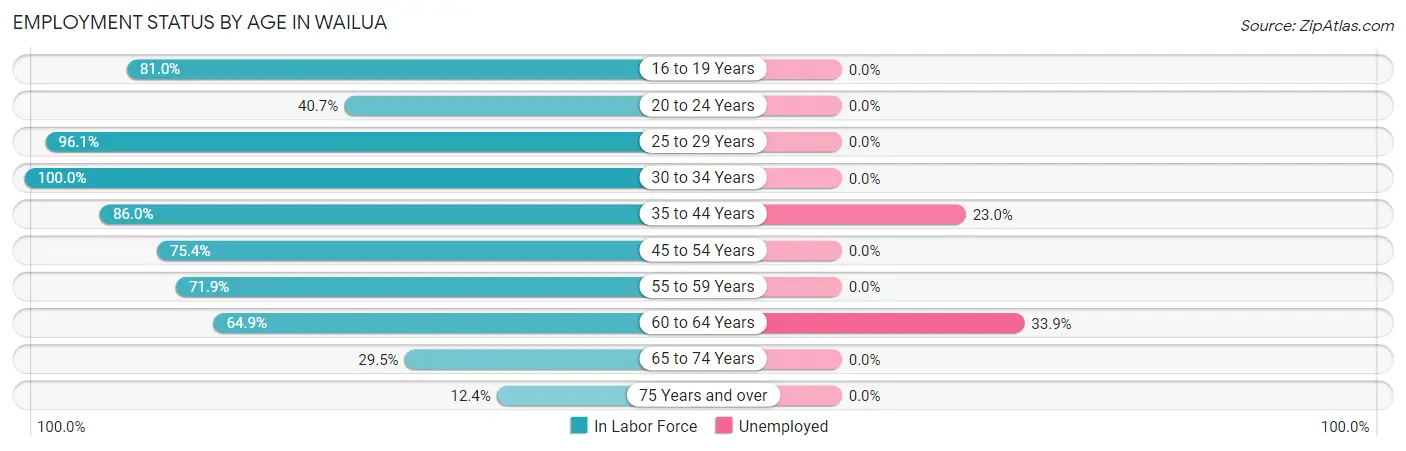
| Age Bracket | In Labor Force | Unemployed |
| 16 to 19 Years | 51 (81.0%) | 0 (0.0%) |
| 20 to 24 Years | 44 (40.7%) | 0 (0.0%) |
| 25 to 29 Years | 98 (96.1%) | 0 (0.0%) |
| 30 to 34 Years | 238 (100.0%) | 0 (0.0%) |
| 35 to 44 Years | 239 (86.0%) | 55 (23.0%) |
| 45 to 54 Years | 144 (75.4%) | 0 (0.0%) |
| 55 to 59 Years | 100 (71.9%) | 0 (0.0%) |
| 60 to 64 Years | 124 (64.9%) | 42 (33.9%) |
| 65 to 74 Years | 117 (29.5%) | 0 (0.0%) |
| 75 Years and over | 30 (12.4%) | 0 (0.0%) |
| Total | 1,185 (60.8%) | 97 (8.2%) |
Employment Status by Educational Attainment in Wailua
According to labor force statistics for Wailua, 82.8% of individuals (943) out of the total population between 25 and 64 years of age (1,139) are in the labor force, with 10.3% or 97 of them being unemployed. The group with the highest labor force participation rate are those with the educational attainment of less than high school, with 92.7% or 76 individuals in the labor force. Within the labor force, individuals with bachelor's degree or higher education have the highest percentage of unemployment, with 17.3% or 60 of them being unemployed.
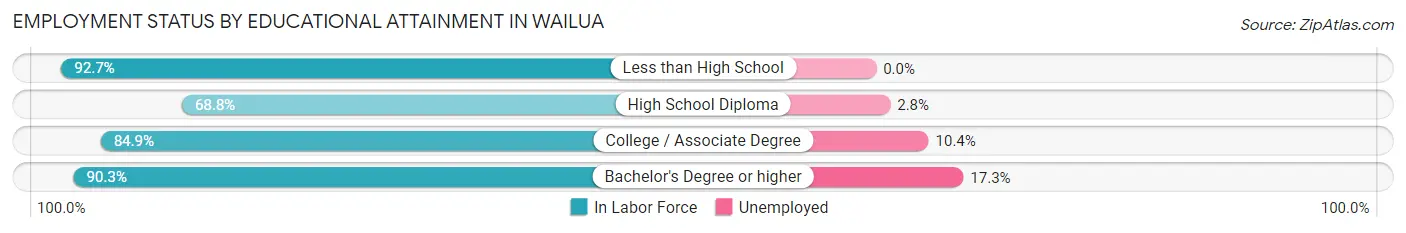
| Educational Attainment | In Labor Force | Unemployed |
| Less than High School | 76 (92.7%) | 0 (0.0%) |
| High School Diploma | 218 (68.8%) | 9 (2.8%) |
| College / Associate Degree | 303 (84.9%) | 37 (10.4%) |
| Bachelor's Degree or higher | 346 (90.3%) | 66 (17.3%) |
| Total | 943 (82.8%) | 117 (10.3%) |
Employment Occupations by Sex in Wailua
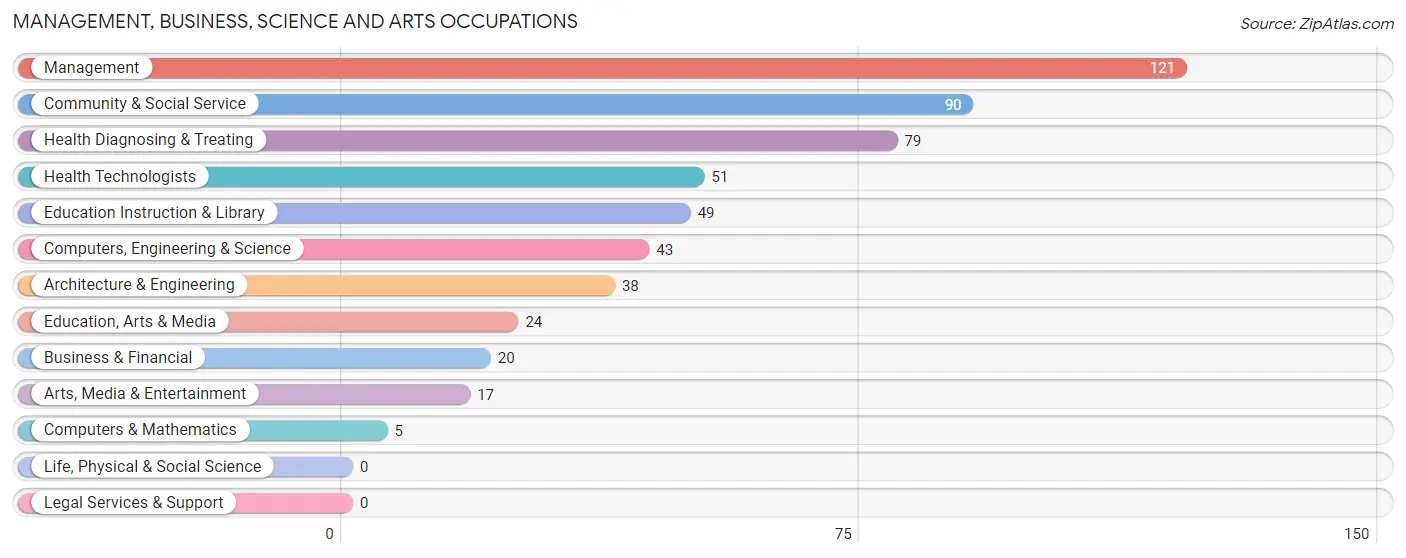
Management, Business, Science and Arts Occupations
The most common Management, Business, Science and Arts occupations in Wailua are Management (121 | 11.2%), Community & Social Service (90 | 8.3%), Health Diagnosing & Treating (79 | 7.3%), Health Technologists (51 | 4.7%), and Education Instruction & Library (49 | 4.5%).
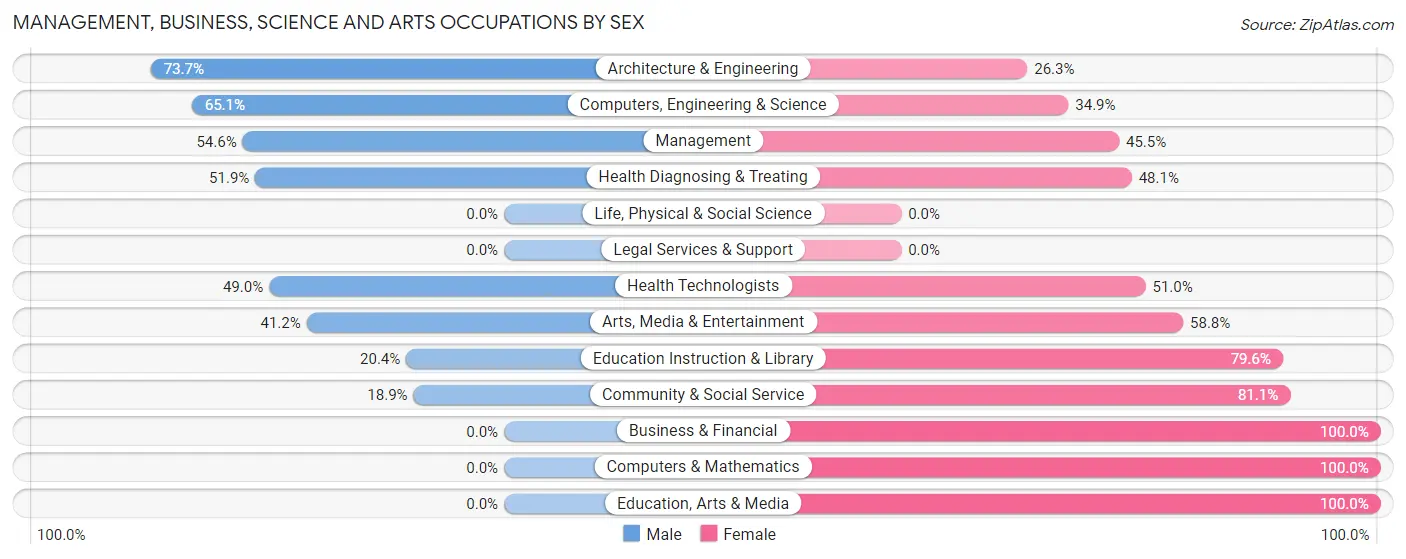
Management, Business, Science and Arts Occupations by Sex
Within the Management, Business, Science and Arts occupations in Wailua, the most male-oriented occupations are Architecture & Engineering (73.7%), Computers, Engineering & Science (65.1%), and Management (54.5%), while the most female-oriented occupations are Business & Financial (100.0%), Computers & Mathematics (100.0%), and Education, Arts & Media (100.0%).
| Occupation | Male | Female |
| Management | 66 (54.5%) | 55 (45.5%) |
| Business & Financial | 0 (0.0%) | 20 (100.0%) |
| Computers, Engineering & Science | 28 (65.1%) | 15 (34.9%) |
| Computers & Mathematics | 0 (0.0%) | 5 (100.0%) |
| Architecture & Engineering | 28 (73.7%) | 10 (26.3%) |
| Life, Physical & Social Science | 0 (0.0%) | 0 (0.0%) |
| Community & Social Service | 17 (18.9%) | 73 (81.1%) |
| Education, Arts & Media | 0 (0.0%) | 24 (100.0%) |
| Legal Services & Support | 0 (0.0%) | 0 (0.0%) |
| Education Instruction & Library | 10 (20.4%) | 39 (79.6%) |
| Arts, Media & Entertainment | 7 (41.2%) | 10 (58.8%) |
| Health Diagnosing & Treating | 41 (51.9%) | 38 (48.1%) |
| Health Technologists | 25 (49.0%) | 26 (51.0%) |
| Total (Category) | 152 (43.1%) | 201 (56.9%) |
| Total (Overall) | 566 (52.2%) | 518 (47.8%) |
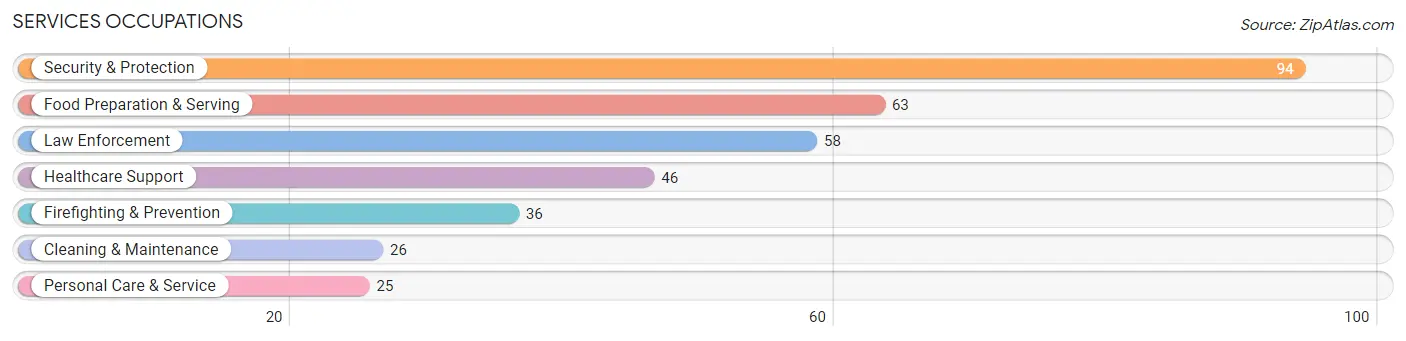
Services Occupations
The most common Services occupations in Wailua are Security & Protection (94 | 8.7%), Food Preparation & Serving (63 | 5.8%), Law Enforcement (58 | 5.3%), Healthcare Support (46 | 4.2%), and Firefighting & Prevention (36 | 3.3%).
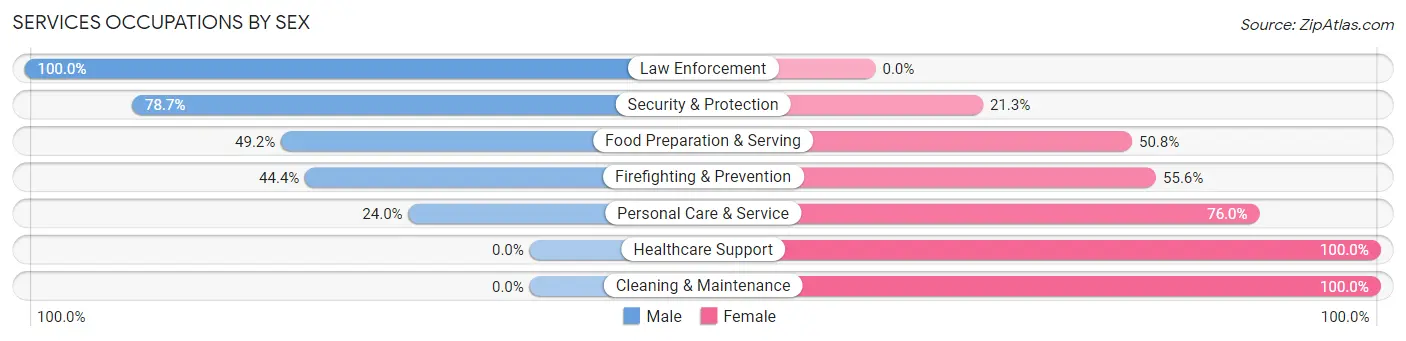
Services Occupations by Sex
Within the Services occupations in Wailua, the most male-oriented occupations are Law Enforcement (100.0%), Security & Protection (78.7%), and Food Preparation & Serving (49.2%), while the most female-oriented occupations are Healthcare Support (100.0%), Cleaning & Maintenance (100.0%), and Personal Care & Service (76.0%).
| Occupation | Male | Female |
| Healthcare Support | 0 (0.0%) | 46 (100.0%) |
| Security & Protection | 74 (78.7%) | 20 (21.3%) |
| Firefighting & Prevention | 16 (44.4%) | 20 (55.6%) |
| Law Enforcement | 58 (100.0%) | 0 (0.0%) |
| Food Preparation & Serving | 31 (49.2%) | 32 (50.8%) |
| Cleaning & Maintenance | 0 (0.0%) | 26 (100.0%) |
| Personal Care & Service | 6 (24.0%) | 19 (76.0%) |
| Total (Category) | 111 (43.7%) | 143 (56.3%) |
| Total (Overall) | 566 (52.2%) | 518 (47.8%) |
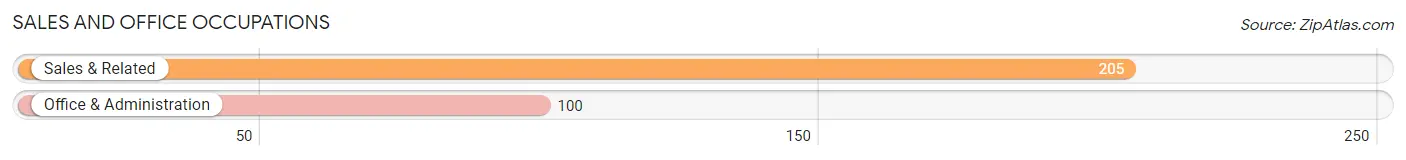
Sales and Office Occupations
The most common Sales and Office occupations in Wailua are Sales & Related (205 | 18.9%), and Office & Administration (100 | 9.2%).
Sales and Office Occupations by Sex
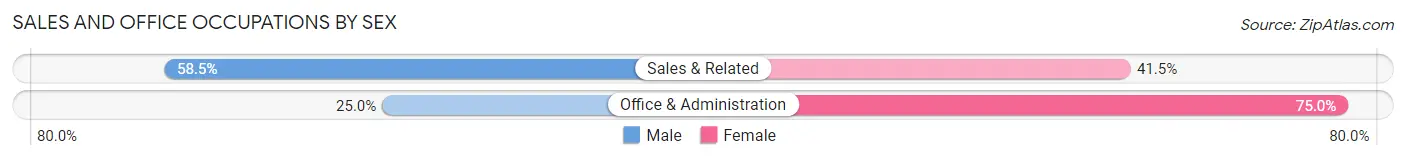
| Occupation | Male | Female |
| Sales & Related | 120 (58.5%) | 85 (41.5%) |
| Office & Administration | 25 (25.0%) | 75 (75.0%) |
| Total (Category) | 145 (47.5%) | 160 (52.5%) |
| Total (Overall) | 566 (52.2%) | 518 (47.8%) |
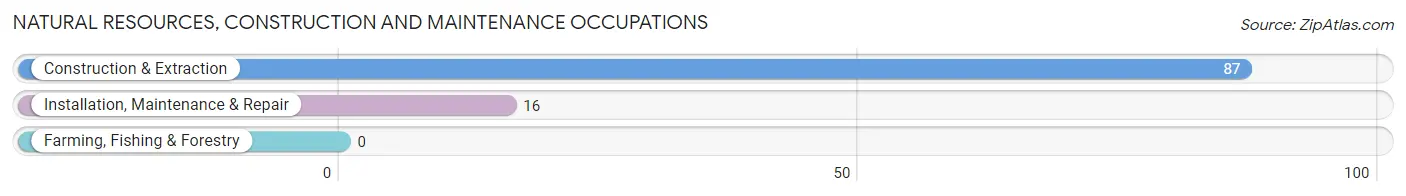
Natural Resources, Construction and Maintenance Occupations
The most common Natural Resources, Construction and Maintenance occupations in Wailua are Construction & Extraction (87 | 8.0%), and Installation, Maintenance & Repair (16 | 1.5%).
Natural Resources, Construction and Maintenance Occupations by Sex
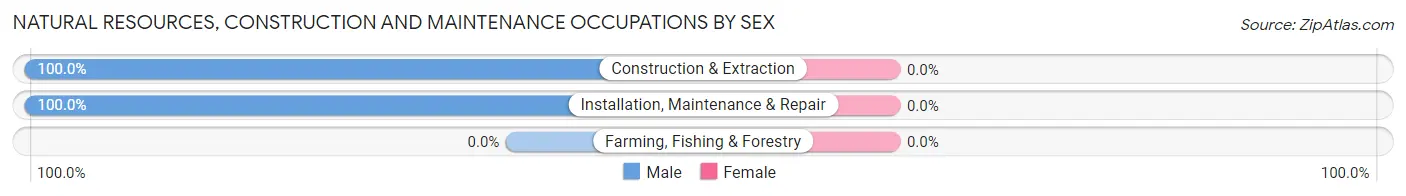
| Occupation | Male | Female |
| Farming, Fishing & Forestry | 0 (0.0%) | 0 (0.0%) |
| Construction & Extraction | 87 (100.0%) | 0 (0.0%) |
| Installation, Maintenance & Repair | 16 (100.0%) | 0 (0.0%) |
| Total (Category) | 103 (100.0%) | 0 (0.0%) |
| Total (Overall) | 566 (52.2%) | 518 (47.8%) |
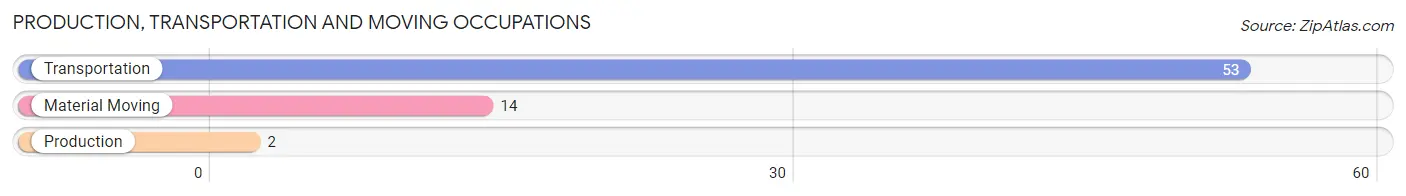
Production, Transportation and Moving Occupations
The most common Production, Transportation and Moving occupations in Wailua are Transportation (53 | 4.9%), Material Moving (14 | 1.3%), and Production (2 | 0.2%).
Production, Transportation and Moving Occupations by Sex
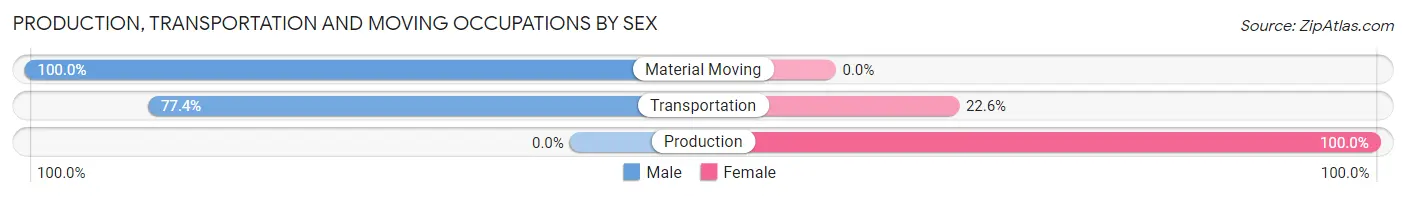
| Occupation | Male | Female |
| Production | 0 (0.0%) | 2 (100.0%) |
| Transportation | 41 (77.4%) | 12 (22.6%) |
| Material Moving | 14 (100.0%) | 0 (0.0%) |
| Total (Category) | 55 (79.7%) | 14 (20.3%) |
| Total (Overall) | 566 (52.2%) | 518 (47.8%) |
Employment Industries by Sex in Wailua
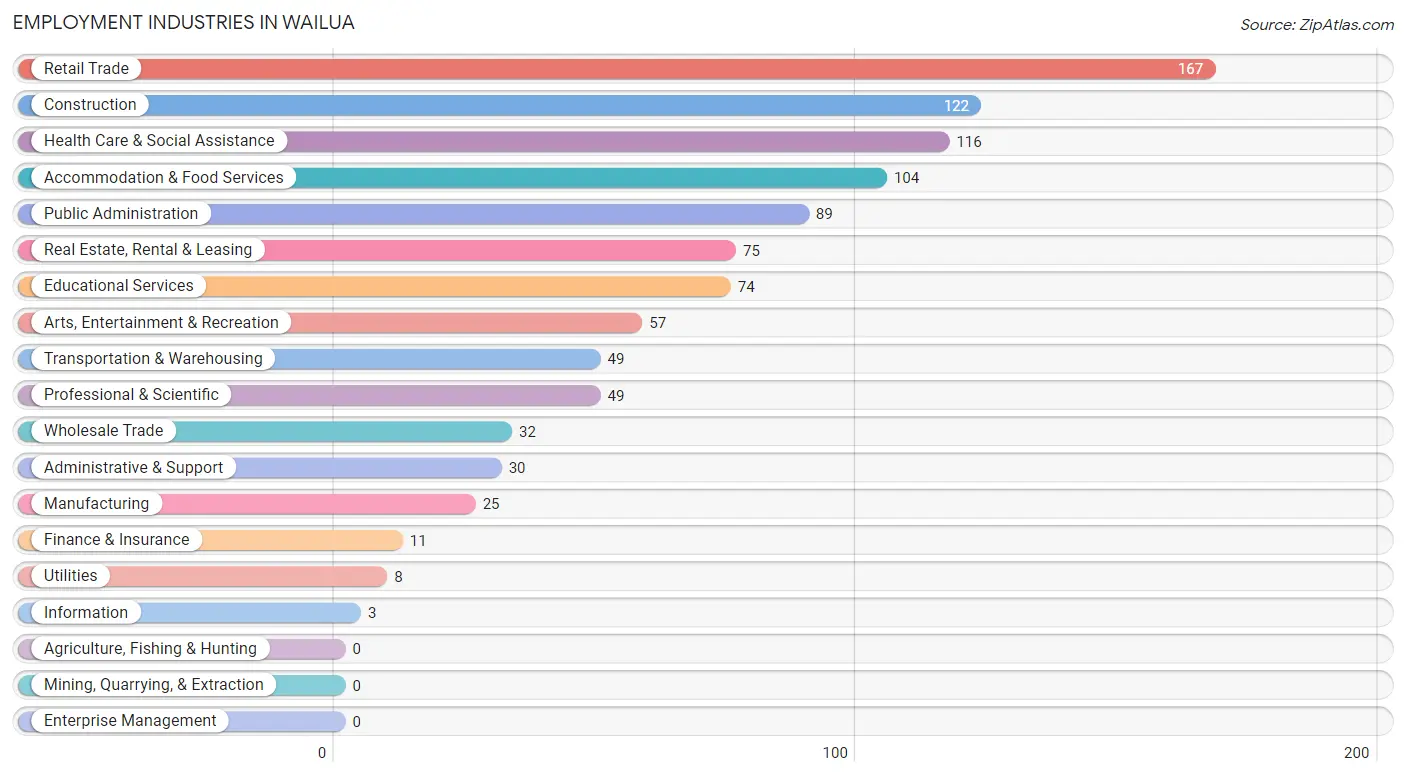
Employment Industries in Wailua
The major employment industries in Wailua include Retail Trade (167 | 15.4%), Construction (122 | 11.3%), Health Care & Social Assistance (116 | 10.7%), Accommodation & Food Services (104 | 9.6%), and Public Administration (89 | 8.2%).
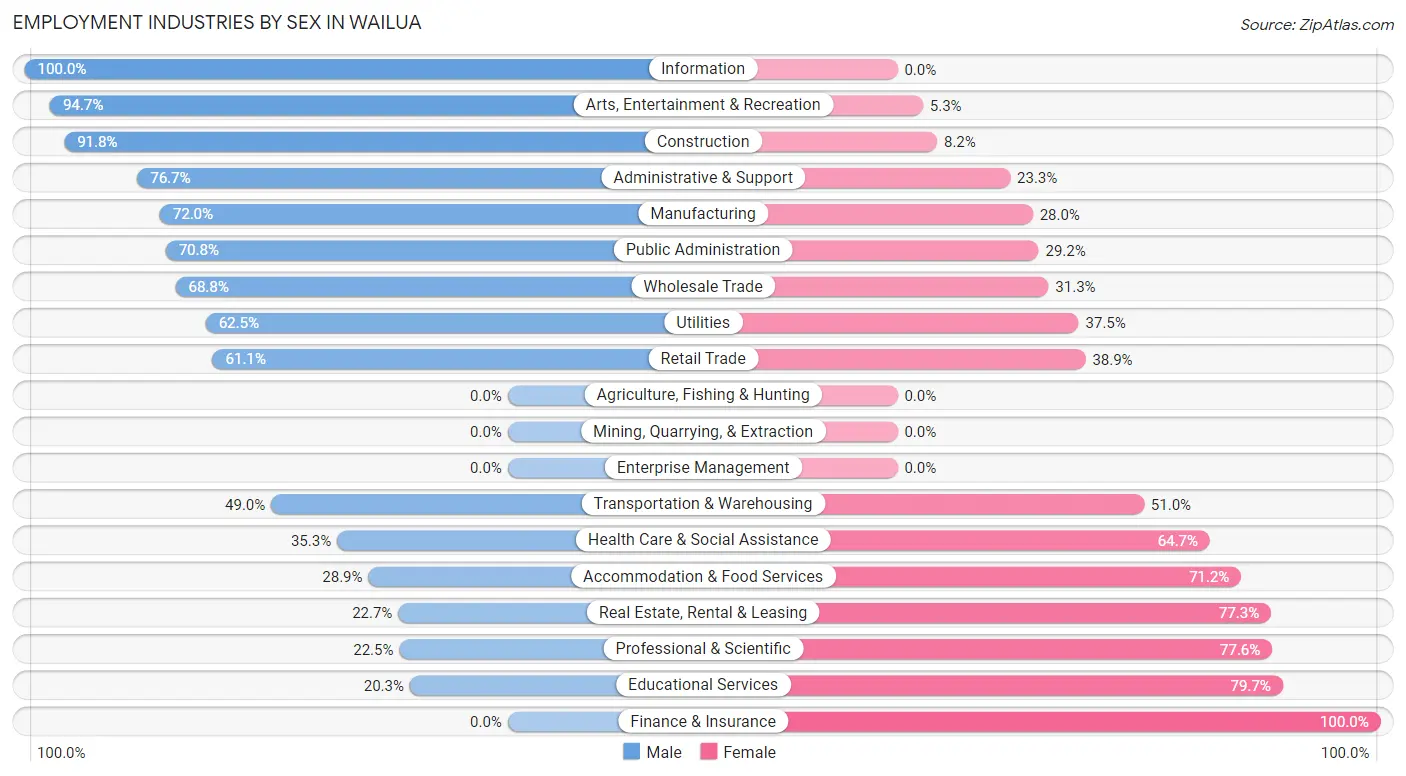
Employment Industries by Sex in Wailua
The Wailua industries that see more men than women are Information (100.0%), Arts, Entertainment & Recreation (94.7%), and Construction (91.8%), whereas the industries that tend to have a higher number of women are Finance & Insurance (100.0%), Educational Services (79.7%), and Professional & Scientific (77.5%).
| Industry | Male | Female |
| Agriculture, Fishing & Hunting | 0 (0.0%) | 0 (0.0%) |
| Mining, Quarrying, & Extraction | 0 (0.0%) | 0 (0.0%) |
| Construction | 112 (91.8%) | 10 (8.2%) |
| Manufacturing | 18 (72.0%) | 7 (28.0%) |
| Wholesale Trade | 22 (68.8%) | 10 (31.2%) |
| Retail Trade | 102 (61.1%) | 65 (38.9%) |
| Transportation & Warehousing | 24 (49.0%) | 25 (51.0%) |
| Utilities | 5 (62.5%) | 3 (37.5%) |
| Information | 3 (100.0%) | 0 (0.0%) |
| Finance & Insurance | 0 (0.0%) | 11 (100.0%) |
| Real Estate, Rental & Leasing | 17 (22.7%) | 58 (77.3%) |
| Professional & Scientific | 11 (22.5%) | 38 (77.5%) |
| Enterprise Management | 0 (0.0%) | 0 (0.0%) |
| Administrative & Support | 23 (76.7%) | 7 (23.3%) |
| Educational Services | 15 (20.3%) | 59 (79.7%) |
| Health Care & Social Assistance | 41 (35.3%) | 75 (64.7%) |
| Arts, Entertainment & Recreation | 54 (94.7%) | 3 (5.3%) |
| Accommodation & Food Services | 30 (28.8%) | 74 (71.2%) |
| Public Administration | 63 (70.8%) | 26 (29.2%) |
| Total | 566 (52.2%) | 518 (47.8%) |
Education in Wailua
School Enrollment in Wailua
The most common levels of schooling among the 453 students in Wailua are elementary school (184 | 40.6%), middle school (168 | 37.1%), and high school (62 | 13.7%).
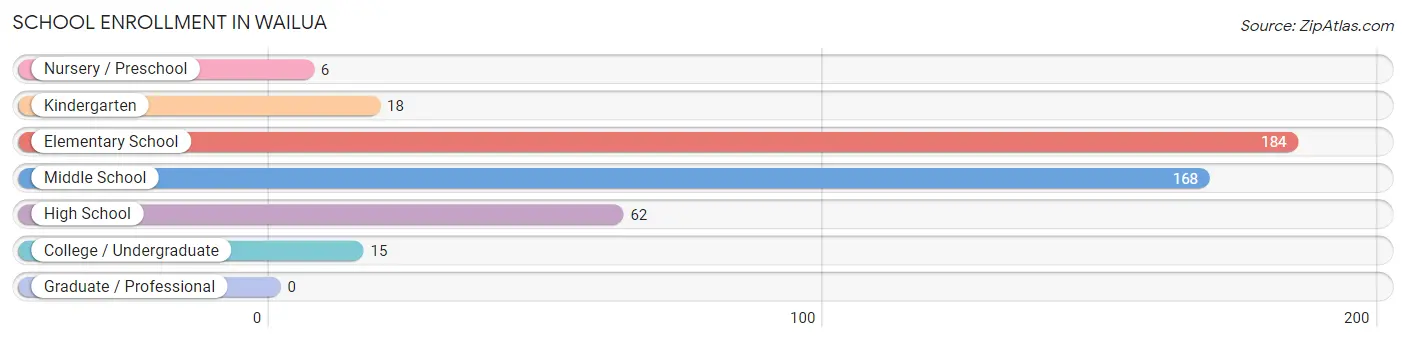
| School Level | # Students | % Students |
| Nursery / Preschool | 6 | 1.3% |
| Kindergarten | 18 | 4.0% |
| Elementary School | 184 | 40.6% |
| Middle School | 168 | 37.1% |
| High School | 62 | 13.7% |
| College / Undergraduate | 15 | 3.3% |
| Graduate / Professional | 0 | 0.0% |
| Total | 453 | 100.0% |
School Enrollment by Age by Funding Source in Wailua
Out of a total of 453 students who are enrolled in schools in Wailua, 15 (3.3%) attend a private institution, while the remaining 438 (96.7%) are enrolled in public schools. The age group of 15 to 17 year olds has the highest likelihood of being enrolled in private schools, with 9 (22.0% in the age bracket) enrolled. Conversely, the age group of 10 to 14 year olds has the lowest likelihood of being enrolled in a private school, with 174 (100.0% in the age bracket) attending a public institution.
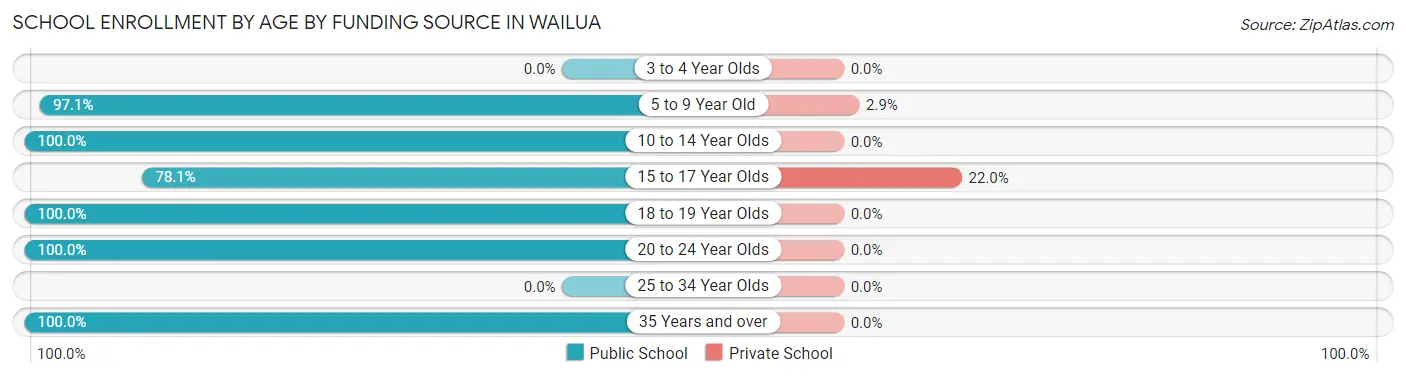
| Age Bracket | Public School | Private School |
| 3 to 4 Year Olds | 0 (0.0%) | 0 (0.0%) |
| 5 to 9 Year Old | 202 (97.1%) | 6 (2.9%) |
| 10 to 14 Year Olds | 174 (100.0%) | 0 (0.0%) |
| 15 to 17 Year Olds | 32 (78.0%) | 9 (22.0%) |
| 18 to 19 Year Olds | 15 (100.0%) | 0 (0.0%) |
| 20 to 24 Year Olds | 11 (100.0%) | 0 (0.0%) |
| 25 to 34 Year Olds | 0 (0.0%) | 0 (0.0%) |
| 35 Years and over | 4 (100.0%) | 0 (0.0%) |
| Total | 438 (96.7%) | 15 (3.3%) |
Educational Attainment by Field of Study in Wailua
Business (202 | 33.5%), education (111 | 18.4%), bio, nature & agricultural (59 | 9.8%), visual & performing arts (55 | 9.1%), and communications (30 | 5.0%) are the most common fields of study among 603 individuals in Wailua who have obtained a bachelor's degree or higher.
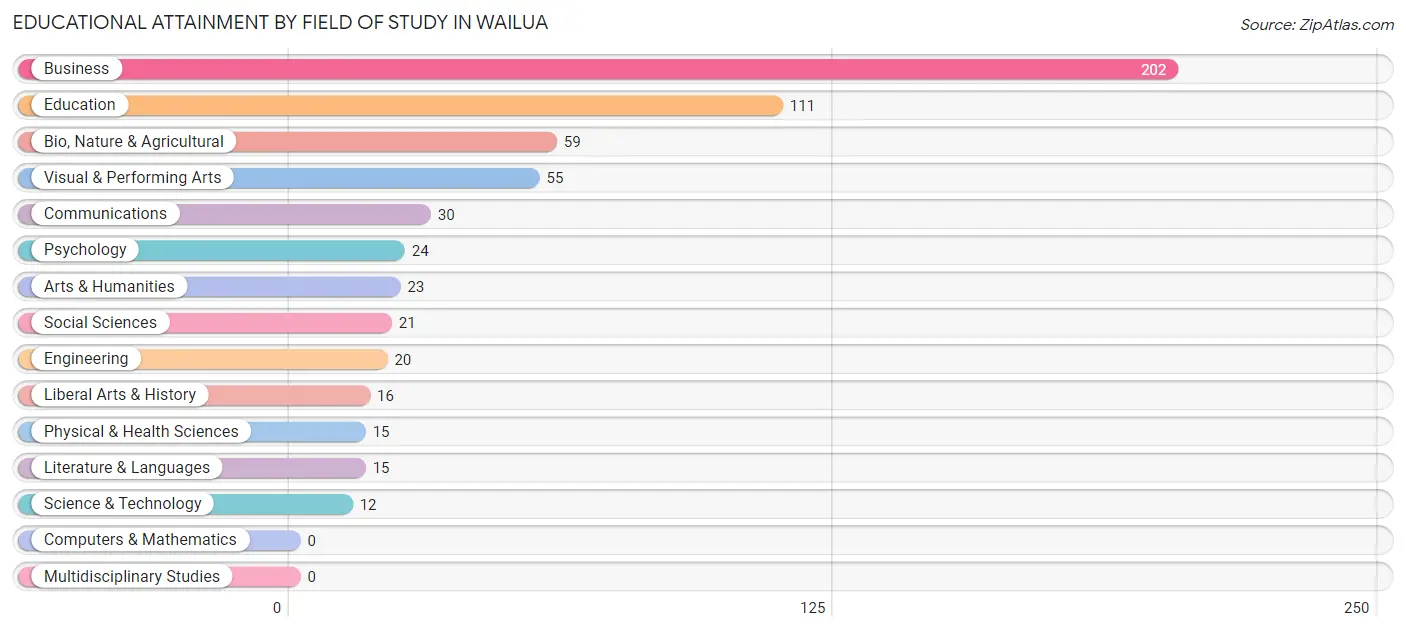
| Field of Study | # Graduates | % Graduates |
| Computers & Mathematics | 0 | 0.0% |
| Bio, Nature & Agricultural | 59 | 9.8% |
| Physical & Health Sciences | 15 | 2.5% |
| Psychology | 24 | 4.0% |
| Social Sciences | 21 | 3.5% |
| Engineering | 20 | 3.3% |
| Multidisciplinary Studies | 0 | 0.0% |
| Science & Technology | 12 | 2.0% |
| Business | 202 | 33.5% |
| Education | 111 | 18.4% |
| Literature & Languages | 15 | 2.5% |
| Liberal Arts & History | 16 | 2.6% |
| Visual & Performing Arts | 55 | 9.1% |
| Communications | 30 | 5.0% |
| Arts & Humanities | 23 | 3.8% |
| Total | 603 | 100.0% |
Transportation & Commute in Wailua
Vehicle Availability by Sex in Wailua
The most prevalent vehicle ownership categories in Wailua are males with 3 vehicles (213, accounting for 38.1%) and females with 3 vehicles (152, making up 42.6%).
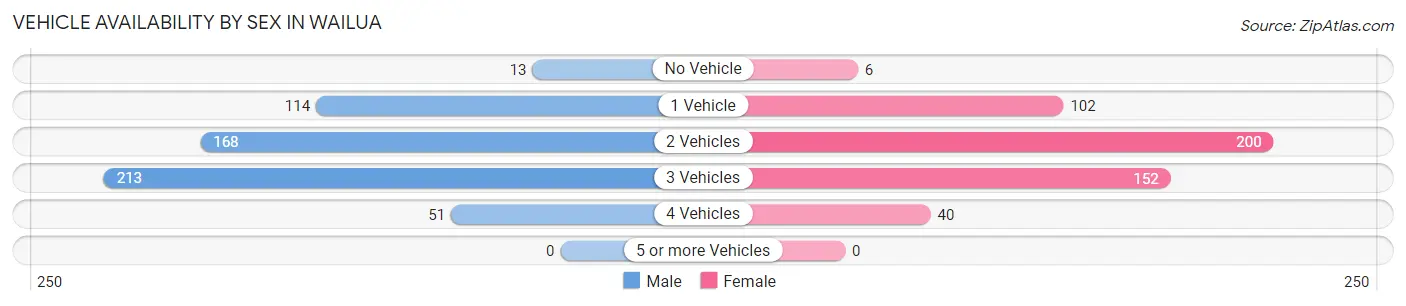
| Vehicles Available | Male | Female |
| No Vehicle | 13 (2.3%) | 6 (1.2%) |
| 1 Vehicle | 114 (20.4%) | 102 (20.4%) |
| 2 Vehicles | 168 (30.0%) | 200 (40.0%) |
| 3 Vehicles | 213 (38.1%) | 152 (30.4%) |
| 4 Vehicles | 51 (9.1%) | 40 (8.0%) |
| 5 or more Vehicles | 0 (0.0%) | 0 (0.0%) |
| Total | 559 (100.0%) | 500 (100.0%) |
Commute Time in Wailua
The most frequently occuring commute durations in Wailua are 20 to 24 minutes (182 commuters, 18.0%), 10 to 14 minutes (177 commuters, 17.5%), and 15 to 19 minutes (147 commuters, 14.6%).
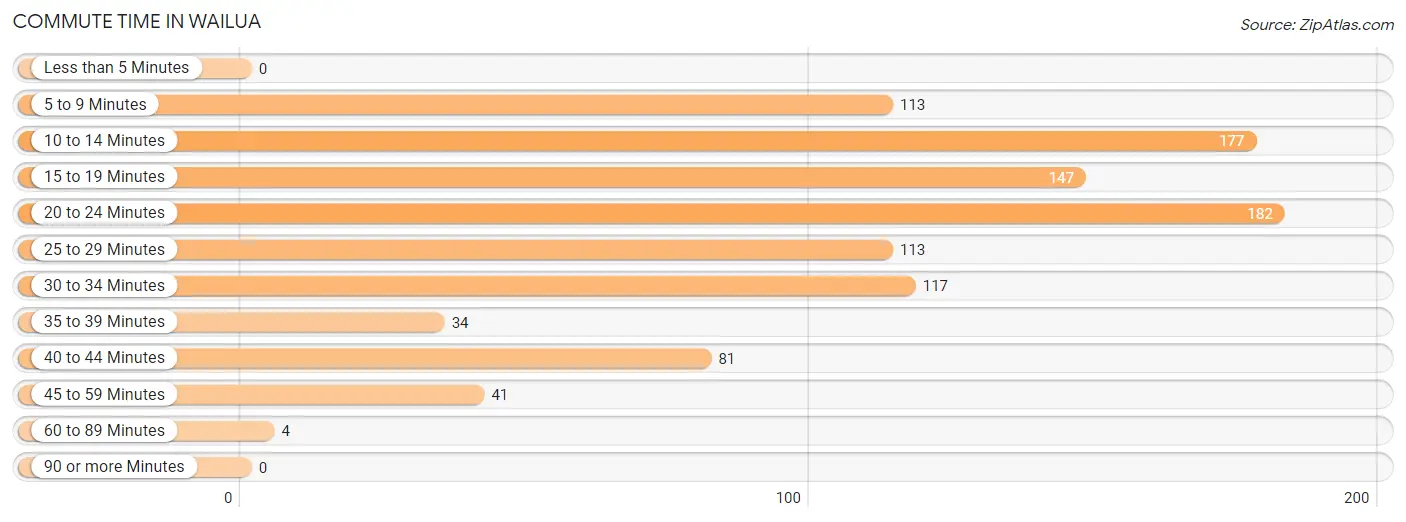
| Commute Time | # Commuters | % Commuters |
| Less than 5 Minutes | 0 | 0.0% |
| 5 to 9 Minutes | 113 | 11.2% |
| 10 to 14 Minutes | 177 | 17.5% |
| 15 to 19 Minutes | 147 | 14.6% |
| 20 to 24 Minutes | 182 | 18.0% |
| 25 to 29 Minutes | 113 | 11.2% |
| 30 to 34 Minutes | 117 | 11.6% |
| 35 to 39 Minutes | 34 | 3.4% |
| 40 to 44 Minutes | 81 | 8.0% |
| 45 to 59 Minutes | 41 | 4.1% |
| 60 to 89 Minutes | 4 | 0.4% |
| 90 or more Minutes | 0 | 0.0% |
Commute Time by Sex in Wailua
The most common commute times in Wailua are 20 to 24 minutes (116 commuters, 21.0%) for males and 10 to 14 minutes (109 commuters, 23.8%) for females.
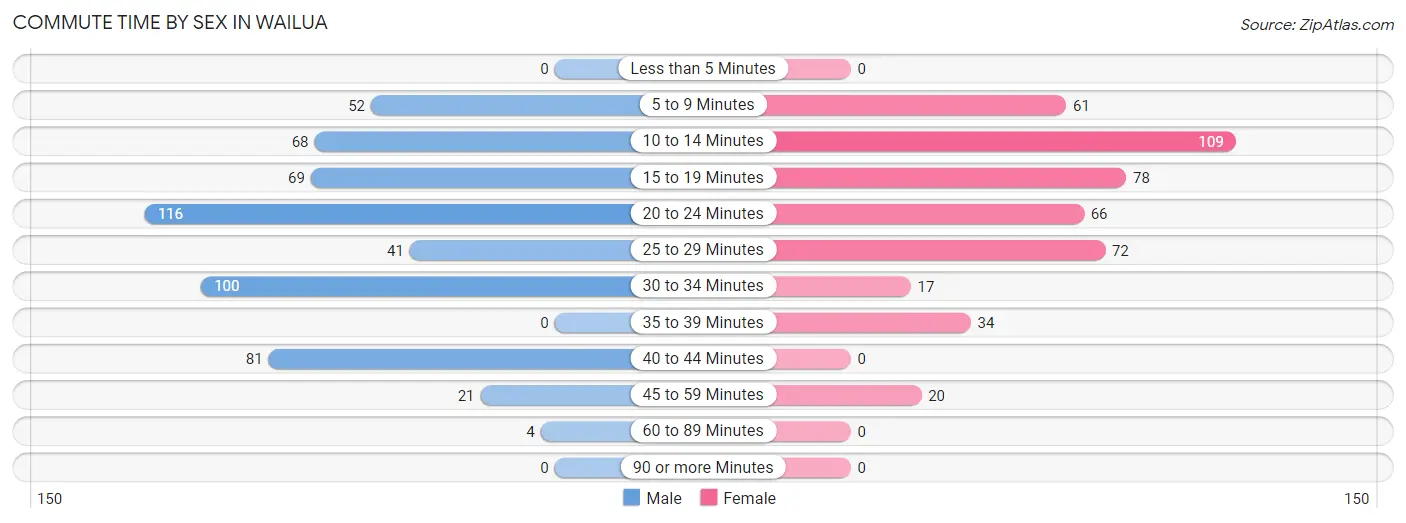
| Commute Time | Male | Female |
| Less than 5 Minutes | 0 (0.0%) | 0 (0.0%) |
| 5 to 9 Minutes | 52 (9.4%) | 61 (13.4%) |
| 10 to 14 Minutes | 68 (12.3%) | 109 (23.8%) |
| 15 to 19 Minutes | 69 (12.5%) | 78 (17.1%) |
| 20 to 24 Minutes | 116 (21.0%) | 66 (14.4%) |
| 25 to 29 Minutes | 41 (7.4%) | 72 (15.8%) |
| 30 to 34 Minutes | 100 (18.1%) | 17 (3.7%) |
| 35 to 39 Minutes | 0 (0.0%) | 34 (7.4%) |
| 40 to 44 Minutes | 81 (14.7%) | 0 (0.0%) |
| 45 to 59 Minutes | 21 (3.8%) | 20 (4.4%) |
| 60 to 89 Minutes | 4 (0.7%) | 0 (0.0%) |
| 90 or more Minutes | 0 (0.0%) | 0 (0.0%) |
Time of Departure to Work by Sex in Wailua
The most frequent times of departure to work in Wailua are 6:00 AM to 6:29 AM (141, 25.5%) for males and 8:00 AM to 8:29 AM (80, 17.5%) for females.
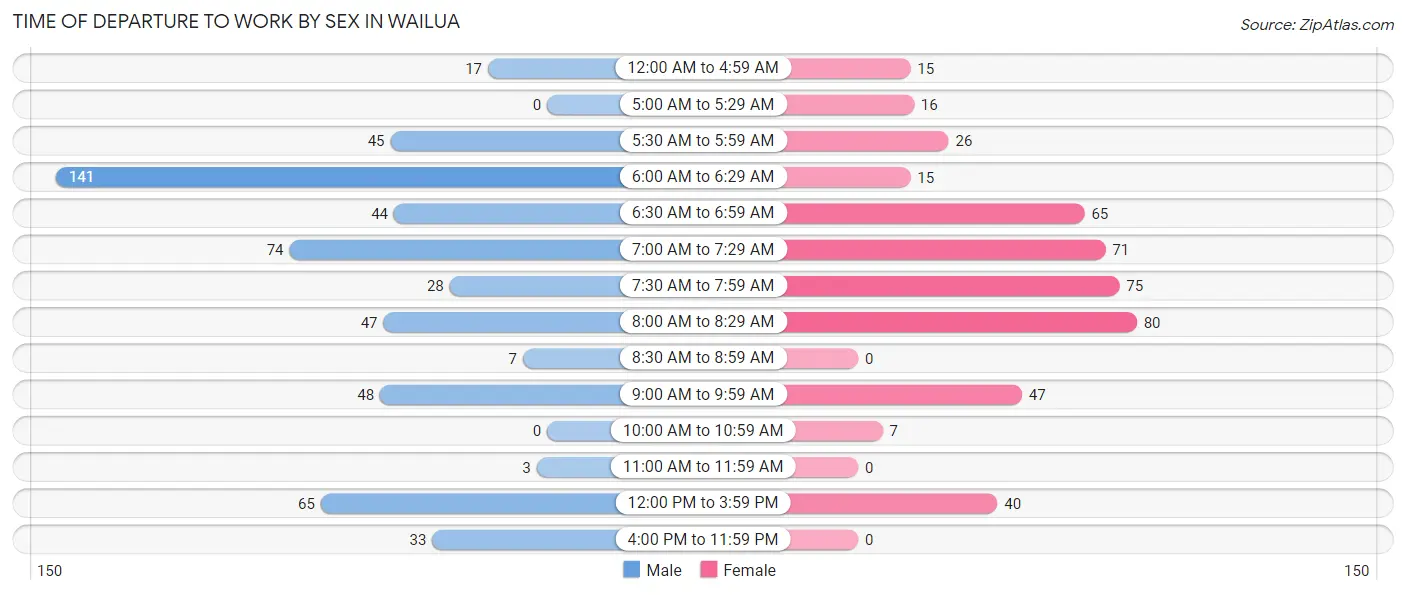
| Time of Departure | Male | Female |
| 12:00 AM to 4:59 AM | 17 (3.1%) | 15 (3.3%) |
| 5:00 AM to 5:29 AM | 0 (0.0%) | 16 (3.5%) |
| 5:30 AM to 5:59 AM | 45 (8.2%) | 26 (5.7%) |
| 6:00 AM to 6:29 AM | 141 (25.5%) | 15 (3.3%) |
| 6:30 AM to 6:59 AM | 44 (8.0%) | 65 (14.2%) |
| 7:00 AM to 7:29 AM | 74 (13.4%) | 71 (15.5%) |
| 7:30 AM to 7:59 AM | 28 (5.1%) | 75 (16.4%) |
| 8:00 AM to 8:29 AM | 47 (8.5%) | 80 (17.5%) |
| 8:30 AM to 8:59 AM | 7 (1.3%) | 0 (0.0%) |
| 9:00 AM to 9:59 AM | 48 (8.7%) | 47 (10.3%) |
| 10:00 AM to 10:59 AM | 0 (0.0%) | 7 (1.5%) |
| 11:00 AM to 11:59 AM | 3 (0.5%) | 0 (0.0%) |
| 12:00 PM to 3:59 PM | 65 (11.8%) | 40 (8.7%) |
| 4:00 PM to 11:59 PM | 33 (6.0%) | 0 (0.0%) |
| Total | 552 (100.0%) | 457 (100.0%) |
Housing Occupancy in Wailua
Occupancy by Ownership in Wailua
Of the total 914 dwellings in Wailua, owner-occupied units account for 552 (60.4%), while renter-occupied units make up 362 (39.6%).
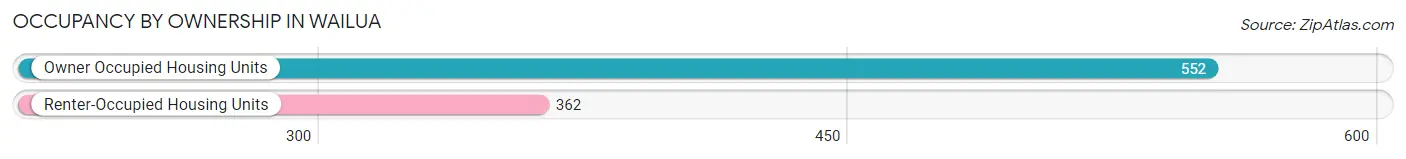
| Occupancy | # Housing Units | % Housing Units |
| Owner Occupied Housing Units | 552 | 60.4% |
| Renter-Occupied Housing Units | 362 | 39.6% |
| Total Occupied Housing Units | 914 | 100.0% |
Occupancy by Household Size in Wailua
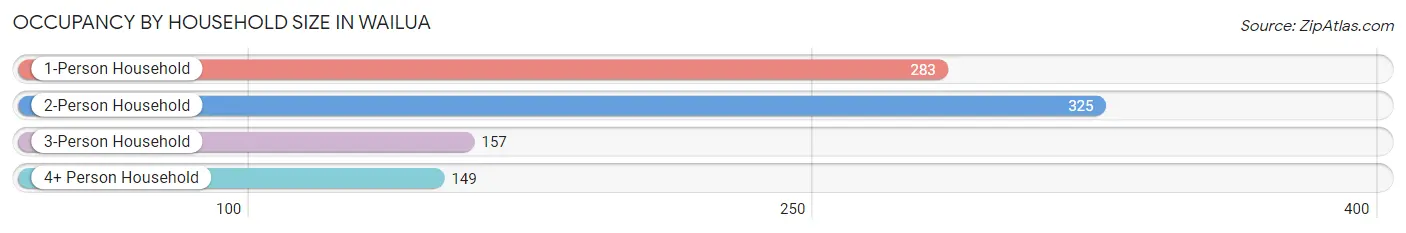
| Household Size | # Housing Units | % Housing Units |
| 1-Person Household | 283 | 31.0% |
| 2-Person Household | 325 | 35.6% |
| 3-Person Household | 157 | 17.2% |
| 4+ Person Household | 149 | 16.3% |
| Total Housing Units | 914 | 100.0% |
Occupancy by Ownership by Household Size in Wailua
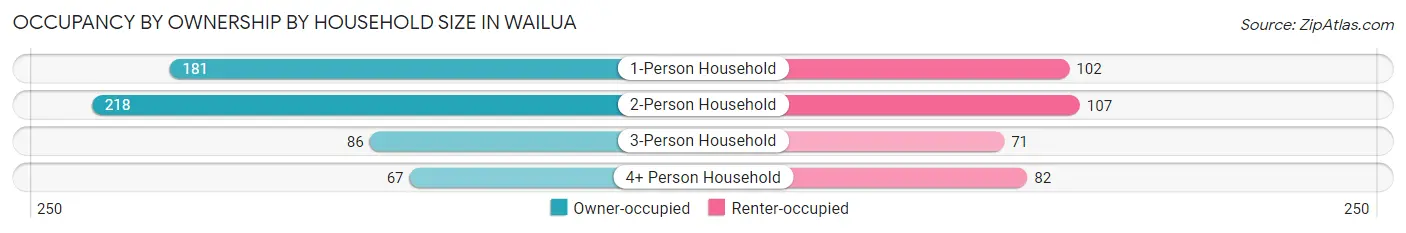
| Household Size | Owner-occupied | Renter-occupied |
| 1-Person Household | 181 (64.0%) | 102 (36.0%) |
| 2-Person Household | 218 (67.1%) | 107 (32.9%) |
| 3-Person Household | 86 (54.8%) | 71 (45.2%) |
| 4+ Person Household | 67 (45.0%) | 82 (55.0%) |
| Total Housing Units | 552 (60.4%) | 362 (39.6%) |
Occupancy by Educational Attainment in Wailua
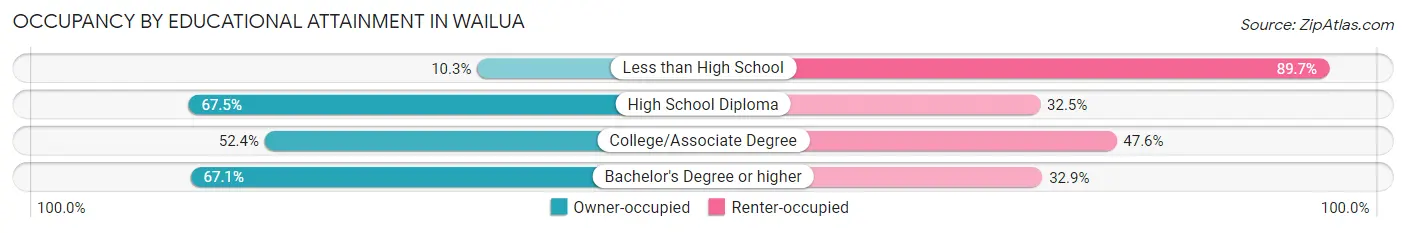
| Household Size | Owner-occupied | Renter-occupied |
| Less than High School | 4 (10.3%) | 35 (89.7%) |
| High School Diploma | 189 (67.5%) | 91 (32.5%) |
| College/Associate Degree | 143 (52.4%) | 130 (47.6%) |
| Bachelor's Degree or higher | 216 (67.1%) | 106 (32.9%) |
Occupancy by Age of Householder in Wailua
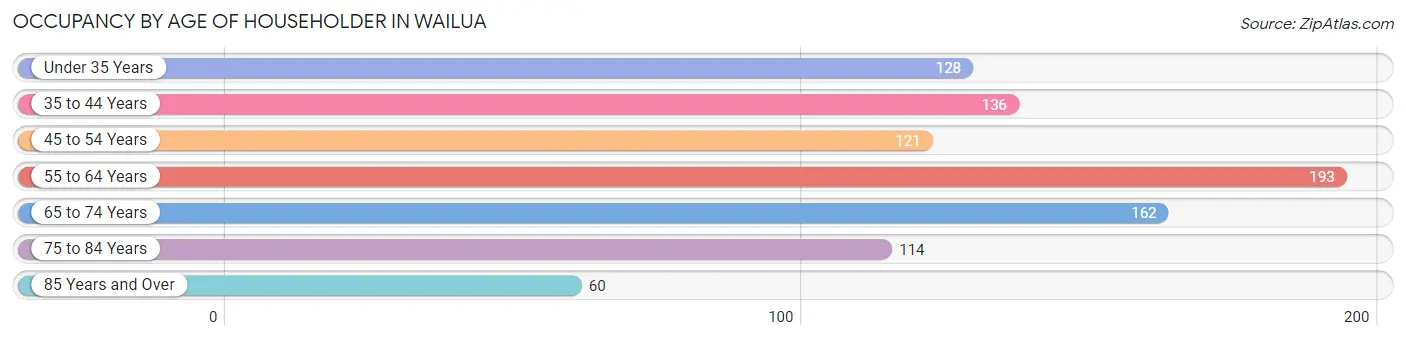
| Age Bracket | # Households | % Households |
| Under 35 Years | 128 | 14.0% |
| 35 to 44 Years | 136 | 14.9% |
| 45 to 54 Years | 121 | 13.2% |
| 55 to 64 Years | 193 | 21.1% |
| 65 to 74 Years | 162 | 17.7% |
| 75 to 84 Years | 114 | 12.5% |
| 85 Years and Over | 60 | 6.6% |
| Total | 914 | 100.0% |
Housing Finances in Wailua
Median Income by Occupancy in Wailua
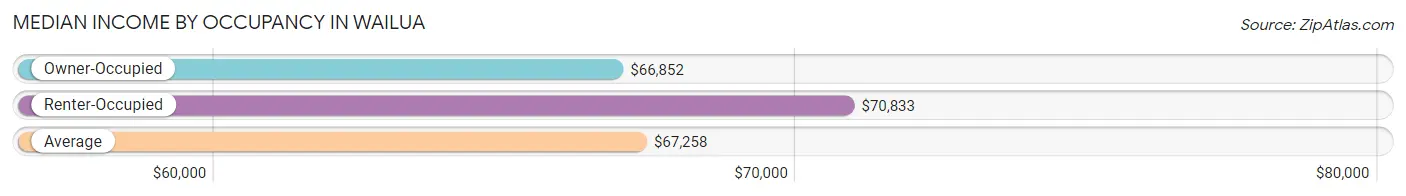
| Occupancy Type | # Households | Median Income |
| Owner-Occupied | 552 (60.4%) | $66,852 |
| Renter-Occupied | 362 (39.6%) | $70,833 |
| Average | 914 (100.0%) | $67,258 |
Occupancy by Householder Income Bracket in Wailua
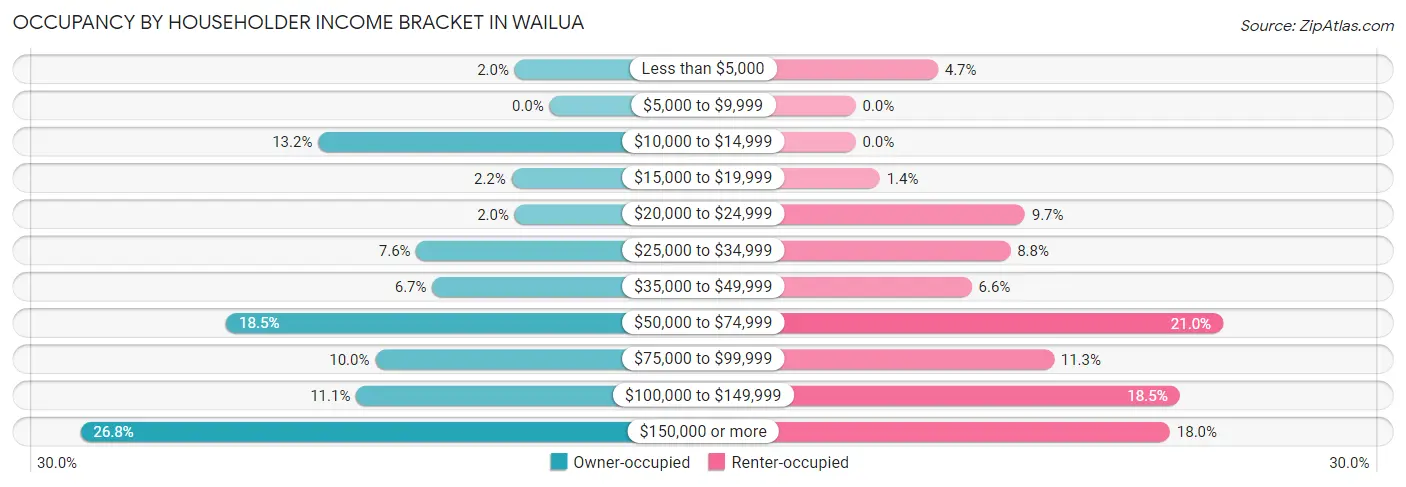
| Income Bracket | Owner-occupied | Renter-occupied |
| Less than $5,000 | 11 (2.0%) | 17 (4.7%) |
| $5,000 to $9,999 | 0 (0.0%) | 0 (0.0%) |
| $10,000 to $14,999 | 73 (13.2%) | 0 (0.0%) |
| $15,000 to $19,999 | 12 (2.2%) | 5 (1.4%) |
| $20,000 to $24,999 | 11 (2.0%) | 35 (9.7%) |
| $25,000 to $34,999 | 42 (7.6%) | 32 (8.8%) |
| $35,000 to $49,999 | 37 (6.7%) | 24 (6.6%) |
| $50,000 to $74,999 | 102 (18.5%) | 76 (21.0%) |
| $75,000 to $99,999 | 55 (10.0%) | 41 (11.3%) |
| $100,000 to $149,999 | 61 (11.1%) | 67 (18.5%) |
| $150,000 or more | 148 (26.8%) | 65 (18.0%) |
| Total | 552 (100.0%) | 362 (100.0%) |
Monthly Housing Cost Tiers in Wailua
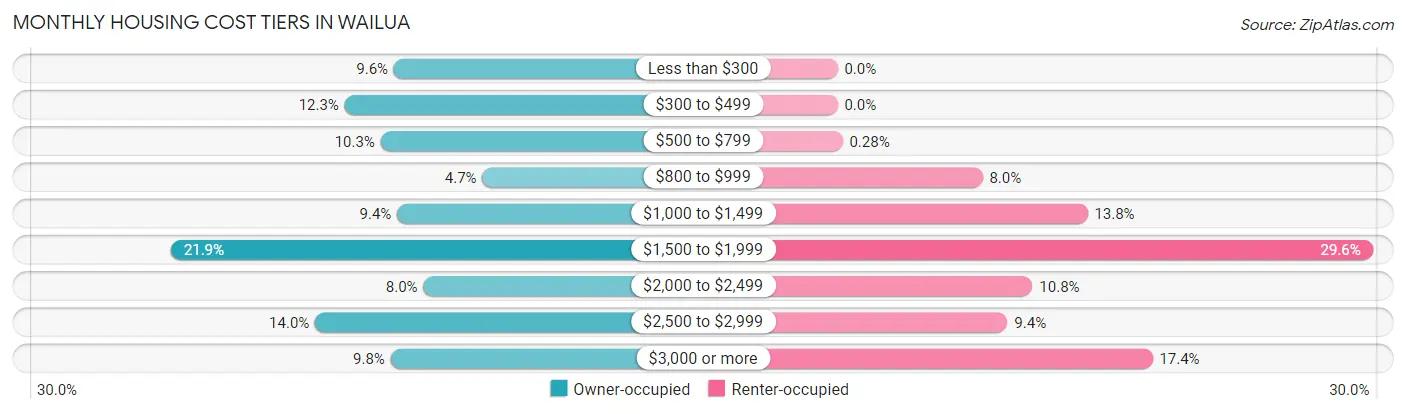
| Monthly Cost | Owner-occupied | Renter-occupied |
| Less than $300 | 53 (9.6%) | 0 (0.0%) |
| $300 to $499 | 68 (12.3%) | 0 (0.0%) |
| $500 to $799 | 57 (10.3%) | 1 (0.3%) |
| $800 to $999 | 26 (4.7%) | 29 (8.0%) |
| $1,000 to $1,499 | 52 (9.4%) | 50 (13.8%) |
| $1,500 to $1,999 | 121 (21.9%) | 107 (29.6%) |
| $2,000 to $2,499 | 44 (8.0%) | 39 (10.8%) |
| $2,500 to $2,999 | 77 (14.0%) | 34 (9.4%) |
| $3,000 or more | 54 (9.8%) | 63 (17.4%) |
| Total | 552 (100.0%) | 362 (100.0%) |
Physical Housing Characteristics in Wailua
Housing Structures in Wailua
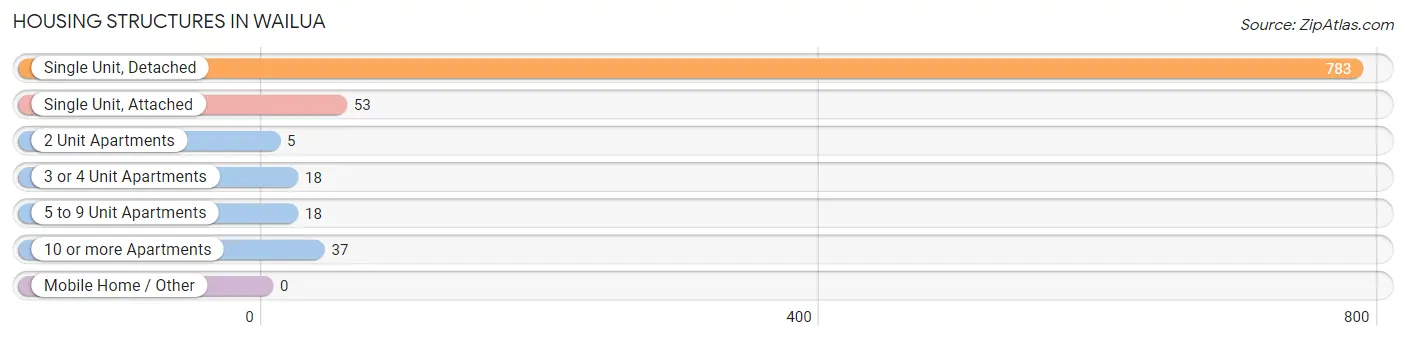
| Structure Type | # Housing Units | % Housing Units |
| Single Unit, Detached | 783 | 85.7% |
| Single Unit, Attached | 53 | 5.8% |
| 2 Unit Apartments | 5 | 0.5% |
| 3 or 4 Unit Apartments | 18 | 2.0% |
| 5 to 9 Unit Apartments | 18 | 2.0% |
| 10 or more Apartments | 37 | 4.1% |
| Mobile Home / Other | 0 | 0.0% |
| Total | 914 | 100.0% |
Housing Structures by Occupancy in Wailua
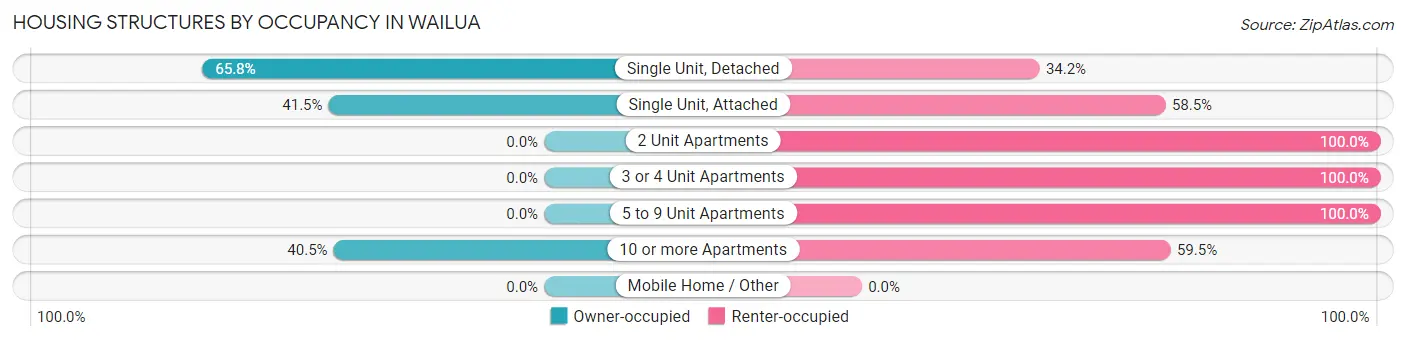
| Structure Type | Owner-occupied | Renter-occupied |
| Single Unit, Detached | 515 (65.8%) | 268 (34.2%) |
| Single Unit, Attached | 22 (41.5%) | 31 (58.5%) |
| 2 Unit Apartments | 0 (0.0%) | 5 (100.0%) |
| 3 or 4 Unit Apartments | 0 (0.0%) | 18 (100.0%) |
| 5 to 9 Unit Apartments | 0 (0.0%) | 18 (100.0%) |
| 10 or more Apartments | 15 (40.5%) | 22 (59.5%) |
| Mobile Home / Other | 0 (0.0%) | 0 (0.0%) |
| Total | 552 (60.4%) | 362 (39.6%) |
Housing Structures by Number of Rooms in Wailua
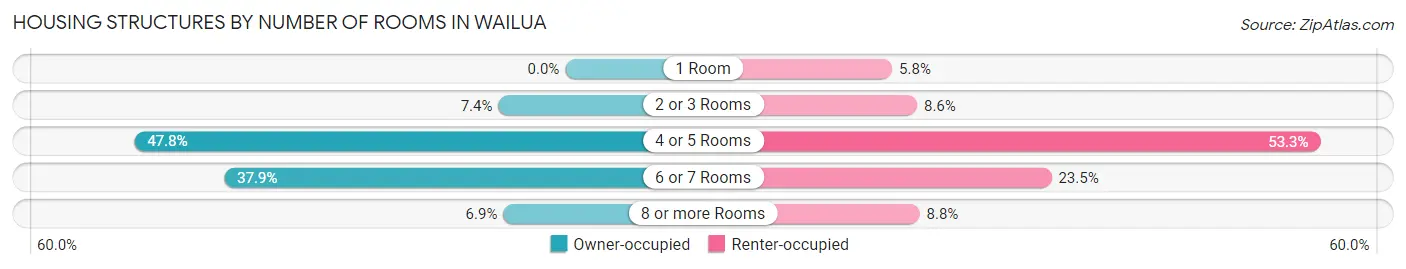
| Number of Rooms | Owner-occupied | Renter-occupied |
| 1 Room | 0 (0.0%) | 21 (5.8%) |
| 2 or 3 Rooms | 41 (7.4%) | 31 (8.6%) |
| 4 or 5 Rooms | 264 (47.8%) | 193 (53.3%) |
| 6 or 7 Rooms | 209 (37.9%) | 85 (23.5%) |
| 8 or more Rooms | 38 (6.9%) | 32 (8.8%) |
| Total | 552 (100.0%) | 362 (100.0%) |
Housing Structure by Heating Type in Wailua
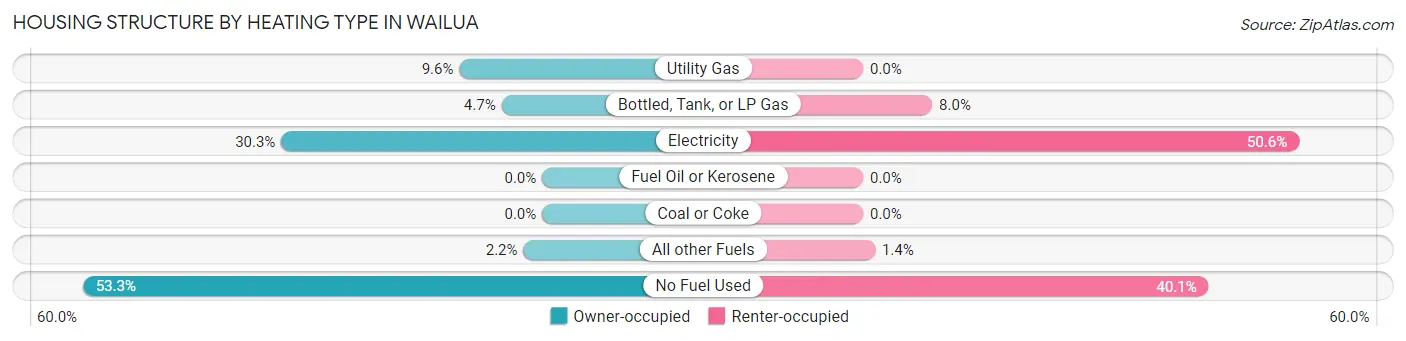
| Heating Type | Owner-occupied | Renter-occupied |
| Utility Gas | 53 (9.6%) | 0 (0.0%) |
| Bottled, Tank, or LP Gas | 26 (4.7%) | 29 (8.0%) |
| Electricity | 167 (30.2%) | 183 (50.5%) |
| Fuel Oil or Kerosene | 0 (0.0%) | 0 (0.0%) |
| Coal or Coke | 0 (0.0%) | 0 (0.0%) |
| All other Fuels | 12 (2.2%) | 5 (1.4%) |
| No Fuel Used | 294 (53.3%) | 145 (40.1%) |
| Total | 552 (100.0%) | 362 (100.0%) |
Household Vehicle Usage in Wailua
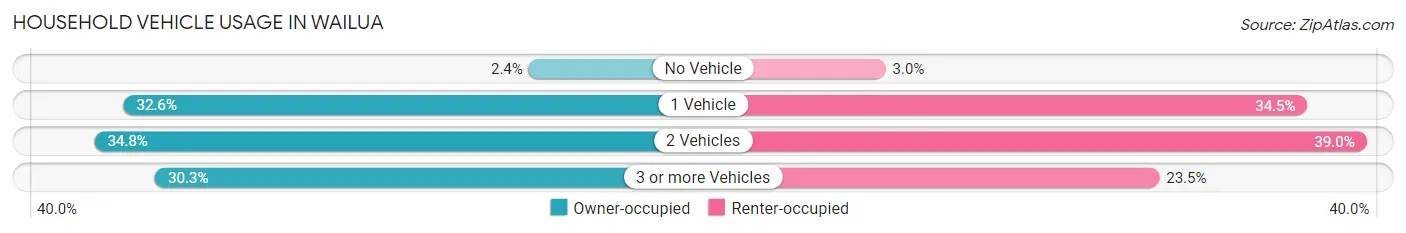
| Vehicles per Household | Owner-occupied | Renter-occupied |
| No Vehicle | 13 (2.4%) | 11 (3.0%) |
| 1 Vehicle | 180 (32.6%) | 125 (34.5%) |
| 2 Vehicles | 192 (34.8%) | 141 (39.0%) |
| 3 or more Vehicles | 167 (30.2%) | 85 (23.5%) |
| Total | 552 (100.0%) | 362 (100.0%) |
Real Estate & Mortgages in Wailua
Real Estate and Mortgage Overview in Wailua
| Characteristic | Without Mortgage | With Mortgage |
| Housing Units | 214 | 338 |
| Median Property Value | $656,700 | $670,800 |
| Median Household Income | $66,667 | $91 |
| Monthly Housing Costs | $459 | $54 |
| Real Estate Taxes | $1,470 | $0 |
Property Value by Mortgage Status in Wailua
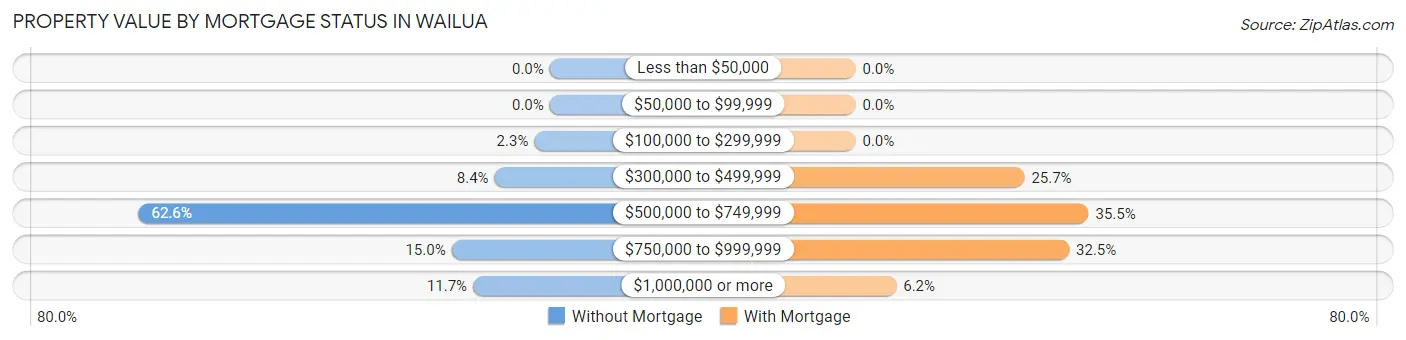
| Property Value | Without Mortgage | With Mortgage |
| Less than $50,000 | 0 (0.0%) | 0 (0.0%) |
| $50,000 to $99,999 | 0 (0.0%) | 0 (0.0%) |
| $100,000 to $299,999 | 5 (2.3%) | 0 (0.0%) |
| $300,000 to $499,999 | 18 (8.4%) | 87 (25.7%) |
| $500,000 to $749,999 | 134 (62.6%) | 120 (35.5%) |
| $750,000 to $999,999 | 32 (14.9%) | 110 (32.5%) |
| $1,000,000 or more | 25 (11.7%) | 21 (6.2%) |
| Total | 214 (100.0%) | 338 (100.0%) |
Household Income by Mortgage Status in Wailua
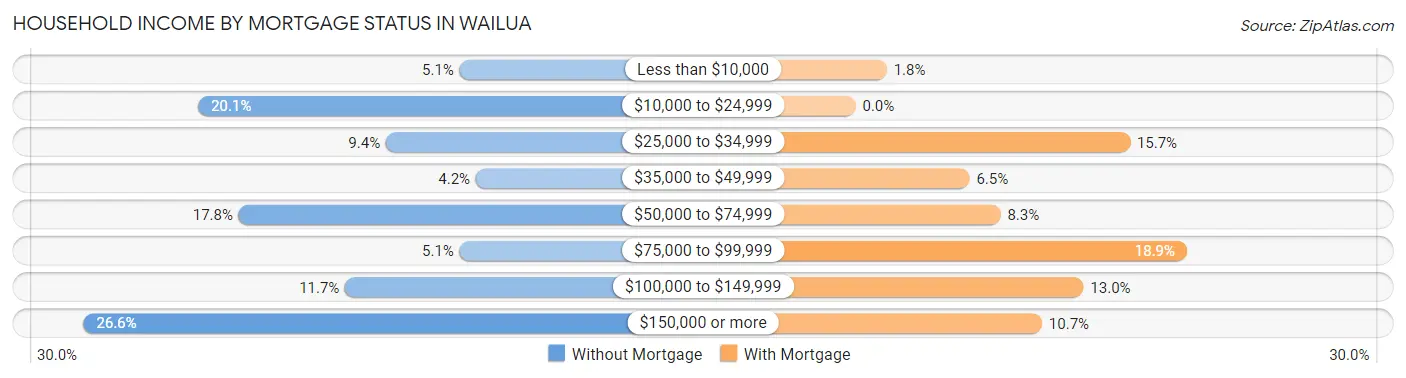
| Household Income | Without Mortgage | With Mortgage |
| Less than $10,000 | 11 (5.1%) | 6 (1.8%) |
| $10,000 to $24,999 | 43 (20.1%) | 0 (0.0%) |
| $25,000 to $34,999 | 20 (9.3%) | 53 (15.7%) |
| $35,000 to $49,999 | 9 (4.2%) | 22 (6.5%) |
| $50,000 to $74,999 | 38 (17.8%) | 28 (8.3%) |
| $75,000 to $99,999 | 11 (5.1%) | 64 (18.9%) |
| $100,000 to $149,999 | 25 (11.7%) | 44 (13.0%) |
| $150,000 or more | 57 (26.6%) | 36 (10.6%) |
| Total | 214 (100.0%) | 338 (100.0%) |
Property Value to Household Income Ratio in Wailua
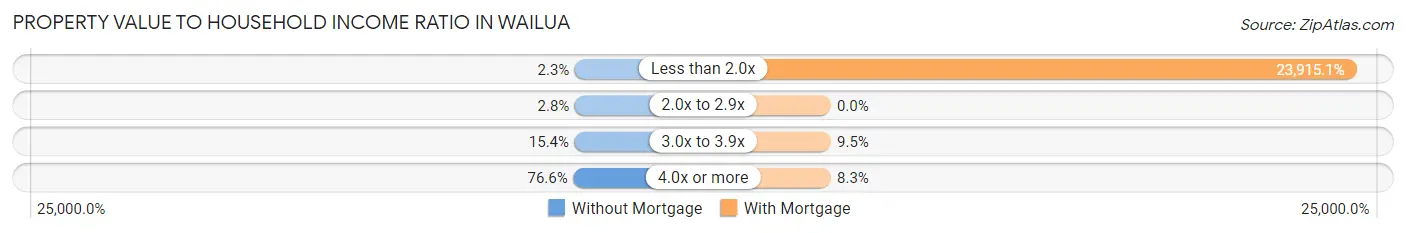
| Value-to-Income Ratio | Without Mortgage | With Mortgage |
| Less than 2.0x | 5 (2.3%) | 80,833 (23,915.1%) |
| 2.0x to 2.9x | 6 (2.8%) | 0 (0.0%) |
| 3.0x to 3.9x | 33 (15.4%) | 32 (9.5%) |
| 4.0x or more | 164 (76.6%) | 28 (8.3%) |
| Total | 214 (100.0%) | 338 (100.0%) |
Real Estate Taxes by Mortgage Status in Wailua
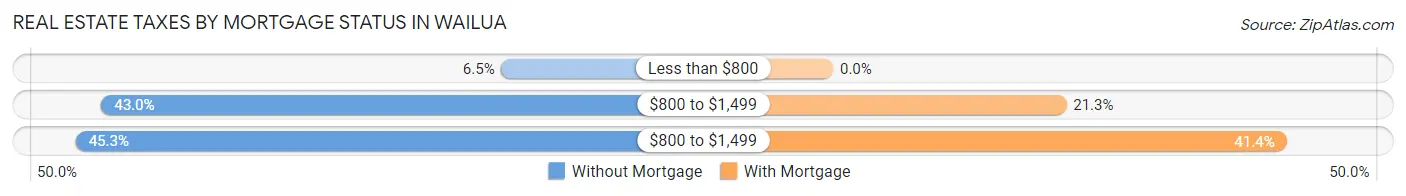
| Property Taxes | Without Mortgage | With Mortgage |
| Less than $800 | 14 (6.5%) | 0 (0.0%) |
| $800 to $1,499 | 92 (43.0%) | 72 (21.3%) |
| $800 to $1,499 | 97 (45.3%) | 140 (41.4%) |
| Total | 214 (100.0%) | 338 (100.0%) |
Health & Disability in Wailua
Health Insurance Coverage by Age in Wailua
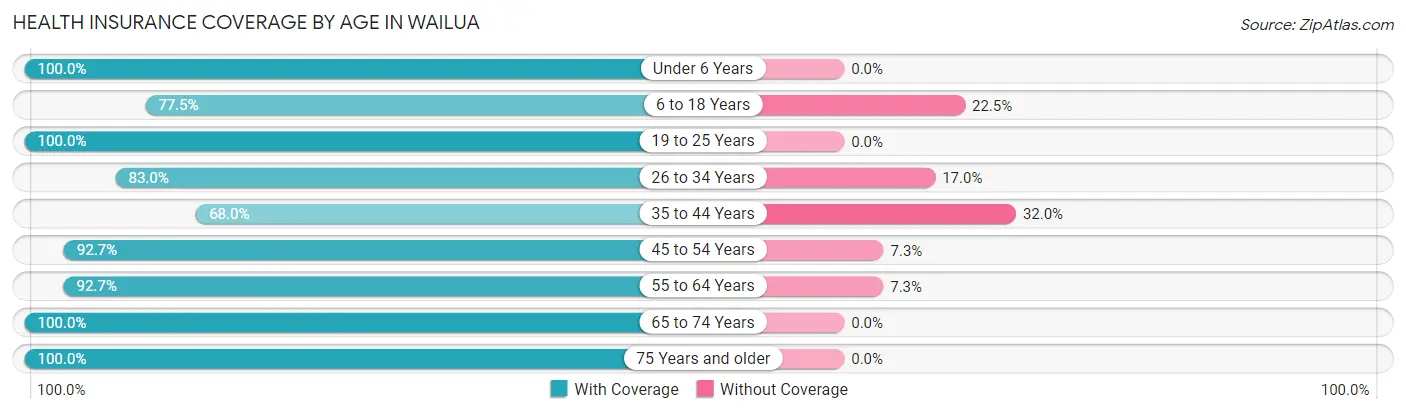
| Age Bracket | With Coverage | Without Coverage |
| Under 6 Years | 94 (100.0%) | 0 (0.0%) |
| 6 to 18 Years | 327 (77.5%) | 95 (22.5%) |
| 19 to 25 Years | 144 (100.0%) | 0 (0.0%) |
| 26 to 34 Years | 279 (83.0%) | 57 (17.0%) |
| 35 to 44 Years | 189 (68.0%) | 89 (32.0%) |
| 45 to 54 Years | 177 (92.7%) | 14 (7.3%) |
| 55 to 64 Years | 306 (92.7%) | 24 (7.3%) |
| 65 to 74 Years | 397 (100.0%) | 0 (0.0%) |
| 75 Years and older | 242 (100.0%) | 0 (0.0%) |
| Total | 2,155 (88.5%) | 279 (11.5%) |
Health Insurance Coverage by Citizenship Status in Wailua
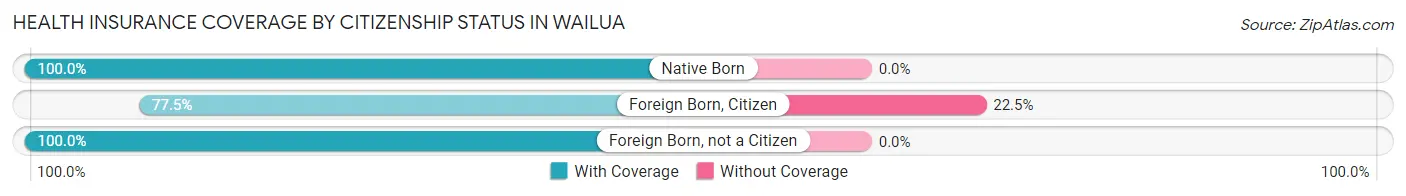
| Citizenship Status | With Coverage | Without Coverage |
| Native Born | 94 (100.0%) | 0 (0.0%) |
| Foreign Born, Citizen | 327 (77.5%) | 95 (22.5%) |
| Foreign Born, not a Citizen | 144 (100.0%) | 0 (0.0%) |
Health Insurance Coverage by Household Income in Wailua
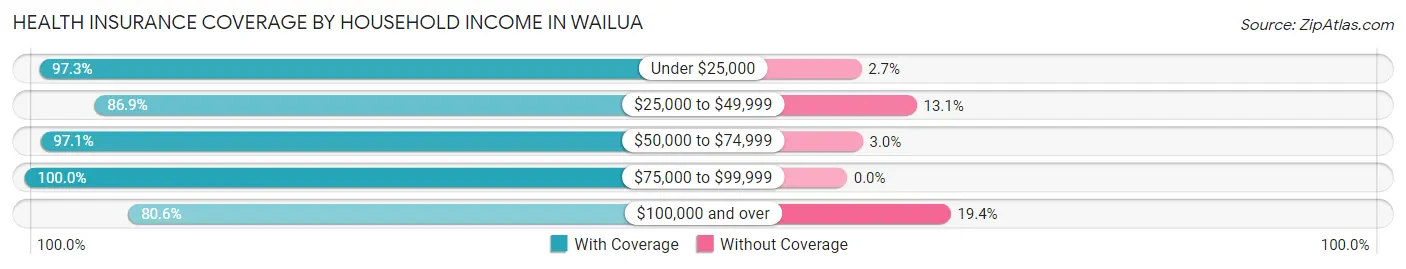
| Household Income | With Coverage | Without Coverage |
| Under $25,000 | 251 (97.3%) | 7 (2.7%) |
| $25,000 to $49,999 | 233 (86.9%) | 35 (13.1%) |
| $50,000 to $74,999 | 494 (97.1%) | 15 (2.9%) |
| $75,000 to $99,999 | 256 (100.0%) | 0 (0.0%) |
| $100,000 and over | 921 (80.6%) | 222 (19.4%) |
Public vs Private Health Insurance Coverage by Age in Wailua
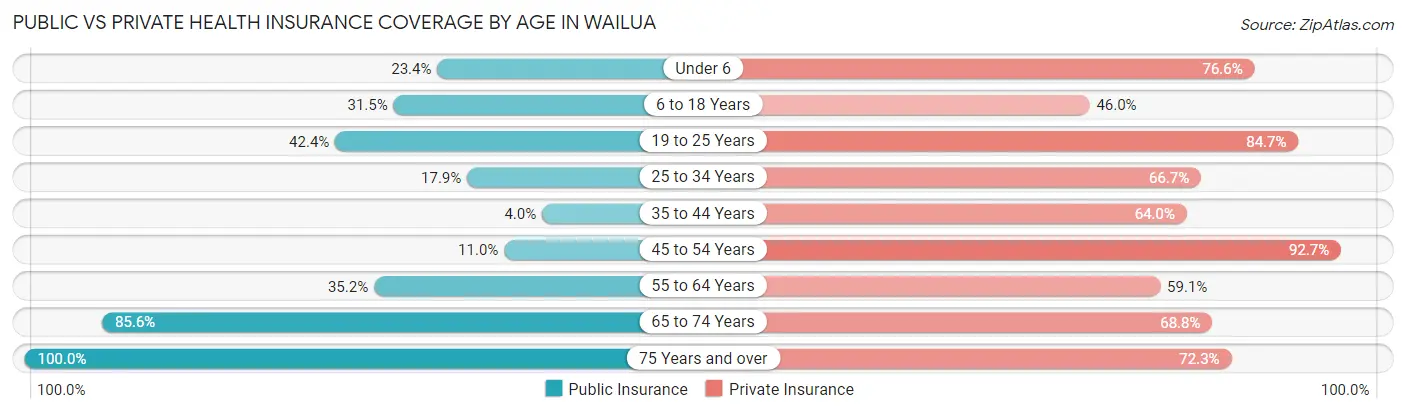
| Age Bracket | Public Insurance | Private Insurance |
| Under 6 | 22 (23.4%) | 72 (76.6%) |
| 6 to 18 Years | 133 (31.5%) | 194 (46.0%) |
| 19 to 25 Years | 61 (42.4%) | 122 (84.7%) |
| 25 to 34 Years | 60 (17.9%) | 224 (66.7%) |
| 35 to 44 Years | 11 (4.0%) | 178 (64.0%) |
| 45 to 54 Years | 21 (11.0%) | 177 (92.7%) |
| 55 to 64 Years | 116 (35.1%) | 195 (59.1%) |
| 65 to 74 Years | 340 (85.6%) | 273 (68.8%) |
| 75 Years and over | 242 (100.0%) | 175 (72.3%) |
| Total | 1,006 (41.3%) | 1,610 (66.1%) |
Disability Status by Sex by Age in Wailua
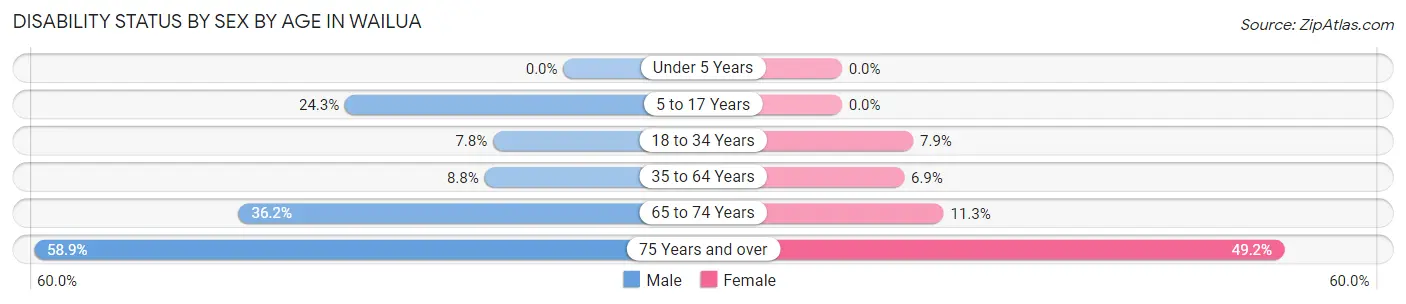
| Age Bracket | Male | Female |
| Under 5 Years | 0 (0.0%) | 0 (0.0%) |
| 5 to 17 Years | 53 (24.3%) | 0 (0.0%) |
| 18 to 34 Years | 22 (7.8%) | 17 (7.9%) |
| 35 to 64 Years | 41 (8.8%) | 23 (6.9%) |
| 65 to 74 Years | 51 (36.2%) | 29 (11.3%) |
| 75 Years and over | 66 (58.9%) | 64 (49.2%) |
Disability Class by Sex by Age in Wailua
Disability Class: Hearing Difficulty
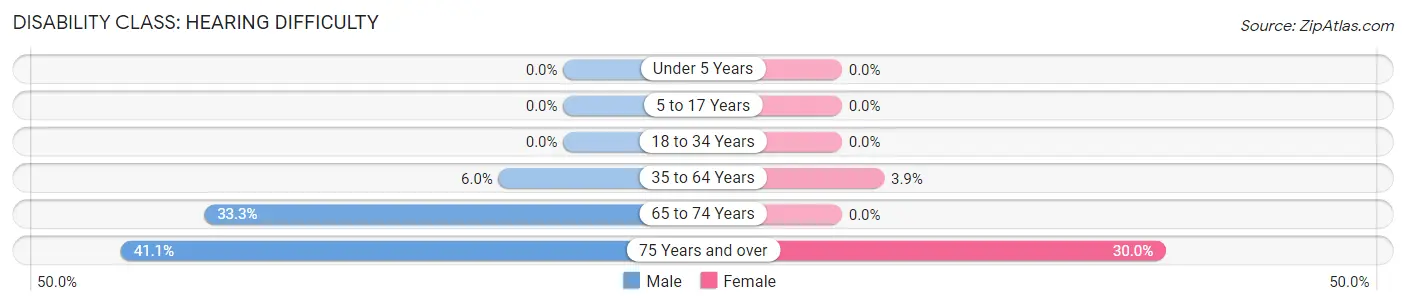
| Age Bracket | Male | Female |
| Under 5 Years | 0 (0.0%) | 0 (0.0%) |
| 5 to 17 Years | 0 (0.0%) | 0 (0.0%) |
| 18 to 34 Years | 0 (0.0%) | 0 (0.0%) |
| 35 to 64 Years | 28 (6.0%) | 13 (3.9%) |
| 65 to 74 Years | 47 (33.3%) | 0 (0.0%) |
| 75 Years and over | 46 (41.1%) | 39 (30.0%) |
Disability Class: Vision Difficulty
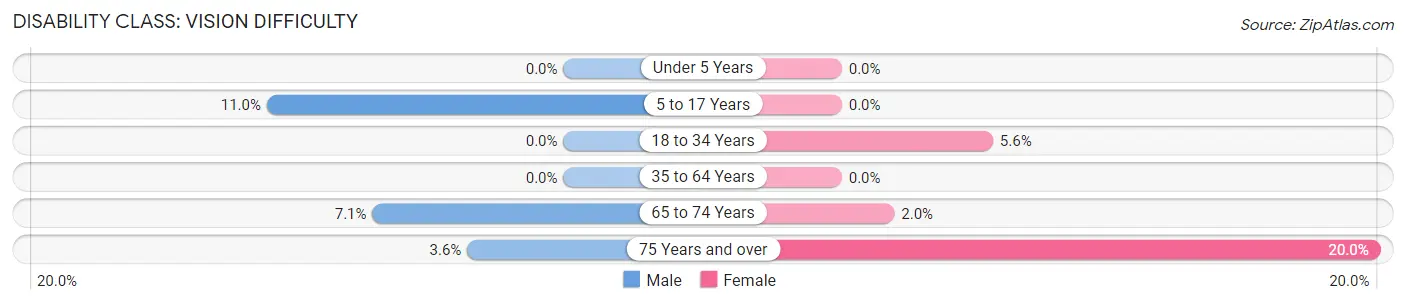
| Age Bracket | Male | Female |
| Under 5 Years | 0 (0.0%) | 0 (0.0%) |
| 5 to 17 Years | 24 (11.0%) | 0 (0.0%) |
| 18 to 34 Years | 0 (0.0%) | 12 (5.6%) |
| 35 to 64 Years | 0 (0.0%) | 0 (0.0%) |
| 65 to 74 Years | 10 (7.1%) | 5 (1.9%) |
| 75 Years and over | 4 (3.6%) | 26 (20.0%) |
Disability Class: Cognitive Difficulty
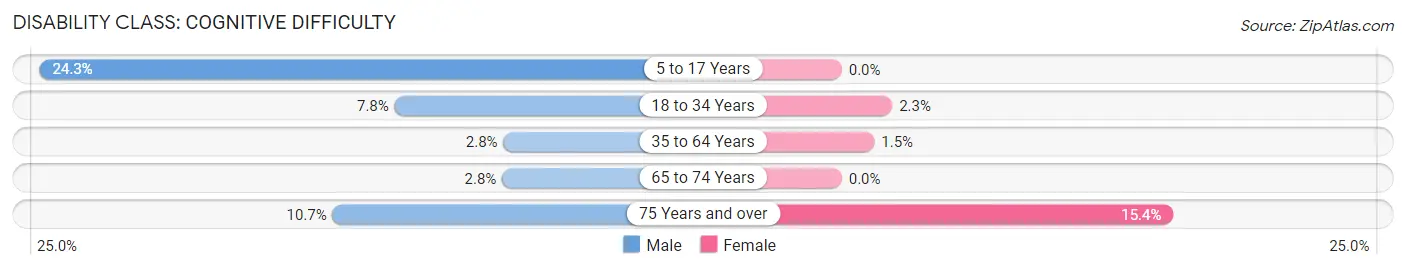
| Age Bracket | Male | Female |
| 5 to 17 Years | 53 (24.3%) | 0 (0.0%) |
| 18 to 34 Years | 22 (7.8%) | 5 (2.3%) |
| 35 to 64 Years | 13 (2.8%) | 5 (1.5%) |
| 65 to 74 Years | 4 (2.8%) | 0 (0.0%) |
| 75 Years and over | 12 (10.7%) | 20 (15.4%) |
Disability Class: Ambulatory Difficulty
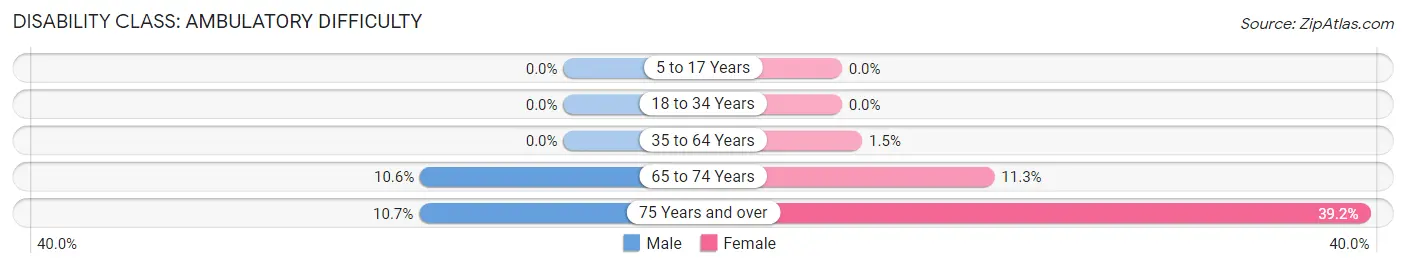
| Age Bracket | Male | Female |
| 5 to 17 Years | 0 (0.0%) | 0 (0.0%) |
| 18 to 34 Years | 0 (0.0%) | 0 (0.0%) |
| 35 to 64 Years | 0 (0.0%) | 5 (1.5%) |
| 65 to 74 Years | 15 (10.6%) | 29 (11.3%) |
| 75 Years and over | 12 (10.7%) | 51 (39.2%) |
Disability Class: Self-Care Difficulty
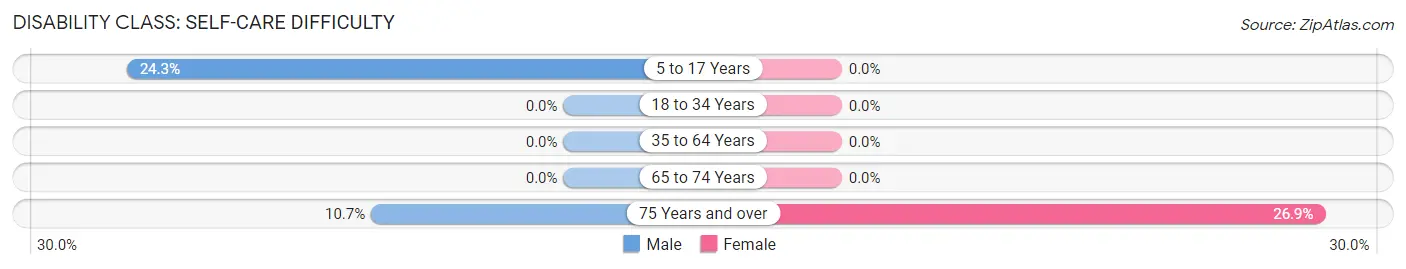
| Age Bracket | Male | Female |
| 5 to 17 Years | 53 (24.3%) | 0 (0.0%) |
| 18 to 34 Years | 0 (0.0%) | 0 (0.0%) |
| 35 to 64 Years | 0 (0.0%) | 0 (0.0%) |
| 65 to 74 Years | 0 (0.0%) | 0 (0.0%) |
| 75 Years and over | 12 (10.7%) | 35 (26.9%) |
Technology Access in Wailua
Computing Device Access in Wailua
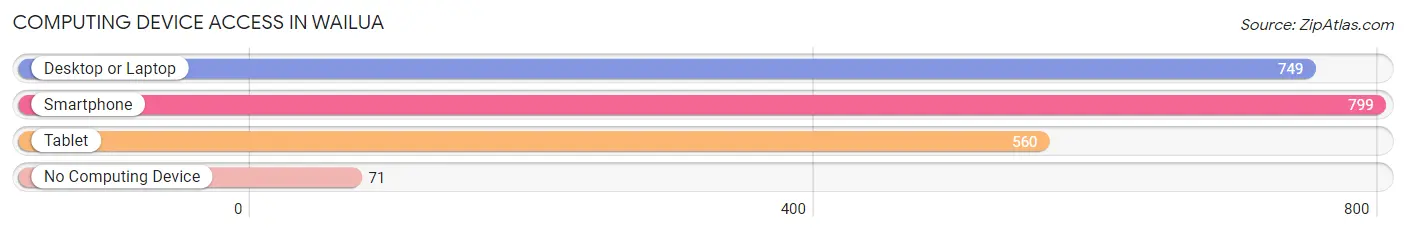
| Device Type | # Households | % Households |
| Desktop or Laptop | 749 | 82.0% |
| Smartphone | 799 | 87.4% |
| Tablet | 560 | 61.3% |
| No Computing Device | 71 | 7.8% |
| Total | 914 | 100.0% |
Internet Access in Wailua
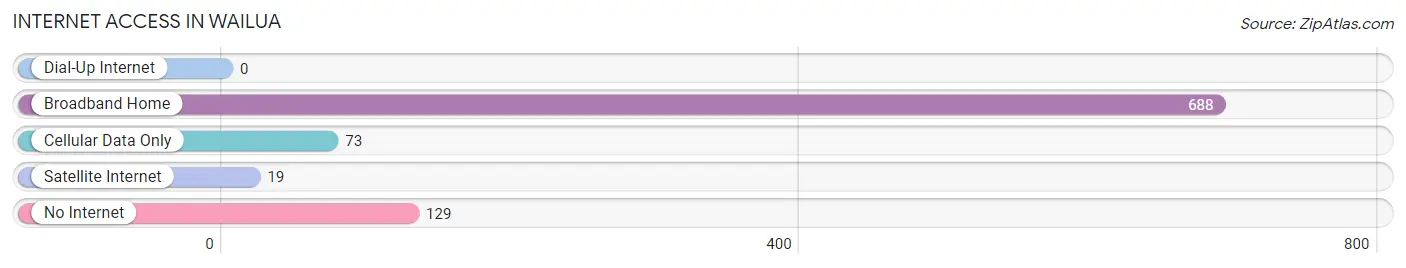
| Internet Type | # Households | % Households |
| Dial-Up Internet | 0 | 0.0% |
| Broadband Home | 688 | 75.3% |
| Cellular Data Only | 73 | 8.0% |
| Satellite Internet | 19 | 2.1% |
| No Internet | 129 | 14.1% |
| Total | 914 | 100.0% |
Wailua Summary
Wailua is a census-designated place (CDP) located in Kauai County, Hawaii, United States. The population was 4,539 at the 2010 census. Wailua is located on the east side of the island of Kauai, and is the only major town on the east side of the island.
History
The area of Wailua was first settled by Polynesian voyagers in the 12th century. The first Europeans to visit the area were Captain James Cook and his crew in 1778. The area was later settled by missionaries in the early 19th century. The town of Wailua was established in 1845 and was the first capital of the Kingdom of Hawaii.
Geography
Wailua is located at 21°58'N 159°25'W (21.967, -159.417). According to the United States Census Bureau, the CDP has a total area of 4.2 square miles (10.8 km2), of which 4.1 square miles (10.6 km2) is land and 0.1 square miles (0.2 km2) (2.37%) is water.
Economy
The economy of Wailua is largely based on tourism. The area is home to several resorts, hotels, and vacation rentals. The town is also home to several restaurants, shops, and other businesses catering to tourists. The area is also home to several agricultural operations, including sugarcane, coffee, and macadamia nut farms.
Demographics
As of the census of 2000, there were 4,539 people, 1,845 households, and 1,097 families residing in the CDP. The population density was 1,098.7 people per square mile (424.9/km2). There were 2,072 housing units at an average density of 501.3 per square mile (193.3/km2). The racial makeup of the CDP was 37.2% White, 0.2% African American, 0.3% Native American, 28.2% Asian, 8.2% Pacific Islander, 0.7% from other races, and 25.2% from two or more races. Hispanic or Latino of any race were 8.2% of the population.
There were 1,845 households, out of which 28.2% had children under the age of 18 living with them, 43.2% were married couples living together, 11.7% had a female householder with no husband present, and 39.7% were non-families. 30.2% of all households were made up of individuals, and 8.2% had someone living alone who was 65 years of age or older. The average household size was 2.45 and the average family size was 3.09.
In the CDP, the population was spread out, with 24.2% under the age of 18, 8.2% from 18 to 24, 30.2% from 25 to 44, 24.2% from 45 to 64, and 13.2% who were 65 years of age or older. The median age was 37 years. For every 100 females, there were 97.2 males. For every 100 females age 18 and over, there were 95.2 males.
The median income for a household in the CDP was $41,964, and the median income for a family was $50,000. Males had a median income of $31,250 versus $25,000 for females. The per capita income for the CDP was $20,945. About 8.2% of families and 11.7% of the population were below the poverty line, including 14.2% of those under age 18 and 8.2% of those age 65 or over.
Common Questions
What is Per Capita Income in Wailua?
Per Capita income in Wailua is $38,828.
What is the Median Family Income in Wailua?
Median Family Income in Wailua is $80,733.
What is the Median Household income in Wailua?
Median Household Income in Wailua is $67,258.
What is Income or Wage Gap in Wailua?
Income or Wage Gap in Wailua is 15.6%.
Women in Wailua earn 84.4 cents for every dollar earned by a man.
What is Inequality or Gini Index in Wailua?
Inequality or Gini Index in Wailua is 0.45.
What is the Total Population of Wailua?
Total Population of Wailua is 2,438.
What is the Total Male Population of Wailua?
Total Male Population of Wailua is 1,292.
What is the Total Female Population of Wailua?
Total Female Population of Wailua is 1,146.
What is the Ratio of Males per 100 Females in Wailua?
There are 112.74 Males per 100 Females in Wailua.
What is the Ratio of Females per 100 Males in Wailua?
There are 88.70 Females per 100 Males in Wailua.
What is the Median Population Age in Wailua?
Median Population Age in Wailua is 42.8 Years.
What is the Average Family Size in Wailua
Average Family Size in Wailua is 3.3 People.
What is the Average Household Size in Wailua
Average Household Size in Wailua is 2.7 People.
How Large is the Labor Force in Wailua?
There are 1,185 People in the Labor Forcein in Wailua.
What is the Percentage of People in the Labor Force in Wailua?
60.8% of People are in the Labor Force in Wailua.
What is the Unemployment Rate in Wailua?
Unemployment Rate in Wailua is 8.2%.