Discovery Harbour, HI Map & Demographics
Discovery Harbour Map
Discovery Harbour Overview
$35,411
PER CAPITA INCOME
$85,000
AVG FAMILY INCOME
$61,417
AVG HOUSEHOLD INCOME
0.46
INEQUALITY / GINI INDEX
1,241
TOTAL POPULATION
663
MALE POPULATION
578
FEMALE POPULATION
114.71
MALES / 100 FEMALES
87.18
FEMALES / 100 MALES
56.2
MEDIAN AGE
2.9
AVG FAMILY SIZE
2.4
AVG HOUSEHOLD SIZE
459
LABOR FORCE [ PEOPLE ]
42.4%
PERCENT IN LABOR FORCE
13.9%
UNEMPLOYMENT RATE
Income in Discovery Harbour
Income Overview in Discovery Harbour
Per Capita Income in Discovery Harbour is $35,411, while median incomes of families and households are $85,000 and $61,417 respectively.
| Characteristic | Number | Measure |
| Per Capita Income | 1,241 | $35,411 |
| Median Family Income | 334 | $85,000 |
| Mean Family Income | 334 | $95,334 |
| Median Household Income | 526 | $61,417 |
| Mean Household Income | 526 | $81,739 |
| Income Deficit | 334 | $0 |
| Wage / Income Gap (%) | 1,241 | 0.00% |
| Wage / Income Gap ($) | 1,241 | 100.00¢ per $1 |
| Gini / Inequality Index | 1,241 | 0.46 |
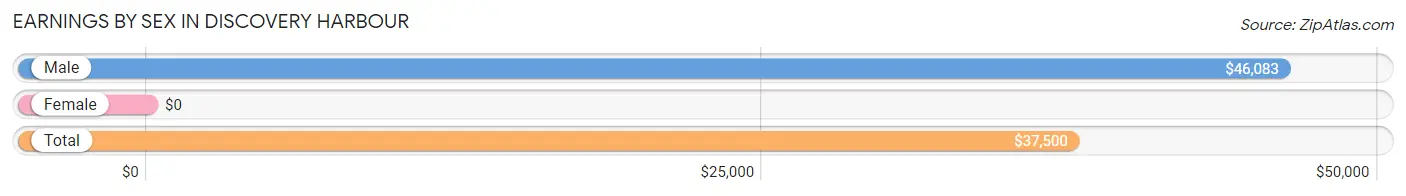
Earnings by Sex in Discovery Harbour
| Sex | Number | Average Earnings |
| Male | 275 (55.7%) | $46,083 |
| Female | 219 (44.3%) | $0 |
| Total | 494 (100.0%) | $37,500 |
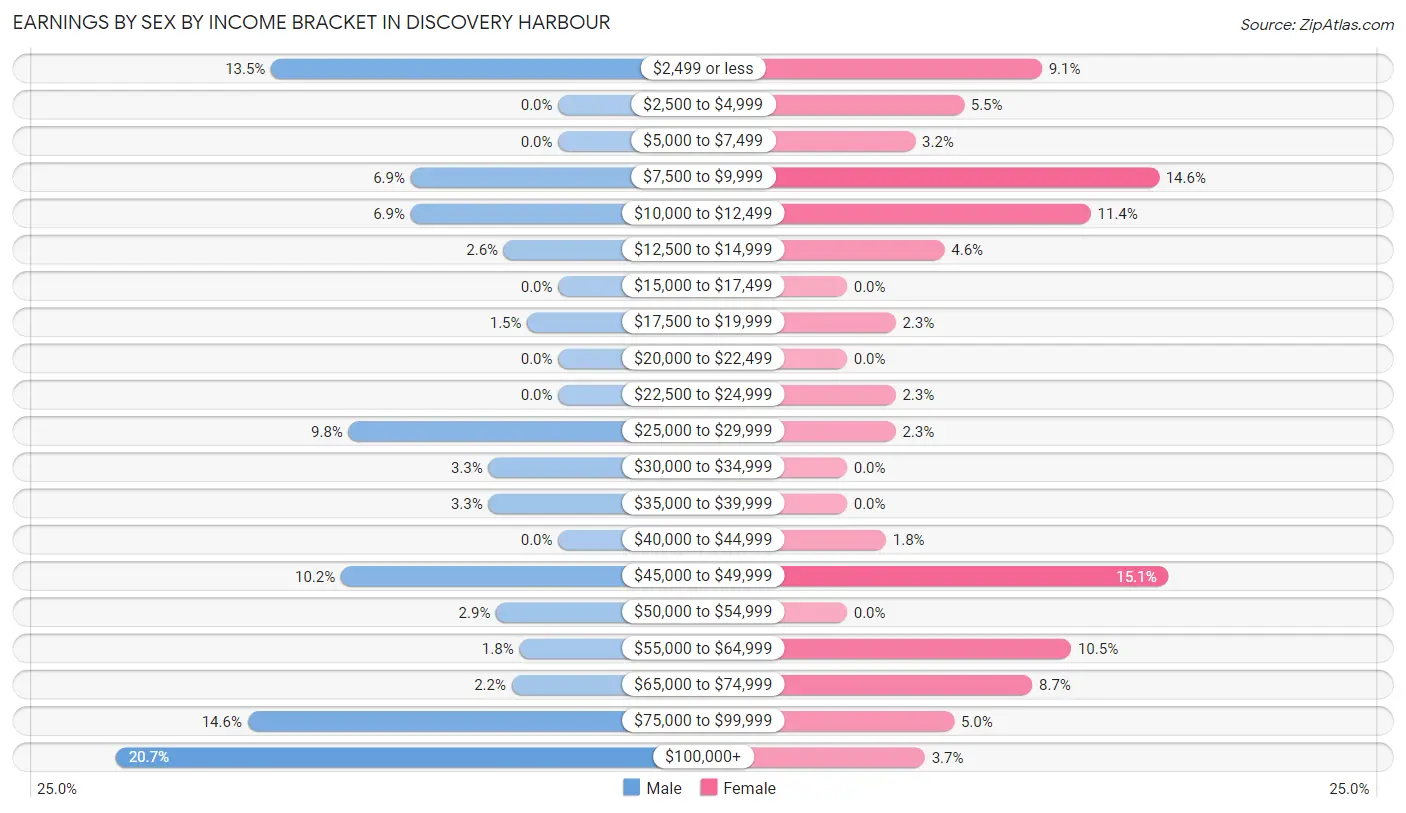
Earnings by Sex by Income Bracket in Discovery Harbour
The most common earnings brackets in Discovery Harbour are $100,000+ for men (57 | 20.7%) and $45,000 to $49,999 for women (33 | 15.1%).
| Income | Male | Female |
| $2,499 or less | 37 (13.5%) | 20 (9.1%) |
| $2,500 to $4,999 | 0 (0.0%) | 12 (5.5%) |
| $5,000 to $7,499 | 0 (0.0%) | 7 (3.2%) |
| $7,500 to $9,999 | 19 (6.9%) | 32 (14.6%) |
| $10,000 to $12,499 | 19 (6.9%) | 25 (11.4%) |
| $12,500 to $14,999 | 7 (2.5%) | 10 (4.6%) |
| $15,000 to $17,499 | 0 (0.0%) | 0 (0.0%) |
| $17,500 to $19,999 | 4 (1.5%) | 5 (2.3%) |
| $20,000 to $22,499 | 0 (0.0%) | 0 (0.0%) |
| $22,500 to $24,999 | 0 (0.0%) | 5 (2.3%) |
| $25,000 to $29,999 | 27 (9.8%) | 5 (2.3%) |
| $30,000 to $34,999 | 9 (3.3%) | 0 (0.0%) |
| $35,000 to $39,999 | 9 (3.3%) | 0 (0.0%) |
| $40,000 to $44,999 | 0 (0.0%) | 4 (1.8%) |
| $45,000 to $49,999 | 28 (10.2%) | 33 (15.1%) |
| $50,000 to $54,999 | 8 (2.9%) | 0 (0.0%) |
| $55,000 to $64,999 | 5 (1.8%) | 23 (10.5%) |
| $65,000 to $74,999 | 6 (2.2%) | 19 (8.7%) |
| $75,000 to $99,999 | 40 (14.5%) | 11 (5.0%) |
| $100,000+ | 57 (20.7%) | 8 (3.6%) |
| Total | 275 (100.0%) | 219 (100.0%) |
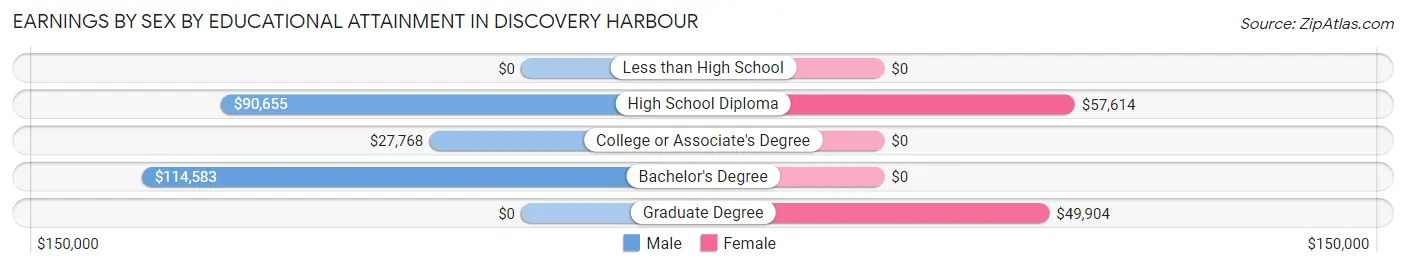
Earnings by Sex by Educational Attainment in Discovery Harbour
| Educational Attainment | Male Income | Female Income |
| Less than High School | - | - |
| High School Diploma | $90,655 | $57,614 |
| College or Associate's Degree | $27,768 | $0 |
| Bachelor's Degree | $114,583 | $0 |
| Graduate Degree | - | - |
| Total | $49,231 | $0 |
Family Income in Discovery Harbour
Family Income Brackets in Discovery Harbour
According to the Discovery Harbour family income data, there are 68 families falling into the $75,000 to $99,999 income range, which is the most common income bracket and makes up 20.4% of all families. Conversely, the less than $10,000 income bracket is the least frequent group with only 6 families (1.8%) belonging to this category.
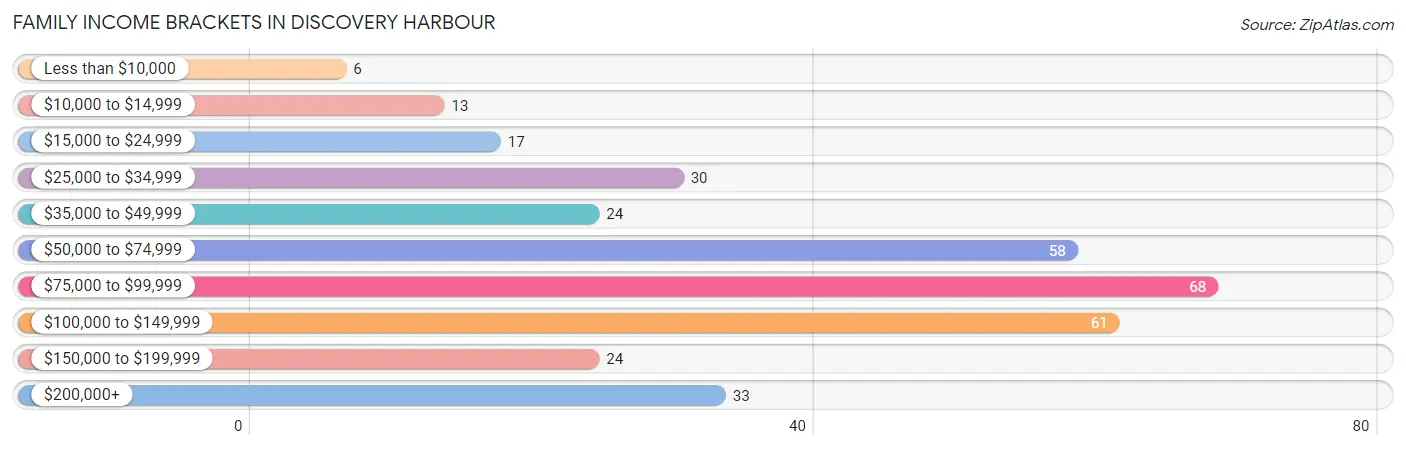
| Income Bracket | # Families | % Families |
| Less than $10,000 | 6 | 1.8% |
| $10,000 to $14,999 | 13 | 3.9% |
| $15,000 to $24,999 | 17 | 5.1% |
| $25,000 to $34,999 | 30 | 9.0% |
| $35,000 to $49,999 | 24 | 7.2% |
| $50,000 to $74,999 | 58 | 17.4% |
| $75,000 to $99,999 | 68 | 20.4% |
| $100,000 to $149,999 | 61 | 18.3% |
| $150,000 to $199,999 | 24 | 7.2% |
| $200,000+ | 33 | 9.9% |
Family Income by Famaliy Size in Discovery Harbour
6-person families (24 | 7.2%) account for the highest median family income in Discovery Harbour with $145,000 per family, while 2-person families (212 | 63.5%) have the highest median income of $41,442 per family member.
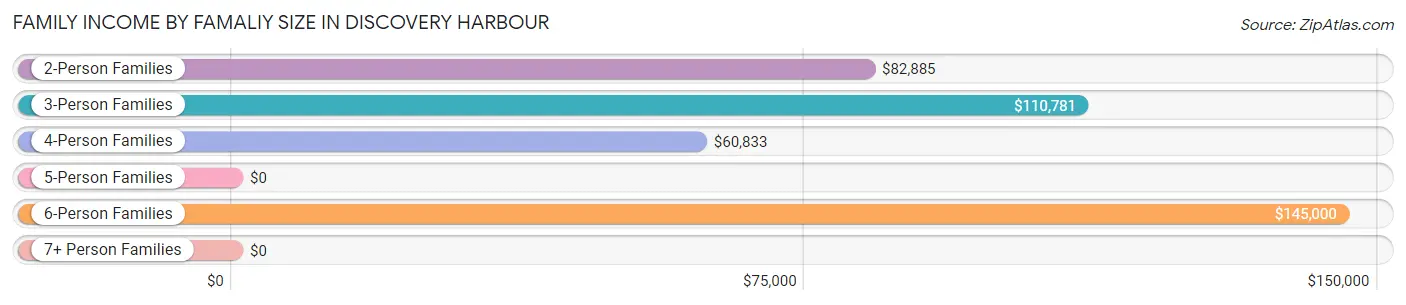
| Income Bracket | # Families | Median Income |
| 2-Person Families | 212 (63.5%) | $82,885 |
| 3-Person Families | 31 (9.3%) | $110,781 |
| 4-Person Families | 32 (9.6%) | $60,833 |
| 5-Person Families | 35 (10.5%) | $0 |
| 6-Person Families | 24 (7.2%) | $145,000 |
| 7+ Person Families | 0 (0.0%) | $0 |
| Total | 334 (100.0%) | $85,000 |
Family Income by Number of Earners in Discovery Harbour
The median family income in Discovery Harbour is $85,000, with families comprising 2 earners (67) having the highest median family income of $141,875, while families with no earners (116) have the lowest median family income of $63,021, accounting for 20.1% and 34.7% of families, respectively.
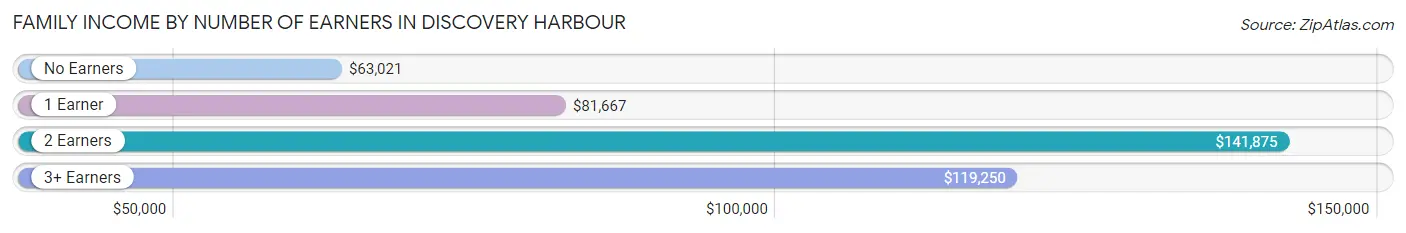
| Number of Earners | # Families | Median Income |
| No Earners | 116 (34.7%) | $63,021 |
| 1 Earner | 128 (38.3%) | $81,667 |
| 2 Earners | 67 (20.1%) | $141,875 |
| 3+ Earners | 23 (6.9%) | $119,250 |
| Total | 334 (100.0%) | $85,000 |
Household Income in Discovery Harbour
Household Income Brackets in Discovery Harbour
With 95 households falling in the category, the $50,000 to $74,999 income range is the most frequent in Discovery Harbour, accounting for 18.1% of all households. In contrast, only 27 households (5.1%) fall into the $15,000 to $24,999 income bracket, making it the least populous group.
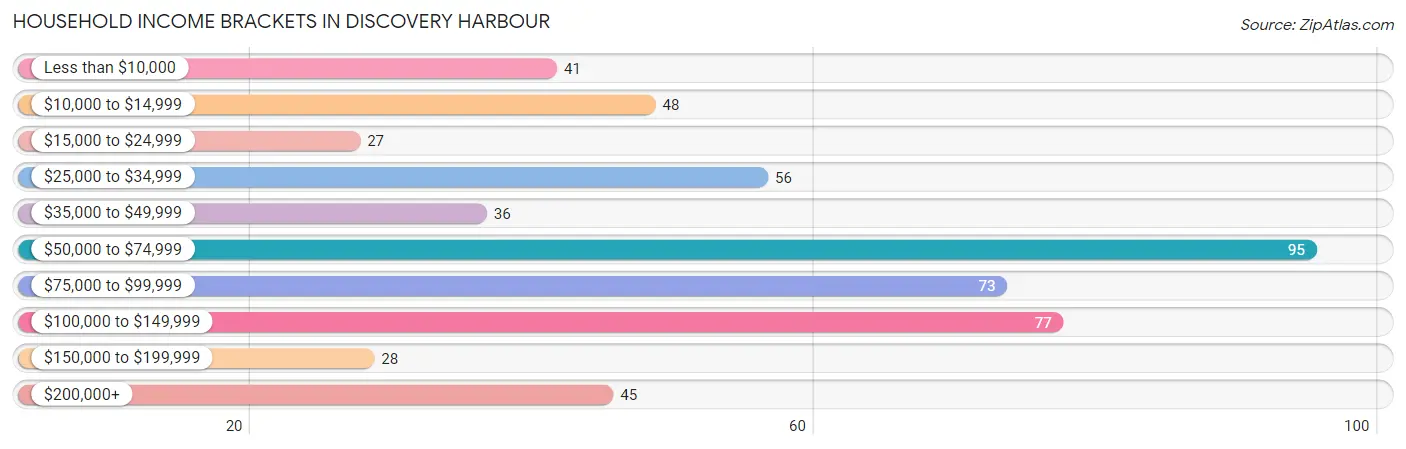
| Income Bracket | # Households | % Households |
| Less than $10,000 | 41 | 7.8% |
| $10,000 to $14,999 | 48 | 9.1% |
| $15,000 to $24,999 | 27 | 5.1% |
| $25,000 to $34,999 | 56 | 10.6% |
| $35,000 to $49,999 | 36 | 6.8% |
| $50,000 to $74,999 | 95 | 18.1% |
| $75,000 to $99,999 | 73 | 13.9% |
| $100,000 to $149,999 | 77 | 14.6% |
| $150,000 to $199,999 | 28 | 5.3% |
| $200,000+ | 45 | 8.6% |
Household Income by Householder Age in Discovery Harbour
The median household income in Discovery Harbour is $61,417, with the highest median household income of $111,023 found in the 45 to 64 years age bracket for the primary householder. A total of 147 households (28.0%) fall into this category. Meanwhile, the 15 to 24 years age bracket for the primary householder has the lowest median household income of $0, with 11 households (2.1%) in this group.
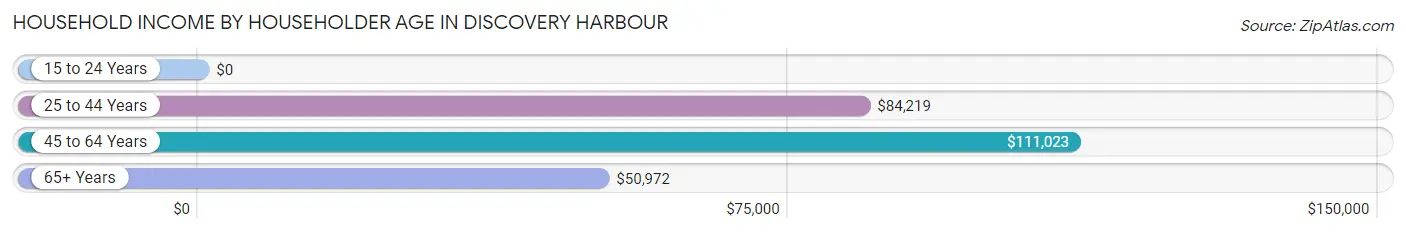
| Income Bracket | # Households | Median Income |
| 15 to 24 Years | 11 (2.1%) | $0 |
| 25 to 44 Years | 95 (18.1%) | $84,219 |
| 45 to 64 Years | 147 (28.0%) | $111,023 |
| 65+ Years | 273 (51.9%) | $50,972 |
| Total | 526 (100.0%) | $61,417 |
Poverty in Discovery Harbour
Income Below Poverty by Sex and Age in Discovery Harbour
With 17.1% poverty level for males and 13.3% for females among the residents of Discovery Harbour, 6 to 11 year old males and 6 to 11 year old females are the most vulnerable to poverty, with 9 males (60.0%) and 5 females (100.0%) in their respective age groups living below the poverty level.
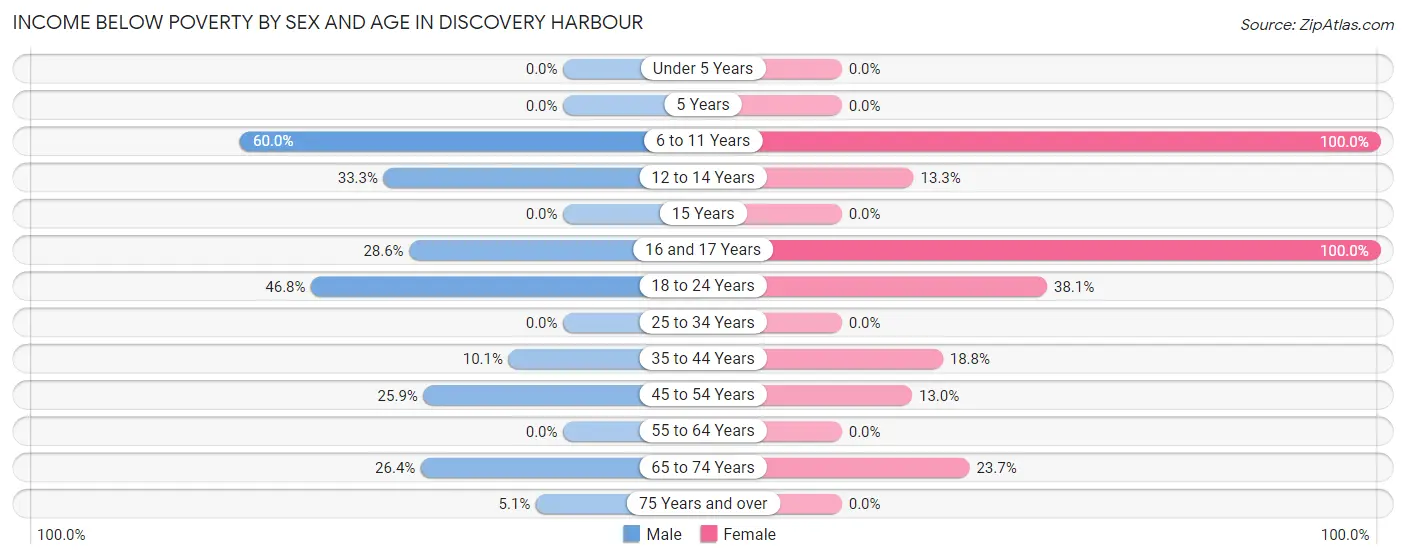
| Age Bracket | Male | Female |
| Under 5 Years | 0 (0.0%) | 0 (0.0%) |
| 5 Years | 0 (0.0%) | 0 (0.0%) |
| 6 to 11 Years | 9 (60.0%) | 5 (100.0%) |
| 12 to 14 Years | 6 (33.3%) | 6 (13.3%) |
| 15 Years | 0 (0.0%) | 0 (0.0%) |
| 16 and 17 Years | 10 (28.6%) | 5 (100.0%) |
| 18 to 24 Years | 29 (46.8%) | 8 (38.1%) |
| 25 to 34 Years | 0 (0.0%) | 0 (0.0%) |
| 35 to 44 Years | 8 (10.1%) | 15 (18.8%) |
| 45 to 54 Years | 7 (25.9%) | 6 (13.0%) |
| 55 to 64 Years | 0 (0.0%) | 0 (0.0%) |
| 65 to 74 Years | 38 (26.4%) | 32 (23.7%) |
| 75 Years and over | 5 (5.1%) | 0 (0.0%) |
| Total | 112 (17.1%) | 77 (13.3%) |
Income Above Poverty by Sex and Age in Discovery Harbour
According to the poverty statistics in Discovery Harbour, males aged under 5 years and females aged under 5 years are the age groups that are most secure financially, with 100.0% of males and 100.0% of females in these age groups living above the poverty line.
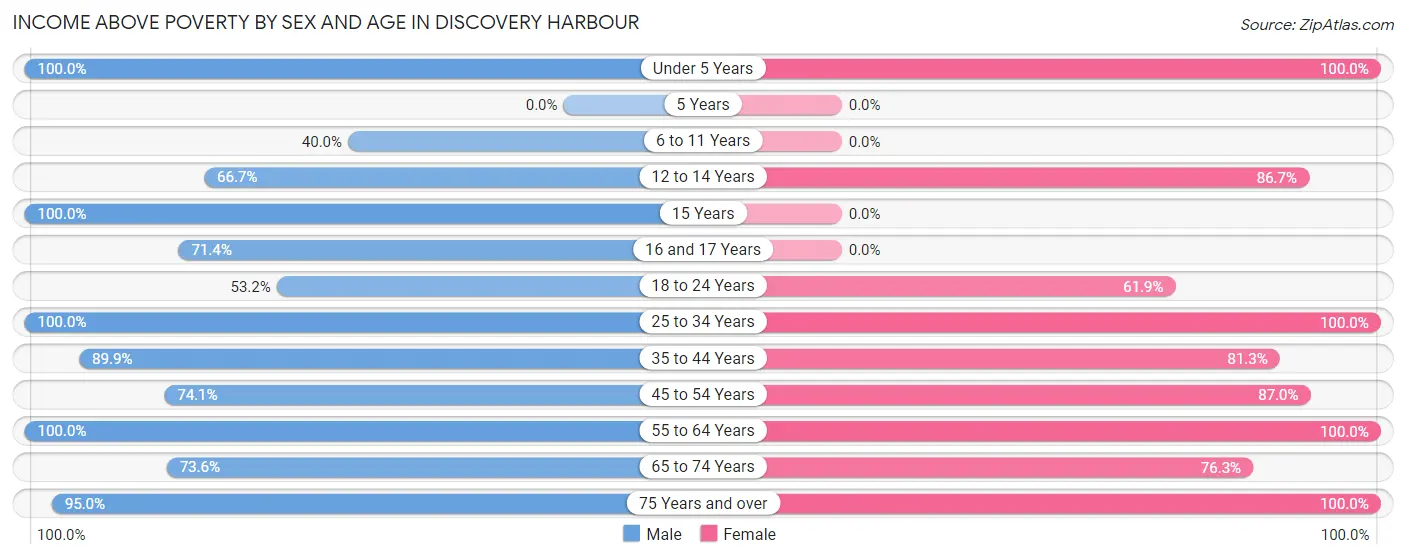
| Age Bracket | Male | Female |
| Under 5 Years | 35 (100.0%) | 31 (100.0%) |
| 5 Years | 0 (0.0%) | 0 (0.0%) |
| 6 to 11 Years | 6 (40.0%) | 0 (0.0%) |
| 12 to 14 Years | 12 (66.7%) | 39 (86.7%) |
| 15 Years | 3 (100.0%) | 0 (0.0%) |
| 16 and 17 Years | 25 (71.4%) | 0 (0.0%) |
| 18 to 24 Years | 33 (53.2%) | 13 (61.9%) |
| 25 to 34 Years | 45 (100.0%) | 40 (100.0%) |
| 35 to 44 Years | 71 (89.9%) | 65 (81.2%) |
| 45 to 54 Years | 20 (74.1%) | 40 (87.0%) |
| 55 to 64 Years | 94 (100.0%) | 123 (100.0%) |
| 65 to 74 Years | 106 (73.6%) | 103 (76.3%) |
| 75 Years and over | 94 (95.0%) | 47 (100.0%) |
| Total | 544 (82.9%) | 501 (86.7%) |
Income Below Poverty Among Married-Couple Families in Discovery Harbour
The poverty statistics for married-couple families in Discovery Harbour show that 7.3% or 21 of the total 288 families live below the poverty line. Families with 1 or 2 children have the highest poverty rate of 19.1%, comprising of 8 families. On the other hand, families with no children have the lowest poverty rate of 3.0%, which includes 6 families.
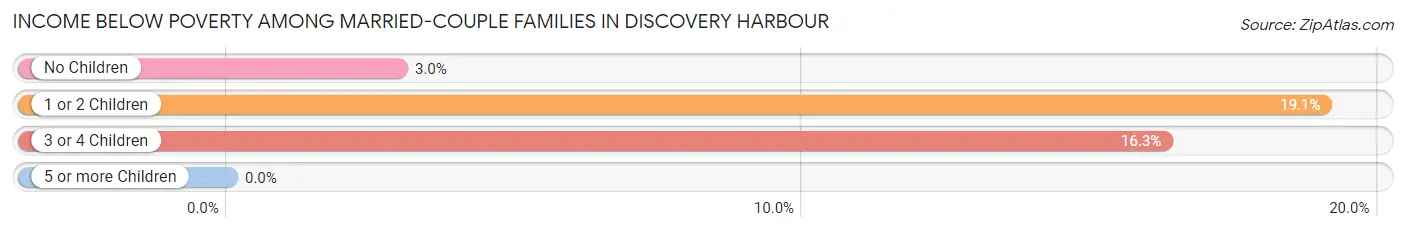
| Children | Above Poverty | Below Poverty |
| No Children | 197 (97.0%) | 6 (3.0%) |
| 1 or 2 Children | 34 (80.9%) | 8 (19.1%) |
| 3 or 4 Children | 36 (83.7%) | 7 (16.3%) |
| 5 or more Children | 0 (0.0%) | 0 (0.0%) |
| Total | 267 (92.7%) | 21 (7.3%) |
Income Below Poverty Among Single-Parent Households in Discovery Harbour
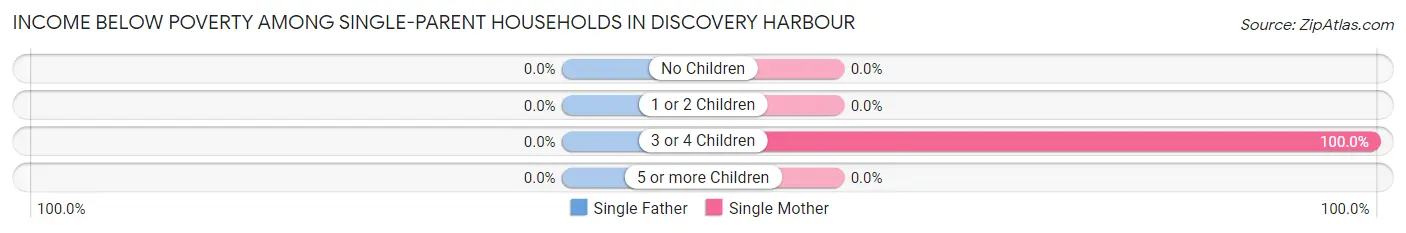
| Children | Single Father | Single Mother |
| No Children | 0 (0.0%) | 0 (0.0%) |
| 1 or 2 Children | 0 (0.0%) | 0 (0.0%) |
| 3 or 4 Children | 0 (0.0%) | 6 (100.0%) |
| 5 or more Children | 0 (0.0%) | 0 (0.0%) |
| Total | 0 (0.0%) | 6 (18.8%) |
Income Below Poverty Among Married-Couple vs Single-Parent Households in Discovery Harbour
The poverty data for Discovery Harbour shows that 21 of the married-couple family households (7.3%) and 6 of the single-parent households (13.0%) are living below the poverty level. Within the married-couple family households, those with 1 or 2 children have the highest poverty rate, with 8 households (19.1%) falling below the poverty line. Among the single-parent households, those with 3 or 4 children have the highest poverty rate, with 6 household (100.0%) living below poverty.
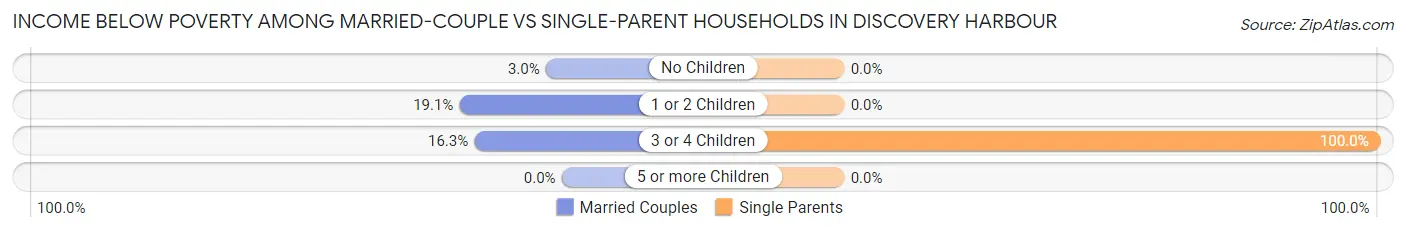
| Children | Married-Couple Families | Single-Parent Households |
| No Children | 6 (3.0%) | 0 (0.0%) |
| 1 or 2 Children | 8 (19.1%) | 0 (0.0%) |
| 3 or 4 Children | 7 (16.3%) | 6 (100.0%) |
| 5 or more Children | 0 (0.0%) | 0 (0.0%) |
| Total | 21 (7.3%) | 6 (13.0%) |
Race in Discovery Harbour
The most populous races in Discovery Harbour are White / Caucasian (748 | 60.3%), Two or more Races (281 | 22.6%), and Hispanic or Latino (158 | 12.7%).
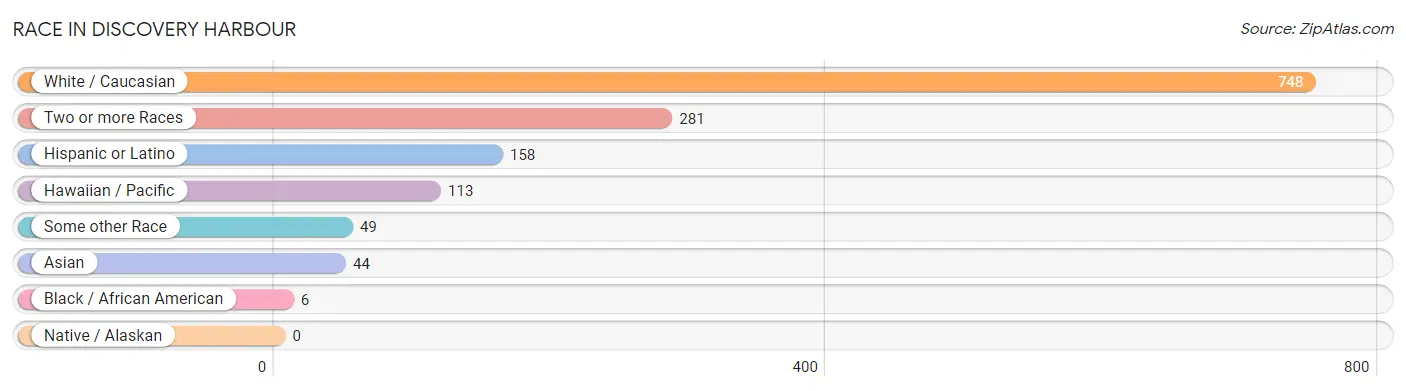
| Race | # Population | % Population |
| Asian | 44 | 3.5% |
| Black / African American | 6 | 0.5% |
| Hawaiian / Pacific | 113 | 9.1% |
| Hispanic or Latino | 158 | 12.7% |
| Native / Alaskan | 0 | 0.0% |
| White / Caucasian | 748 | 60.3% |
| Two or more Races | 281 | 22.6% |
| Some other Race | 49 | 4.0% |
| Total | 1,241 | 100.0% |
Ancestry in Discovery Harbour
The most populous ancestries reported in Discovery Harbour are Native Hawaiian (254 | 20.5%), German (234 | 18.9%), English (201 | 16.2%), Irish (142 | 11.4%), and Korean (124 | 10.0%), together accounting for 77.0% of all Discovery Harbour residents.
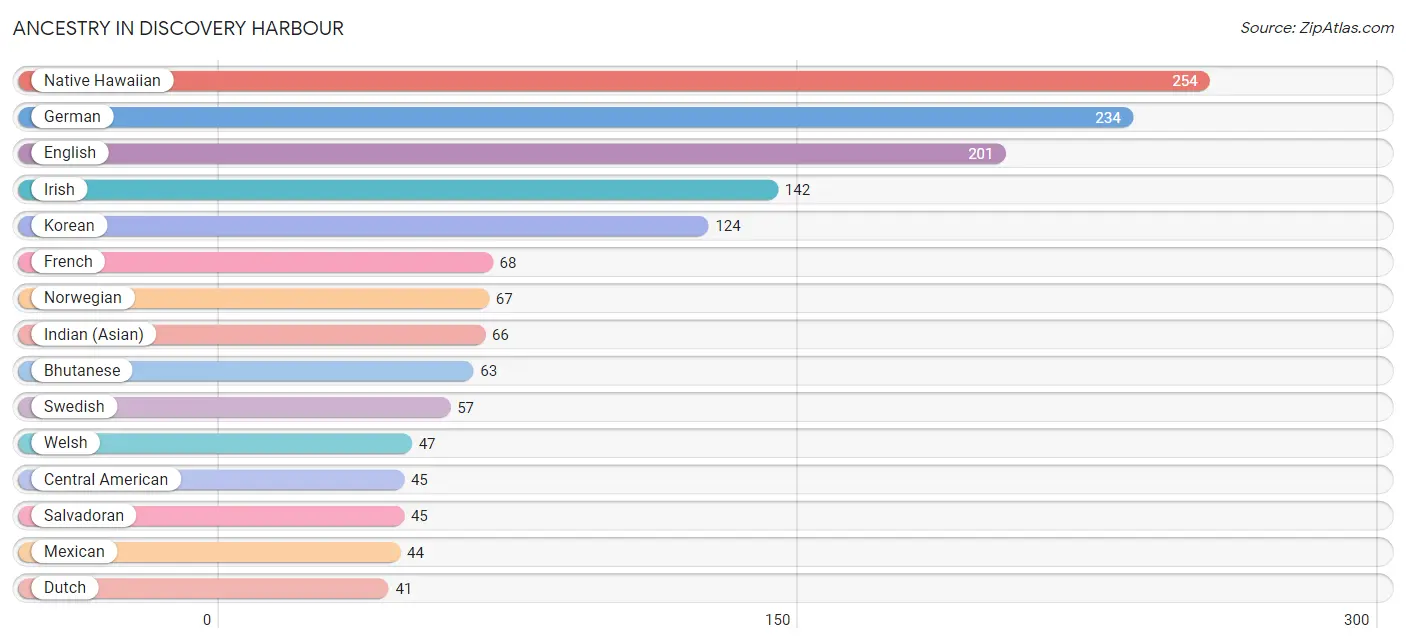
| Ancestry | # Population | % Population |
| Apache | 3 | 0.2% |
| Arab | 19 | 1.5% |
| Austrian | 6 | 0.5% |
| Bhutanese | 63 | 5.1% |
| British | 17 | 1.4% |
| Burmese | 6 | 0.5% |
| Canadian | 3 | 0.2% |
| Central American | 45 | 3.6% |
| Colombian | 37 | 3.0% |
| Danish | 3 | 0.2% |
| Dutch | 41 | 3.3% |
| Eastern European | 5 | 0.4% |
| English | 201 | 16.2% |
| Estonian | 6 | 0.5% |
| European | 10 | 0.8% |
| French | 68 | 5.5% |
| German | 234 | 18.9% |
| Indian (Asian) | 66 | 5.3% |
| Irish | 142 | 11.4% |
| Italian | 41 | 3.3% |
| Korean | 124 | 10.0% |
| Lebanese | 5 | 0.4% |
| Mexican | 44 | 3.5% |
| Moroccan | 14 | 1.1% |
| Native Hawaiian | 254 | 20.5% |
| Northern European | 5 | 0.4% |
| Norwegian | 67 | 5.4% |
| Polish | 9 | 0.7% |
| Portuguese | 29 | 2.3% |
| Puerto Rican | 13 | 1.1% |
| Russian | 10 | 0.8% |
| Salvadoran | 45 | 3.6% |
| Samoan | 24 | 1.9% |
| Scotch-Irish | 10 | 0.8% |
| Scottish | 8 | 0.6% |
| South American | 37 | 3.0% |
| Spaniard | 4 | 0.3% |
| Spanish | 11 | 0.9% |
| Subsaharan African | 7 | 0.6% |
| Swedish | 57 | 4.6% |
| Swiss | 21 | 1.7% |
| Tongan | 18 | 1.5% |
| Ukrainian | 13 | 1.1% |
| Welsh | 47 | 3.8% |
| West Indian | 6 | 0.5% | View All 45 Rows |
Immigrants in Discovery Harbour
The most numerous immigrant groups reported in Discovery Harbour came from Latin America (54 | 4.3%), Colombia (37 | 3.0%), South America (37 | 3.0%), Asia (34 | 2.7%), and Philippines (34 | 2.7%), together accounting for 15.8% of all Discovery Harbour residents.
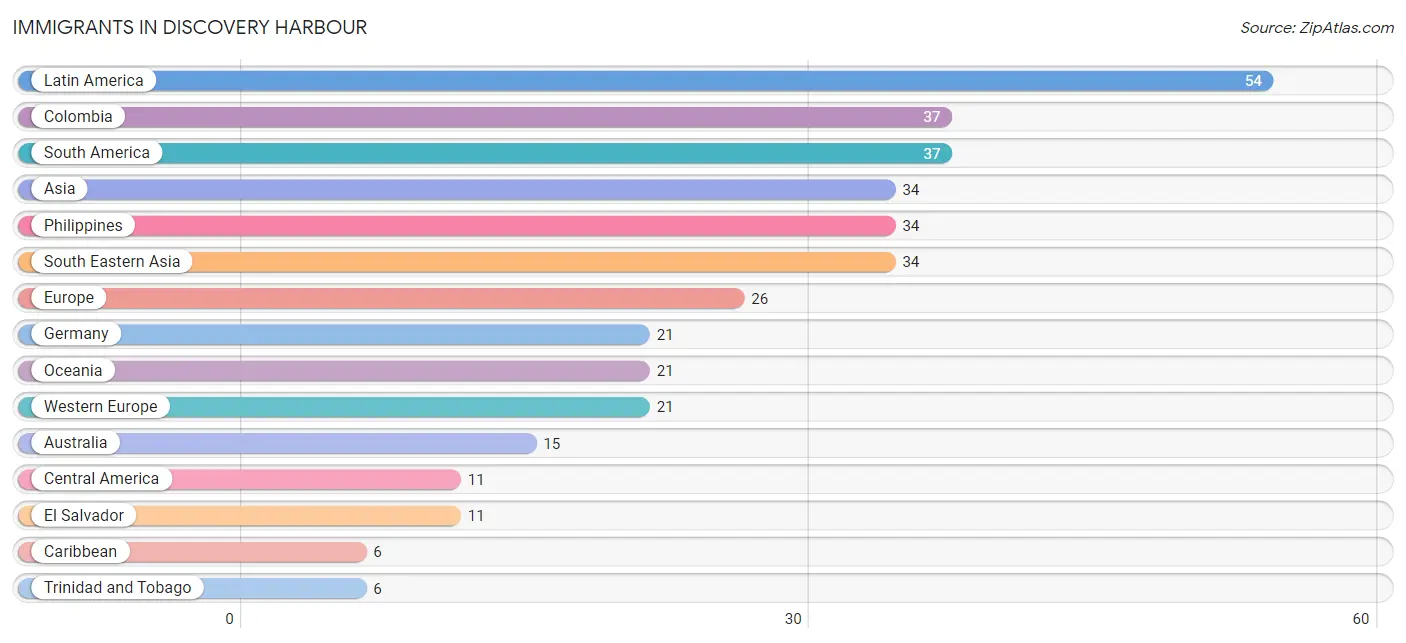
| Immigration Origin | # Population | % Population |
| Asia | 34 | 2.7% |
| Australia | 15 | 1.2% |
| Canada | 4 | 0.3% |
| Caribbean | 6 | 0.5% |
| Central America | 11 | 0.9% |
| Colombia | 37 | 3.0% |
| El Salvador | 11 | 0.9% |
| England | 5 | 0.4% |
| Europe | 26 | 2.1% |
| Germany | 21 | 1.7% |
| Latin America | 54 | 4.3% |
| Northern Europe | 5 | 0.4% |
| Oceania | 21 | 1.7% |
| Philippines | 34 | 2.7% |
| South America | 37 | 3.0% |
| South Eastern Asia | 34 | 2.7% |
| Trinidad and Tobago | 6 | 0.5% |
| Western Europe | 21 | 1.7% | View All 18 Rows |
Sex and Age in Discovery Harbour
Sex and Age in Discovery Harbour
The most populous age groups in Discovery Harbour are 70 to 74 Years (85 | 12.8%) for men and 70 to 74 Years (91 | 15.7%) for women.
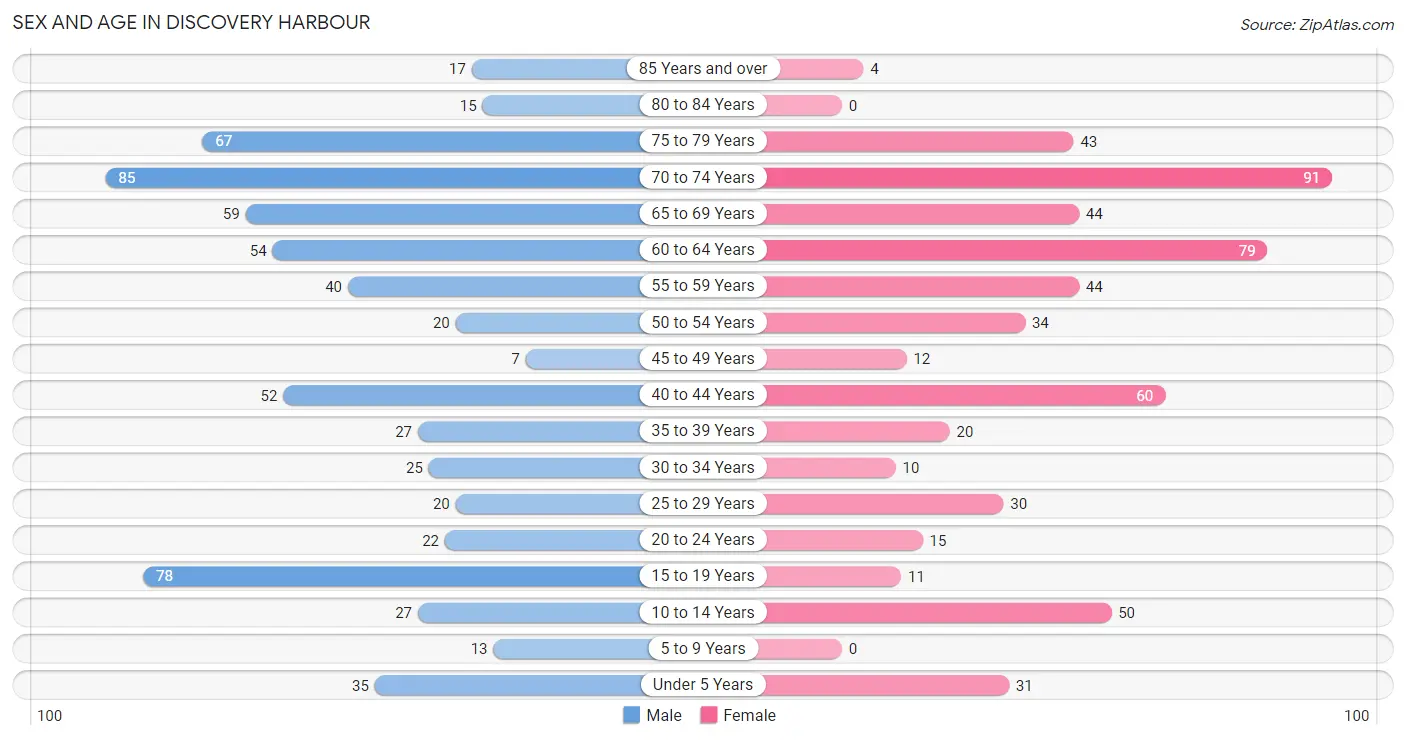
| Age Bracket | Male | Female |
| Under 5 Years | 35 (5.3%) | 31 (5.4%) |
| 5 to 9 Years | 13 (2.0%) | 0 (0.0%) |
| 10 to 14 Years | 27 (4.1%) | 50 (8.6%) |
| 15 to 19 Years | 78 (11.8%) | 11 (1.9%) |
| 20 to 24 Years | 22 (3.3%) | 15 (2.6%) |
| 25 to 29 Years | 20 (3.0%) | 30 (5.2%) |
| 30 to 34 Years | 25 (3.8%) | 10 (1.7%) |
| 35 to 39 Years | 27 (4.1%) | 20 (3.5%) |
| 40 to 44 Years | 52 (7.8%) | 60 (10.4%) |
| 45 to 49 Years | 7 (1.1%) | 12 (2.1%) |
| 50 to 54 Years | 20 (3.0%) | 34 (5.9%) |
| 55 to 59 Years | 40 (6.0%) | 44 (7.6%) |
| 60 to 64 Years | 54 (8.1%) | 79 (13.7%) |
| 65 to 69 Years | 59 (8.9%) | 44 (7.6%) |
| 70 to 74 Years | 85 (12.8%) | 91 (15.7%) |
| 75 to 79 Years | 67 (10.1%) | 43 (7.4%) |
| 80 to 84 Years | 15 (2.3%) | 0 (0.0%) |
| 85 Years and over | 17 (2.6%) | 4 (0.7%) |
| Total | 663 (100.0%) | 578 (100.0%) |
Families and Households in Discovery Harbour
Median Family Size in Discovery Harbour
The median family size in Discovery Harbour is 2.94 persons per family, with married-couple families (288 | 86.2%) accounting for the largest median family size of 2.95 persons per family. On the other hand, single male/father families (14 | 4.2%) represent the smallest median family size with 2.71 persons per family.
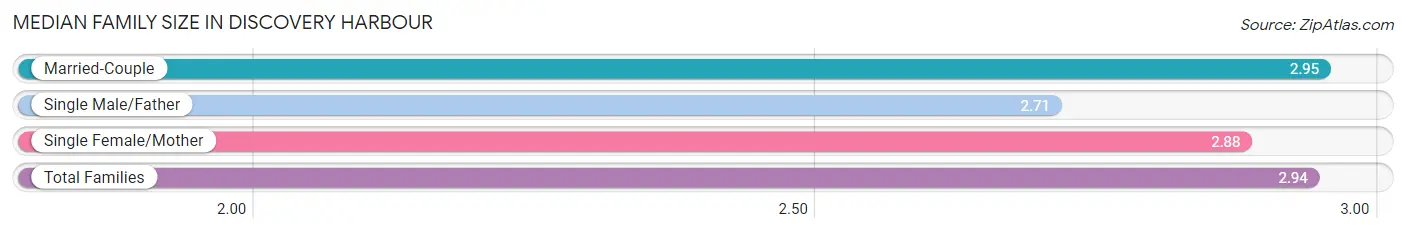
| Family Type | # Families | Family Size |
| Married-Couple | 288 (86.2%) | 2.95 |
| Single Male/Father | 14 (4.2%) | 2.71 |
| Single Female/Mother | 32 (9.6%) | 2.88 |
| Total Families | 334 (100.0%) | 2.94 |
Median Household Size in Discovery Harbour
The median household size in Discovery Harbour is 2.36 persons per household, with single male/father households (14 | 2.7%) accounting for the largest median household size of 3.14 persons per household. non-family households (192 | 36.5%) represent the smallest median household size with 1.24 persons per household.
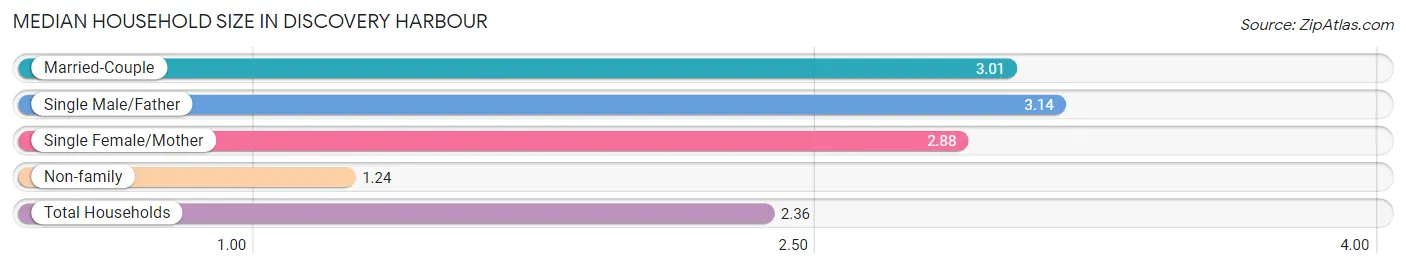
| Household Type | # Households | Household Size |
| Married-Couple | 288 (54.7%) | 3.01 |
| Single Male/Father | 14 (2.7%) | 3.14 |
| Single Female/Mother | 32 (6.1%) | 2.88 |
| Non-family | 192 (36.5%) | 1.24 |
| Total Households | 526 (100.0%) | 2.36 |
Household Size by Marriage Status in Discovery Harbour
Out of a total of 526 households in Discovery Harbour, 334 (63.5%) are family households, while 192 (36.5%) are nonfamily households. The most numerous type of family households are 2-person households, comprising 207, and the most common type of nonfamily households are 1-person households, comprising 148.
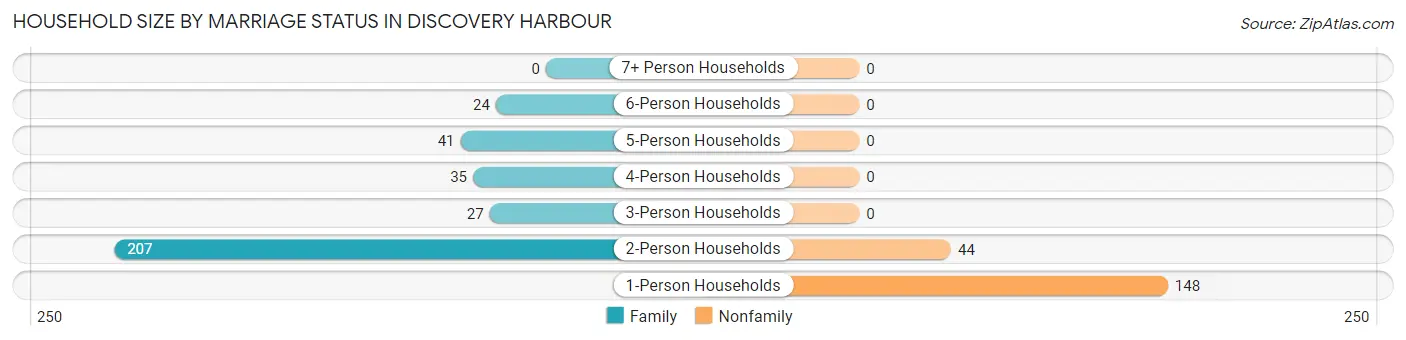
| Household Size | Family Households | Nonfamily Households |
| 1-Person Households | - | 148 (28.1%) |
| 2-Person Households | 207 (39.4%) | 44 (8.4%) |
| 3-Person Households | 27 (5.1%) | 0 (0.0%) |
| 4-Person Households | 35 (6.7%) | 0 (0.0%) |
| 5-Person Households | 41 (7.8%) | 0 (0.0%) |
| 6-Person Households | 24 (4.6%) | 0 (0.0%) |
| 7+ Person Households | 0 (0.0%) | 0 (0.0%) |
| Total | 334 (63.5%) | 192 (36.5%) |
Female Fertility in Discovery Harbour
Fertility by Age in Discovery Harbour
Average fertility rate in Discovery Harbour is 120.0 births per 1,000 women. Women in the age bracket of 20 to 34 years have the highest fertility rate with 218.0 births per 1,000 women. Women in the age bracket of 20 to 34 years acount for 63.2% of all women with births.
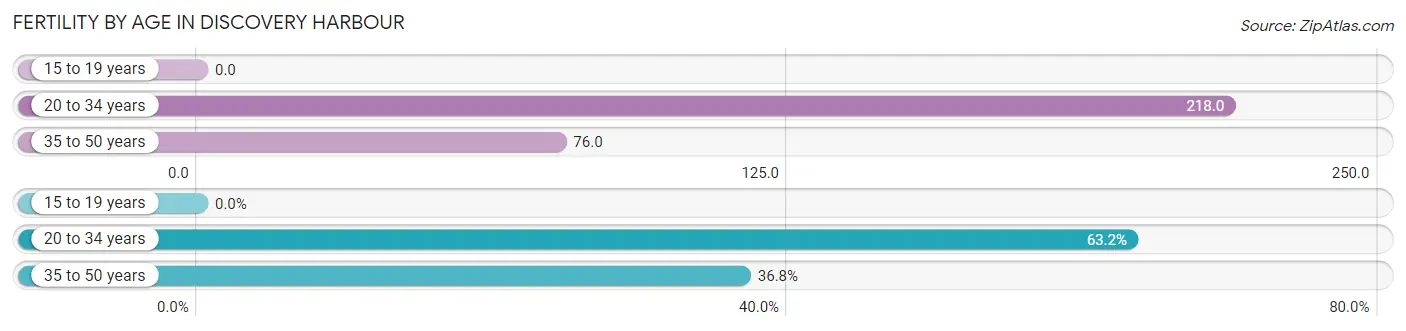
| Age Bracket | Women with Births | Births / 1,000 Women |
| 15 to 19 years | 0 (0.0%) | 0.0 |
| 20 to 34 years | 12 (63.2%) | 218.0 |
| 35 to 50 years | 7 (36.8%) | 76.0 |
| Total | 19 (100.0%) | 120.0 |
Fertility by Age by Marriage Status in Discovery Harbour
36.8% of women with births (19) in Discovery Harbour are married. The highest percentage of unmarried women with births falls into 20 to 34 years age bracket with 100.0% of them unmarried at the time of birth, while the lowest percentage of unmarried women with births belong to 35 to 50 years age bracket with 0.0% of them unmarried.
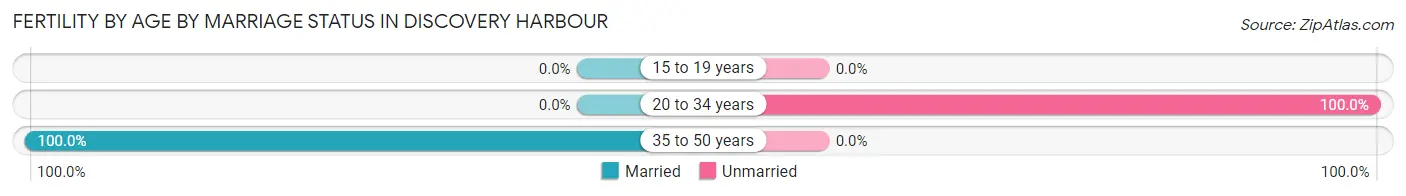
| Age Bracket | Married | Unmarried |
| 15 to 19 years | 0 (0.0%) | 0 (0.0%) |
| 20 to 34 years | 0 (0.0%) | 12 (100.0%) |
| 35 to 50 years | 7 (100.0%) | 0 (0.0%) |
| Total | 7 (36.8%) | 12 (63.2%) |
Fertility by Education in Discovery Harbour
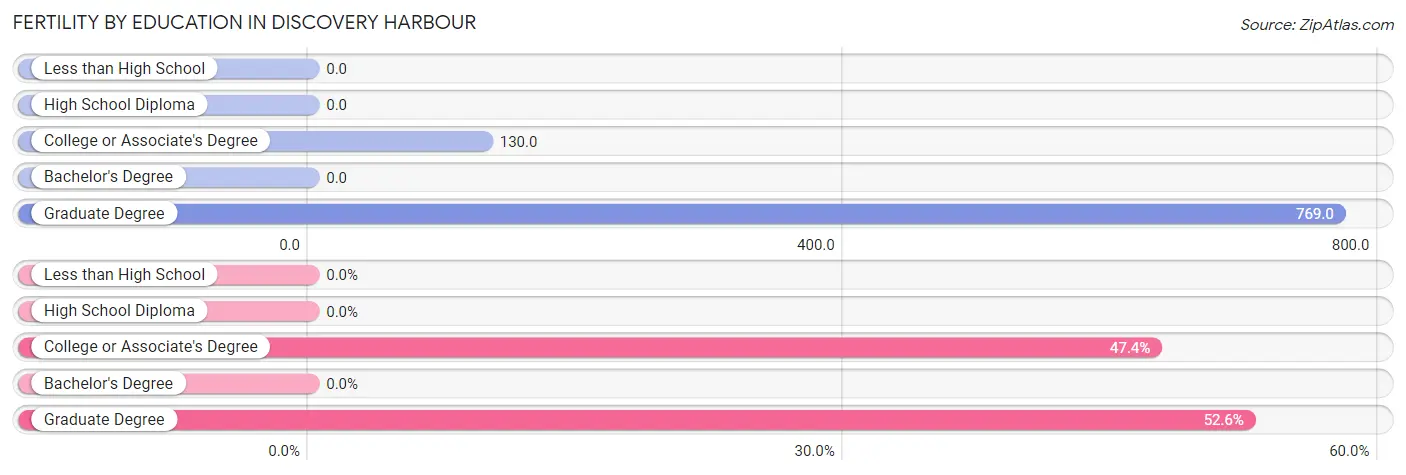
| Educational Attainment | Women with Births | Births / 1,000 Women |
| Less than High School | 0 (0.0%) | 0.0 |
| High School Diploma | 0 (0.0%) | 0.0 |
| College or Associate's Degree | 9 (47.4%) | 130.0 |
| Bachelor's Degree | 0 (0.0%) | 0.0 |
| Graduate Degree | 10 (52.6%) | 769.0 |
| Total | 19 (100.0%) | 120.0 |
Fertility by Education by Marriage Status in Discovery Harbour
63.2% of women with births in Discovery Harbour are unmarried. Women with the educational attainment of college or associate's degree are most likely to be married with 77.8% of them married at childbirth, while women with the educational attainment of graduate degree are least likely to be married with 100.0% of them unmarried at childbirth.
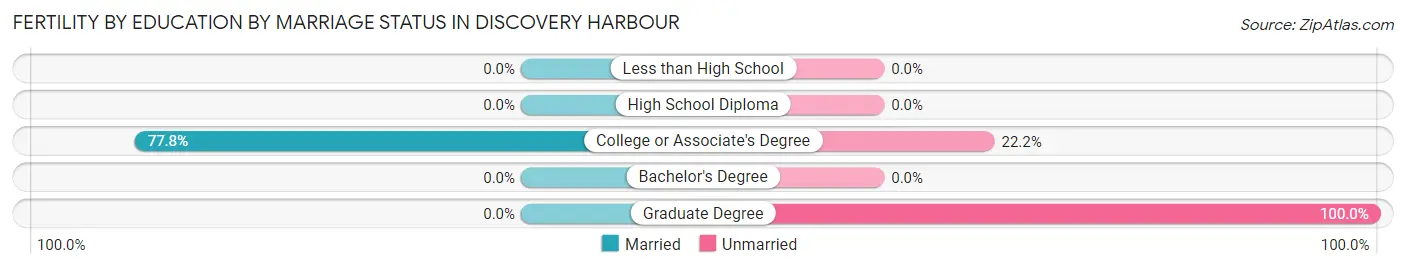
| Educational Attainment | Married | Unmarried |
| Less than High School | 0 (0.0%) | 0 (0.0%) |
| High School Diploma | 0 (0.0%) | 0 (0.0%) |
| College or Associate's Degree | 7 (77.8%) | 2 (22.2%) |
| Bachelor's Degree | 0 (0.0%) | 0 (0.0%) |
| Graduate Degree | 0 (0.0%) | 10 (100.0%) |
| Total | 7 (36.8%) | 12 (63.2%) |
Employment Characteristics in Discovery Harbour
Employment by Class of Employer in Discovery Harbour
Among the 393 employed individuals in Discovery Harbour, self-employed (not incorporated) (151 | 38.4%), private company employees (101 | 25.7%), and self-employed (incorporated) (55 | 14.0%) make up the most common classes of employment.
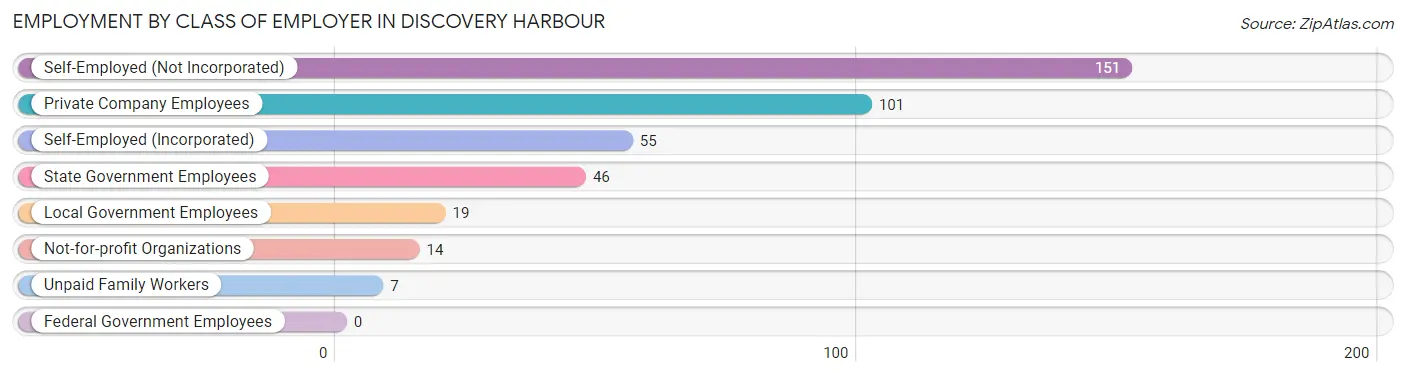
| Employer Class | # Employees | % Employees |
| Private Company Employees | 101 | 25.7% |
| Self-Employed (Incorporated) | 55 | 14.0% |
| Self-Employed (Not Incorporated) | 151 | 38.4% |
| Not-for-profit Organizations | 14 | 3.6% |
| Local Government Employees | 19 | 4.8% |
| State Government Employees | 46 | 11.7% |
| Federal Government Employees | 0 | 0.0% |
| Unpaid Family Workers | 7 | 1.8% |
| Total | 393 | 100.0% |
Employment Status by Age in Discovery Harbour
According to the labor force statistics for Discovery Harbour, out of the total population over 16 years of age (1,082), 42.4% or 459 individuals are in the labor force, with 13.9% or 64 of them unemployed. The age group with the highest labor force participation rate is 30 to 34 years, with 100.0% or 35 individuals in the labor force. Within the labor force, the 16 to 19 years age range has the highest percentage of unemployed individuals, with 78.6% or 22 of them being unemployed.
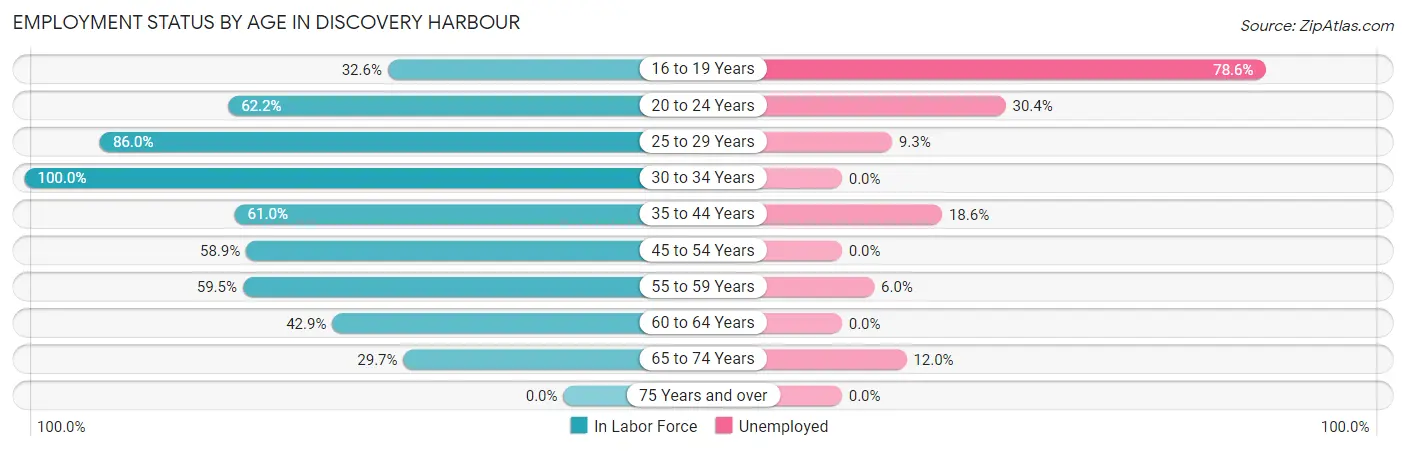
| Age Bracket | In Labor Force | Unemployed |
| 16 to 19 Years | 28 (32.6%) | 22 (78.6%) |
| 20 to 24 Years | 23 (62.2%) | 7 (30.4%) |
| 25 to 29 Years | 43 (86.0%) | 4 (9.3%) |
| 30 to 34 Years | 35 (100.0%) | 0 (0.0%) |
| 35 to 44 Years | 97 (61.0%) | 18 (18.6%) |
| 45 to 54 Years | 43 (58.9%) | 0 (0.0%) |
| 55 to 59 Years | 50 (59.5%) | 3 (6.0%) |
| 60 to 64 Years | 57 (42.9%) | 0 (0.0%) |
| 65 to 74 Years | 83 (29.7%) | 10 (12.0%) |
| 75 Years and over | 0 (0.0%) | 0 (0.0%) |
| Total | 459 (42.4%) | 64 (13.9%) |
Employment Status by Educational Attainment in Discovery Harbour
According to labor force statistics for Discovery Harbour, 60.9% of individuals (325) out of the total population between 25 and 64 years of age (534) are in the labor force, with 7.7% or 25 of them being unemployed. The group with the highest labor force participation rate are those with the educational attainment of bachelor's degree or higher, with 66.5% or 105 individuals in the labor force. Within the labor force, individuals with bachelor's degree or higher education have the highest percentage of unemployment, with 11.4% or 12 of them being unemployed.
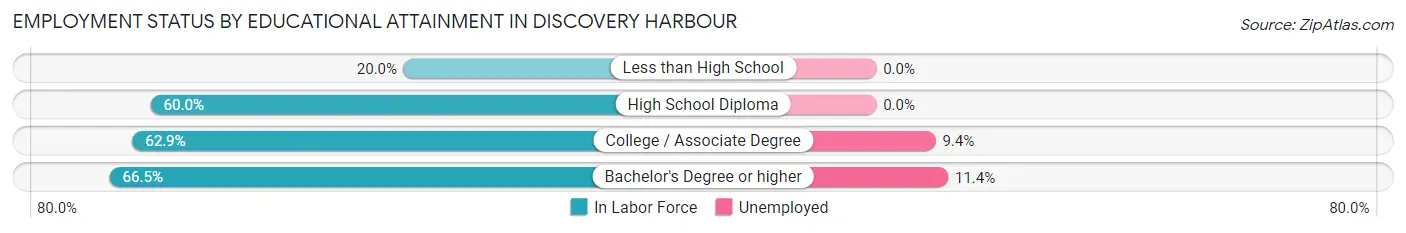
| Educational Attainment | In Labor Force | Unemployed |
| Less than High School | 6 (20.0%) | 0 (0.0%) |
| High School Diploma | 75 (60.0%) | 0 (0.0%) |
| College / Associate Degree | 139 (62.9%) | 21 (9.4%) |
| Bachelor's Degree or higher | 105 (66.5%) | 18 (11.4%) |
| Total | 325 (60.9%) | 41 (7.7%) |
Employment Occupations by Sex in Discovery Harbour
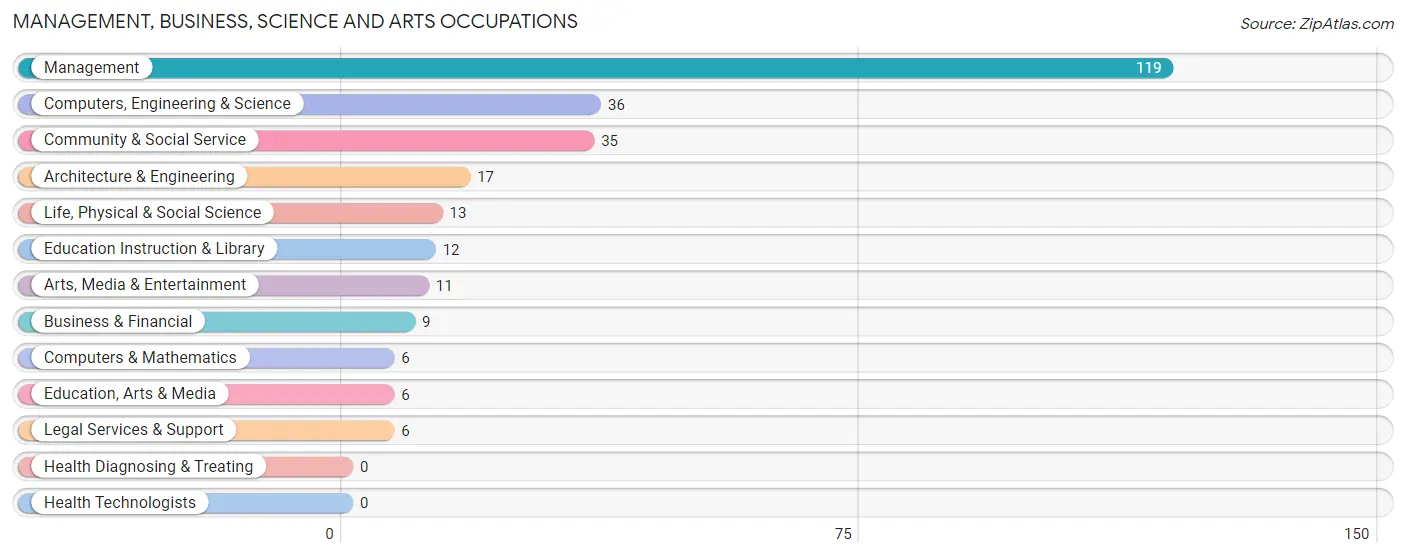
Management, Business, Science and Arts Occupations
The most common Management, Business, Science and Arts occupations in Discovery Harbour are Management (119 | 30.1%), Computers, Engineering & Science (36 | 9.1%), Community & Social Service (35 | 8.9%), Architecture & Engineering (17 | 4.3%), and Life, Physical & Social Science (13 | 3.3%).
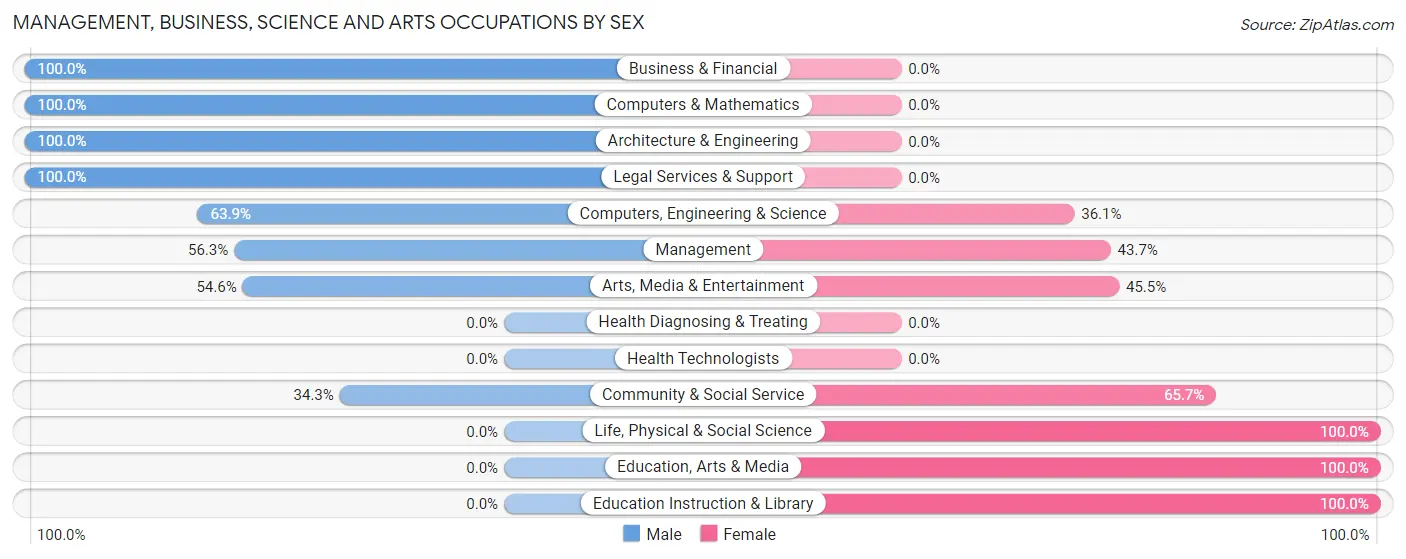
Management, Business, Science and Arts Occupations by Sex
Within the Management, Business, Science and Arts occupations in Discovery Harbour, the most male-oriented occupations are Business & Financial (100.0%), Computers & Mathematics (100.0%), and Architecture & Engineering (100.0%), while the most female-oriented occupations are Life, Physical & Social Science (100.0%), Education, Arts & Media (100.0%), and Education Instruction & Library (100.0%).
| Occupation | Male | Female |
| Management | 67 (56.3%) | 52 (43.7%) |
| Business & Financial | 9 (100.0%) | 0 (0.0%) |
| Computers, Engineering & Science | 23 (63.9%) | 13 (36.1%) |
| Computers & Mathematics | 6 (100.0%) | 0 (0.0%) |
| Architecture & Engineering | 17 (100.0%) | 0 (0.0%) |
| Life, Physical & Social Science | 0 (0.0%) | 13 (100.0%) |
| Community & Social Service | 12 (34.3%) | 23 (65.7%) |
| Education, Arts & Media | 0 (0.0%) | 6 (100.0%) |
| Legal Services & Support | 6 (100.0%) | 0 (0.0%) |
| Education Instruction & Library | 0 (0.0%) | 12 (100.0%) |
| Arts, Media & Entertainment | 6 (54.5%) | 5 (45.5%) |
| Health Diagnosing & Treating | 0 (0.0%) | 0 (0.0%) |
| Health Technologists | 0 (0.0%) | 0 (0.0%) |
| Total (Category) | 111 (55.8%) | 88 (44.2%) |
| Total (Overall) | 206 (52.1%) | 189 (47.8%) |
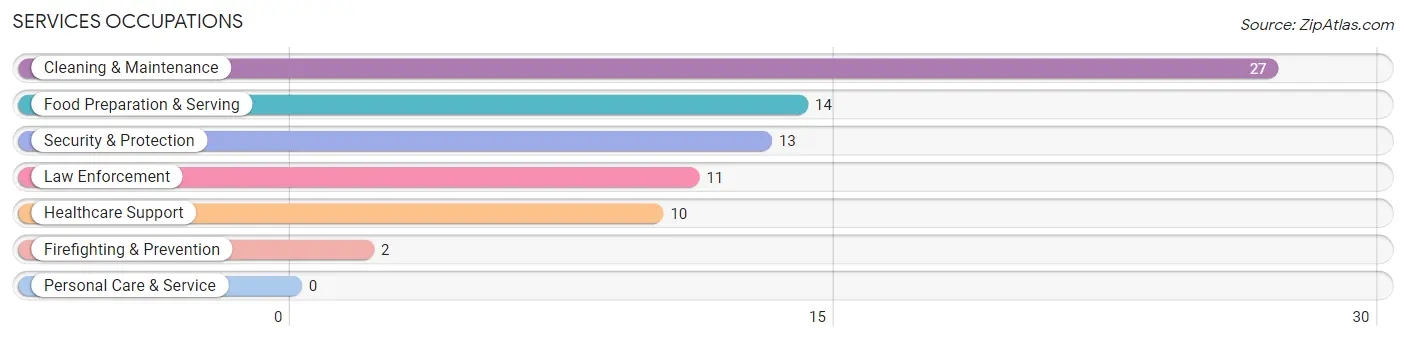
Services Occupations
The most common Services occupations in Discovery Harbour are Cleaning & Maintenance (27 | 6.8%), Food Preparation & Serving (14 | 3.5%), Security & Protection (13 | 3.3%), Law Enforcement (11 | 2.8%), and Healthcare Support (10 | 2.5%).
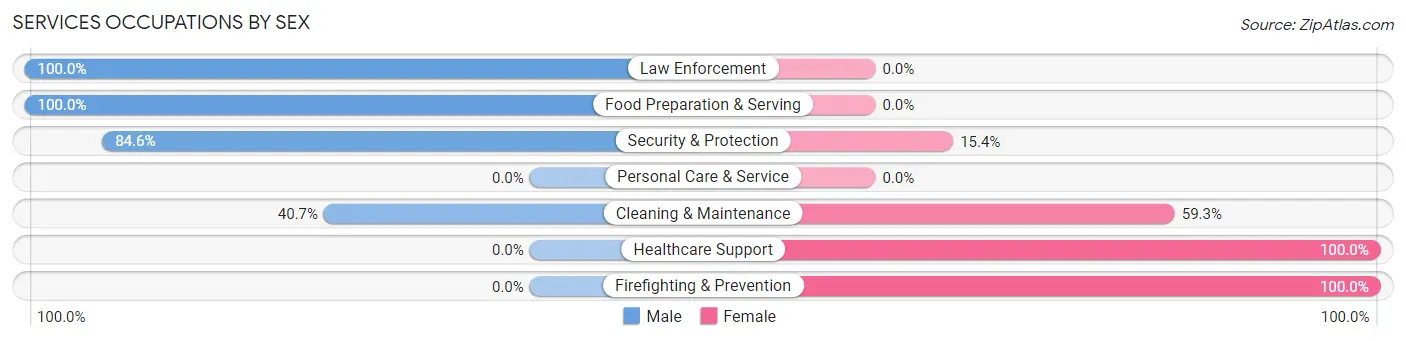
Services Occupations by Sex
Within the Services occupations in Discovery Harbour, the most male-oriented occupations are Law Enforcement (100.0%), Food Preparation & Serving (100.0%), and Security & Protection (84.6%), while the most female-oriented occupations are Healthcare Support (100.0%), Firefighting & Prevention (100.0%), and Cleaning & Maintenance (59.3%).
| Occupation | Male | Female |
| Healthcare Support | 0 (0.0%) | 10 (100.0%) |
| Security & Protection | 11 (84.6%) | 2 (15.4%) |
| Firefighting & Prevention | 0 (0.0%) | 2 (100.0%) |
| Law Enforcement | 11 (100.0%) | 0 (0.0%) |
| Food Preparation & Serving | 14 (100.0%) | 0 (0.0%) |
| Cleaning & Maintenance | 11 (40.7%) | 16 (59.3%) |
| Personal Care & Service | 0 (0.0%) | 0 (0.0%) |
| Total (Category) | 36 (56.2%) | 28 (43.8%) |
| Total (Overall) | 206 (52.1%) | 189 (47.8%) |
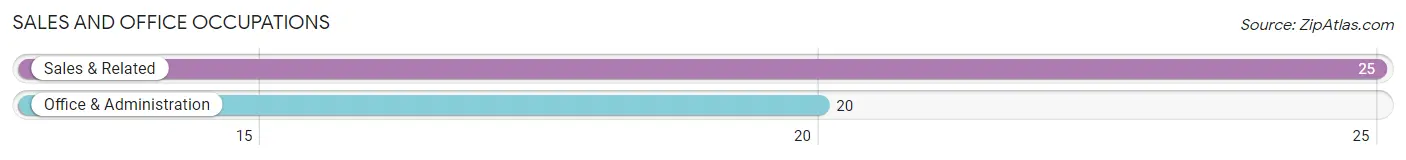
Sales and Office Occupations
The most common Sales and Office occupations in Discovery Harbour are Sales & Related (25 | 6.3%), and Office & Administration (20 | 5.1%).
Sales and Office Occupations by Sex
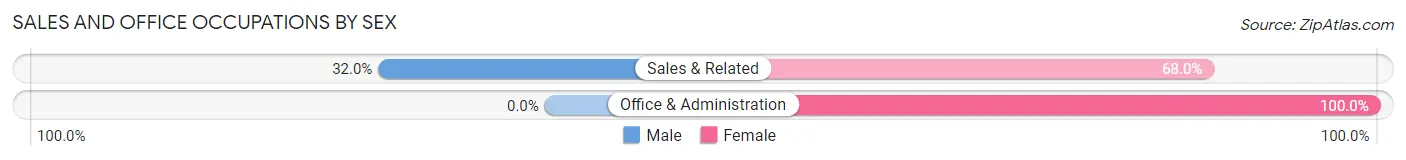
| Occupation | Male | Female |
| Sales & Related | 8 (32.0%) | 17 (68.0%) |
| Office & Administration | 0 (0.0%) | 20 (100.0%) |
| Total (Category) | 8 (17.8%) | 37 (82.2%) |
| Total (Overall) | 206 (52.1%) | 189 (47.8%) |
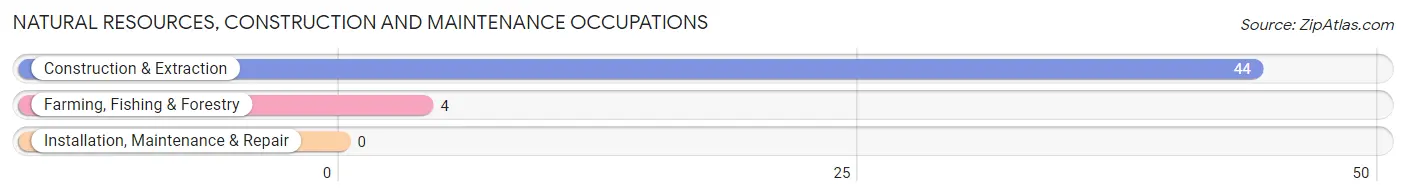
Natural Resources, Construction and Maintenance Occupations
The most common Natural Resources, Construction and Maintenance occupations in Discovery Harbour are Construction & Extraction (44 | 11.1%), and Farming, Fishing & Forestry (4 | 1.0%).
Natural Resources, Construction and Maintenance Occupations by Sex
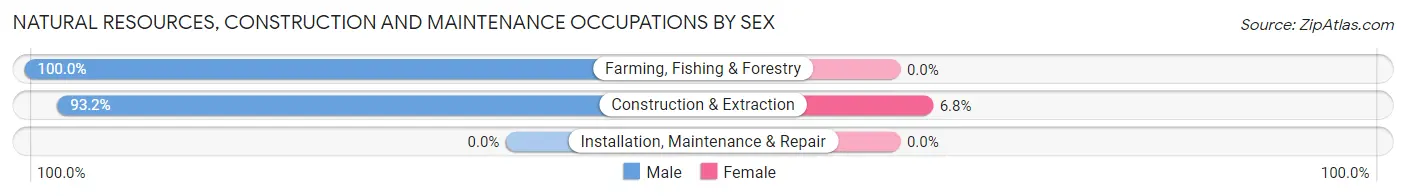
| Occupation | Male | Female |
| Farming, Fishing & Forestry | 4 (100.0%) | 0 (0.0%) |
| Construction & Extraction | 41 (93.2%) | 3 (6.8%) |
| Installation, Maintenance & Repair | 0 (0.0%) | 0 (0.0%) |
| Total (Category) | 45 (93.8%) | 3 (6.2%) |
| Total (Overall) | 206 (52.1%) | 189 (47.8%) |
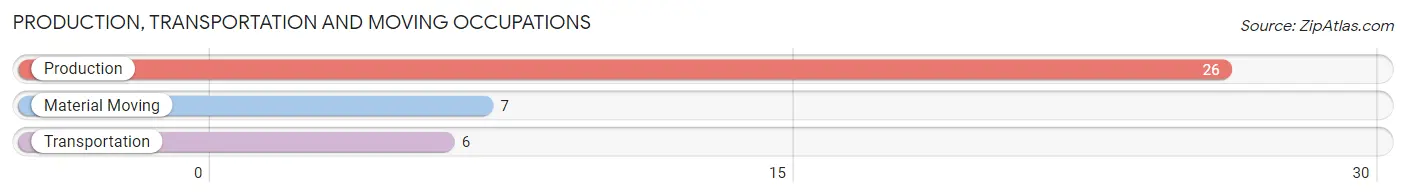
Production, Transportation and Moving Occupations
The most common Production, Transportation and Moving occupations in Discovery Harbour are Production (26 | 6.6%), Material Moving (7 | 1.8%), and Transportation (6 | 1.5%).
Production, Transportation and Moving Occupations by Sex
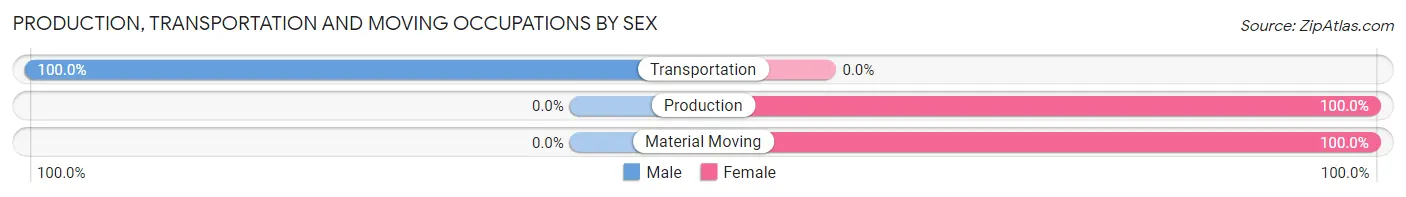
| Occupation | Male | Female |
| Production | 0 (0.0%) | 26 (100.0%) |
| Transportation | 6 (100.0%) | 0 (0.0%) |
| Material Moving | 0 (0.0%) | 7 (100.0%) |
| Total (Category) | 6 (15.4%) | 33 (84.6%) |
| Total (Overall) | 206 (52.1%) | 189 (47.8%) |
Employment Industries by Sex in Discovery Harbour
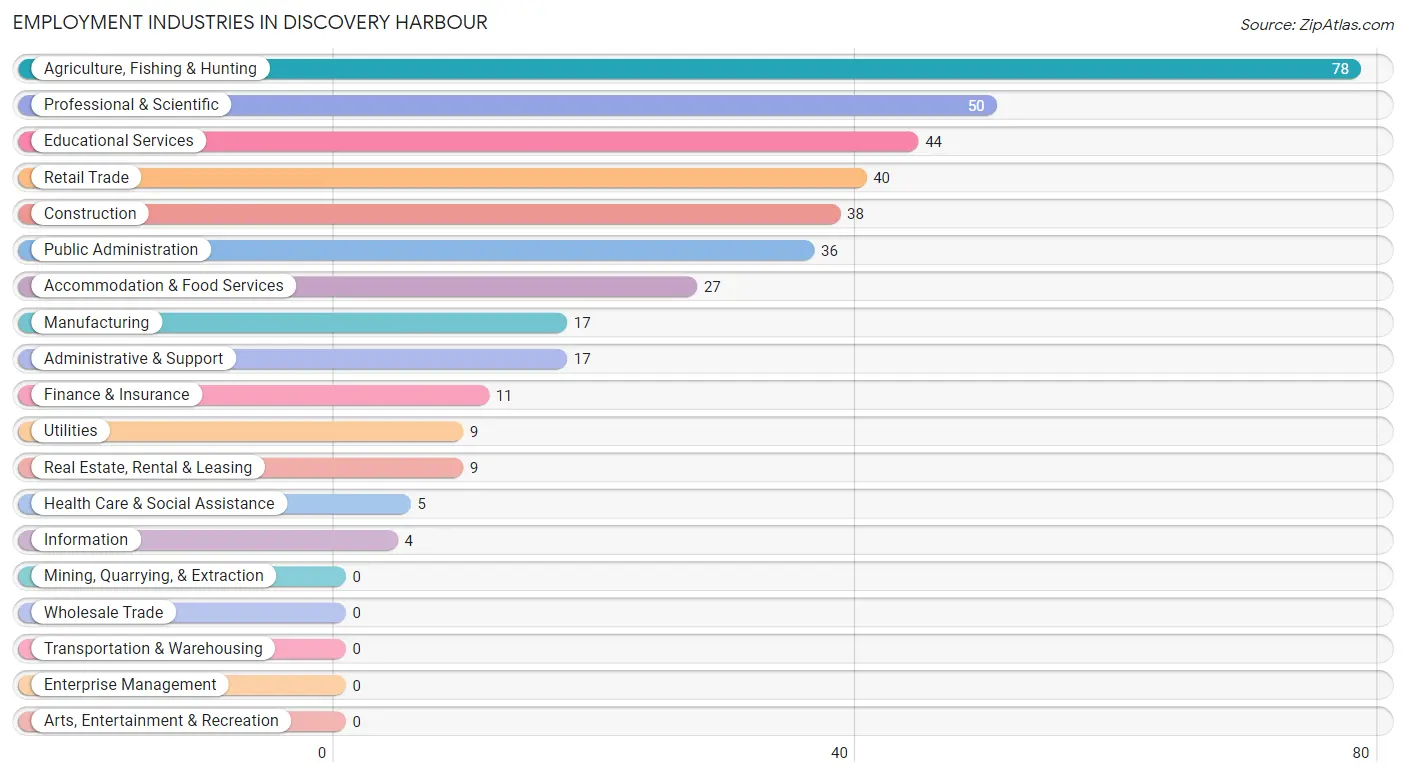
Employment Industries in Discovery Harbour
The major employment industries in Discovery Harbour include Agriculture, Fishing & Hunting (78 | 19.8%), Professional & Scientific (50 | 12.7%), Educational Services (44 | 11.1%), Retail Trade (40 | 10.1%), and Construction (38 | 9.6%).
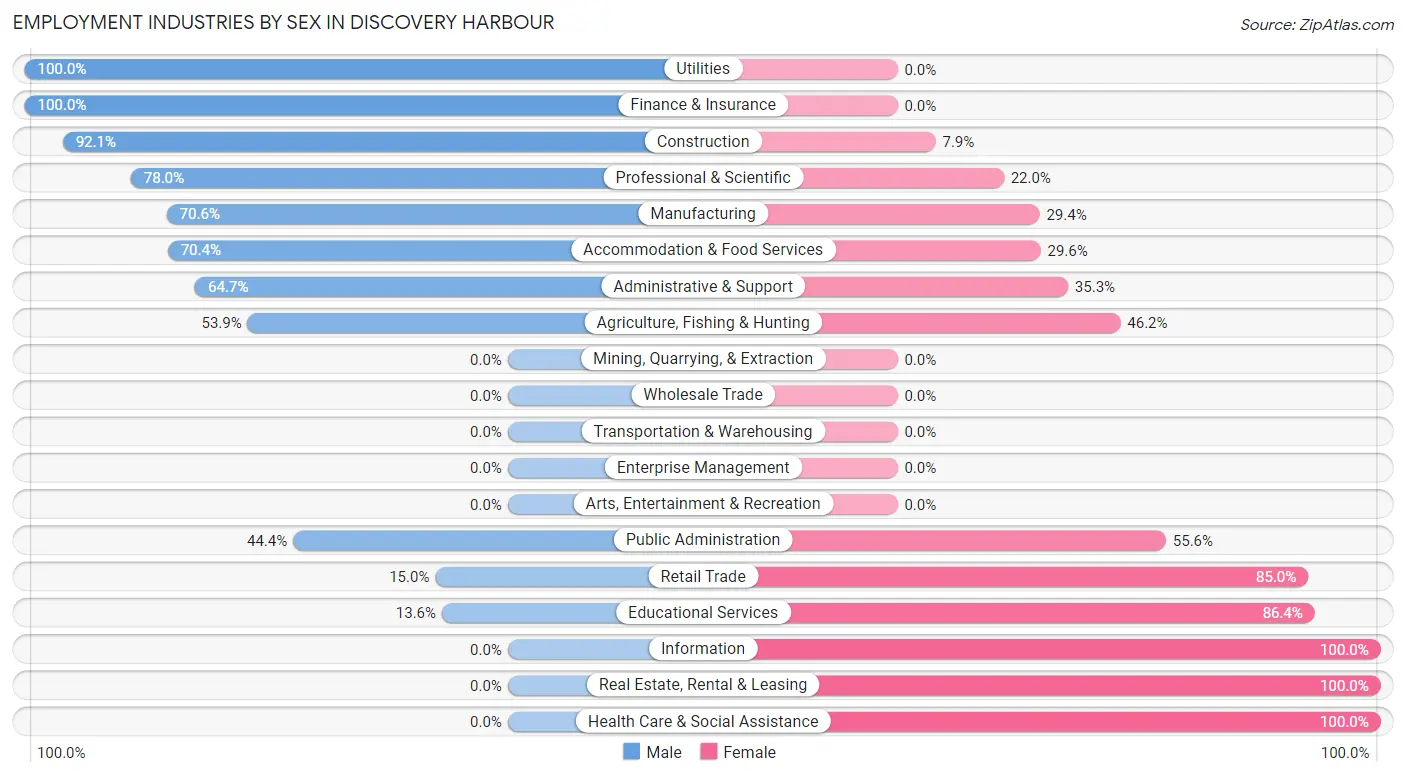
Employment Industries by Sex in Discovery Harbour
The Discovery Harbour industries that see more men than women are Utilities (100.0%), Finance & Insurance (100.0%), and Construction (92.1%), whereas the industries that tend to have a higher number of women are Information (100.0%), Real Estate, Rental & Leasing (100.0%), and Health Care & Social Assistance (100.0%).
| Industry | Male | Female |
| Agriculture, Fishing & Hunting | 42 (53.8%) | 36 (46.2%) |
| Mining, Quarrying, & Extraction | 0 (0.0%) | 0 (0.0%) |
| Construction | 35 (92.1%) | 3 (7.9%) |
| Manufacturing | 12 (70.6%) | 5 (29.4%) |
| Wholesale Trade | 0 (0.0%) | 0 (0.0%) |
| Retail Trade | 6 (15.0%) | 34 (85.0%) |
| Transportation & Warehousing | 0 (0.0%) | 0 (0.0%) |
| Utilities | 9 (100.0%) | 0 (0.0%) |
| Information | 0 (0.0%) | 4 (100.0%) |
| Finance & Insurance | 11 (100.0%) | 0 (0.0%) |
| Real Estate, Rental & Leasing | 0 (0.0%) | 9 (100.0%) |
| Professional & Scientific | 39 (78.0%) | 11 (22.0%) |
| Enterprise Management | 0 (0.0%) | 0 (0.0%) |
| Administrative & Support | 11 (64.7%) | 6 (35.3%) |
| Educational Services | 6 (13.6%) | 38 (86.4%) |
| Health Care & Social Assistance | 0 (0.0%) | 5 (100.0%) |
| Arts, Entertainment & Recreation | 0 (0.0%) | 0 (0.0%) |
| Accommodation & Food Services | 19 (70.4%) | 8 (29.6%) |
| Public Administration | 16 (44.4%) | 20 (55.6%) |
| Total | 206 (52.1%) | 189 (47.8%) |
Education in Discovery Harbour
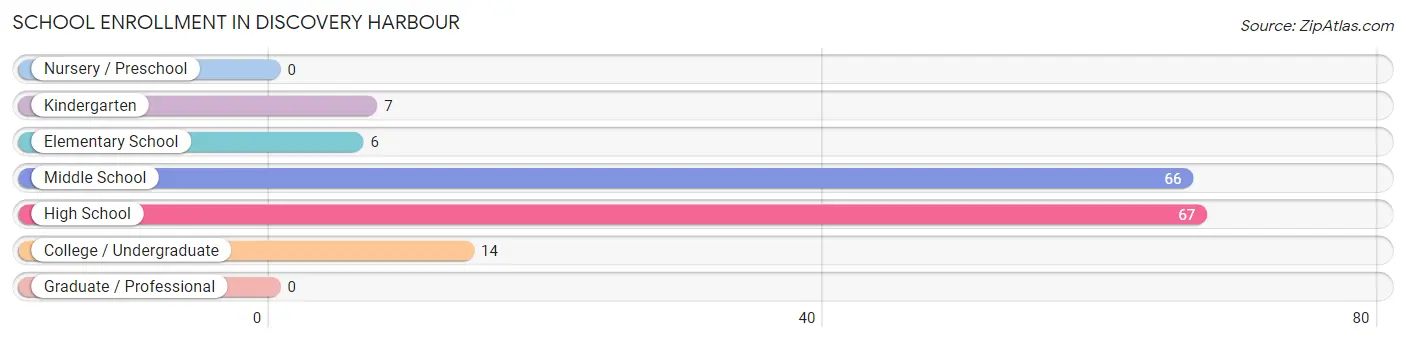
School Enrollment in Discovery Harbour
The most common levels of schooling among the 160 students in Discovery Harbour are high school (67 | 41.9%), middle school (66 | 41.2%), and college / undergraduate (14 | 8.7%).
| School Level | # Students | % Students |
| Nursery / Preschool | 0 | 0.0% |
| Kindergarten | 7 | 4.4% |
| Elementary School | 6 | 3.7% |
| Middle School | 66 | 41.2% |
| High School | 67 | 41.9% |
| College / Undergraduate | 14 | 8.7% |
| Graduate / Professional | 0 | 0.0% |
| Total | 160 | 100.0% |
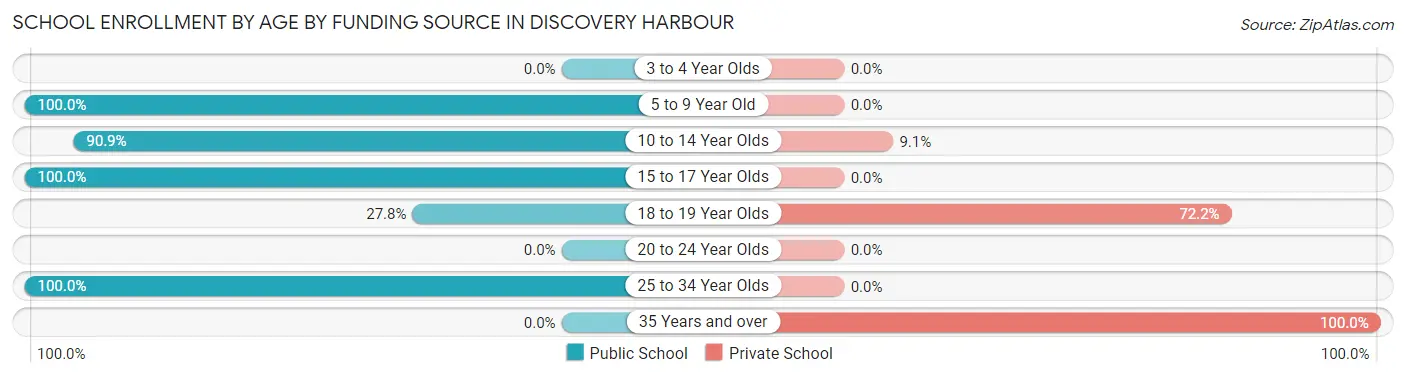
School Enrollment by Age by Funding Source in Discovery Harbour
Out of a total of 160 students who are enrolled in schools in Discovery Harbour, 25 (15.6%) attend a private institution, while the remaining 135 (84.4%) are enrolled in public schools. The age group of 35 years and over has the highest likelihood of being enrolled in private schools, with 5 (100.0% in the age bracket) enrolled. Conversely, the age group of 5 to 9 year old has the lowest likelihood of being enrolled in a private school, with 13 (100.0% in the age bracket) attending a public institution.
| Age Bracket | Public School | Private School |
| 3 to 4 Year Olds | 0 (0.0%) | 0 (0.0%) |
| 5 to 9 Year Old | 13 (100.0%) | 0 (0.0%) |
| 10 to 14 Year Olds | 70 (90.9%) | 7 (9.1%) |
| 15 to 17 Year Olds | 43 (100.0%) | 0 (0.0%) |
| 18 to 19 Year Olds | 5 (27.8%) | 13 (72.2%) |
| 20 to 24 Year Olds | 0 (0.0%) | 0 (0.0%) |
| 25 to 34 Year Olds | 4 (100.0%) | 0 (0.0%) |
| 35 Years and over | 0 (0.0%) | 5 (100.0%) |
| Total | 135 (84.4%) | 25 (15.6%) |
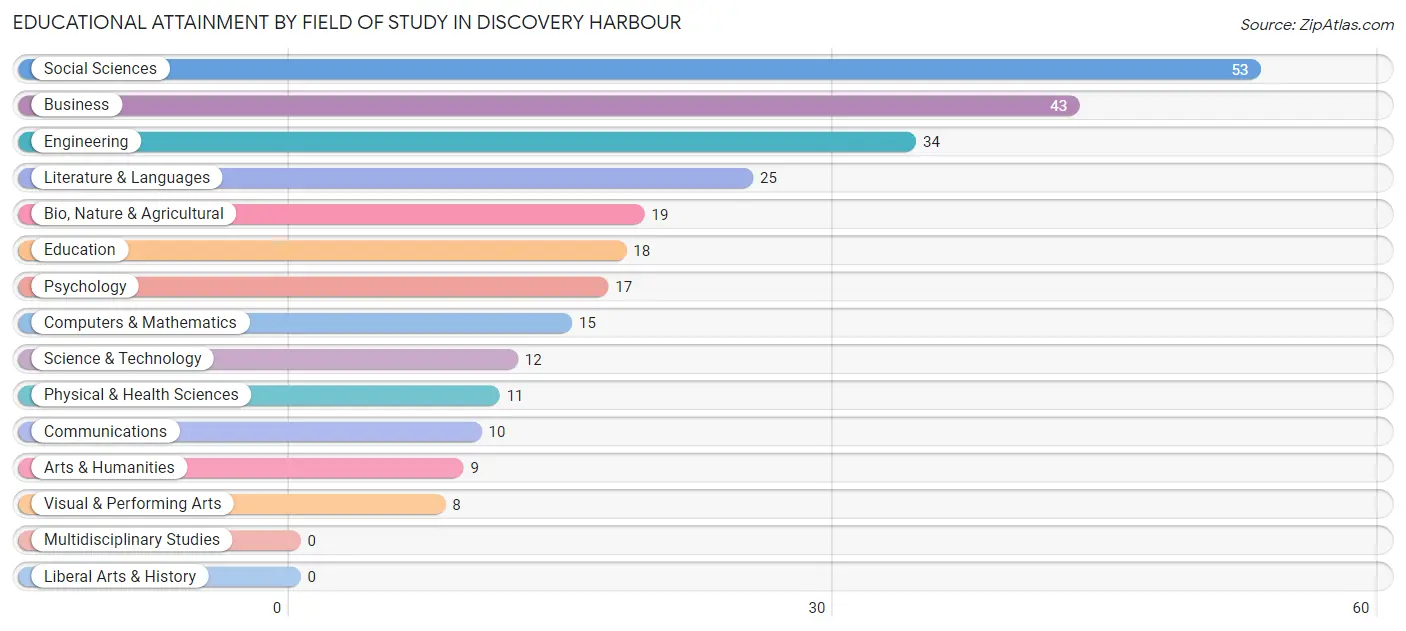
Educational Attainment by Field of Study in Discovery Harbour
Social sciences (53 | 19.3%), business (43 | 15.7%), engineering (34 | 12.4%), literature & languages (25 | 9.1%), and bio, nature & agricultural (19 | 6.9%) are the most common fields of study among 274 individuals in Discovery Harbour who have obtained a bachelor's degree or higher.
| Field of Study | # Graduates | % Graduates |
| Computers & Mathematics | 15 | 5.5% |
| Bio, Nature & Agricultural | 19 | 6.9% |
| Physical & Health Sciences | 11 | 4.0% |
| Psychology | 17 | 6.2% |
| Social Sciences | 53 | 19.3% |
| Engineering | 34 | 12.4% |
| Multidisciplinary Studies | 0 | 0.0% |
| Science & Technology | 12 | 4.4% |
| Business | 43 | 15.7% |
| Education | 18 | 6.6% |
| Literature & Languages | 25 | 9.1% |
| Liberal Arts & History | 0 | 0.0% |
| Visual & Performing Arts | 8 | 2.9% |
| Communications | 10 | 3.6% |
| Arts & Humanities | 9 | 3.3% |
| Total | 274 | 100.0% |
Transportation & Commute in Discovery Harbour
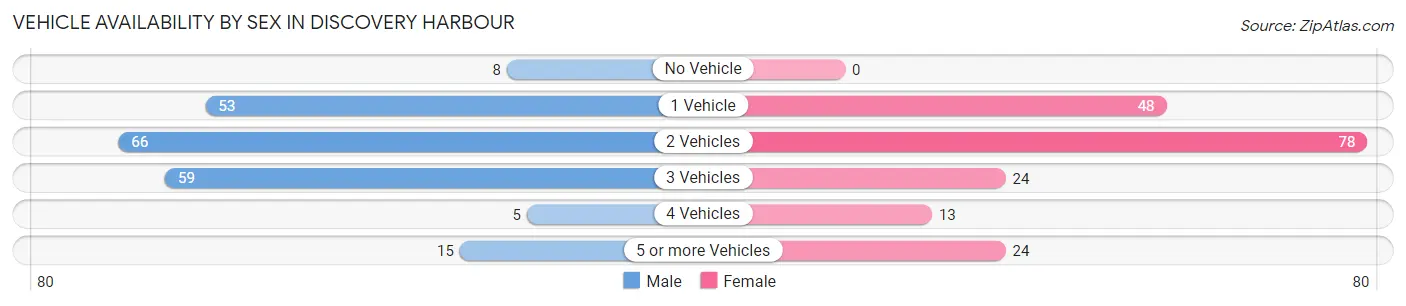
Vehicle Availability by Sex in Discovery Harbour
The most prevalent vehicle ownership categories in Discovery Harbour are males with 2 vehicles (66, accounting for 32.0%) and females with 2 vehicles (78, making up 35.3%).
| Vehicles Available | Male | Female |
| No Vehicle | 8 (3.9%) | 0 (0.0%) |
| 1 Vehicle | 53 (25.7%) | 48 (25.7%) |
| 2 Vehicles | 66 (32.0%) | 78 (41.7%) |
| 3 Vehicles | 59 (28.6%) | 24 (12.8%) |
| 4 Vehicles | 5 (2.4%) | 13 (7.0%) |
| 5 or more Vehicles | 15 (7.3%) | 24 (12.8%) |
| Total | 206 (100.0%) | 187 (100.0%) |
Commute Time in Discovery Harbour
The most frequently occuring commute durations in Discovery Harbour are 60 to 89 minutes (77 commuters, 22.8%), 90 or more minutes (77 commuters, 22.8%), and 40 to 44 minutes (53 commuters, 15.7%).
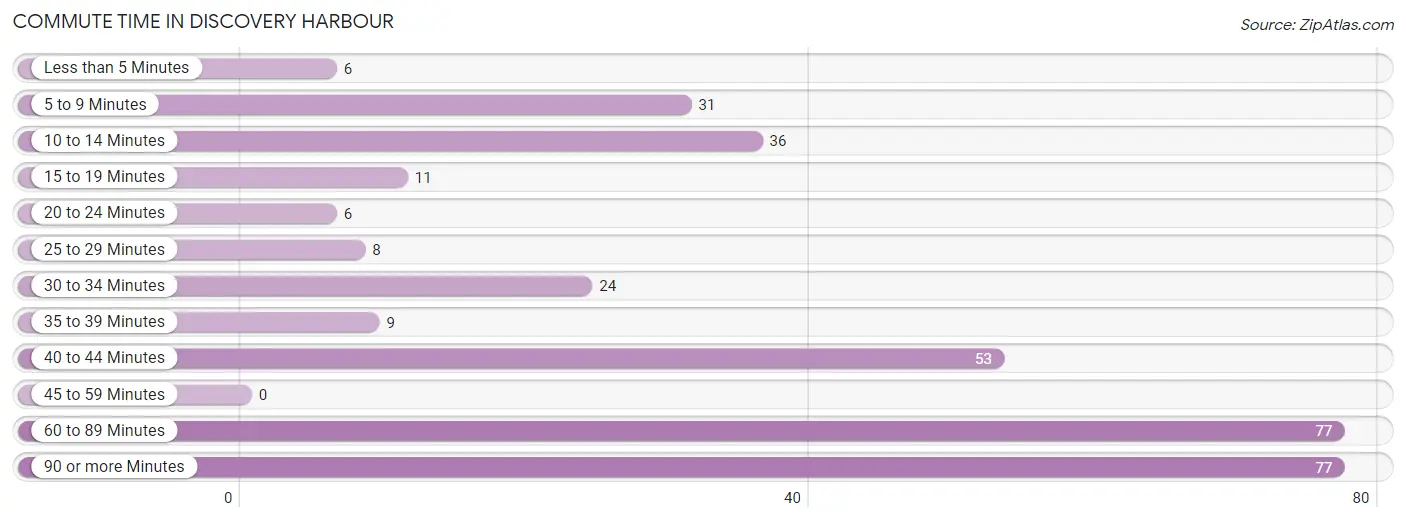
| Commute Time | # Commuters | % Commuters |
| Less than 5 Minutes | 6 | 1.8% |
| 5 to 9 Minutes | 31 | 9.2% |
| 10 to 14 Minutes | 36 | 10.6% |
| 15 to 19 Minutes | 11 | 3.3% |
| 20 to 24 Minutes | 6 | 1.8% |
| 25 to 29 Minutes | 8 | 2.4% |
| 30 to 34 Minutes | 24 | 7.1% |
| 35 to 39 Minutes | 9 | 2.7% |
| 40 to 44 Minutes | 53 | 15.7% |
| 45 to 59 Minutes | 0 | 0.0% |
| 60 to 89 Minutes | 77 | 22.8% |
| 90 or more Minutes | 77 | 22.8% |
Commute Time by Sex in Discovery Harbour
The most common commute times in Discovery Harbour are 90 or more minutes (77 commuters, 43.3%) for males and 60 to 89 minutes (58 commuters, 36.2%) for females.
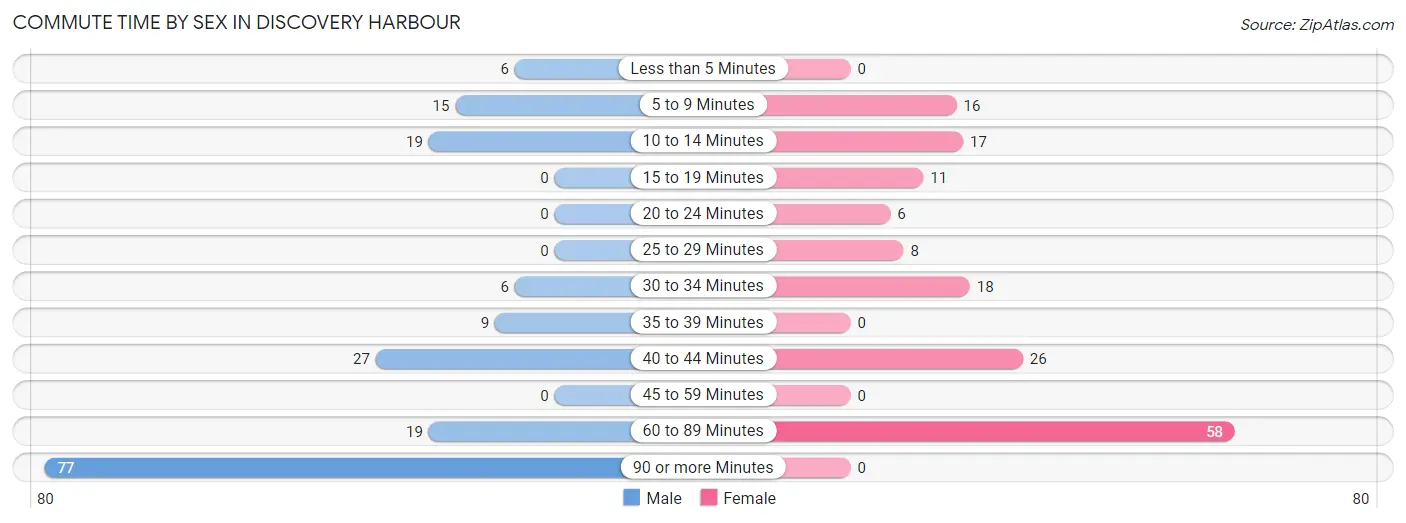
| Commute Time | Male | Female |
| Less than 5 Minutes | 6 (3.4%) | 0 (0.0%) |
| 5 to 9 Minutes | 15 (8.4%) | 16 (10.0%) |
| 10 to 14 Minutes | 19 (10.7%) | 17 (10.6%) |
| 15 to 19 Minutes | 0 (0.0%) | 11 (6.9%) |
| 20 to 24 Minutes | 0 (0.0%) | 6 (3.7%) |
| 25 to 29 Minutes | 0 (0.0%) | 8 (5.0%) |
| 30 to 34 Minutes | 6 (3.4%) | 18 (11.3%) |
| 35 to 39 Minutes | 9 (5.1%) | 0 (0.0%) |
| 40 to 44 Minutes | 27 (15.2%) | 26 (16.3%) |
| 45 to 59 Minutes | 0 (0.0%) | 0 (0.0%) |
| 60 to 89 Minutes | 19 (10.7%) | 58 (36.2%) |
| 90 or more Minutes | 77 (43.3%) | 0 (0.0%) |
Time of Departure to Work by Sex in Discovery Harbour
The most frequent times of departure to work in Discovery Harbour are 8:00 AM to 8:29 AM (51, 28.6%) for males and 8:00 AM to 8:29 AM (52, 32.5%) for females.
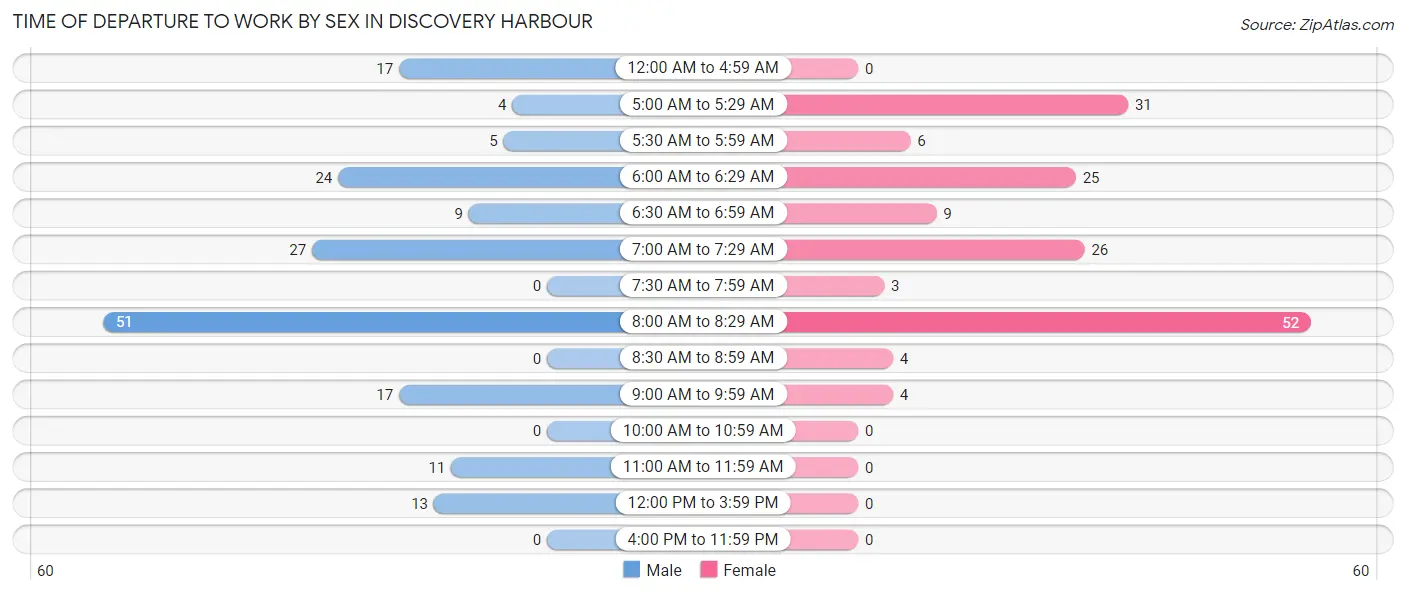
| Time of Departure | Male | Female |
| 12:00 AM to 4:59 AM | 17 (9.6%) | 0 (0.0%) |
| 5:00 AM to 5:29 AM | 4 (2.2%) | 31 (19.4%) |
| 5:30 AM to 5:59 AM | 5 (2.8%) | 6 (3.7%) |
| 6:00 AM to 6:29 AM | 24 (13.5%) | 25 (15.6%) |
| 6:30 AM to 6:59 AM | 9 (5.1%) | 9 (5.6%) |
| 7:00 AM to 7:29 AM | 27 (15.2%) | 26 (16.3%) |
| 7:30 AM to 7:59 AM | 0 (0.0%) | 3 (1.9%) |
| 8:00 AM to 8:29 AM | 51 (28.6%) | 52 (32.5%) |
| 8:30 AM to 8:59 AM | 0 (0.0%) | 4 (2.5%) |
| 9:00 AM to 9:59 AM | 17 (9.6%) | 4 (2.5%) |
| 10:00 AM to 10:59 AM | 0 (0.0%) | 0 (0.0%) |
| 11:00 AM to 11:59 AM | 11 (6.2%) | 0 (0.0%) |
| 12:00 PM to 3:59 PM | 13 (7.3%) | 0 (0.0%) |
| 4:00 PM to 11:59 PM | 0 (0.0%) | 0 (0.0%) |
| Total | 178 (100.0%) | 160 (100.0%) |
Housing Occupancy in Discovery Harbour
Occupancy by Ownership in Discovery Harbour
Of the total 526 dwellings in Discovery Harbour, owner-occupied units account for 418 (79.5%), while renter-occupied units make up 108 (20.5%).
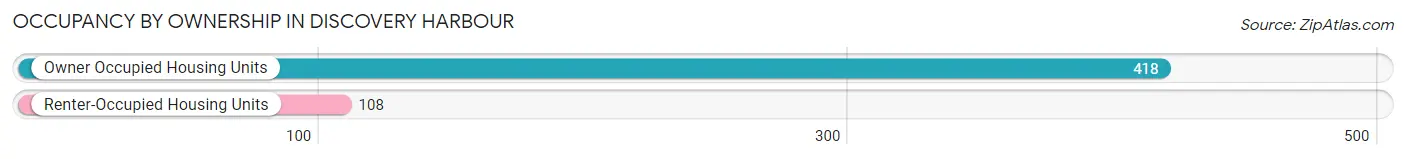
| Occupancy | # Housing Units | % Housing Units |
| Owner Occupied Housing Units | 418 | 79.5% |
| Renter-Occupied Housing Units | 108 | 20.5% |
| Total Occupied Housing Units | 526 | 100.0% |
Occupancy by Household Size in Discovery Harbour
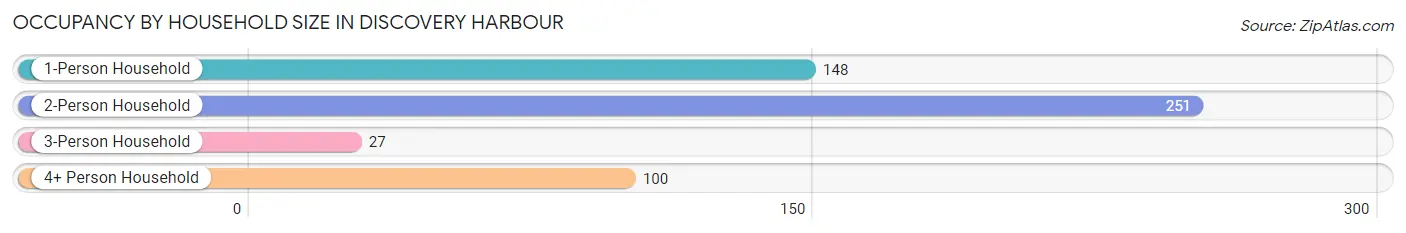
| Household Size | # Housing Units | % Housing Units |
| 1-Person Household | 148 | 28.1% |
| 2-Person Household | 251 | 47.7% |
| 3-Person Household | 27 | 5.1% |
| 4+ Person Household | 100 | 19.0% |
| Total Housing Units | 526 | 100.0% |
Occupancy by Ownership by Household Size in Discovery Harbour
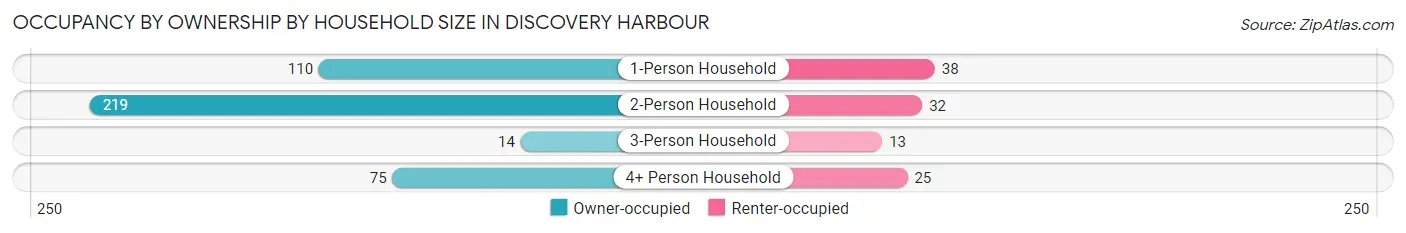
| Household Size | Owner-occupied | Renter-occupied |
| 1-Person Household | 110 (74.3%) | 38 (25.7%) |
| 2-Person Household | 219 (87.3%) | 32 (12.8%) |
| 3-Person Household | 14 (51.8%) | 13 (48.1%) |
| 4+ Person Household | 75 (75.0%) | 25 (25.0%) |
| Total Housing Units | 418 (79.5%) | 108 (20.5%) |
Occupancy by Educational Attainment in Discovery Harbour
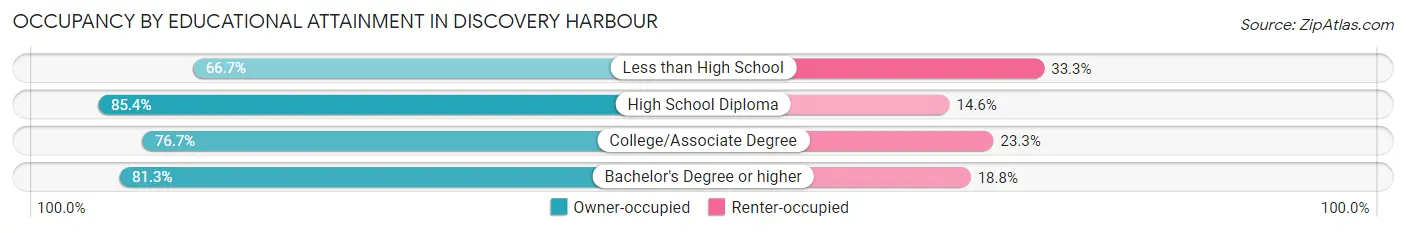
| Household Size | Owner-occupied | Renter-occupied |
| Less than High School | 12 (66.7%) | 6 (33.3%) |
| High School Diploma | 88 (85.4%) | 15 (14.6%) |
| College/Associate Degree | 188 (76.7%) | 57 (23.3%) |
| Bachelor's Degree or higher | 130 (81.2%) | 30 (18.8%) |
Occupancy by Age of Householder in Discovery Harbour
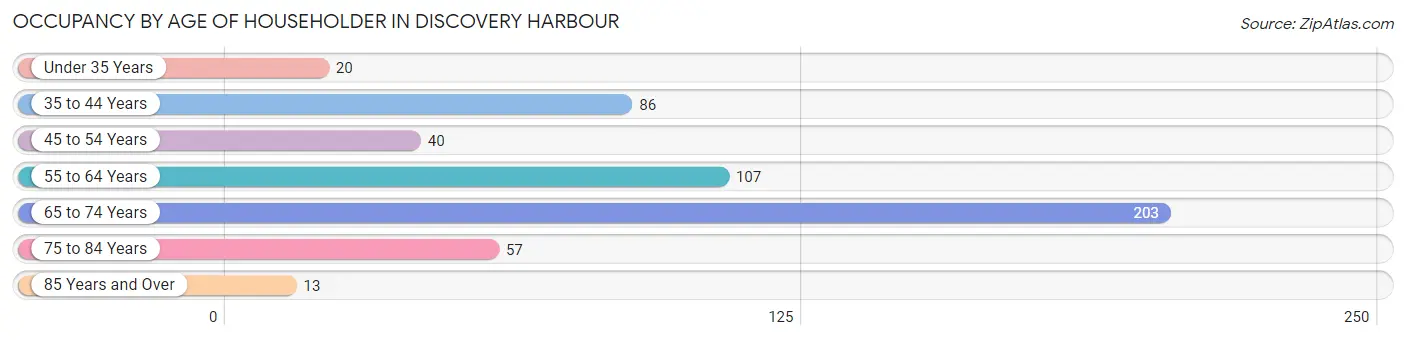
| Age Bracket | # Households | % Households |
| Under 35 Years | 20 | 3.8% |
| 35 to 44 Years | 86 | 16.4% |
| 45 to 54 Years | 40 | 7.6% |
| 55 to 64 Years | 107 | 20.3% |
| 65 to 74 Years | 203 | 38.6% |
| 75 to 84 Years | 57 | 10.8% |
| 85 Years and Over | 13 | 2.5% |
| Total | 526 | 100.0% |
Housing Finances in Discovery Harbour
Median Income by Occupancy in Discovery Harbour
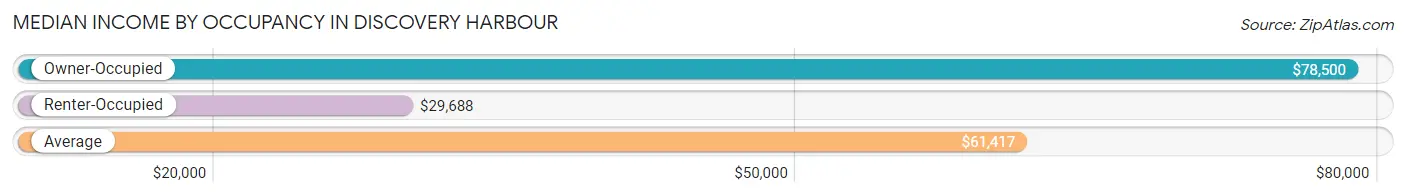
| Occupancy Type | # Households | Median Income |
| Owner-Occupied | 418 (79.5%) | $78,500 |
| Renter-Occupied | 108 (20.5%) | $29,688 |
| Average | 526 (100.0%) | $61,417 |
Occupancy by Householder Income Bracket in Discovery Harbour
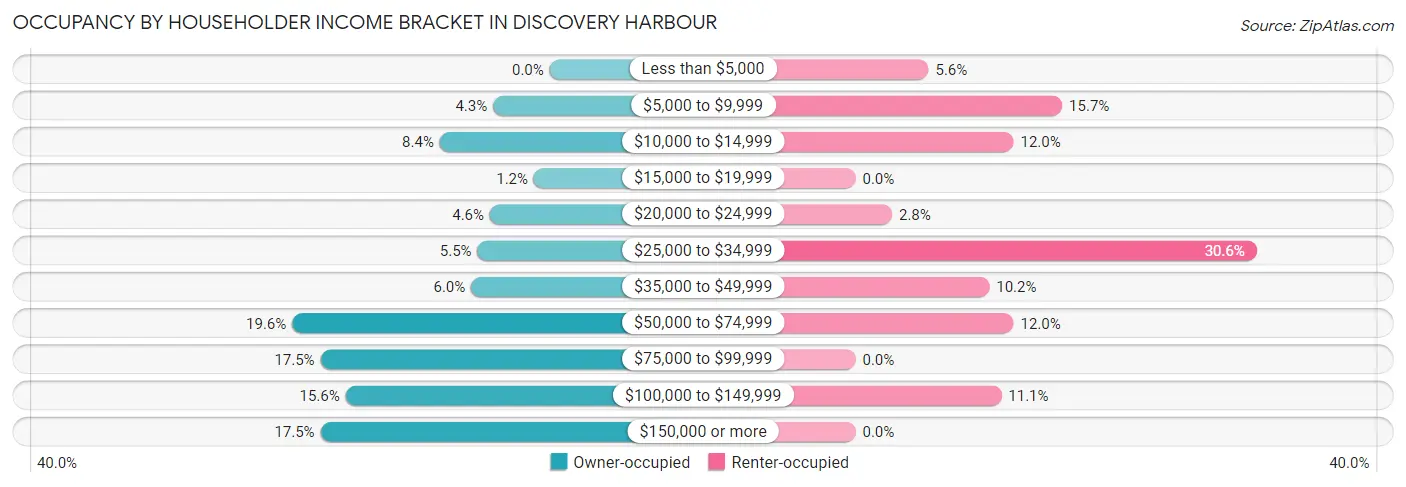
| Income Bracket | Owner-occupied | Renter-occupied |
| Less than $5,000 | 0 (0.0%) | 6 (5.6%) |
| $5,000 to $9,999 | 18 (4.3%) | 17 (15.7%) |
| $10,000 to $14,999 | 35 (8.4%) | 13 (12.0%) |
| $15,000 to $19,999 | 5 (1.2%) | 0 (0.0%) |
| $20,000 to $24,999 | 19 (4.5%) | 3 (2.8%) |
| $25,000 to $34,999 | 23 (5.5%) | 33 (30.6%) |
| $35,000 to $49,999 | 25 (6.0%) | 11 (10.2%) |
| $50,000 to $74,999 | 82 (19.6%) | 13 (12.0%) |
| $75,000 to $99,999 | 73 (17.5%) | 0 (0.0%) |
| $100,000 to $149,999 | 65 (15.5%) | 12 (11.1%) |
| $150,000 or more | 73 (17.5%) | 0 (0.0%) |
| Total | 418 (100.0%) | 108 (100.0%) |
Monthly Housing Cost Tiers in Discovery Harbour
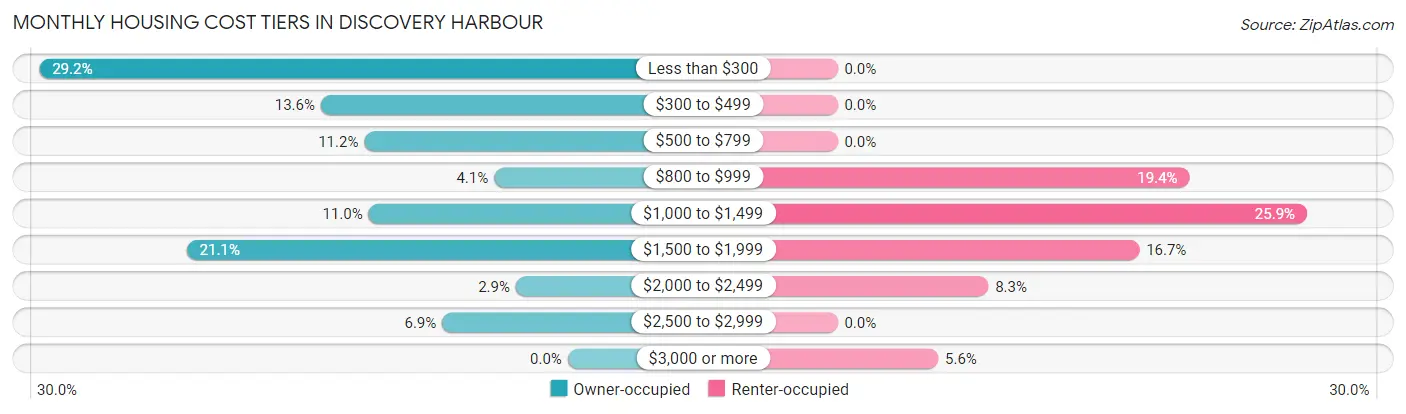
| Monthly Cost | Owner-occupied | Renter-occupied |
| Less than $300 | 122 (29.2%) | 0 (0.0%) |
| $300 to $499 | 57 (13.6%) | 0 (0.0%) |
| $500 to $799 | 47 (11.2%) | 0 (0.0%) |
| $800 to $999 | 17 (4.1%) | 21 (19.4%) |
| $1,000 to $1,499 | 46 (11.0%) | 28 (25.9%) |
| $1,500 to $1,999 | 88 (21.0%) | 18 (16.7%) |
| $2,000 to $2,499 | 12 (2.9%) | 9 (8.3%) |
| $2,500 to $2,999 | 29 (6.9%) | 0 (0.0%) |
| $3,000 or more | 0 (0.0%) | 6 (5.6%) |
| Total | 418 (100.0%) | 108 (100.0%) |
Physical Housing Characteristics in Discovery Harbour
Housing Structures in Discovery Harbour
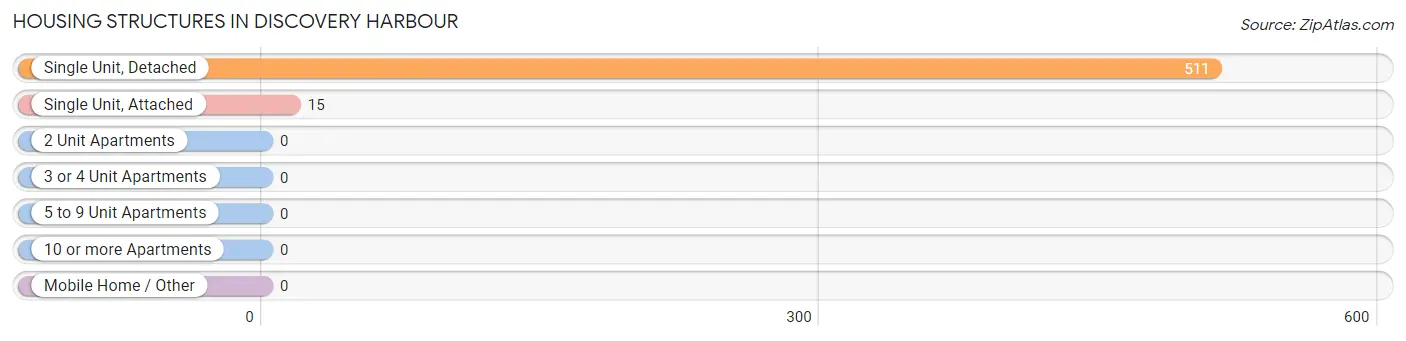
| Structure Type | # Housing Units | % Housing Units |
| Single Unit, Detached | 511 | 97.2% |
| Single Unit, Attached | 15 | 2.9% |
| 2 Unit Apartments | 0 | 0.0% |
| 3 or 4 Unit Apartments | 0 | 0.0% |
| 5 to 9 Unit Apartments | 0 | 0.0% |
| 10 or more Apartments | 0 | 0.0% |
| Mobile Home / Other | 0 | 0.0% |
| Total | 526 | 100.0% |
Housing Structures by Occupancy in Discovery Harbour
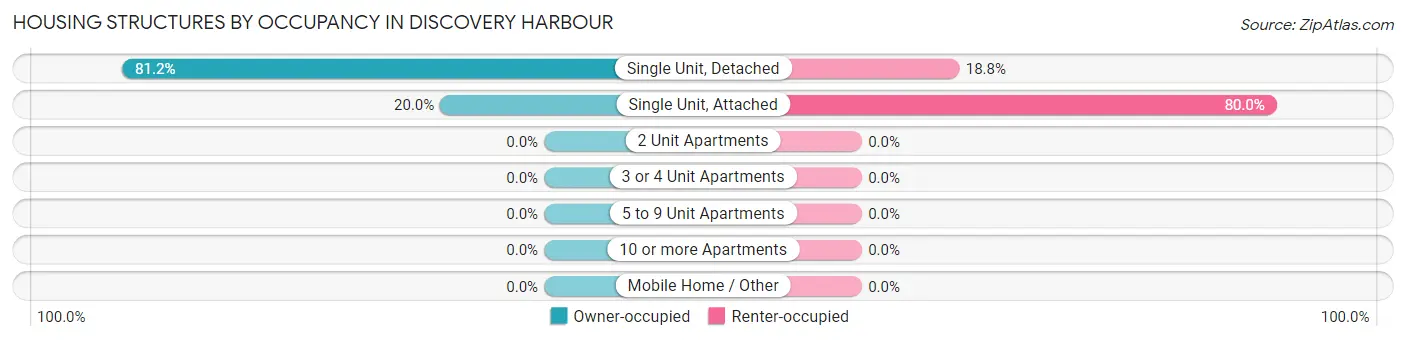
| Structure Type | Owner-occupied | Renter-occupied |
| Single Unit, Detached | 415 (81.2%) | 96 (18.8%) |
| Single Unit, Attached | 3 (20.0%) | 12 (80.0%) |
| 2 Unit Apartments | 0 (0.0%) | 0 (0.0%) |
| 3 or 4 Unit Apartments | 0 (0.0%) | 0 (0.0%) |
| 5 to 9 Unit Apartments | 0 (0.0%) | 0 (0.0%) |
| 10 or more Apartments | 0 (0.0%) | 0 (0.0%) |
| Mobile Home / Other | 0 (0.0%) | 0 (0.0%) |
| Total | 418 (79.5%) | 108 (20.5%) |
Housing Structures by Number of Rooms in Discovery Harbour
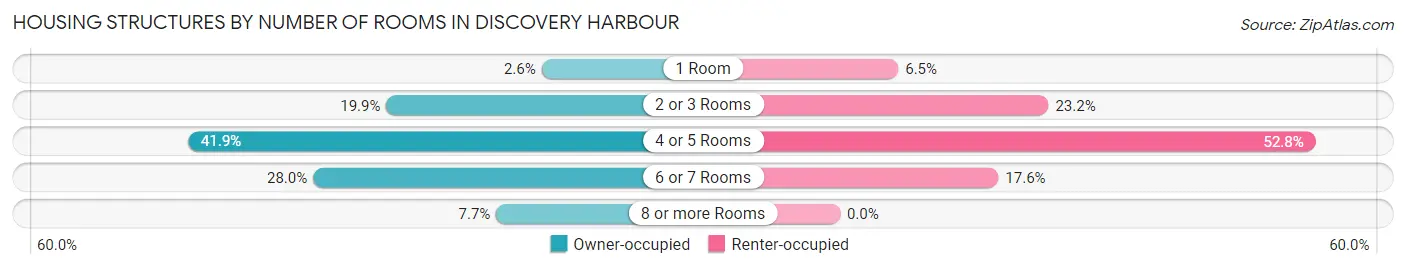
| Number of Rooms | Owner-occupied | Renter-occupied |
| 1 Room | 11 (2.6%) | 7 (6.5%) |
| 2 or 3 Rooms | 83 (19.9%) | 25 (23.2%) |
| 4 or 5 Rooms | 175 (41.9%) | 57 (52.8%) |
| 6 or 7 Rooms | 117 (28.0%) | 19 (17.6%) |
| 8 or more Rooms | 32 (7.7%) | 0 (0.0%) |
| Total | 418 (100.0%) | 108 (100.0%) |
Housing Structure by Heating Type in Discovery Harbour
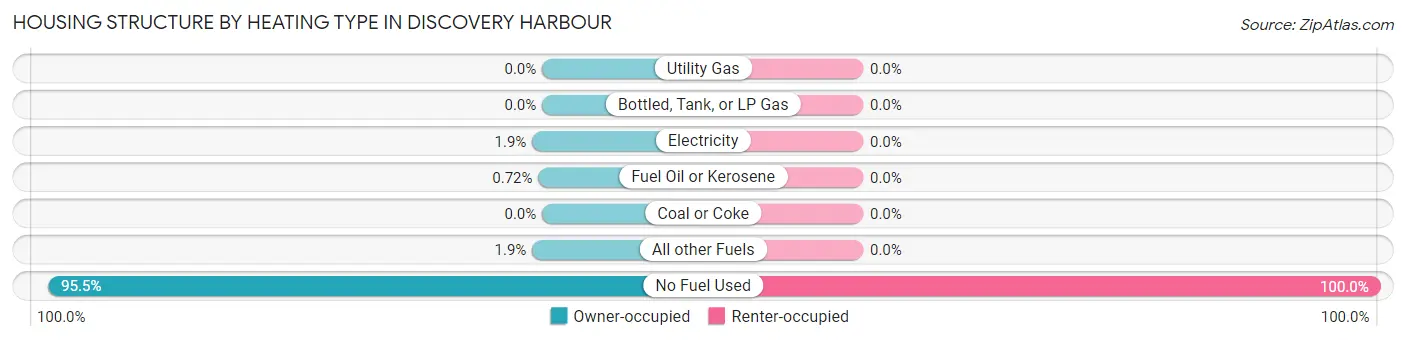
| Heating Type | Owner-occupied | Renter-occupied |
| Utility Gas | 0 (0.0%) | 0 (0.0%) |
| Bottled, Tank, or LP Gas | 0 (0.0%) | 0 (0.0%) |
| Electricity | 8 (1.9%) | 0 (0.0%) |
| Fuel Oil or Kerosene | 3 (0.7%) | 0 (0.0%) |
| Coal or Coke | 0 (0.0%) | 0 (0.0%) |
| All other Fuels | 8 (1.9%) | 0 (0.0%) |
| No Fuel Used | 399 (95.5%) | 108 (100.0%) |
| Total | 418 (100.0%) | 108 (100.0%) |
Household Vehicle Usage in Discovery Harbour
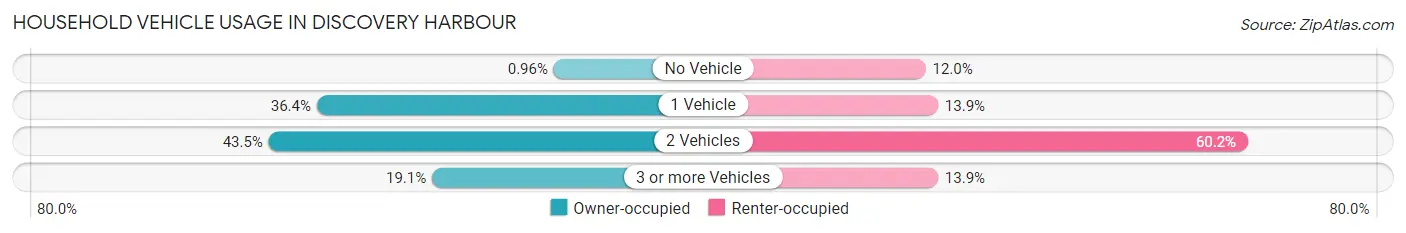
| Vehicles per Household | Owner-occupied | Renter-occupied |
| No Vehicle | 4 (1.0%) | 13 (12.0%) |
| 1 Vehicle | 152 (36.4%) | 15 (13.9%) |
| 2 Vehicles | 182 (43.5%) | 65 (60.2%) |
| 3 or more Vehicles | 80 (19.1%) | 15 (13.9%) |
| Total | 418 (100.0%) | 108 (100.0%) |
Real Estate & Mortgages in Discovery Harbour
Real Estate and Mortgage Overview in Discovery Harbour
| Characteristic | Without Mortgage | With Mortgage |
| Housing Units | 227 | 191 |
| Median Property Value | $368,200 | $460,200 |
| Median Household Income | $59,583 | $41 |
| Monthly Housing Costs | $292 | $0 |
| Real Estate Taxes | $707 | $5 |
Property Value by Mortgage Status in Discovery Harbour
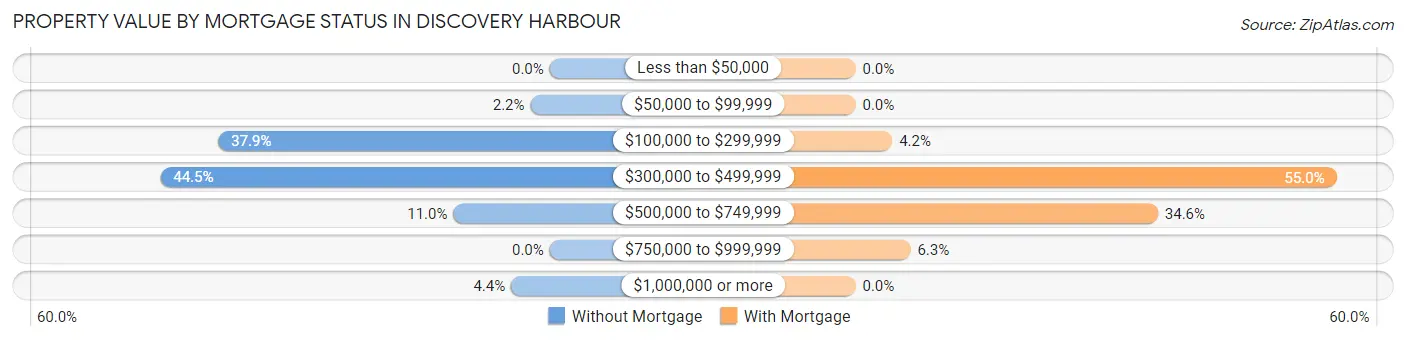
| Property Value | Without Mortgage | With Mortgage |
| Less than $50,000 | 0 (0.0%) | 0 (0.0%) |
| $50,000 to $99,999 | 5 (2.2%) | 0 (0.0%) |
| $100,000 to $299,999 | 86 (37.9%) | 8 (4.2%) |
| $300,000 to $499,999 | 101 (44.5%) | 105 (55.0%) |
| $500,000 to $749,999 | 25 (11.0%) | 66 (34.5%) |
| $750,000 to $999,999 | 0 (0.0%) | 12 (6.3%) |
| $1,000,000 or more | 10 (4.4%) | 0 (0.0%) |
| Total | 227 (100.0%) | 191 (100.0%) |
Household Income by Mortgage Status in Discovery Harbour
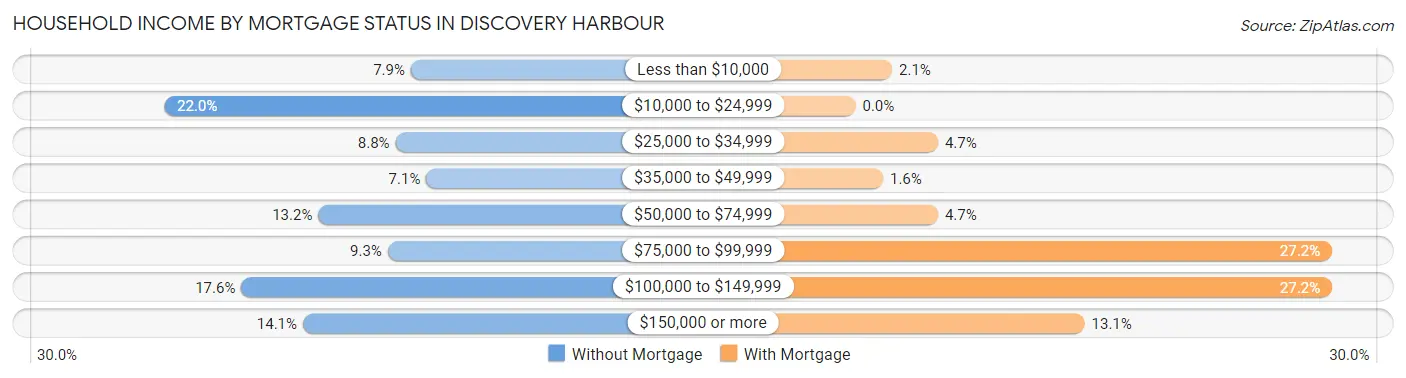
| Household Income | Without Mortgage | With Mortgage |
| Less than $10,000 | 18 (7.9%) | 4 (2.1%) |
| $10,000 to $24,999 | 50 (22.0%) | 0 (0.0%) |
| $25,000 to $34,999 | 20 (8.8%) | 9 (4.7%) |
| $35,000 to $49,999 | 16 (7.0%) | 3 (1.6%) |
| $50,000 to $74,999 | 30 (13.2%) | 9 (4.7%) |
| $75,000 to $99,999 | 21 (9.2%) | 52 (27.2%) |
| $100,000 to $149,999 | 40 (17.6%) | 52 (27.2%) |
| $150,000 or more | 32 (14.1%) | 25 (13.1%) |
| Total | 227 (100.0%) | 191 (100.0%) |
Property Value to Household Income Ratio in Discovery Harbour
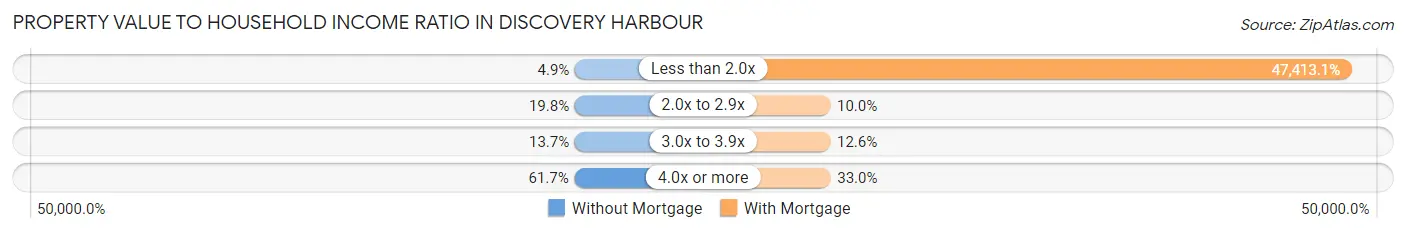
| Value-to-Income Ratio | Without Mortgage | With Mortgage |
| Less than 2.0x | 11 (4.9%) | 90,559 (47,413.1%) |
| 2.0x to 2.9x | 45 (19.8%) | 19 (10.0%) |
| 3.0x to 3.9x | 31 (13.7%) | 24 (12.6%) |
| 4.0x or more | 140 (61.7%) | 63 (33.0%) |
| Total | 227 (100.0%) | 191 (100.0%) |
Real Estate Taxes by Mortgage Status in Discovery Harbour
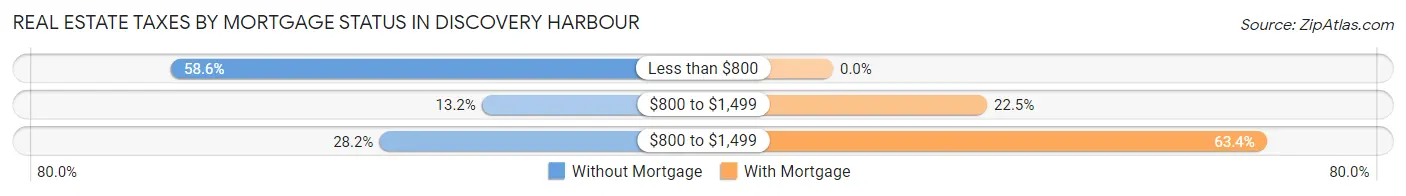
| Property Taxes | Without Mortgage | With Mortgage |
| Less than $800 | 133 (58.6%) | 0 (0.0%) |
| $800 to $1,499 | 30 (13.2%) | 43 (22.5%) |
| $800 to $1,499 | 64 (28.2%) | 121 (63.3%) |
| Total | 227 (100.0%) | 191 (100.0%) |
Health & Disability in Discovery Harbour
Health Insurance Coverage by Age in Discovery Harbour
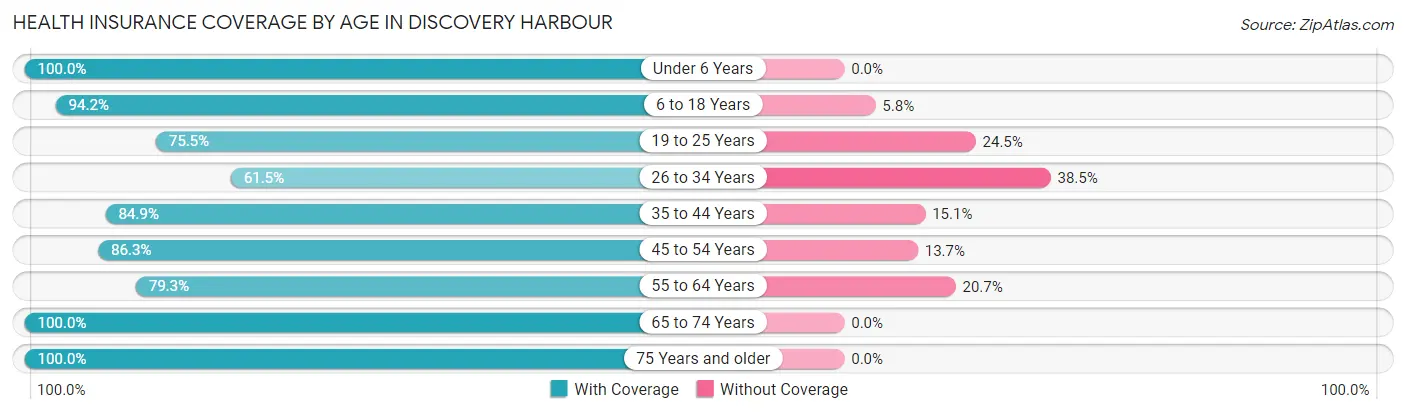
| Age Bracket | With Coverage | Without Coverage |
| Under 6 Years | 66 (100.0%) | 0 (0.0%) |
| 6 to 18 Years | 130 (94.2%) | 8 (5.8%) |
| 19 to 25 Years | 74 (75.5%) | 24 (24.5%) |
| 26 to 34 Years | 40 (61.5%) | 25 (38.5%) |
| 35 to 44 Years | 135 (84.9%) | 24 (15.1%) |
| 45 to 54 Years | 63 (86.3%) | 10 (13.7%) |
| 55 to 64 Years | 172 (79.3%) | 45 (20.7%) |
| 65 to 74 Years | 279 (100.0%) | 0 (0.0%) |
| 75 Years and older | 146 (100.0%) | 0 (0.0%) |
| Total | 1,105 (89.0%) | 136 (11.0%) |
Health Insurance Coverage by Citizenship Status in Discovery Harbour
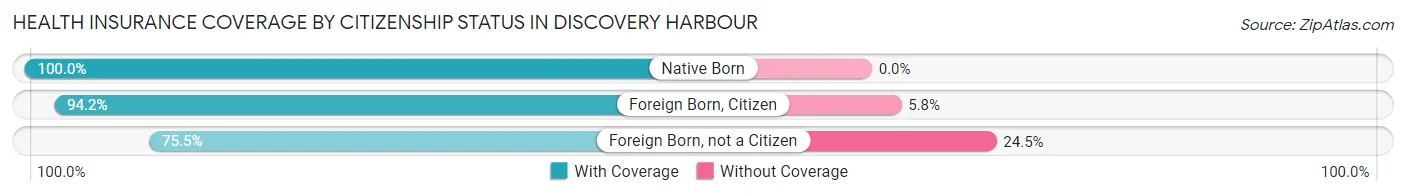
| Citizenship Status | With Coverage | Without Coverage |
| Native Born | 66 (100.0%) | 0 (0.0%) |
| Foreign Born, Citizen | 130 (94.2%) | 8 (5.8%) |
| Foreign Born, not a Citizen | 74 (75.5%) | 24 (24.5%) |
Health Insurance Coverage by Household Income in Discovery Harbour
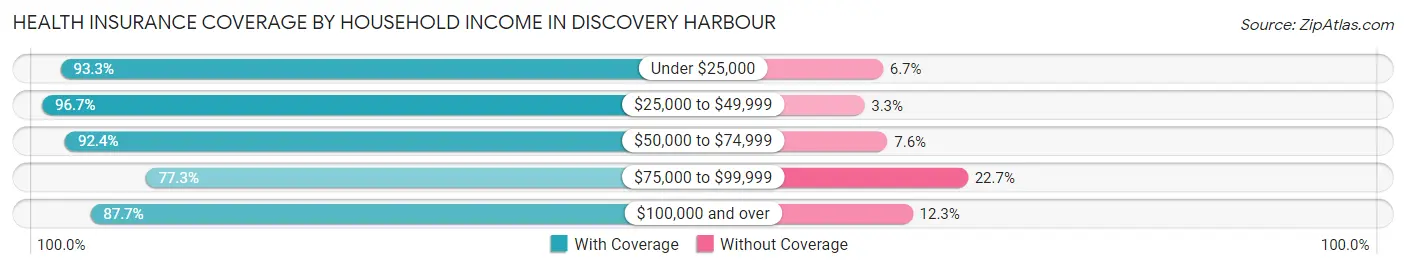
| Household Income | With Coverage | Without Coverage |
| Under $25,000 | 180 (93.3%) | 13 (6.7%) |
| $25,000 to $49,999 | 177 (96.7%) | 6 (3.3%) |
| $50,000 to $74,999 | 207 (92.4%) | 17 (7.6%) |
| $75,000 to $99,999 | 157 (77.3%) | 46 (22.7%) |
| $100,000 and over | 384 (87.7%) | 54 (12.3%) |
Public vs Private Health Insurance Coverage by Age in Discovery Harbour
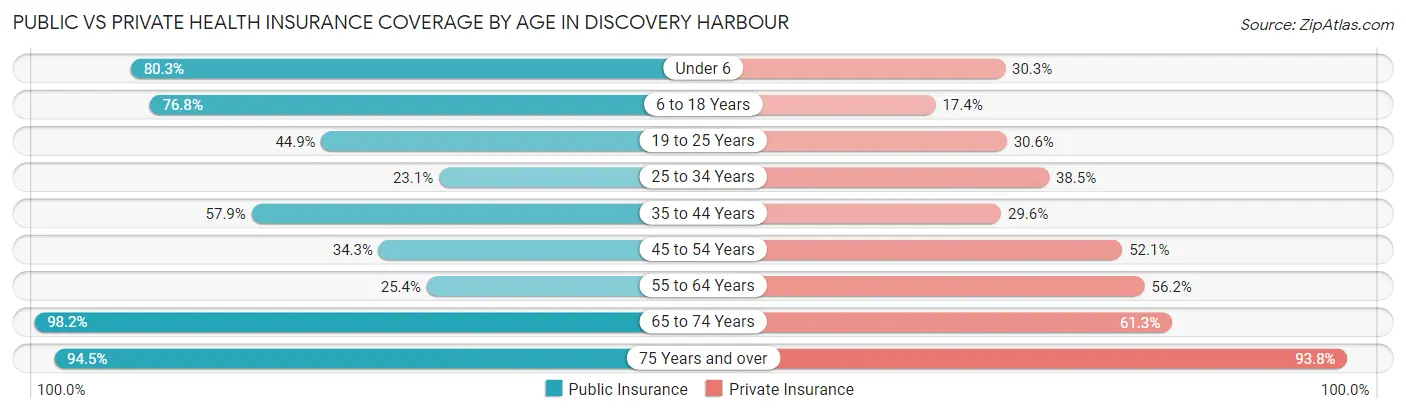
| Age Bracket | Public Insurance | Private Insurance |
| Under 6 | 53 (80.3%) | 20 (30.3%) |
| 6 to 18 Years | 106 (76.8%) | 24 (17.4%) |
| 19 to 25 Years | 44 (44.9%) | 30 (30.6%) |
| 25 to 34 Years | 15 (23.1%) | 25 (38.5%) |
| 35 to 44 Years | 92 (57.9%) | 47 (29.6%) |
| 45 to 54 Years | 25 (34.3%) | 38 (52.0%) |
| 55 to 64 Years | 55 (25.4%) | 122 (56.2%) |
| 65 to 74 Years | 274 (98.2%) | 171 (61.3%) |
| 75 Years and over | 138 (94.5%) | 137 (93.8%) |
| Total | 802 (64.6%) | 614 (49.5%) |
Disability Status by Sex by Age in Discovery Harbour
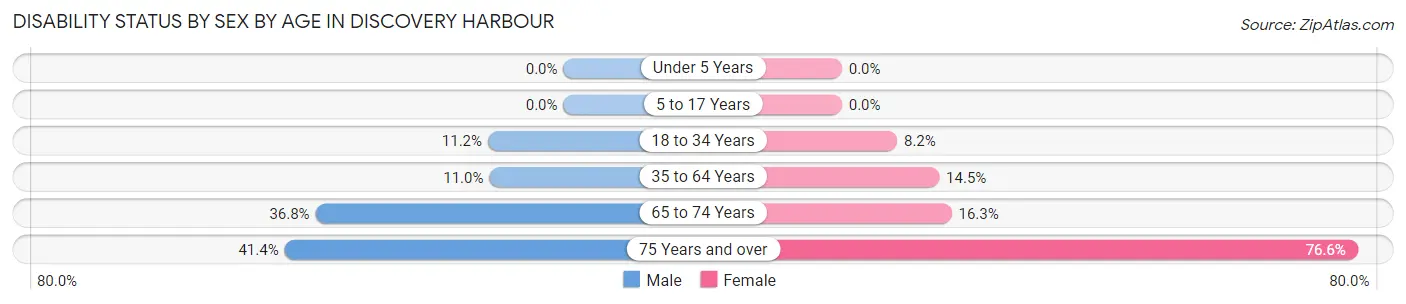
| Age Bracket | Male | Female |
| Under 5 Years | 0 (0.0%) | 0 (0.0%) |
| 5 to 17 Years | 0 (0.0%) | 0 (0.0%) |
| 18 to 34 Years | 12 (11.2%) | 5 (8.2%) |
| 35 to 64 Years | 22 (11.0%) | 36 (14.5%) |
| 65 to 74 Years | 53 (36.8%) | 22 (16.3%) |
| 75 Years and over | 41 (41.4%) | 36 (76.6%) |
Disability Class by Sex by Age in Discovery Harbour
Disability Class: Hearing Difficulty
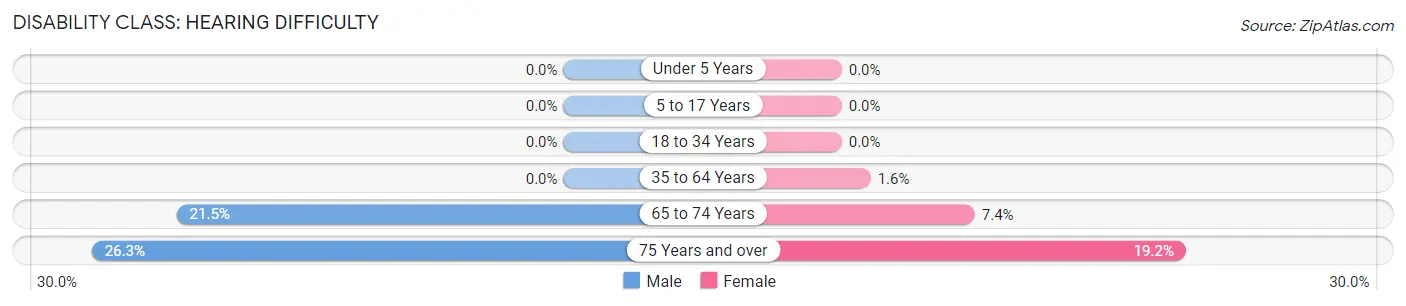
| Age Bracket | Male | Female |
| Under 5 Years | 0 (0.0%) | 0 (0.0%) |
| 5 to 17 Years | 0 (0.0%) | 0 (0.0%) |
| 18 to 34 Years | 0 (0.0%) | 0 (0.0%) |
| 35 to 64 Years | 0 (0.0%) | 4 (1.6%) |
| 65 to 74 Years | 31 (21.5%) | 10 (7.4%) |
| 75 Years and over | 26 (26.3%) | 9 (19.2%) |
Disability Class: Vision Difficulty
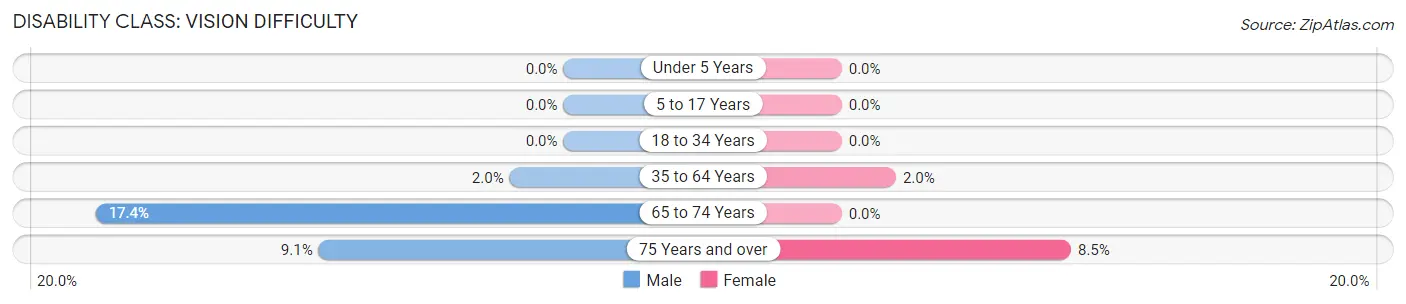
| Age Bracket | Male | Female |
| Under 5 Years | 0 (0.0%) | 0 (0.0%) |
| 5 to 17 Years | 0 (0.0%) | 0 (0.0%) |
| 18 to 34 Years | 0 (0.0%) | 0 (0.0%) |
| 35 to 64 Years | 4 (2.0%) | 5 (2.0%) |
| 65 to 74 Years | 25 (17.4%) | 0 (0.0%) |
| 75 Years and over | 9 (9.1%) | 4 (8.5%) |
Disability Class: Cognitive Difficulty
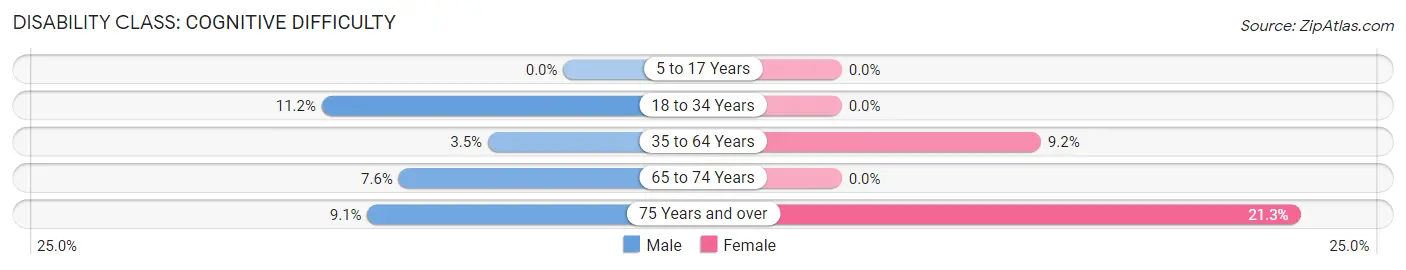
| Age Bracket | Male | Female |
| 5 to 17 Years | 0 (0.0%) | 0 (0.0%) |
| 18 to 34 Years | 12 (11.2%) | 0 (0.0%) |
| 35 to 64 Years | 7 (3.5%) | 23 (9.2%) |
| 65 to 74 Years | 11 (7.6%) | 0 (0.0%) |
| 75 Years and over | 9 (9.1%) | 10 (21.3%) |
Disability Class: Ambulatory Difficulty
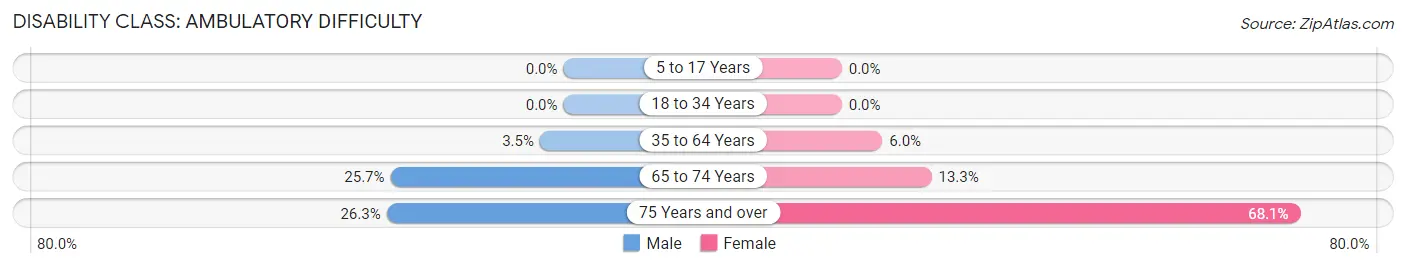
| Age Bracket | Male | Female |
| 5 to 17 Years | 0 (0.0%) | 0 (0.0%) |
| 18 to 34 Years | 0 (0.0%) | 0 (0.0%) |
| 35 to 64 Years | 7 (3.5%) | 15 (6.0%) |
| 65 to 74 Years | 37 (25.7%) | 18 (13.3%) |
| 75 Years and over | 26 (26.3%) | 32 (68.1%) |
Disability Class: Self-Care Difficulty
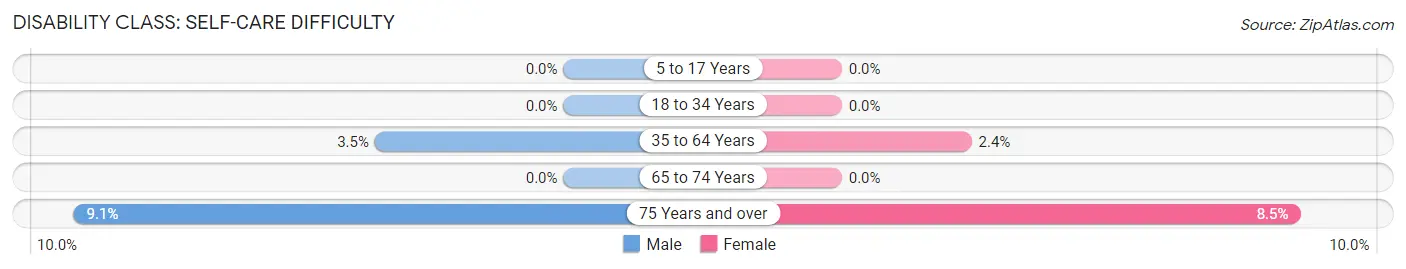
| Age Bracket | Male | Female |
| 5 to 17 Years | 0 (0.0%) | 0 (0.0%) |
| 18 to 34 Years | 0 (0.0%) | 0 (0.0%) |
| 35 to 64 Years | 7 (3.5%) | 6 (2.4%) |
| 65 to 74 Years | 0 (0.0%) | 0 (0.0%) |
| 75 Years and over | 9 (9.1%) | 4 (8.5%) |
Technology Access in Discovery Harbour
Computing Device Access in Discovery Harbour
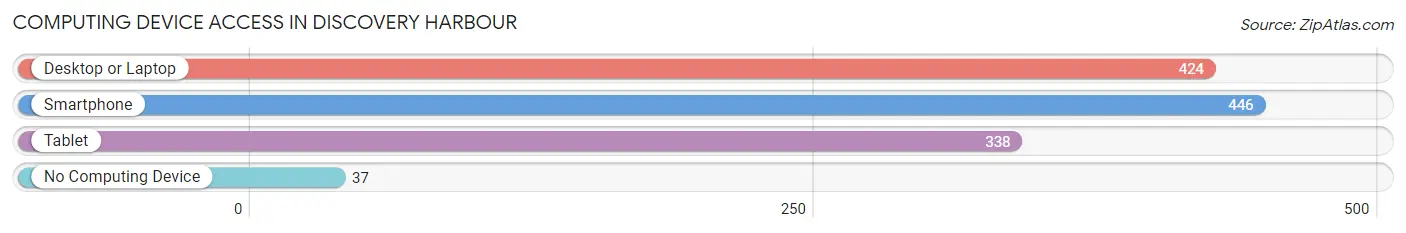
| Device Type | # Households | % Households |
| Desktop or Laptop | 424 | 80.6% |
| Smartphone | 446 | 84.8% |
| Tablet | 338 | 64.3% |
| No Computing Device | 37 | 7.0% |
| Total | 526 | 100.0% |
Internet Access in Discovery Harbour
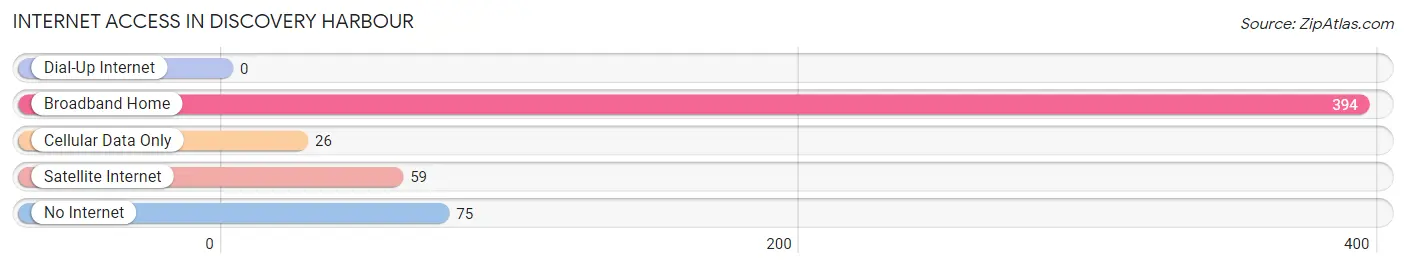
| Internet Type | # Households | % Households |
| Dial-Up Internet | 0 | 0.0% |
| Broadband Home | 394 | 74.9% |
| Cellular Data Only | 26 | 4.9% |
| Satellite Internet | 59 | 11.2% |
| No Internet | 75 | 14.3% |
| Total | 526 | 100.0% |
Discovery Harbour Summary
Discovery Harbour is a small unincorporated community located on the island of Hawaii in the United States. It is situated on the eastern shore of the island, approximately 20 miles south of Hilo. The community is part of the Hawaii County and is located within the Puna District.
History
Discovery Harbour was first settled in the late 1800s by a group of Hawaiian fishermen. The area was known as “Kahalu’u” and was a popular fishing spot for the locals. In the early 1900s, the area was developed into a small village and was renamed “Discovery Harbour”. The name was chosen to commemorate the discovery of the Hawaiian Islands by Captain James Cook in 1778.
In the early 1900s, the area was a popular tourist destination and was home to a number of resorts and hotels. The area was also home to a number of pineapple plantations and was a major producer of the fruit. In the 1950s, the area began to decline as tourism shifted to other parts of the island.
Geography
Discovery Harbour is located on the eastern shore of the island of Hawaii. It is situated approximately 20 miles south of Hilo and is part of the Puna District. The area is bordered by the Pacific Ocean to the east and the Wailuku River to the west. The area is mostly flat and is covered in lush tropical vegetation.
The climate in Discovery Harbour is tropical and humid. The average temperature is around 75 degrees Fahrenheit and the average rainfall is around 60 inches per year.
Economy
The economy of Discovery Harbour is largely based on tourism and agriculture. The area is home to a number of resorts and hotels, as well as a number of pineapple plantations. The area is also home to a number of small businesses, including restaurants, shops, and other services.
Demographics
As of the 2010 census, the population of Discovery Harbour was 1,845. The population is mostly of Hawaiian descent, with a small percentage of other ethnicities. The median household income is around $50,000 and the median home value is around $250,000. The area is served by the Hawaii County School District.
Common Questions
What is Per Capita Income in Discovery Harbour?
Per Capita income in Discovery Harbour is $35,411.
What is the Median Family Income in Discovery Harbour?
Median Family Income in Discovery Harbour is $85,000.
What is the Median Household income in Discovery Harbour?
Median Household Income in Discovery Harbour is $61,417.
What is Inequality or Gini Index in Discovery Harbour?
Inequality or Gini Index in Discovery Harbour is 0.46.
What is the Total Population of Discovery Harbour?
Total Population of Discovery Harbour is 1,241.
What is the Total Male Population of Discovery Harbour?
Total Male Population of Discovery Harbour is 663.
What is the Total Female Population of Discovery Harbour?
Total Female Population of Discovery Harbour is 578.
What is the Ratio of Males per 100 Females in Discovery Harbour?
There are 114.71 Males per 100 Females in Discovery Harbour.
What is the Ratio of Females per 100 Males in Discovery Harbour?
There are 87.18 Females per 100 Males in Discovery Harbour.
What is the Median Population Age in Discovery Harbour?
Median Population Age in Discovery Harbour is 56.2 Years.
What is the Average Family Size in Discovery Harbour
Average Family Size in Discovery Harbour is 2.9 People.
What is the Average Household Size in Discovery Harbour
Average Household Size in Discovery Harbour is 2.4 People.
How Large is the Labor Force in Discovery Harbour?
There are 459 People in the Labor Forcein in Discovery Harbour.
What is the Percentage of People in the Labor Force in Discovery Harbour?
42.4% of People are in the Labor Force in Discovery Harbour.
What is the Unemployment Rate in Discovery Harbour?
Unemployment Rate in Discovery Harbour is 13.9%.