Wailea, HI Map & Demographics
Wailea Map
Wailea Overview
$70,735
PER CAPITA INCOME
$102,365
AVG FAMILY INCOME
$89,088
AVG HOUSEHOLD INCOME
44.4%
WAGE / INCOME GAP [ % ]
55.6¢/ $1
WAGE / INCOME GAP [ $ ]
0.57
INEQUALITY / GINI INDEX
6,517
TOTAL POPULATION
3,412
MALE POPULATION
3,105
FEMALE POPULATION
109.89
MALES / 100 FEMALES
91.00
FEMALES / 100 MALES
54.2
MEDIAN AGE
2.6
AVG FAMILY SIZE
2.3
AVG HOUSEHOLD SIZE
3,221
LABOR FORCE [ PEOPLE ]
54.7%
PERCENT IN LABOR FORCE
5.8%
UNEMPLOYMENT RATE
Wailea Area Codes
Income in Wailea
Income Overview in Wailea
Per Capita Income in Wailea is $70,735, while median incomes of families and households are $102,365 and $89,088 respectively.
| Characteristic | Number | Measure |
| Per Capita Income | 6,517 | $70,735 |
| Median Family Income | 1,954 | $102,365 |
| Mean Family Income | 1,954 | $178,572 |
| Median Household Income | 2,857 | $89,088 |
| Mean Household Income | 2,857 | $162,563 |
| Income Deficit | 1,954 | $0 |
| Wage / Income Gap (%) | 6,517 | 44.40% |
| Wage / Income Gap ($) | 6,517 | 55.60¢ per $1 |
| Gini / Inequality Index | 6,517 | 0.57 |
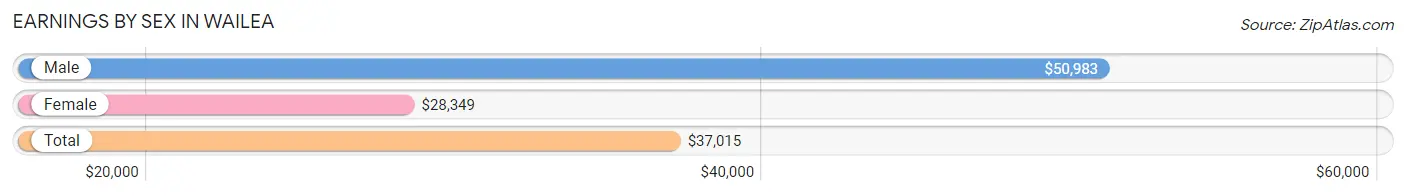
Earnings by Sex in Wailea
Average Earnings in Wailea are $37,015, $50,983 for men and $28,349 for women, a difference of 44.4%.
| Sex | Number | Average Earnings |
| Male | 2,007 (56.6%) | $50,983 |
| Female | 1,537 (43.4%) | $28,349 |
| Total | 3,544 (100.0%) | $37,015 |
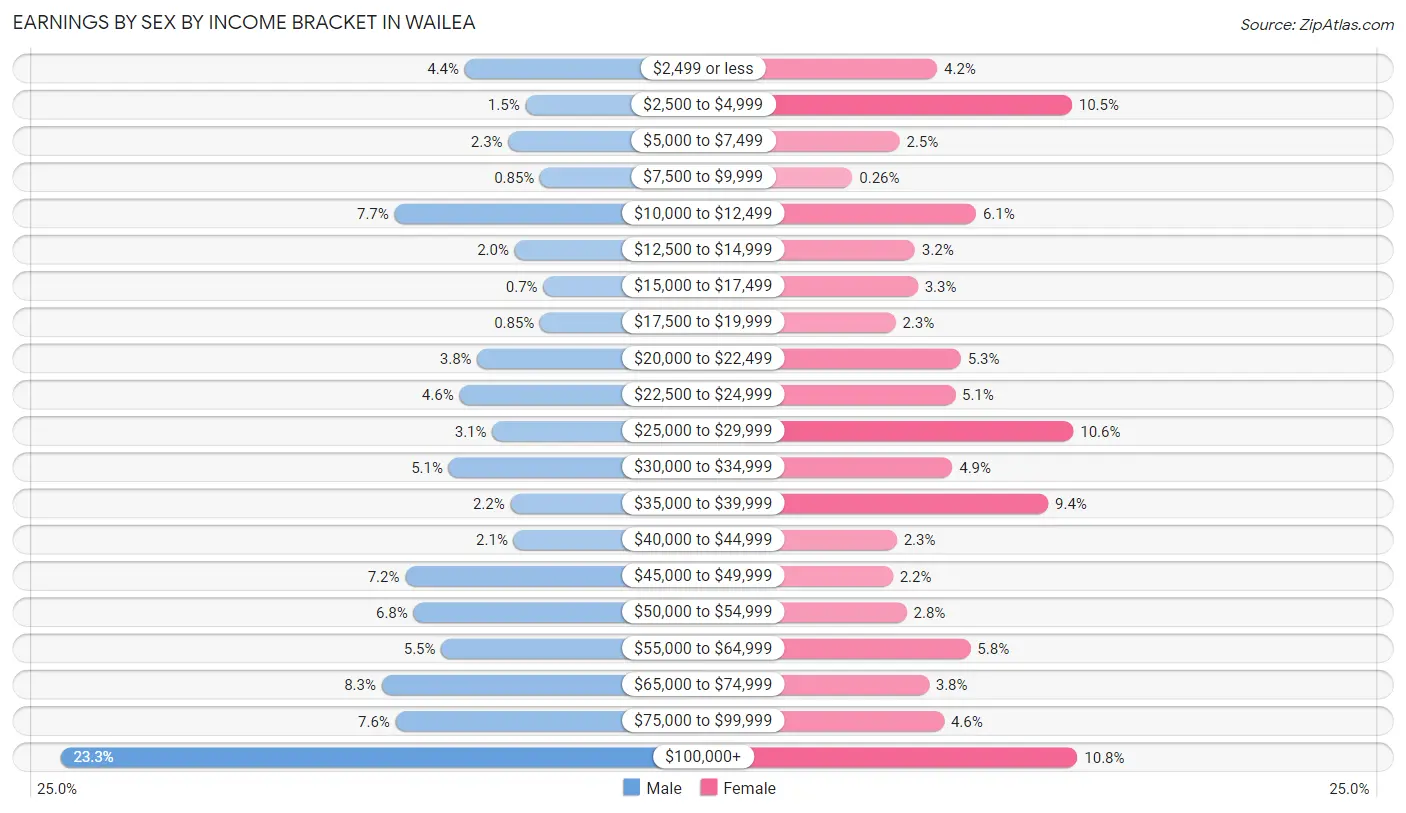
Earnings by Sex by Income Bracket in Wailea
The most common earnings brackets in Wailea are $100,000+ for men (468 | 23.3%) and $100,000+ for women (166 | 10.8%).
| Income | Male | Female |
| $2,499 or less | 88 (4.4%) | 65 (4.2%) |
| $2,500 to $4,999 | 31 (1.5%) | 162 (10.5%) |
| $5,000 to $7,499 | 47 (2.3%) | 38 (2.5%) |
| $7,500 to $9,999 | 17 (0.9%) | 4 (0.3%) |
| $10,000 to $12,499 | 154 (7.7%) | 93 (6.0%) |
| $12,500 to $14,999 | 41 (2.0%) | 49 (3.2%) |
| $15,000 to $17,499 | 14 (0.7%) | 51 (3.3%) |
| $17,500 to $19,999 | 17 (0.9%) | 35 (2.3%) |
| $20,000 to $22,499 | 76 (3.8%) | 82 (5.3%) |
| $22,500 to $24,999 | 93 (4.6%) | 78 (5.1%) |
| $25,000 to $29,999 | 62 (3.1%) | 163 (10.6%) |
| $30,000 to $34,999 | 103 (5.1%) | 76 (4.9%) |
| $35,000 to $39,999 | 45 (2.2%) | 145 (9.4%) |
| $40,000 to $44,999 | 42 (2.1%) | 36 (2.3%) |
| $45,000 to $49,999 | 144 (7.2%) | 33 (2.1%) |
| $50,000 to $54,999 | 136 (6.8%) | 43 (2.8%) |
| $55,000 to $64,999 | 110 (5.5%) | 89 (5.8%) |
| $65,000 to $74,999 | 166 (8.3%) | 59 (3.8%) |
| $75,000 to $99,999 | 153 (7.6%) | 70 (4.5%) |
| $100,000+ | 468 (23.3%) | 166 (10.8%) |
| Total | 2,007 (100.0%) | 1,537 (100.0%) |
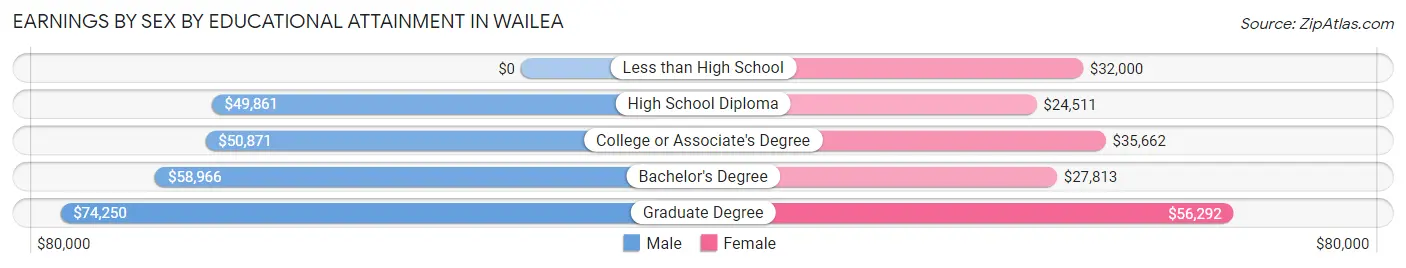
Earnings by Sex by Educational Attainment in Wailea
Average earnings in Wailea are $52,951 for men and $31,027 for women, a difference of 41.4%. Men with an educational attainment of graduate degree enjoy the highest average annual earnings of $74,250, while those with high school diploma education earn the least with $49,861. Women with an educational attainment of graduate degree earn the most with the average annual earnings of $56,292, while those with high school diploma education have the smallest earnings of $24,511.
| Educational Attainment | Male Income | Female Income |
| Less than High School | - | - |
| High School Diploma | $49,861 | $24,511 |
| College or Associate's Degree | $50,871 | $35,662 |
| Bachelor's Degree | $58,966 | $27,813 |
| Graduate Degree | $74,250 | $56,292 |
| Total | $52,951 | $31,027 |
Family Income in Wailea
Family Income Brackets in Wailea
According to the Wailea family income data, there are 381 families falling into the $200,000+ income range, which is the most common income bracket and makes up 19.5% of all families. Conversely, the less than $10,000 income bracket is the least frequent group with only 61 families (3.1%) belonging to this category.
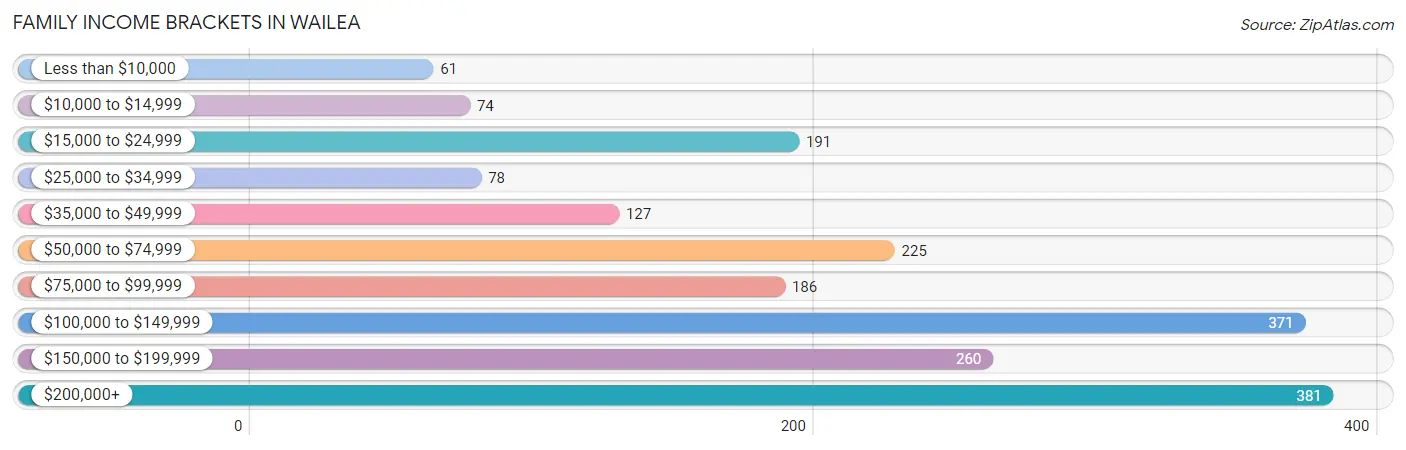
| Income Bracket | # Families | % Families |
| Less than $10,000 | 61 | 3.1% |
| $10,000 to $14,999 | 74 | 3.8% |
| $15,000 to $24,999 | 191 | 9.8% |
| $25,000 to $34,999 | 78 | 4.0% |
| $35,000 to $49,999 | 127 | 6.5% |
| $50,000 to $74,999 | 225 | 11.5% |
| $75,000 to $99,999 | 186 | 9.5% |
| $100,000 to $149,999 | 371 | 19.0% |
| $150,000 to $199,999 | 260 | 13.3% |
| $200,000+ | 381 | 19.5% |
Family Income by Famaliy Size in Wailea
3-person families (515 | 26.4%) account for the highest median family income in Wailea with $113,906 per family, while 2-person families (1,165 | 59.6%) have the highest median income of $48,866 per family member.
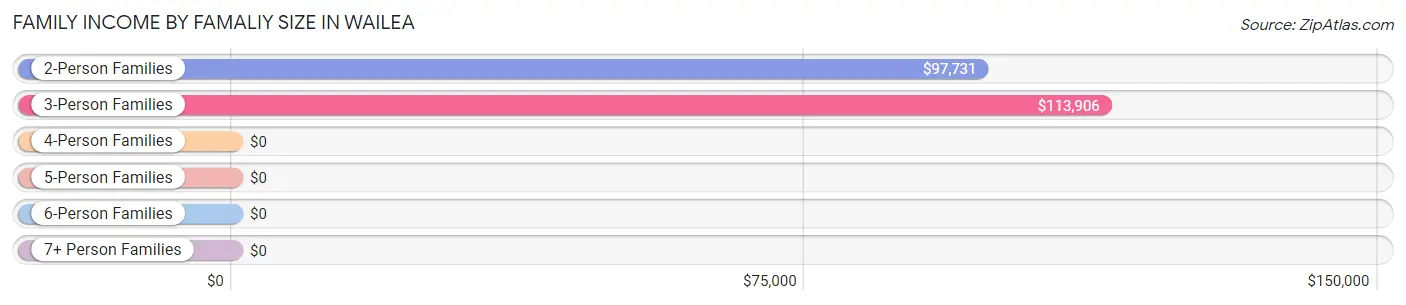
| Income Bracket | # Families | Median Income |
| 2-Person Families | 1,165 (59.6%) | $97,731 |
| 3-Person Families | 515 (26.4%) | $113,906 |
| 4-Person Families | 146 (7.5%) | $0 |
| 5-Person Families | 88 (4.5%) | $0 |
| 6-Person Families | 0 (0.0%) | $0 |
| 7+ Person Families | 40 (2.1%) | $0 |
| Total | 1,954 (100.0%) | $102,365 |
Family Income by Number of Earners in Wailea
The median family income in Wailea is $102,365, with families comprising 3+ earners (184) having the highest median family income of $155,369, while families with 1 earner (669) have the lowest median family income of $84,250, accounting for 9.4% and 34.2% of families, respectively.
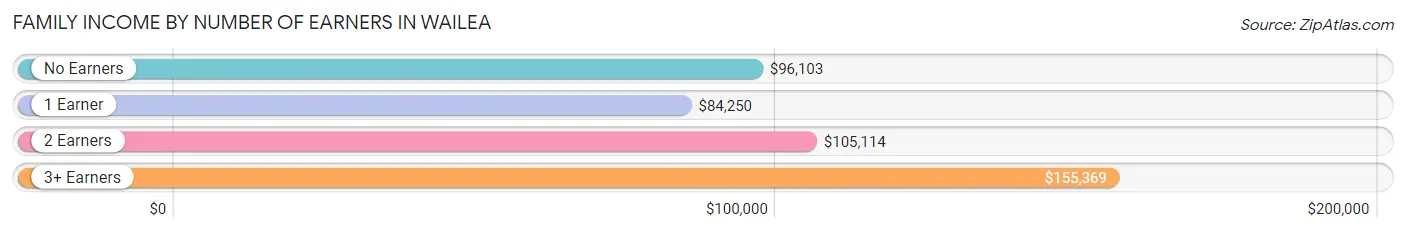
| Number of Earners | # Families | Median Income |
| No Earners | 563 (28.8%) | $96,103 |
| 1 Earner | 669 (34.2%) | $84,250 |
| 2 Earners | 538 (27.5%) | $105,114 |
| 3+ Earners | 184 (9.4%) | $155,369 |
| Total | 1,954 (100.0%) | $102,365 |
Household Income in Wailea
Household Income Brackets in Wailea
With 557 households falling in the category, the $200,000+ income range is the most frequent in Wailea, accounting for 19.5% of all households. In contrast, only 126 households (4.4%) fall into the $10,000 to $14,999 income bracket, making it the least populous group.
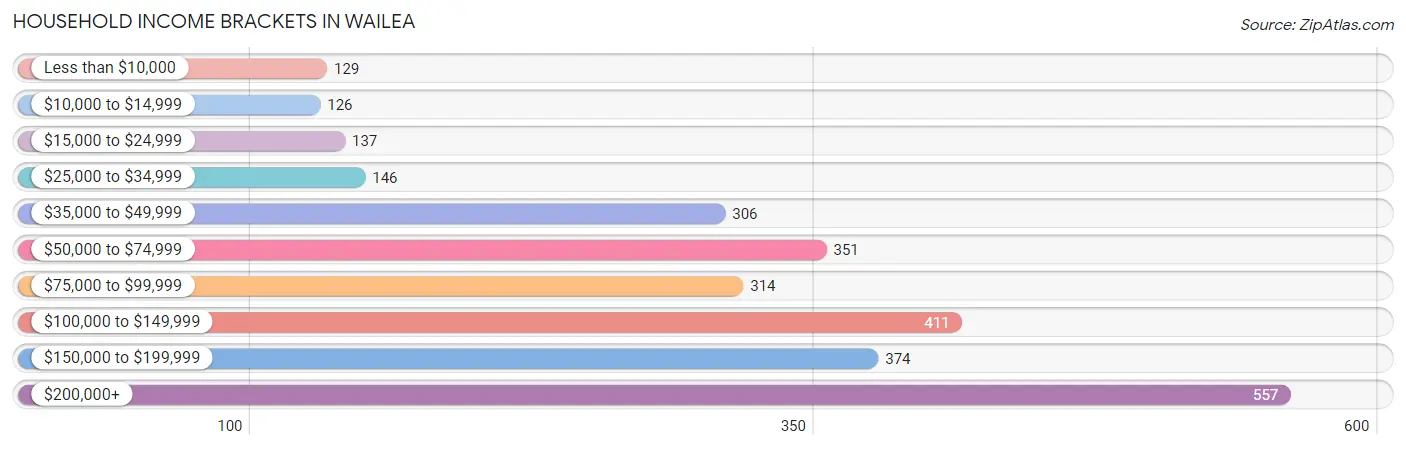
| Income Bracket | # Households | % Households |
| Less than $10,000 | 129 | 4.5% |
| $10,000 to $14,999 | 126 | 4.4% |
| $15,000 to $24,999 | 137 | 4.8% |
| $25,000 to $34,999 | 146 | 5.1% |
| $35,000 to $49,999 | 306 | 10.7% |
| $50,000 to $74,999 | 351 | 12.3% |
| $75,000 to $99,999 | 314 | 11.0% |
| $100,000 to $149,999 | 411 | 14.4% |
| $150,000 to $199,999 | 374 | 13.1% |
| $200,000+ | 557 | 19.5% |
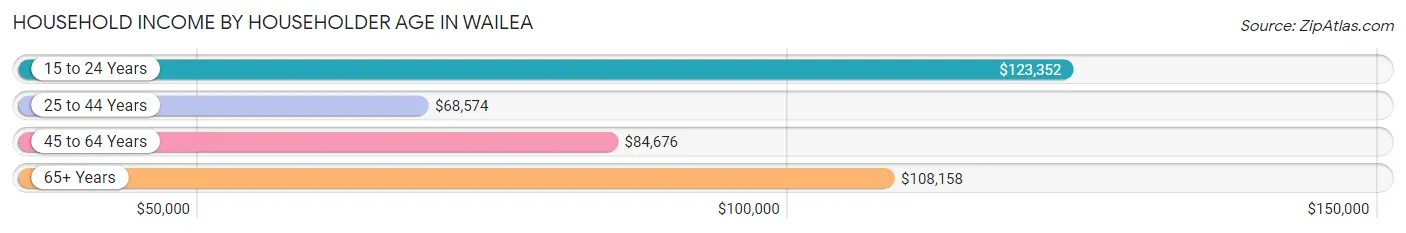
Household Income by Householder Age in Wailea
The median household income in Wailea is $89,088, with the highest median household income of $123,352 found in the 15 to 24 years age bracket for the primary householder. A total of 188 households (6.6%) fall into this category. Meanwhile, the 25 to 44 years age bracket for the primary householder has the lowest median household income of $68,574, with 517 households (18.1%) in this group.
| Income Bracket | # Households | Median Income |
| 15 to 24 Years | 188 (6.6%) | $123,352 |
| 25 to 44 Years | 517 (18.1%) | $68,574 |
| 45 to 64 Years | 1,050 (36.7%) | $84,676 |
| 65+ Years | 1,102 (38.6%) | $108,158 |
| Total | 2,857 (100.0%) | $89,088 |
Poverty in Wailea
Income Below Poverty by Sex and Age in Wailea
With 16.4% poverty level for males and 10.1% for females among the residents of Wailea, 16 and 17 year old males and 6 to 11 year old females are the most vulnerable to poverty, with 64 males (100.0%) and 56 females (34.4%) in their respective age groups living below the poverty level.
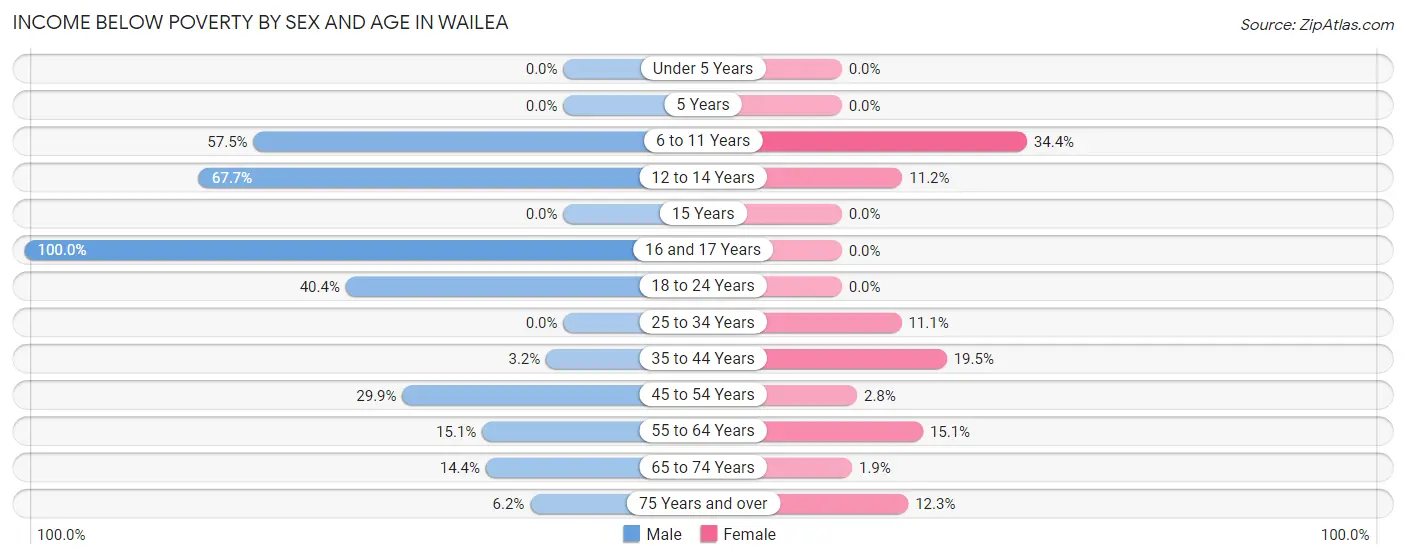
| Age Bracket | Male | Female |
| Under 5 Years | 0 (0.0%) | 0 (0.0%) |
| 5 Years | 0 (0.0%) | 0 (0.0%) |
| 6 to 11 Years | 42 (57.5%) | 56 (34.4%) |
| 12 to 14 Years | 23 (67.6%) | 10 (11.2%) |
| 15 Years | 0 (0.0%) | 0 (0.0%) |
| 16 and 17 Years | 64 (100.0%) | 0 (0.0%) |
| 18 to 24 Years | 82 (40.4%) | 0 (0.0%) |
| 25 to 34 Years | 0 (0.0%) | 37 (11.1%) |
| 35 to 44 Years | 11 (3.2%) | 67 (19.5%) |
| 45 to 54 Years | 98 (29.9%) | 12 (2.8%) |
| 55 to 64 Years | 112 (15.1%) | 64 (15.1%) |
| 65 to 74 Years | 105 (14.4%) | 9 (1.9%) |
| 75 Years and over | 22 (6.1%) | 55 (12.3%) |
| Total | 559 (16.4%) | 310 (10.1%) |
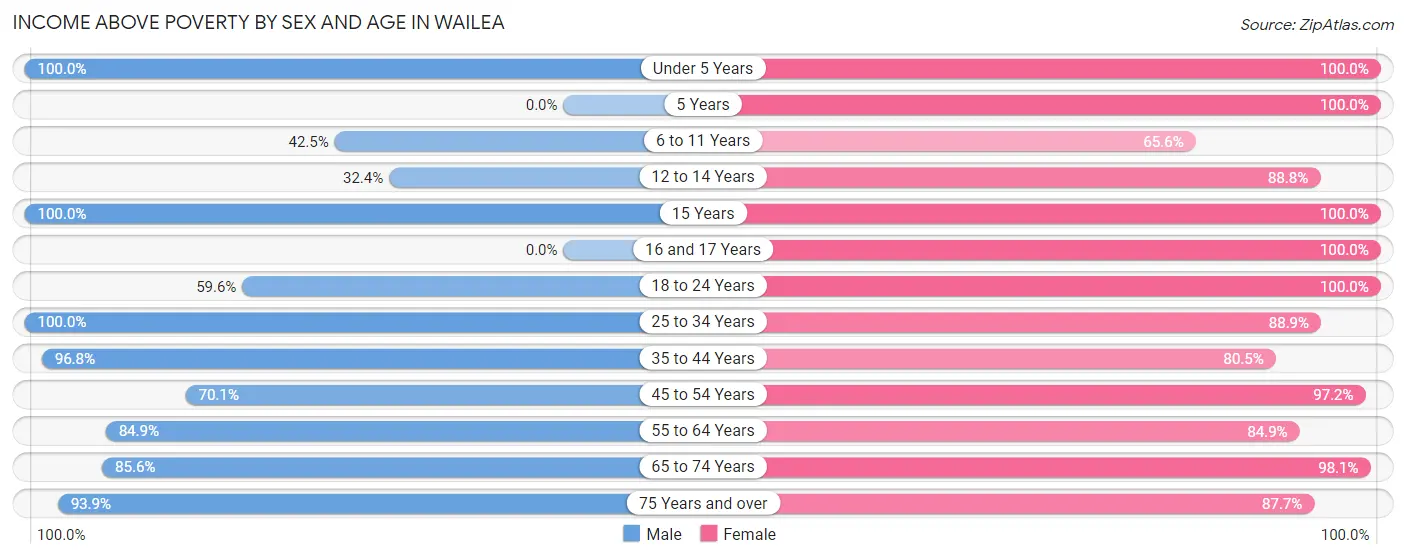
Income Above Poverty by Sex and Age in Wailea
According to the poverty statistics in Wailea, males aged under 5 years and females aged under 5 years are the age groups that are most secure financially, with 100.0% of males and 100.0% of females in these age groups living above the poverty line.
| Age Bracket | Male | Female |
| Under 5 Years | 112 (100.0%) | 62 (100.0%) |
| 5 Years | 0 (0.0%) | 7 (100.0%) |
| 6 to 11 Years | 31 (42.5%) | 107 (65.6%) |
| 12 to 14 Years | 11 (32.4%) | 79 (88.8%) |
| 15 Years | 58 (100.0%) | 11 (100.0%) |
| 16 and 17 Years | 0 (0.0%) | 68 (100.0%) |
| 18 to 24 Years | 121 (59.6%) | 232 (100.0%) |
| 25 to 34 Years | 361 (100.0%) | 297 (88.9%) |
| 35 to 44 Years | 333 (96.8%) | 277 (80.5%) |
| 45 to 54 Years | 230 (70.1%) | 412 (97.2%) |
| 55 to 64 Years | 631 (84.9%) | 361 (84.9%) |
| 65 to 74 Years | 624 (85.6%) | 464 (98.1%) |
| 75 Years and over | 336 (93.9%) | 391 (87.7%) |
| Total | 2,848 (83.6%) | 2,768 (89.9%) |
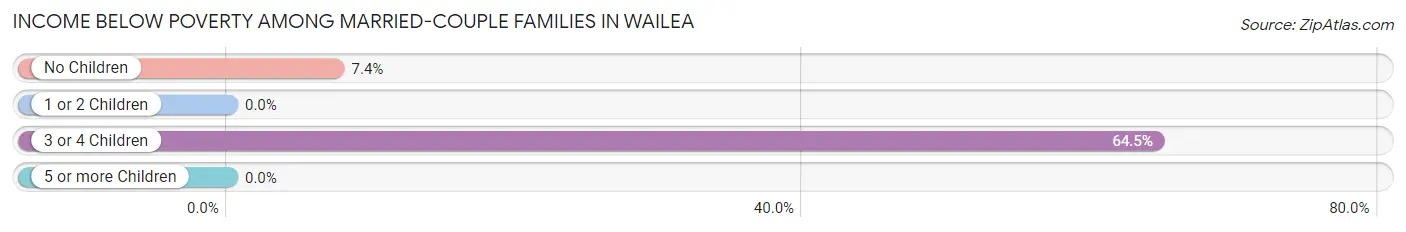
Income Below Poverty Among Married-Couple Families in Wailea
The poverty statistics for married-couple families in Wailea show that 7.3% or 114 of the total 1,567 families live below the poverty line. Families with 3 or 4 children have the highest poverty rate of 64.5%, comprising of 20 families. On the other hand, families with 1 or 2 children have the lowest poverty rate of 0.0%, which includes 0 families.
| Children | Above Poverty | Below Poverty |
| No Children | 1,172 (92.6%) | 94 (7.4%) |
| 1 or 2 Children | 270 (100.0%) | 0 (0.0%) |
| 3 or 4 Children | 11 (35.5%) | 20 (64.5%) |
| 5 or more Children | 0 (0.0%) | 0 (0.0%) |
| Total | 1,453 (92.7%) | 114 (7.3%) |
Income Below Poverty Among Single-Parent Households in Wailea
According to the poverty data in Wailea, 89.2% or 148 single-father households and 3.2% or 7 single-mother households are living below the poverty line. Among single-father households, those with 1 or 2 children have the highest poverty rate, with 140 households (92.1%) experiencing poverty. Likewise, among single-mother households, those with 3 or 4 children have the highest poverty rate, with 7 households (100.0%) falling below the poverty line.
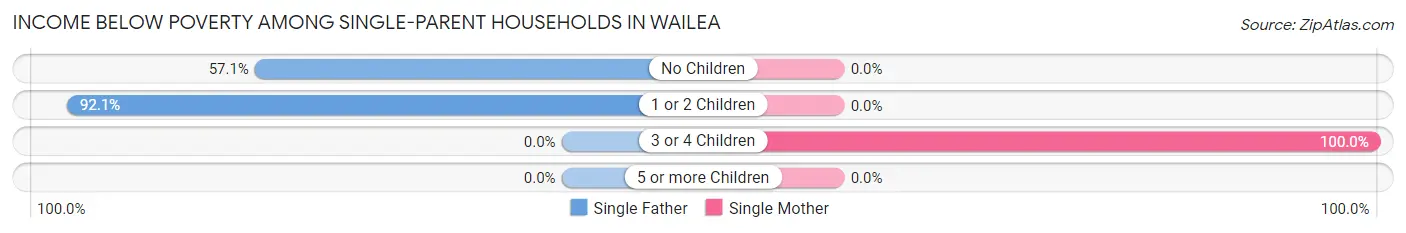
| Children | Single Father | Single Mother |
| No Children | 8 (57.1%) | 0 (0.0%) |
| 1 or 2 Children | 140 (92.1%) | 0 (0.0%) |
| 3 or 4 Children | 0 (0.0%) | 7 (100.0%) |
| 5 or more Children | 0 (0.0%) | 0 (0.0%) |
| Total | 148 (89.2%) | 7 (3.2%) |
Income Below Poverty Among Married-Couple vs Single-Parent Households in Wailea
The poverty data for Wailea shows that 114 of the married-couple family households (7.3%) and 155 of the single-parent households (40.1%) are living below the poverty level. Within the married-couple family households, those with 3 or 4 children have the highest poverty rate, with 20 households (64.5%) falling below the poverty line. Among the single-parent households, those with 3 or 4 children have the highest poverty rate, with 7 household (100.0%) living below poverty.

| Children | Married-Couple Families | Single-Parent Households |
| No Children | 94 (7.4%) | 8 (5.8%) |
| 1 or 2 Children | 0 (0.0%) | 140 (57.9%) |
| 3 or 4 Children | 20 (64.5%) | 7 (100.0%) |
| 5 or more Children | 0 (0.0%) | 0 (0.0%) |
| Total | 114 (7.3%) | 155 (40.1%) |
Race in Wailea
The most populous races in Wailea are White / Caucasian (4,499 | 69.0%), Two or more Races (969 | 14.9%), and Asian (731 | 11.2%).
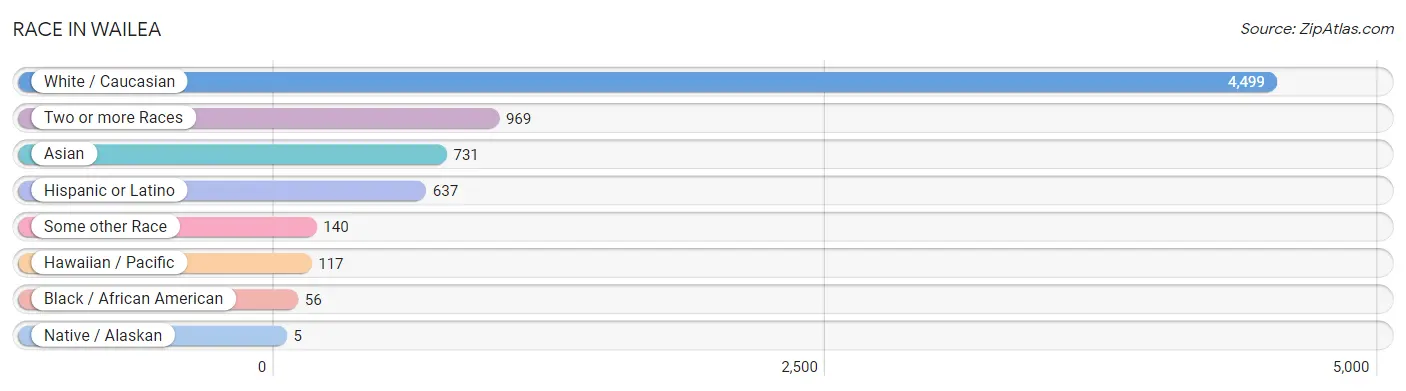
| Race | # Population | % Population |
| Asian | 731 | 11.2% |
| Black / African American | 56 | 0.9% |
| Hawaiian / Pacific | 117 | 1.8% |
| Hispanic or Latino | 637 | 9.8% |
| Native / Alaskan | 5 | 0.1% |
| White / Caucasian | 4,499 | 69.0% |
| Two or more Races | 969 | 14.9% |
| Some other Race | 140 | 2.1% |
| Total | 6,517 | 100.0% |
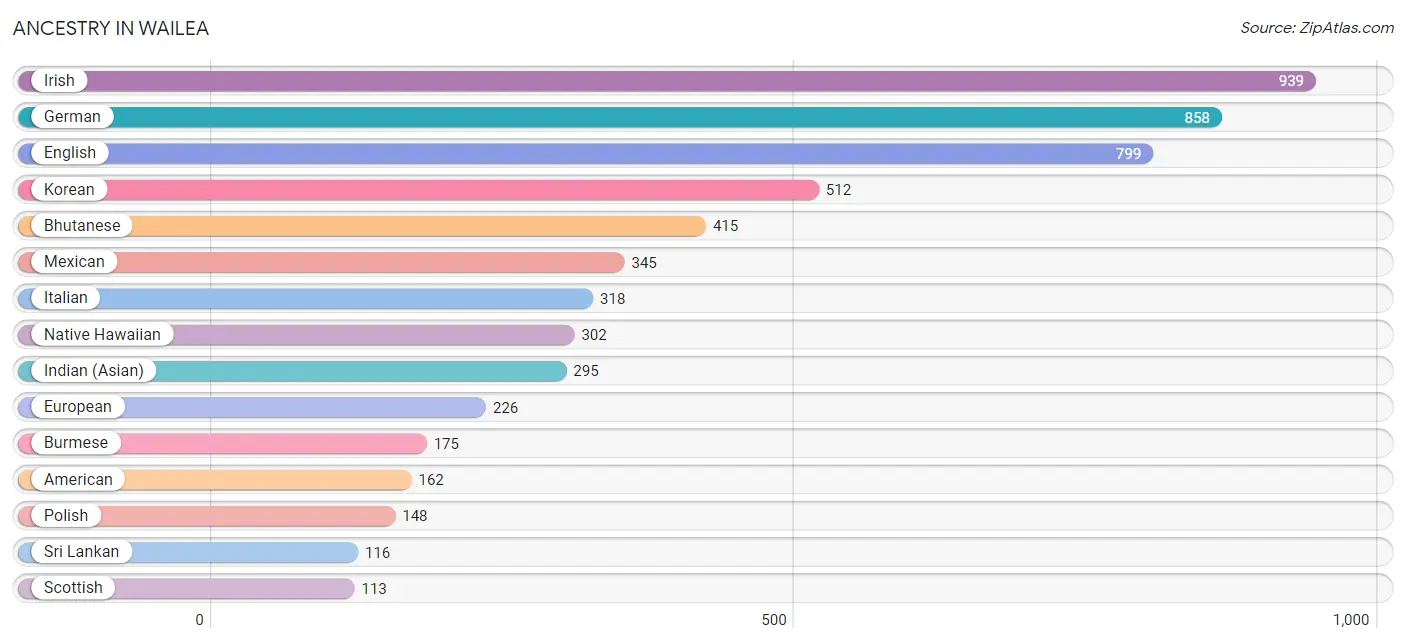
Ancestry in Wailea
The most populous ancestries reported in Wailea are Irish (939 | 14.4%), German (858 | 13.2%), English (799 | 12.3%), Korean (512 | 7.9%), and Bhutanese (415 | 6.4%), together accounting for 54.1% of all Wailea residents.
| Ancestry | # Population | % Population |
| Alsatian | 2 | 0.0% |
| American | 162 | 2.5% |
| Arab | 8 | 0.1% |
| Armenian | 27 | 0.4% |
| Austrian | 23 | 0.4% |
| Basque | 6 | 0.1% |
| Bhutanese | 415 | 6.4% |
| Blackfeet | 8 | 0.1% |
| British | 66 | 1.0% |
| Bulgarian | 6 | 0.1% |
| Burmese | 175 | 2.7% |
| Canadian | 59 | 0.9% |
| Cherokee | 5 | 0.1% |
| Colombian | 11 | 0.2% |
| Czech | 33 | 0.5% |
| Czechoslovakian | 38 | 0.6% |
| Danish | 45 | 0.7% |
| Dutch | 98 | 1.5% |
| Eastern European | 46 | 0.7% |
| English | 799 | 12.3% |
| European | 226 | 3.5% |
| Fijian | 5 | 0.1% |
| Finnish | 38 | 0.6% |
| French | 92 | 1.4% |
| French Canadian | 14 | 0.2% |
| German | 858 | 13.2% |
| Greek | 1 | 0.0% |
| Guamanian / Chamorro | 18 | 0.3% |
| Hungarian | 72 | 1.1% |
| Indian (Asian) | 295 | 4.5% |
| Irish | 939 | 14.4% |
| Italian | 318 | 4.9% |
| Japanese | 10 | 0.2% |
| Korean | 512 | 7.9% |
| Lebanese | 8 | 0.1% |
| Mexican | 345 | 5.3% |
| Native Hawaiian | 302 | 4.6% |
| Navajo | 7 | 0.1% |
| Northern European | 109 | 1.7% |
| Norwegian | 110 | 1.7% |
| Pakistani | 25 | 0.4% |
| Polish | 148 | 2.3% |
| Portuguese | 17 | 0.3% |
| Puerto Rican | 78 | 1.2% |
| Romanian | 3 | 0.1% |
| Russian | 99 | 1.5% |
| Scotch-Irish | 66 | 1.0% |
| Scottish | 113 | 1.7% |
| Serbian | 6 | 0.1% |
| Sioux | 3 | 0.1% |
| South American | 93 | 1.4% |
| Spaniard | 97 | 1.5% |
| Spanish | 24 | 0.4% |
| Sri Lankan | 116 | 1.8% |
| Swedish | 111 | 1.7% |
| Swiss | 18 | 0.3% |
| Thai | 36 | 0.5% |
| Turkish | 68 | 1.0% |
| Ukrainian | 14 | 0.2% |
| Venezuelan | 82 | 1.3% |
| Welsh | 84 | 1.3% |
| Yugoslavian | 10 | 0.2% | View All 62 Rows |
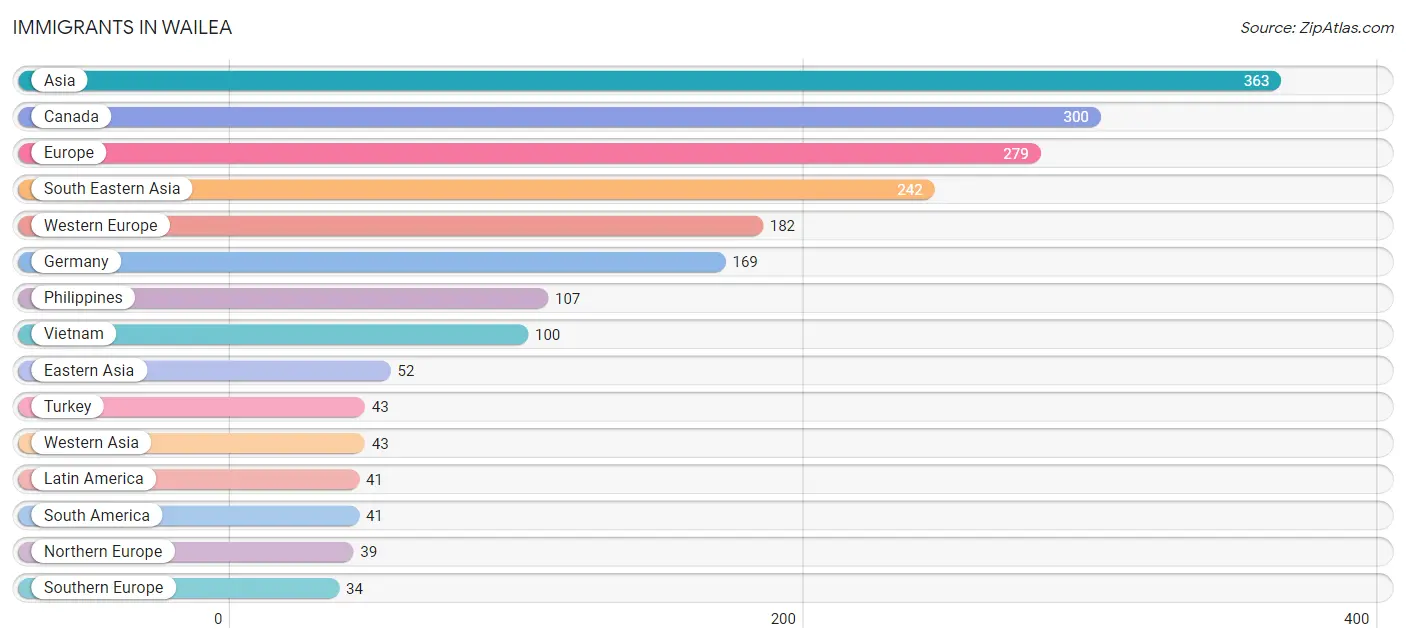
Immigrants in Wailea
The most numerous immigrant groups reported in Wailea came from Asia (363 | 5.6%), Canada (300 | 4.6%), Europe (279 | 4.3%), South Eastern Asia (242 | 3.7%), and Western Europe (182 | 2.8%), together accounting for 20.9% of all Wailea residents.
| Immigration Origin | # Population | % Population |
| Africa | 10 | 0.2% |
| Asia | 363 | 5.6% |
| Cambodia | 10 | 0.2% |
| Canada | 300 | 4.6% |
| China | 29 | 0.4% |
| Colombia | 11 | 0.2% |
| Denmark | 8 | 0.1% |
| Eastern Africa | 10 | 0.2% |
| Eastern Asia | 52 | 0.8% |
| Eastern Europe | 24 | 0.4% |
| England | 17 | 0.3% |
| Europe | 279 | 4.3% |
| France | 5 | 0.1% |
| Germany | 169 | 2.6% |
| Hong Kong | 9 | 0.1% |
| India | 26 | 0.4% |
| Italy | 20 | 0.3% |
| Japan | 23 | 0.4% |
| Latin America | 41 | 0.6% |
| Northern Europe | 39 | 0.6% |
| Oceania | 11 | 0.2% |
| Philippines | 107 | 1.6% |
| Scotland | 7 | 0.1% |
| South America | 41 | 0.6% |
| South Central Asia | 26 | 0.4% |
| South Eastern Asia | 242 | 3.7% |
| Southern Europe | 34 | 0.5% |
| Spain | 14 | 0.2% |
| Switzerland | 8 | 0.1% |
| Taiwan | 7 | 0.1% |
| Thailand | 25 | 0.4% |
| Turkey | 43 | 0.7% |
| Ukraine | 24 | 0.4% |
| Venezuela | 30 | 0.5% |
| Vietnam | 100 | 1.5% |
| Western Asia | 43 | 0.7% |
| Western Europe | 182 | 2.8% | View All 37 Rows |
Sex and Age in Wailea
Sex and Age in Wailea
The most populous age groups in Wailea are 55 to 59 Years (474 | 13.9%) for men and 70 to 74 Years (257 | 8.3%) for women.
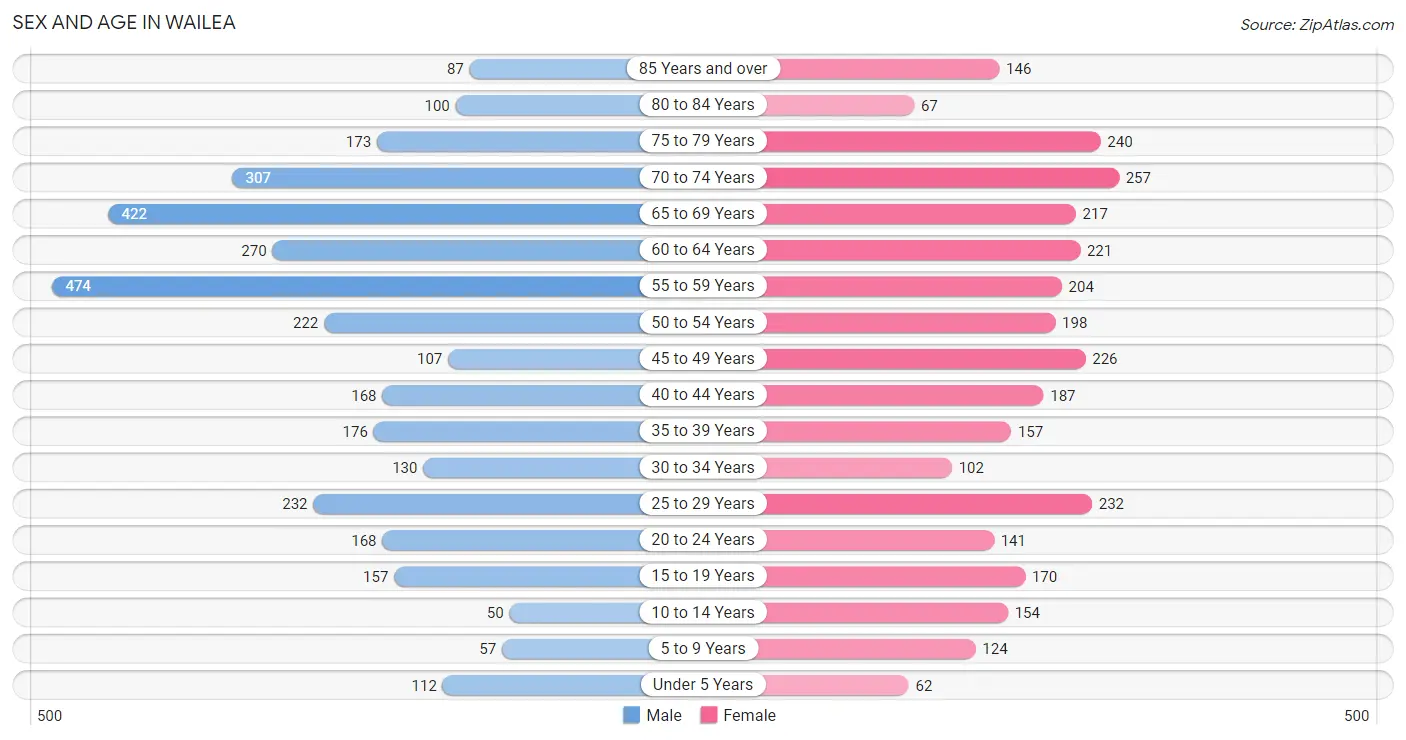
| Age Bracket | Male | Female |
| Under 5 Years | 112 (3.3%) | 62 (2.0%) |
| 5 to 9 Years | 57 (1.7%) | 124 (4.0%) |
| 10 to 14 Years | 50 (1.5%) | 154 (5.0%) |
| 15 to 19 Years | 157 (4.6%) | 170 (5.5%) |
| 20 to 24 Years | 168 (4.9%) | 141 (4.5%) |
| 25 to 29 Years | 232 (6.8%) | 232 (7.5%) |
| 30 to 34 Years | 130 (3.8%) | 102 (3.3%) |
| 35 to 39 Years | 176 (5.2%) | 157 (5.1%) |
| 40 to 44 Years | 168 (4.9%) | 187 (6.0%) |
| 45 to 49 Years | 107 (3.1%) | 226 (7.3%) |
| 50 to 54 Years | 222 (6.5%) | 198 (6.4%) |
| 55 to 59 Years | 474 (13.9%) | 204 (6.6%) |
| 60 to 64 Years | 270 (7.9%) | 221 (7.1%) |
| 65 to 69 Years | 422 (12.4%) | 217 (7.0%) |
| 70 to 74 Years | 307 (9.0%) | 257 (8.3%) |
| 75 to 79 Years | 173 (5.1%) | 240 (7.7%) |
| 80 to 84 Years | 100 (2.9%) | 67 (2.2%) |
| 85 Years and over | 87 (2.5%) | 146 (4.7%) |
| Total | 3,412 (100.0%) | 3,105 (100.0%) |
Families and Households in Wailea
Median Family Size in Wailea
The median family size in Wailea is 2.59 persons per family, with single female/mother families (221 | 11.3%) accounting for the largest median family size of 2.95 persons per family. On the other hand, single male/father families (166 | 8.5%) represent the smallest median family size with 2.42 persons per family.
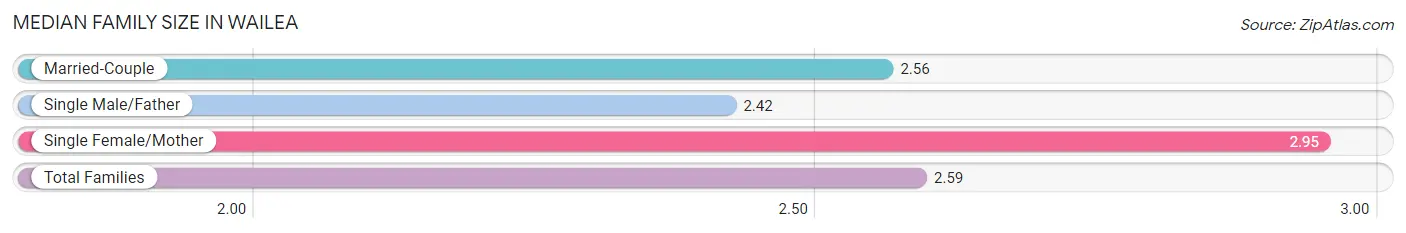
| Family Type | # Families | Family Size |
| Married-Couple | 1,567 (80.2%) | 2.56 |
| Single Male/Father | 166 (8.5%) | 2.42 |
| Single Female/Mother | 221 (11.3%) | 2.95 |
| Total Families | 1,954 (100.0%) | 2.59 |
Median Household Size in Wailea
The median household size in Wailea is 2.27 persons per household, with single female/mother households (221 | 7.7%) accounting for the largest median household size of 3.27 persons per household. non-family households (903 | 31.6%) represent the smallest median household size with 1.37 persons per household.
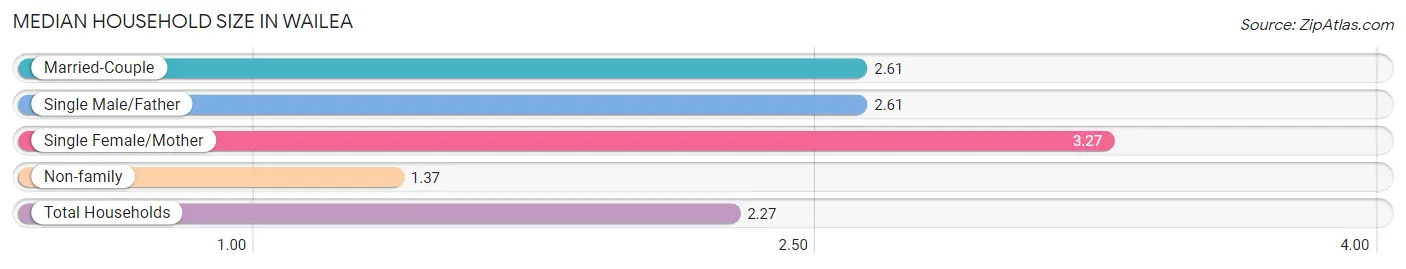
| Household Type | # Households | Household Size |
| Married-Couple | 1,567 (54.8%) | 2.61 |
| Single Male/Father | 166 (5.8%) | 2.61 |
| Single Female/Mother | 221 (7.7%) | 3.27 |
| Non-family | 903 (31.6%) | 1.37 |
| Total Households | 2,857 (100.0%) | 2.27 |
Household Size by Marriage Status in Wailea
Out of a total of 2,857 households in Wailea, 1,954 (68.4%) are family households, while 903 (31.6%) are nonfamily households. The most numerous type of family households are 2-person households, comprising 1,127, and the most common type of nonfamily households are 1-person households, comprising 672.
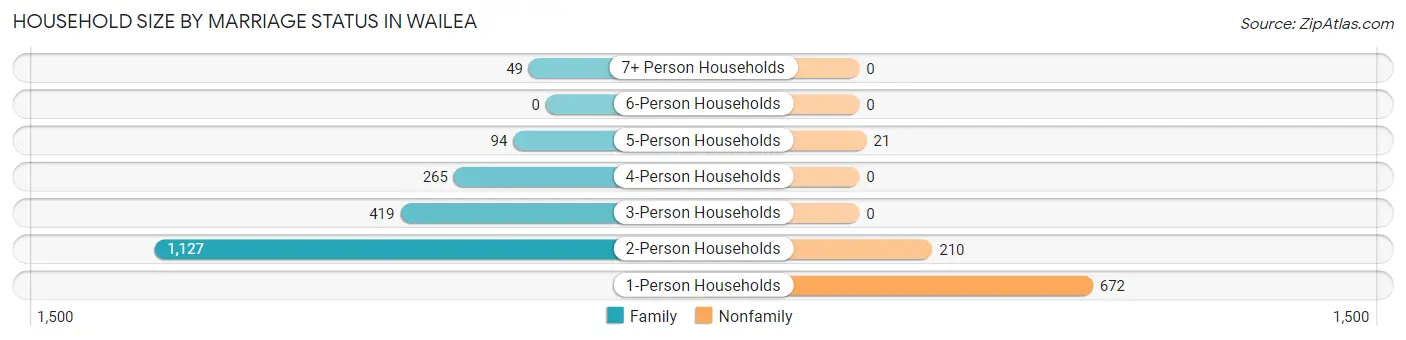
| Household Size | Family Households | Nonfamily Households |
| 1-Person Households | - | 672 (23.5%) |
| 2-Person Households | 1,127 (39.5%) | 210 (7.3%) |
| 3-Person Households | 419 (14.7%) | 0 (0.0%) |
| 4-Person Households | 265 (9.3%) | 0 (0.0%) |
| 5-Person Households | 94 (3.3%) | 21 (0.7%) |
| 6-Person Households | 0 (0.0%) | 0 (0.0%) |
| 7+ Person Households | 49 (1.7%) | 0 (0.0%) |
| Total | 1,954 (68.4%) | 903 (31.6%) |
Female Fertility in Wailea
Fertility by Age in Wailea
Average fertility rate in Wailea is 40.0 births per 1,000 women. Women in the age bracket of 20 to 34 years have the highest fertility rate with 95.0 births per 1,000 women. Women in the age bracket of 20 to 34 years acount for 90.0% of all women with births.
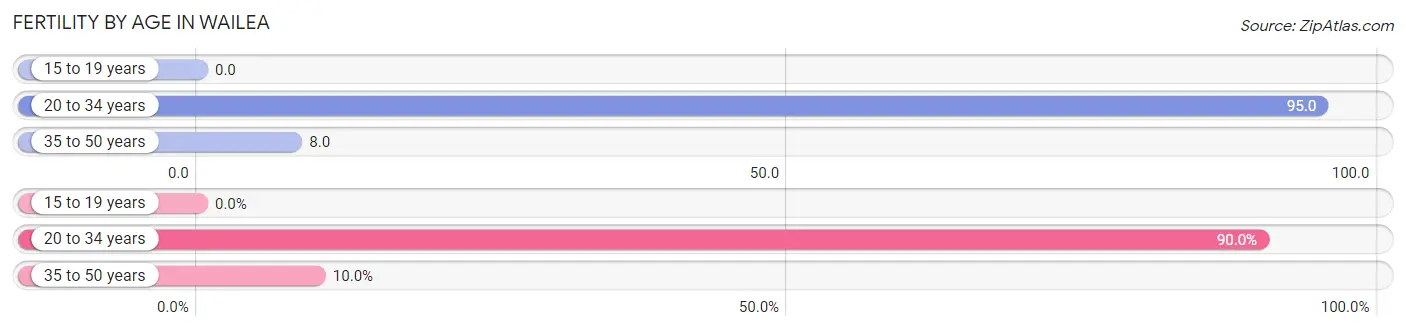
| Age Bracket | Women with Births | Births / 1,000 Women |
| 15 to 19 years | 0 (0.0%) | 0.0 |
| 20 to 34 years | 45 (90.0%) | 95.0 |
| 35 to 50 years | 5 (10.0%) | 8.0 |
| Total | 50 (100.0%) | 40.0 |
Fertility by Age by Marriage Status in Wailea
78.0% of women with births (50) in Wailea are married. The highest percentage of unmarried women with births falls into 20 to 34 years age bracket with 24.4% of them unmarried at the time of birth, while the lowest percentage of unmarried women with births belong to 35 to 50 years age bracket with 0.0% of them unmarried.
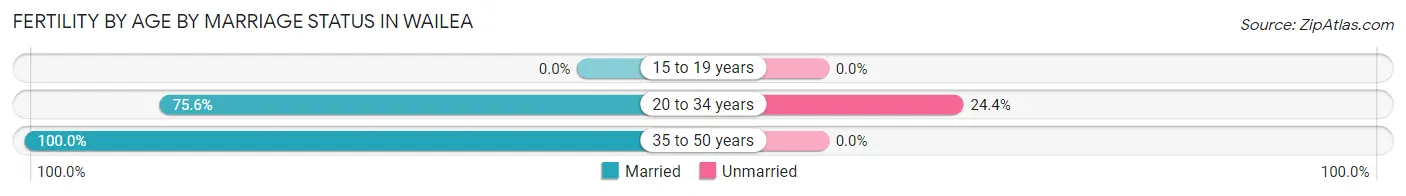
| Age Bracket | Married | Unmarried |
| 15 to 19 years | 0 (0.0%) | 0 (0.0%) |
| 20 to 34 years | 34 (75.6%) | 11 (24.4%) |
| 35 to 50 years | 5 (100.0%) | 0 (0.0%) |
| Total | 39 (78.0%) | 11 (22.0%) |
Fertility by Education in Wailea
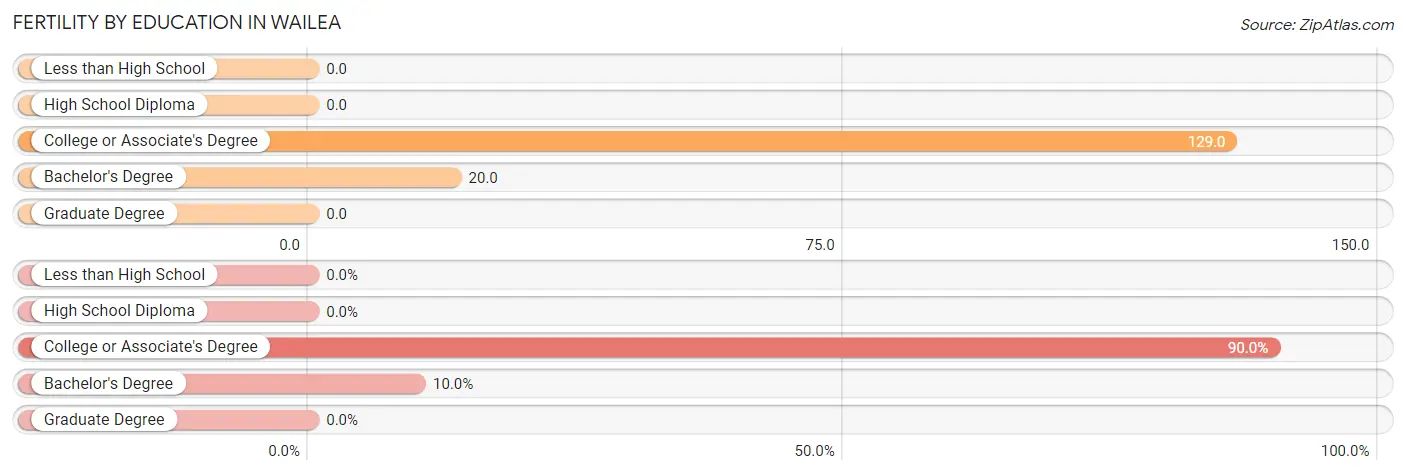
| Educational Attainment | Women with Births | Births / 1,000 Women |
| Less than High School | 0 (0.0%) | 0.0 |
| High School Diploma | 0 (0.0%) | 0.0 |
| College or Associate's Degree | 45 (90.0%) | 129.0 |
| Bachelor's Degree | 5 (10.0%) | 20.0 |
| Graduate Degree | 0 (0.0%) | 0.0 |
| Total | 50 (100.0%) | 40.0 |
Fertility by Education by Marriage Status in Wailea
22.0% of women with births in Wailea are unmarried. Women with the educational attainment of bachelor's degree are most likely to be married with 100.0% of them married at childbirth, while women with the educational attainment of college or associate's degree are least likely to be married with 24.4% of them unmarried at childbirth.
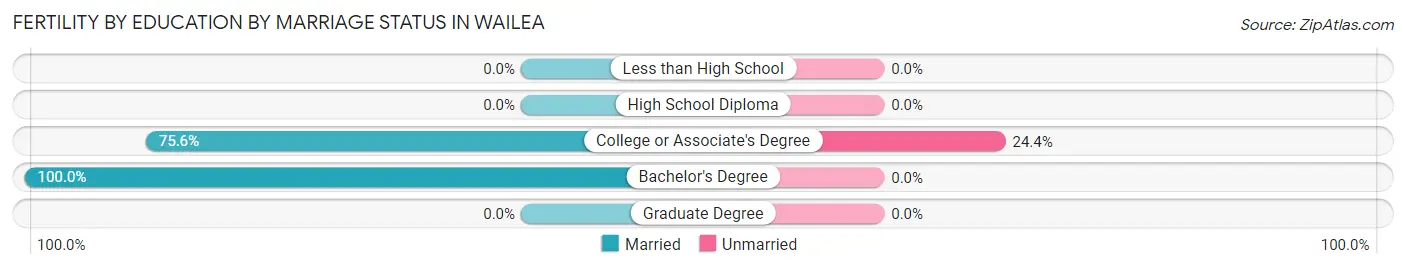
| Educational Attainment | Married | Unmarried |
| Less than High School | 0 (0.0%) | 0 (0.0%) |
| High School Diploma | 0 (0.0%) | 0 (0.0%) |
| College or Associate's Degree | 34 (75.6%) | 11 (24.4%) |
| Bachelor's Degree | 5 (100.0%) | 0 (0.0%) |
| Graduate Degree | 0 (0.0%) | 0 (0.0%) |
| Total | 39 (78.0%) | 11 (22.0%) |
Employment Characteristics in Wailea
Employment by Class of Employer in Wailea
Among the 2,843 employed individuals in Wailea, private company employees (1,617 | 56.9%), self-employed (not incorporated) (450 | 15.8%), and self-employed (incorporated) (264 | 9.3%) make up the most common classes of employment.
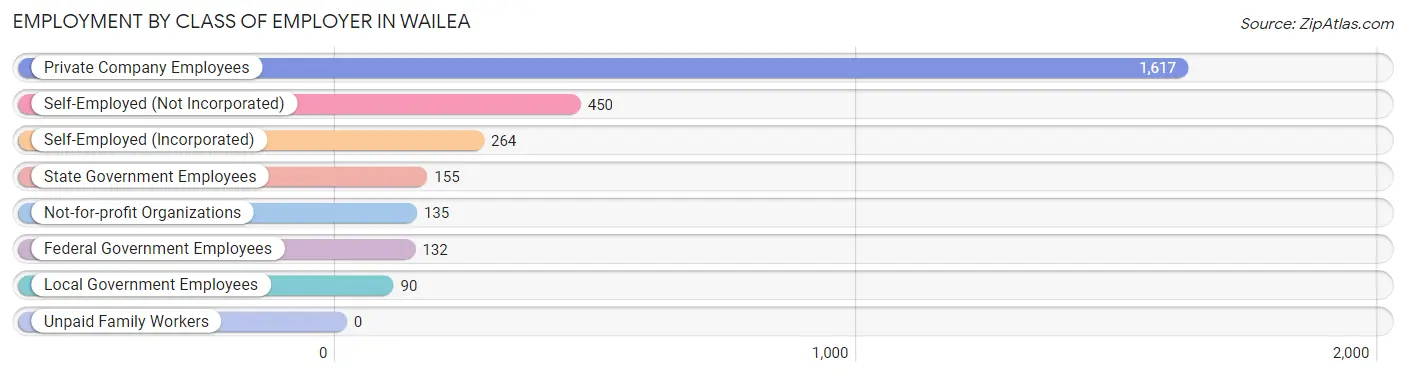
| Employer Class | # Employees | % Employees |
| Private Company Employees | 1,617 | 56.9% |
| Self-Employed (Incorporated) | 264 | 9.3% |
| Self-Employed (Not Incorporated) | 450 | 15.8% |
| Not-for-profit Organizations | 135 | 4.8% |
| Local Government Employees | 90 | 3.2% |
| State Government Employees | 155 | 5.4% |
| Federal Government Employees | 132 | 4.6% |
| Unpaid Family Workers | 0 | 0.0% |
| Total | 2,843 | 100.0% |
Employment Status by Age in Wailea
According to the labor force statistics for Wailea, out of the total population over 16 years of age (5,889), 54.7% or 3,221 individuals are in the labor force, with 5.8% or 187 of them unemployed. The age group with the highest labor force participation rate is 30 to 34 years, with 90.1% or 209 individuals in the labor force. Within the labor force, the 16 to 19 years age range has the highest percentage of unemployed individuals, with 86.7% or 91 of them being unemployed.
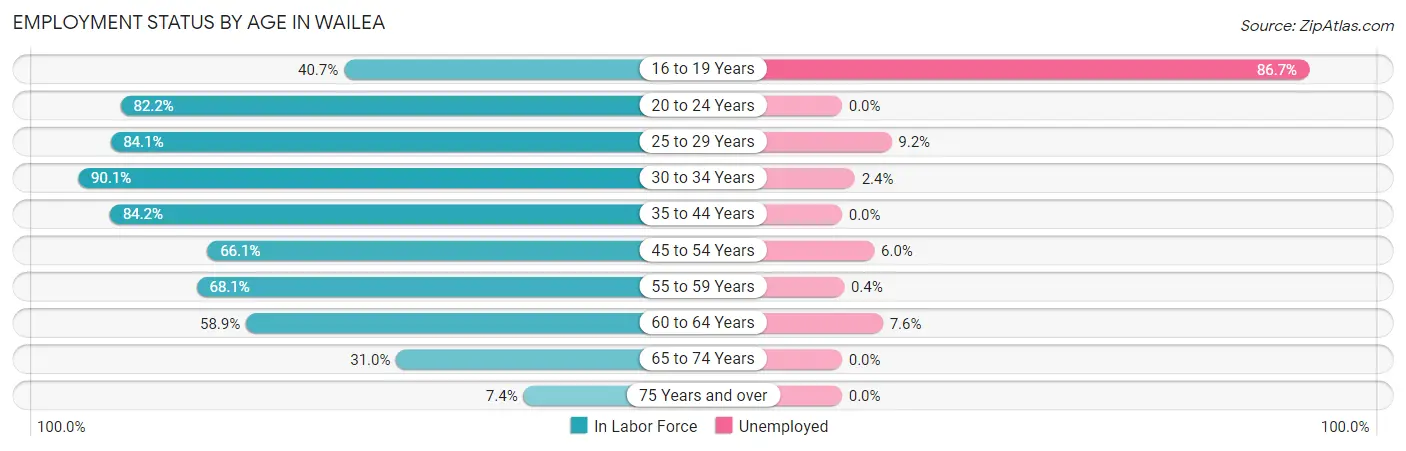
| Age Bracket | In Labor Force | Unemployed |
| 16 to 19 Years | 105 (40.7%) | 91 (86.7%) |
| 20 to 24 Years | 254 (82.2%) | 0 (0.0%) |
| 25 to 29 Years | 390 (84.1%) | 36 (9.2%) |
| 30 to 34 Years | 209 (90.1%) | 5 (2.4%) |
| 35 to 44 Years | 579 (84.2%) | 0 (0.0%) |
| 45 to 54 Years | 498 (66.1%) | 30 (6.0%) |
| 55 to 59 Years | 462 (68.1%) | 2 (0.4%) |
| 60 to 64 Years | 289 (58.9%) | 22 (7.6%) |
| 65 to 74 Years | 373 (31.0%) | 0 (0.0%) |
| 75 Years and over | 60 (7.4%) | 0 (0.0%) |
| Total | 3,221 (54.7%) | 187 (5.8%) |
Employment Status by Educational Attainment in Wailea
According to labor force statistics for Wailea, 73.4% of individuals (2,427) out of the total population between 25 and 64 years of age (3,306) are in the labor force, with 3.9% or 95 of them being unemployed. The group with the highest labor force participation rate are those with the educational attainment of college / associate degree, with 84.3% or 828 individuals in the labor force. Within the labor force, individuals with less than high school education have the highest percentage of unemployment, with 29.4% or 5 of them being unemployed.
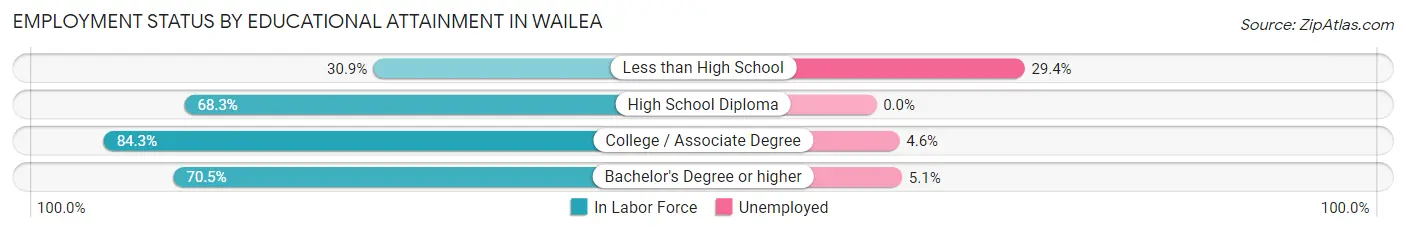
| Educational Attainment | In Labor Force | Unemployed |
| Less than High School | 17 (30.9%) | 16 (29.4%) |
| High School Diploma | 557 (68.3%) | 0 (0.0%) |
| College / Associate Degree | 828 (84.3%) | 45 (4.6%) |
| Bachelor's Degree or higher | 1,024 (70.5%) | 74 (5.1%) |
| Total | 2,427 (73.4%) | 129 (3.9%) |
Employment Occupations by Sex in Wailea
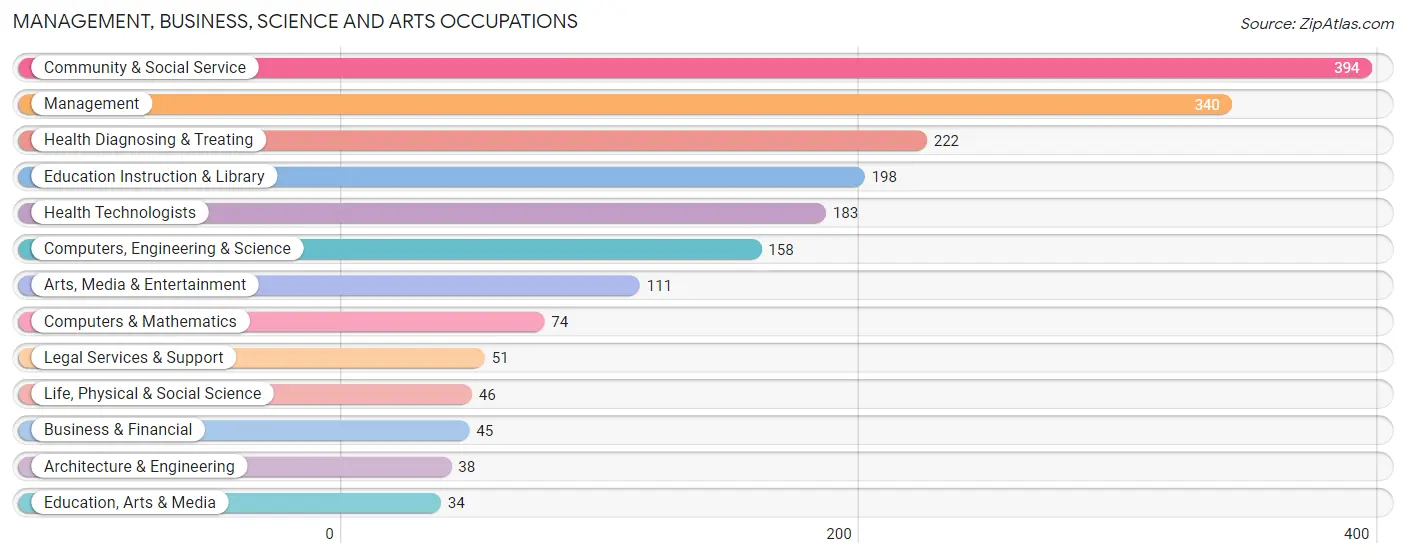
Management, Business, Science and Arts Occupations
The most common Management, Business, Science and Arts occupations in Wailea are Community & Social Service (394 | 13.0%), Management (340 | 11.2%), Health Diagnosing & Treating (222 | 7.3%), Education Instruction & Library (198 | 6.6%), and Health Technologists (183 | 6.0%).
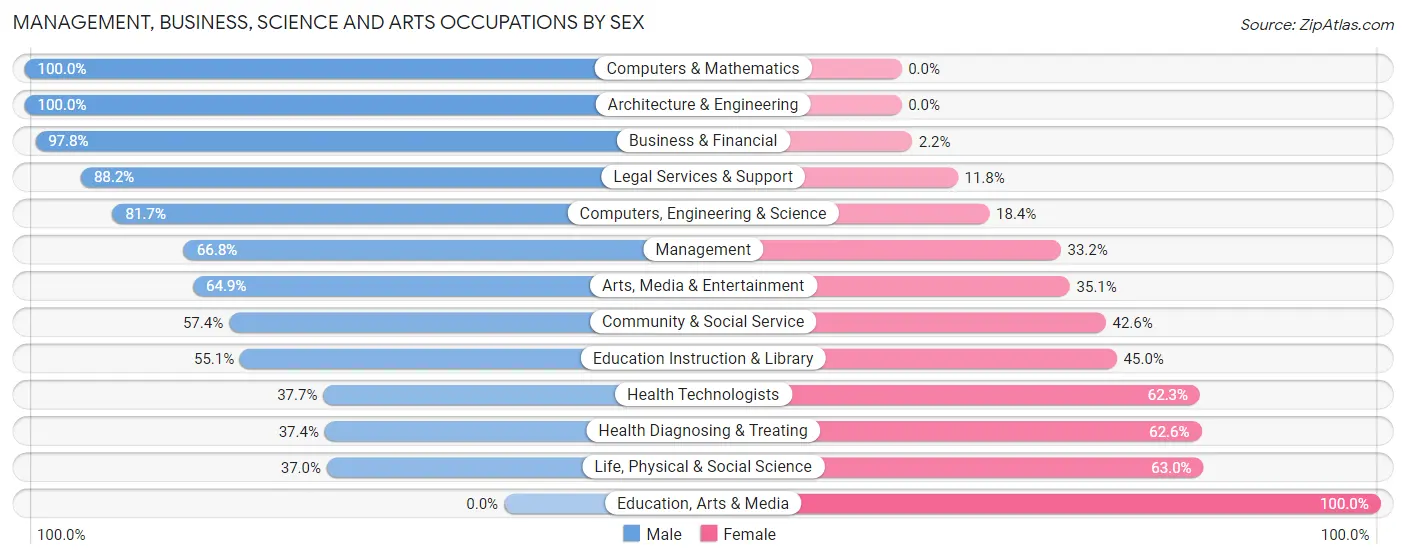
Management, Business, Science and Arts Occupations by Sex
Within the Management, Business, Science and Arts occupations in Wailea, the most male-oriented occupations are Computers & Mathematics (100.0%), Architecture & Engineering (100.0%), and Business & Financial (97.8%), while the most female-oriented occupations are Education, Arts & Media (100.0%), Life, Physical & Social Science (63.0%), and Health Diagnosing & Treating (62.6%).
| Occupation | Male | Female |
| Management | 227 (66.8%) | 113 (33.2%) |
| Business & Financial | 44 (97.8%) | 1 (2.2%) |
| Computers, Engineering & Science | 129 (81.7%) | 29 (18.3%) |
| Computers & Mathematics | 74 (100.0%) | 0 (0.0%) |
| Architecture & Engineering | 38 (100.0%) | 0 (0.0%) |
| Life, Physical & Social Science | 17 (37.0%) | 29 (63.0%) |
| Community & Social Service | 226 (57.4%) | 168 (42.6%) |
| Education, Arts & Media | 0 (0.0%) | 34 (100.0%) |
| Legal Services & Support | 45 (88.2%) | 6 (11.8%) |
| Education Instruction & Library | 109 (55.0%) | 89 (45.0%) |
| Arts, Media & Entertainment | 72 (64.9%) | 39 (35.1%) |
| Health Diagnosing & Treating | 83 (37.4%) | 139 (62.6%) |
| Health Technologists | 69 (37.7%) | 114 (62.3%) |
| Total (Category) | 709 (61.2%) | 450 (38.8%) |
| Total (Overall) | 1,762 (58.3%) | 1,263 (41.7%) |
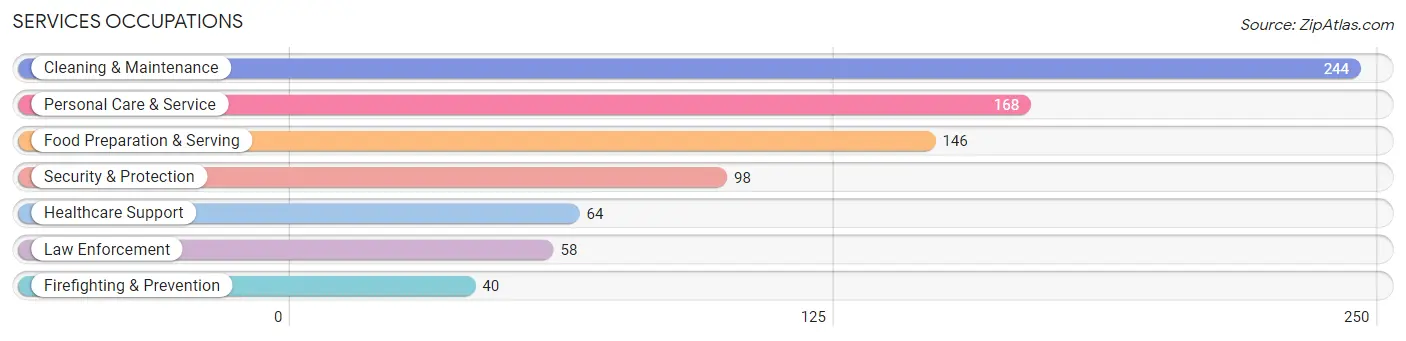
Services Occupations
The most common Services occupations in Wailea are Cleaning & Maintenance (244 | 8.1%), Personal Care & Service (168 | 5.6%), Food Preparation & Serving (146 | 4.8%), Security & Protection (98 | 3.2%), and Healthcare Support (64 | 2.1%).
Services Occupations by Sex
Within the Services occupations in Wailea, the most male-oriented occupations are Security & Protection (100.0%), Firefighting & Prevention (100.0%), and Law Enforcement (100.0%), while the most female-oriented occupations are Cleaning & Maintenance (65.6%), Healthcare Support (62.5%), and Personal Care & Service (59.5%).
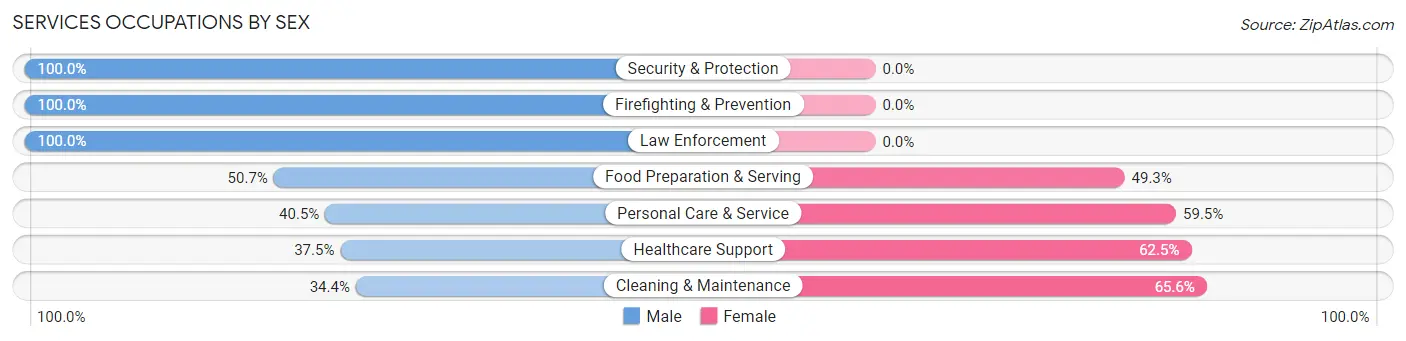
| Occupation | Male | Female |
| Healthcare Support | 24 (37.5%) | 40 (62.5%) |
| Security & Protection | 98 (100.0%) | 0 (0.0%) |
| Firefighting & Prevention | 40 (100.0%) | 0 (0.0%) |
| Law Enforcement | 58 (100.0%) | 0 (0.0%) |
| Food Preparation & Serving | 74 (50.7%) | 72 (49.3%) |
| Cleaning & Maintenance | 84 (34.4%) | 160 (65.6%) |
| Personal Care & Service | 68 (40.5%) | 100 (59.5%) |
| Total (Category) | 348 (48.3%) | 372 (51.7%) |
| Total (Overall) | 1,762 (58.3%) | 1,263 (41.7%) |
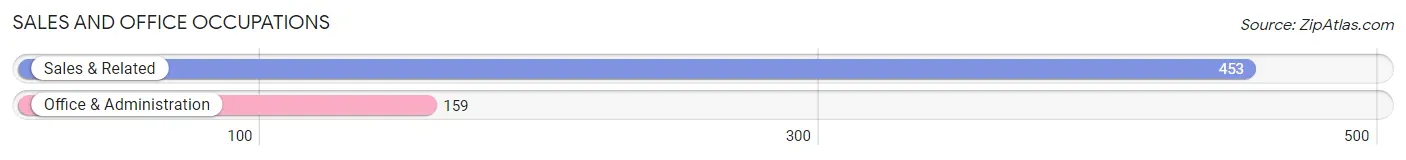
Sales and Office Occupations
The most common Sales and Office occupations in Wailea are Sales & Related (453 | 15.0%), and Office & Administration (159 | 5.3%).
Sales and Office Occupations by Sex
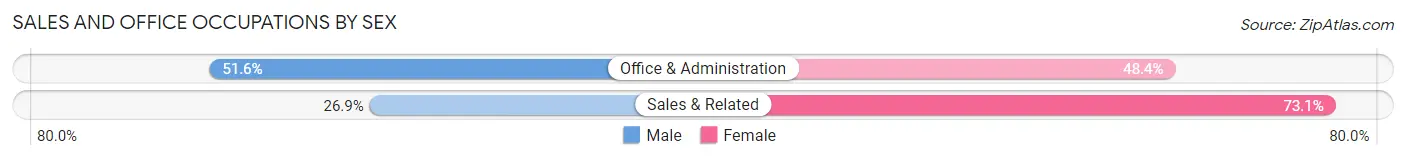
| Occupation | Male | Female |
| Sales & Related | 122 (26.9%) | 331 (73.1%) |
| Office & Administration | 82 (51.6%) | 77 (48.4%) |
| Total (Category) | 204 (33.3%) | 408 (66.7%) |
| Total (Overall) | 1,762 (58.3%) | 1,263 (41.7%) |
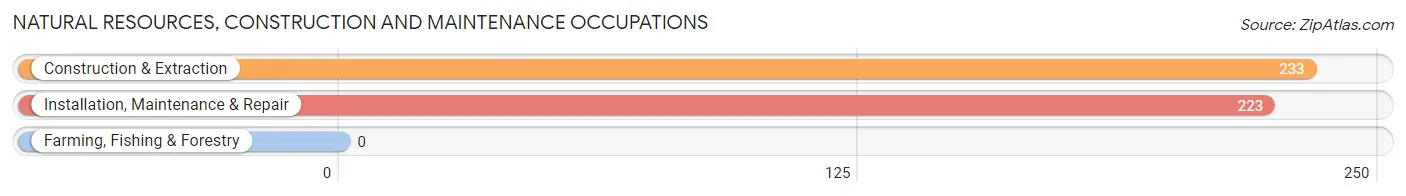
Natural Resources, Construction and Maintenance Occupations
The most common Natural Resources, Construction and Maintenance occupations in Wailea are Construction & Extraction (233 | 7.7%), and Installation, Maintenance & Repair (223 | 7.4%).
Natural Resources, Construction and Maintenance Occupations by Sex
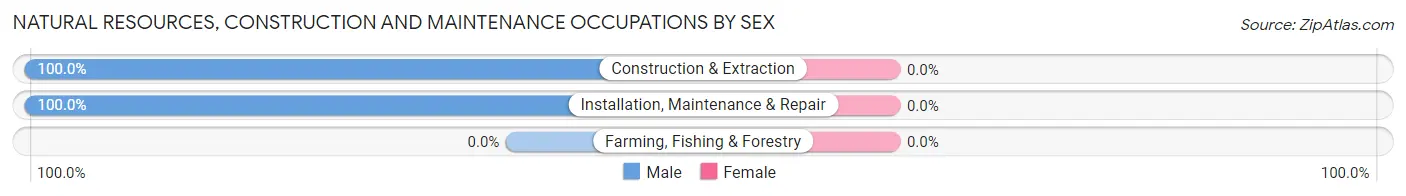
| Occupation | Male | Female |
| Farming, Fishing & Forestry | 0 (0.0%) | 0 (0.0%) |
| Construction & Extraction | 233 (100.0%) | 0 (0.0%) |
| Installation, Maintenance & Repair | 223 (100.0%) | 0 (0.0%) |
| Total (Category) | 456 (100.0%) | 0 (0.0%) |
| Total (Overall) | 1,762 (58.3%) | 1,263 (41.7%) |
Production, Transportation and Moving Occupations
The most common Production, Transportation and Moving occupations in Wailea are Transportation (66 | 2.2%), and Production (12 | 0.4%).
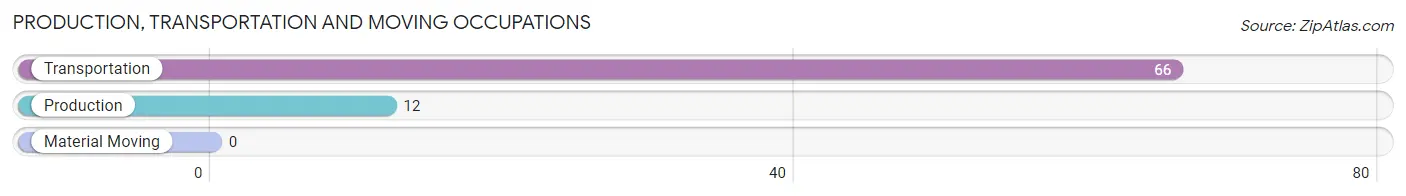
Production, Transportation and Moving Occupations by Sex
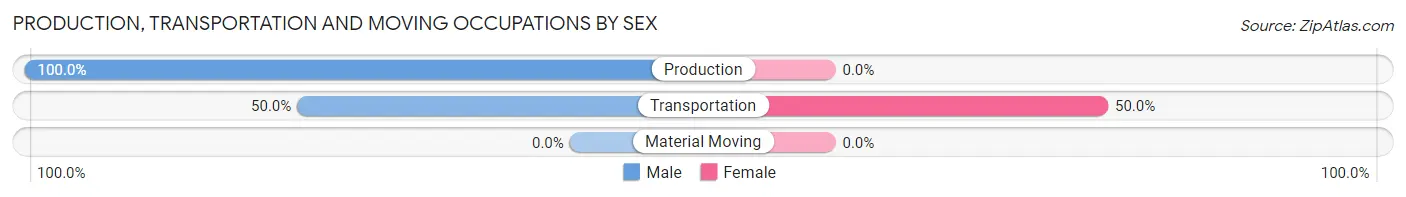
| Occupation | Male | Female |
| Production | 12 (100.0%) | 0 (0.0%) |
| Transportation | 33 (50.0%) | 33 (50.0%) |
| Material Moving | 0 (0.0%) | 0 (0.0%) |
| Total (Category) | 45 (57.7%) | 33 (42.3%) |
| Total (Overall) | 1,762 (58.3%) | 1,263 (41.7%) |
Employment Industries by Sex in Wailea
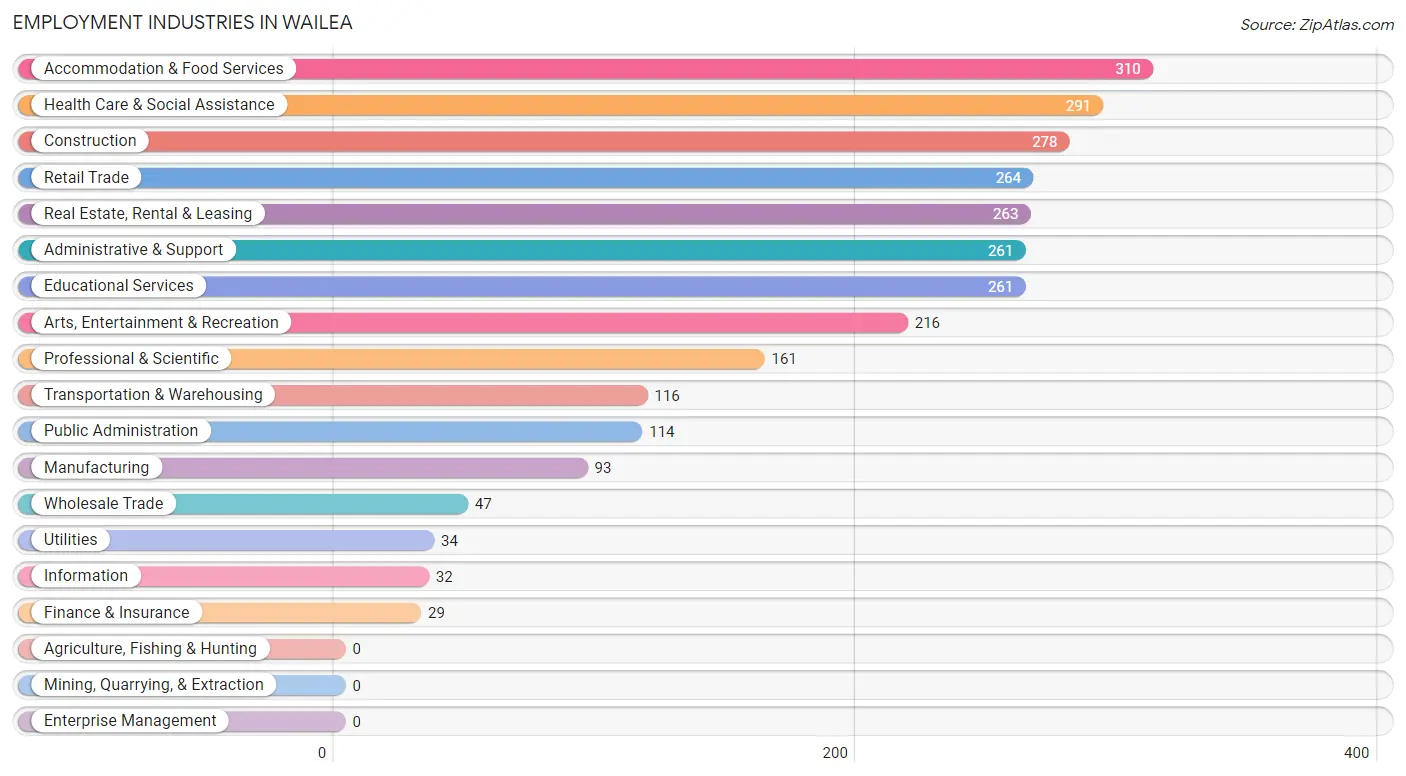
Employment Industries in Wailea
The major employment industries in Wailea include Accommodation & Food Services (310 | 10.2%), Health Care & Social Assistance (291 | 9.6%), Construction (278 | 9.2%), Retail Trade (264 | 8.7%), and Real Estate, Rental & Leasing (263 | 8.7%).
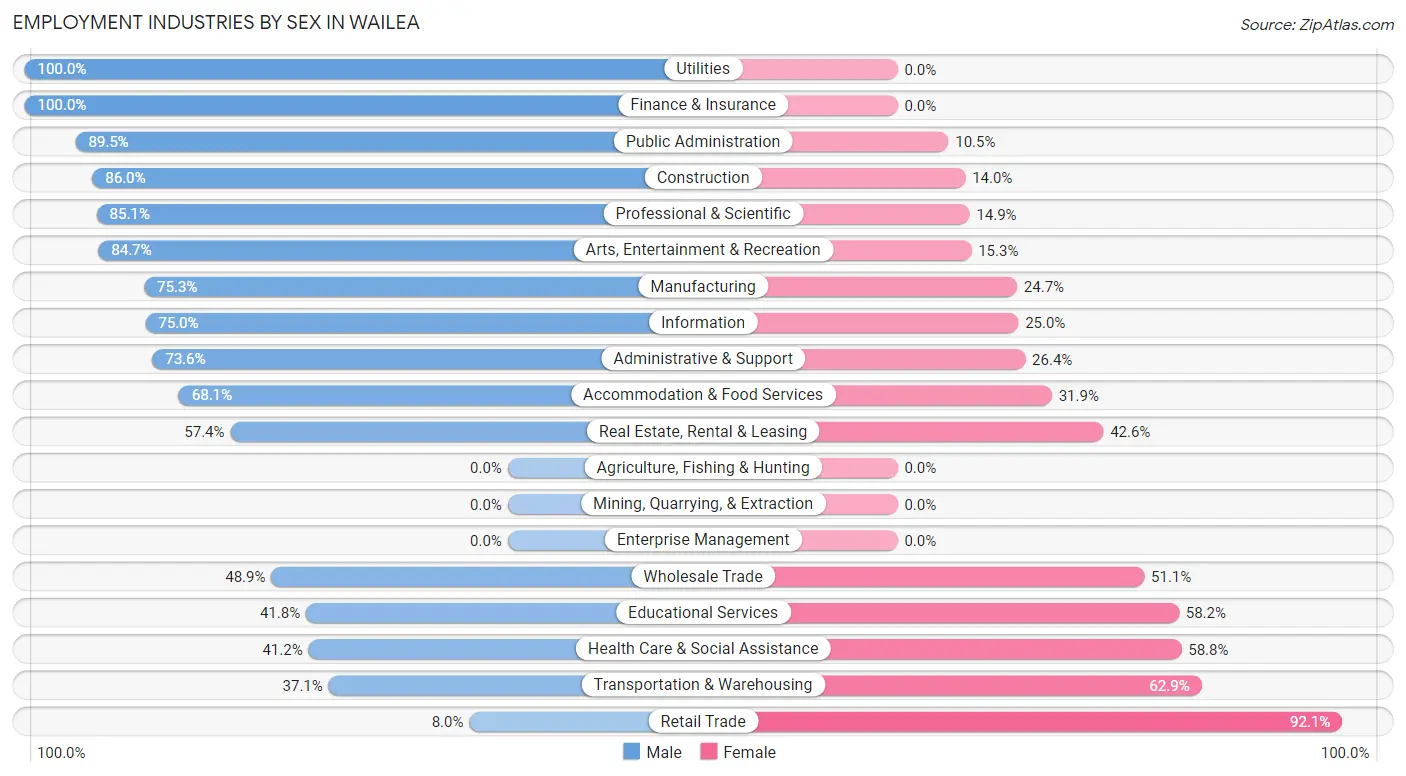
Employment Industries by Sex in Wailea
The Wailea industries that see more men than women are Utilities (100.0%), Finance & Insurance (100.0%), and Public Administration (89.5%), whereas the industries that tend to have a higher number of women are Retail Trade (92.0%), Transportation & Warehousing (62.9%), and Health Care & Social Assistance (58.8%).
| Industry | Male | Female |
| Agriculture, Fishing & Hunting | 0 (0.0%) | 0 (0.0%) |
| Mining, Quarrying, & Extraction | 0 (0.0%) | 0 (0.0%) |
| Construction | 239 (86.0%) | 39 (14.0%) |
| Manufacturing | 70 (75.3%) | 23 (24.7%) |
| Wholesale Trade | 23 (48.9%) | 24 (51.1%) |
| Retail Trade | 21 (8.0%) | 243 (92.0%) |
| Transportation & Warehousing | 43 (37.1%) | 73 (62.9%) |
| Utilities | 34 (100.0%) | 0 (0.0%) |
| Information | 24 (75.0%) | 8 (25.0%) |
| Finance & Insurance | 29 (100.0%) | 0 (0.0%) |
| Real Estate, Rental & Leasing | 151 (57.4%) | 112 (42.6%) |
| Professional & Scientific | 137 (85.1%) | 24 (14.9%) |
| Enterprise Management | 0 (0.0%) | 0 (0.0%) |
| Administrative & Support | 192 (73.6%) | 69 (26.4%) |
| Educational Services | 109 (41.8%) | 152 (58.2%) |
| Health Care & Social Assistance | 120 (41.2%) | 171 (58.8%) |
| Arts, Entertainment & Recreation | 183 (84.7%) | 33 (15.3%) |
| Accommodation & Food Services | 211 (68.1%) | 99 (31.9%) |
| Public Administration | 102 (89.5%) | 12 (10.5%) |
| Total | 1,762 (58.3%) | 1,263 (41.7%) |
Education in Wailea
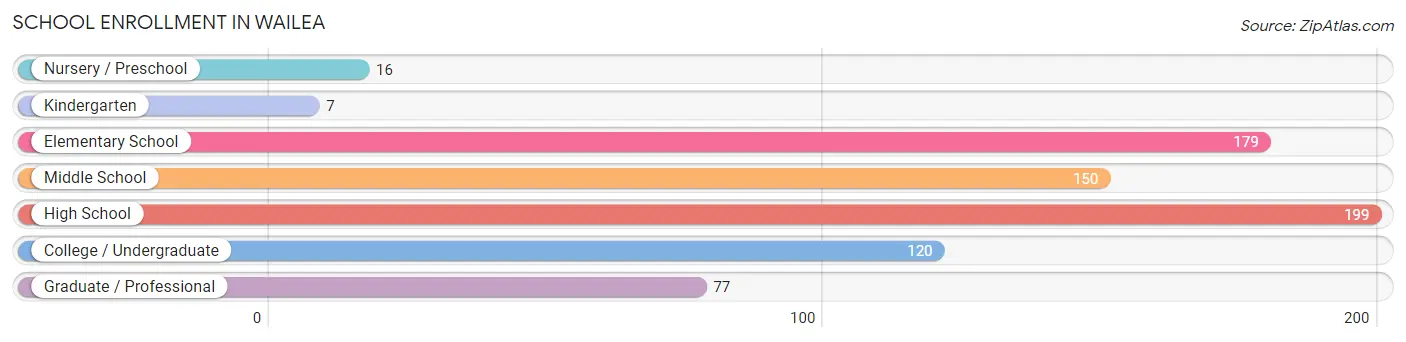
School Enrollment in Wailea
The most common levels of schooling among the 748 students in Wailea are high school (199 | 26.6%), elementary school (179 | 23.9%), and middle school (150 | 20.1%).
| School Level | # Students | % Students |
| Nursery / Preschool | 16 | 2.1% |
| Kindergarten | 7 | 0.9% |
| Elementary School | 179 | 23.9% |
| Middle School | 150 | 20.1% |
| High School | 199 | 26.6% |
| College / Undergraduate | 120 | 16.0% |
| Graduate / Professional | 77 | 10.3% |
| Total | 748 | 100.0% |
School Enrollment by Age by Funding Source in Wailea
Out of a total of 748 students who are enrolled in schools in Wailea, 310 (41.4%) attend a private institution, while the remaining 438 (58.6%) are enrolled in public schools. The age group of 3 to 4 year olds has the highest likelihood of being enrolled in private schools, with 9 (100.0% in the age bracket) enrolled. Conversely, the age group of 25 to 34 year olds has the lowest likelihood of being enrolled in a private school, with 21 (100.0% in the age bracket) attending a public institution.
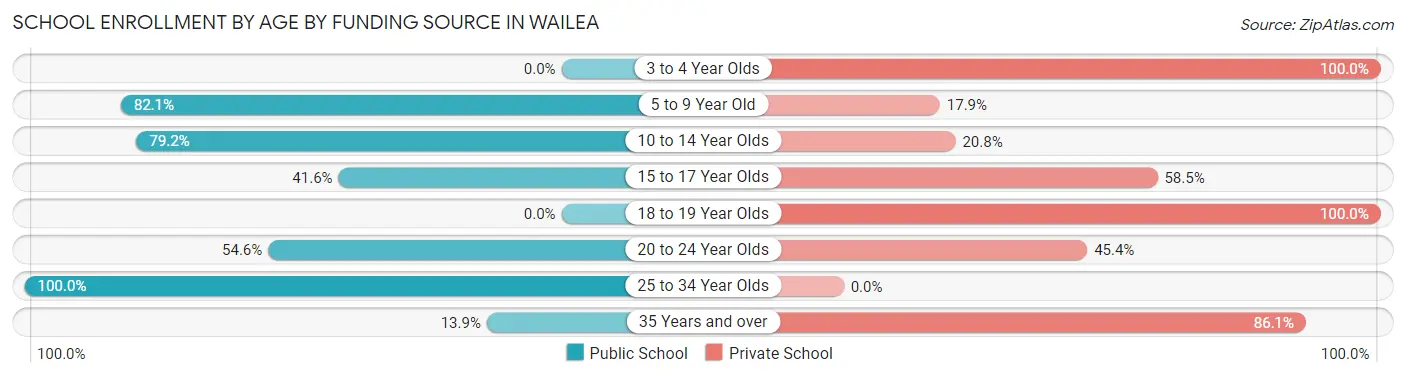
| Age Bracket | Public School | Private School |
| 3 to 4 Year Olds | 0 (0.0%) | 9 (100.0%) |
| 5 to 9 Year Old | 142 (82.1%) | 31 (17.9%) |
| 10 to 14 Year Olds | 152 (79.2%) | 40 (20.8%) |
| 15 to 17 Year Olds | 59 (41.5%) | 83 (58.5%) |
| 18 to 19 Year Olds | 0 (0.0%) | 35 (100.0%) |
| 20 to 24 Year Olds | 53 (54.6%) | 44 (45.4%) |
| 25 to 34 Year Olds | 21 (100.0%) | 0 (0.0%) |
| 35 Years and over | 11 (13.9%) | 68 (86.1%) |
| Total | 438 (58.6%) | 310 (41.4%) |
Educational Attainment by Field of Study in Wailea
Business (524 | 19.6%), science & technology (286 | 10.7%), social sciences (241 | 9.0%), education (200 | 7.5%), and bio, nature & agricultural (193 | 7.2%) are the most common fields of study among 2,677 individuals in Wailea who have obtained a bachelor's degree or higher.
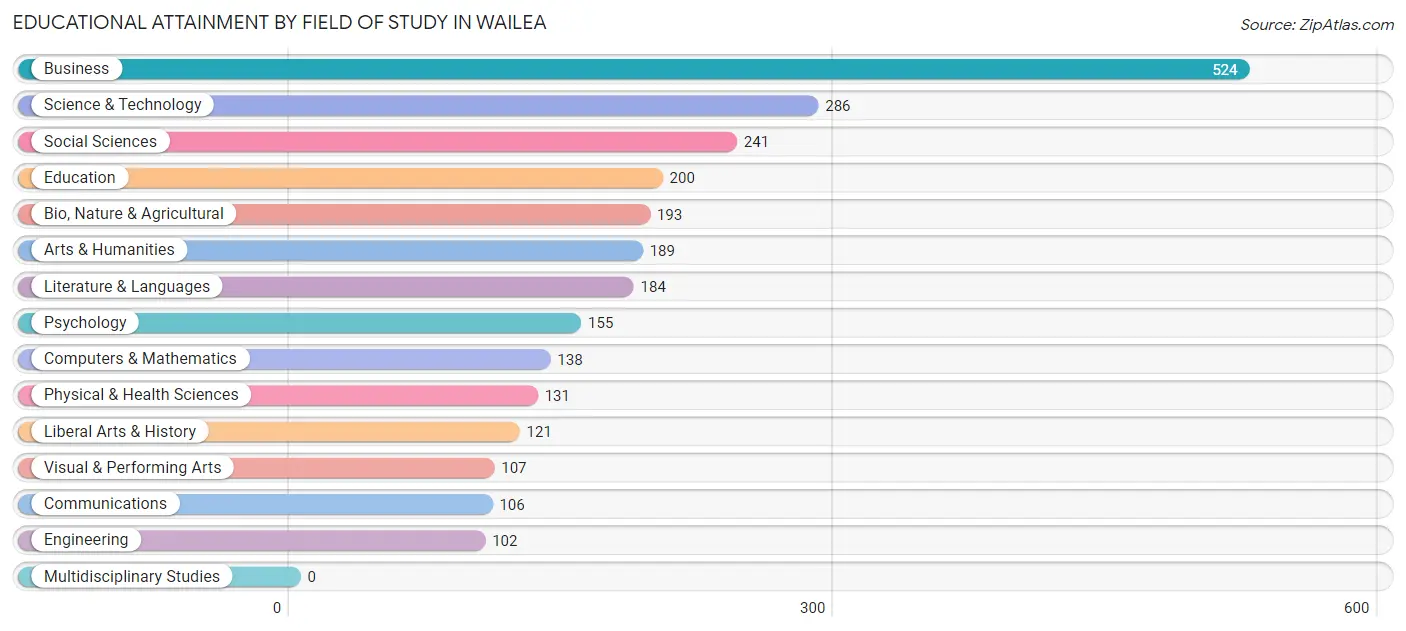
| Field of Study | # Graduates | % Graduates |
| Computers & Mathematics | 138 | 5.2% |
| Bio, Nature & Agricultural | 193 | 7.2% |
| Physical & Health Sciences | 131 | 4.9% |
| Psychology | 155 | 5.8% |
| Social Sciences | 241 | 9.0% |
| Engineering | 102 | 3.8% |
| Multidisciplinary Studies | 0 | 0.0% |
| Science & Technology | 286 | 10.7% |
| Business | 524 | 19.6% |
| Education | 200 | 7.5% |
| Literature & Languages | 184 | 6.9% |
| Liberal Arts & History | 121 | 4.5% |
| Visual & Performing Arts | 107 | 4.0% |
| Communications | 106 | 4.0% |
| Arts & Humanities | 189 | 7.1% |
| Total | 2,677 | 100.0% |
Transportation & Commute in Wailea
Vehicle Availability by Sex in Wailea
The most prevalent vehicle ownership categories in Wailea are males with 2 vehicles (704, accounting for 43.7%) and females with 2 vehicles (431, making up 57.5%).
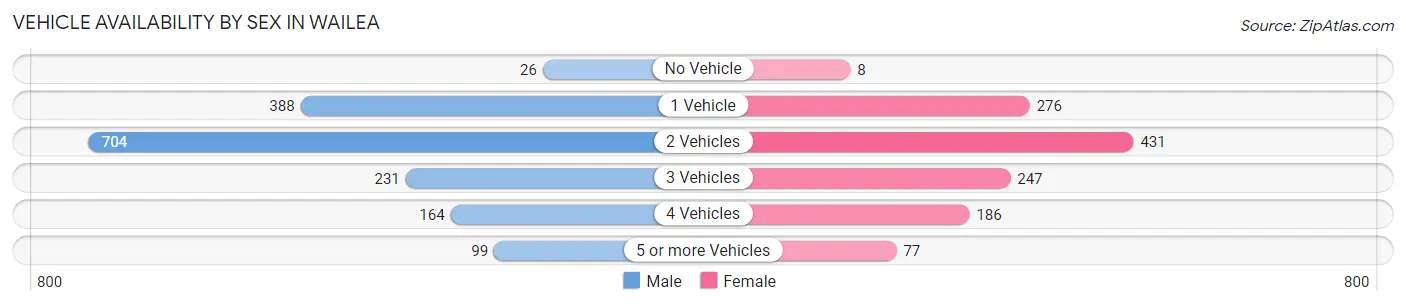
| Vehicles Available | Male | Female |
| No Vehicle | 26 (1.6%) | 8 (0.6%) |
| 1 Vehicle | 388 (24.1%) | 276 (22.5%) |
| 2 Vehicles | 704 (43.7%) | 431 (35.2%) |
| 3 Vehicles | 231 (14.3%) | 247 (20.2%) |
| 4 Vehicles | 164 (10.2%) | 186 (15.2%) |
| 5 or more Vehicles | 99 (6.1%) | 77 (6.3%) |
| Total | 1,612 (100.0%) | 1,225 (100.0%) |
Commute Time in Wailea
The most frequently occuring commute durations in Wailea are 10 to 14 minutes (562 commuters, 25.4%), 5 to 9 minutes (448 commuters, 20.3%), and 30 to 34 minutes (274 commuters, 12.4%).
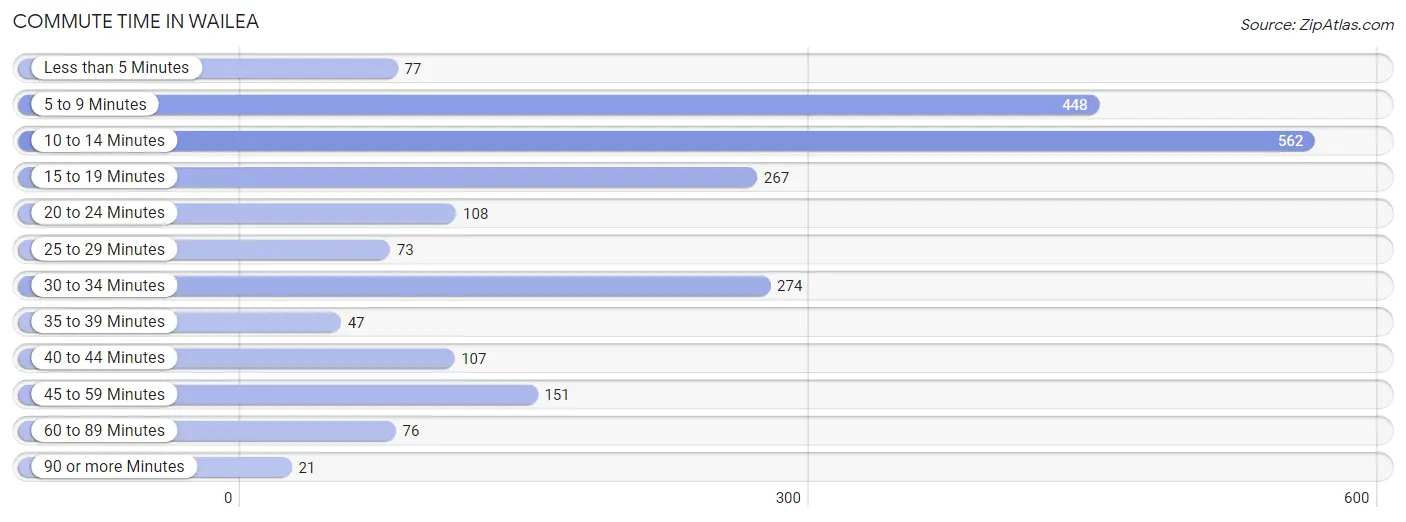
| Commute Time | # Commuters | % Commuters |
| Less than 5 Minutes | 77 | 3.5% |
| 5 to 9 Minutes | 448 | 20.3% |
| 10 to 14 Minutes | 562 | 25.4% |
| 15 to 19 Minutes | 267 | 12.1% |
| 20 to 24 Minutes | 108 | 4.9% |
| 25 to 29 Minutes | 73 | 3.3% |
| 30 to 34 Minutes | 274 | 12.4% |
| 35 to 39 Minutes | 47 | 2.1% |
| 40 to 44 Minutes | 107 | 4.8% |
| 45 to 59 Minutes | 151 | 6.8% |
| 60 to 89 Minutes | 76 | 3.4% |
| 90 or more Minutes | 21 | 0.9% |
Commute Time by Sex in Wailea
The most common commute times in Wailea are 10 to 14 minutes (286 commuters, 23.3%) for males and 10 to 14 minutes (276 commuters, 28.1%) for females.
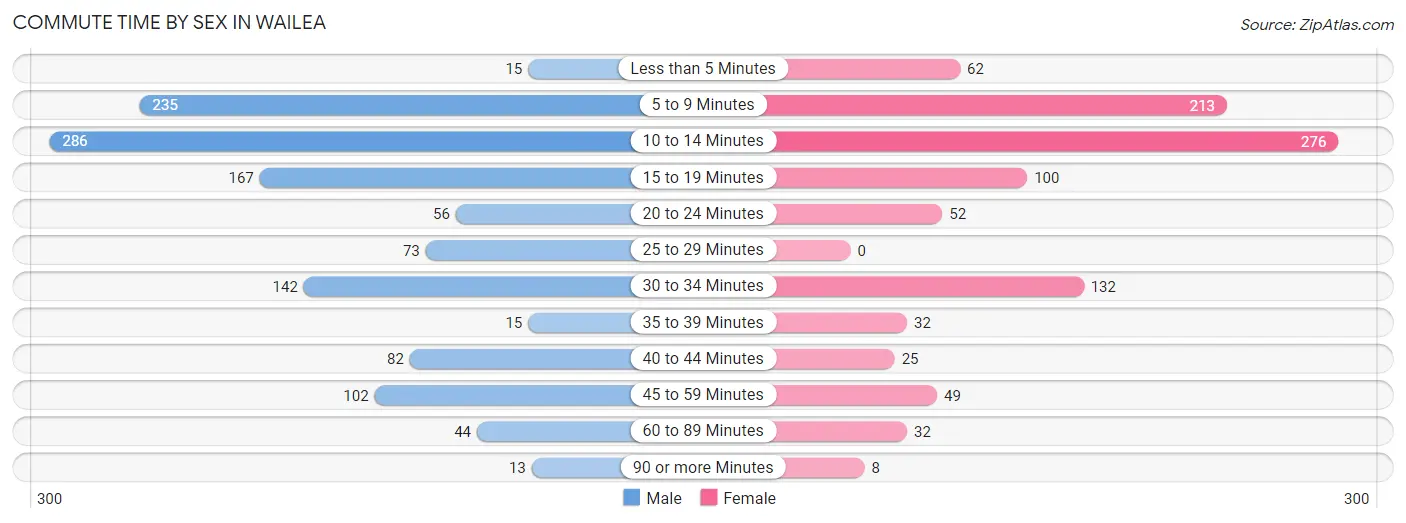
| Commute Time | Male | Female |
| Less than 5 Minutes | 15 (1.2%) | 62 (6.3%) |
| 5 to 9 Minutes | 235 (19.1%) | 213 (21.7%) |
| 10 to 14 Minutes | 286 (23.3%) | 276 (28.1%) |
| 15 to 19 Minutes | 167 (13.6%) | 100 (10.2%) |
| 20 to 24 Minutes | 56 (4.5%) | 52 (5.3%) |
| 25 to 29 Minutes | 73 (5.9%) | 0 (0.0%) |
| 30 to 34 Minutes | 142 (11.5%) | 132 (13.5%) |
| 35 to 39 Minutes | 15 (1.2%) | 32 (3.3%) |
| 40 to 44 Minutes | 82 (6.7%) | 25 (2.5%) |
| 45 to 59 Minutes | 102 (8.3%) | 49 (5.0%) |
| 60 to 89 Minutes | 44 (3.6%) | 32 (3.3%) |
| 90 or more Minutes | 13 (1.1%) | 8 (0.8%) |
Time of Departure to Work by Sex in Wailea
The most frequent times of departure to work in Wailea are 6:30 AM to 6:59 AM (174, 14.1%) for males and 9:00 AM to 9:59 AM (158, 16.1%) for females.
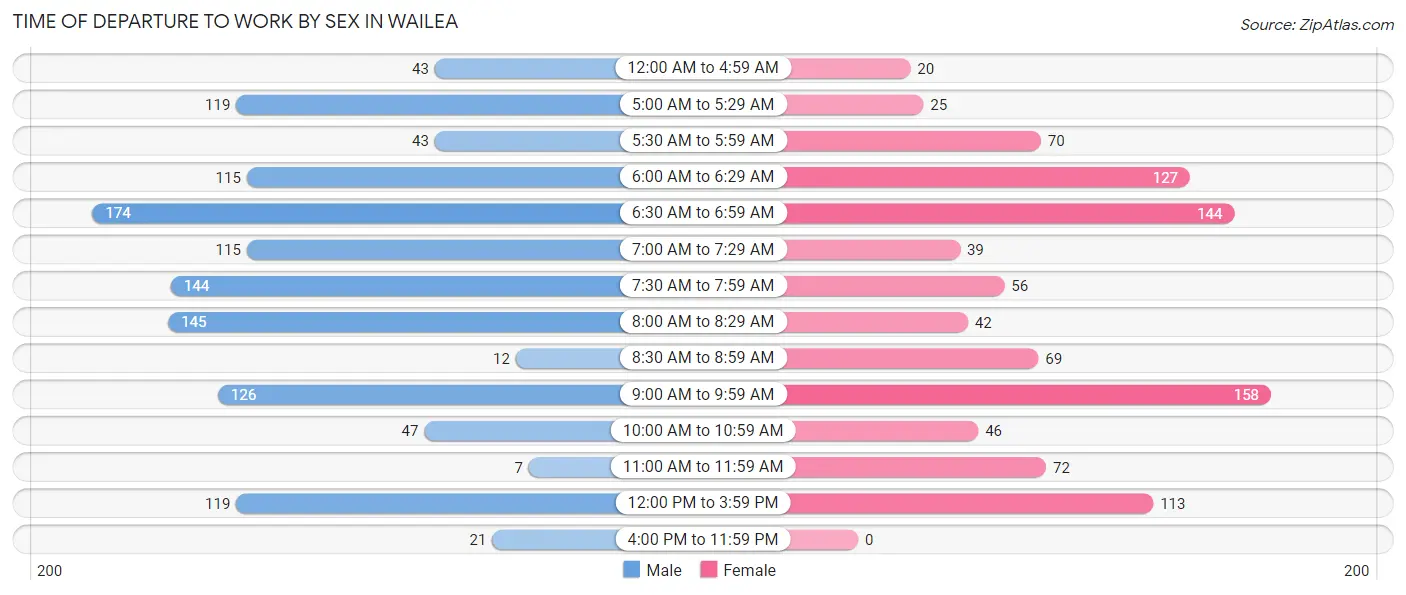
| Time of Departure | Male | Female |
| 12:00 AM to 4:59 AM | 43 (3.5%) | 20 (2.0%) |
| 5:00 AM to 5:29 AM | 119 (9.7%) | 25 (2.5%) |
| 5:30 AM to 5:59 AM | 43 (3.5%) | 70 (7.1%) |
| 6:00 AM to 6:29 AM | 115 (9.3%) | 127 (13.0%) |
| 6:30 AM to 6:59 AM | 174 (14.1%) | 144 (14.7%) |
| 7:00 AM to 7:29 AM | 115 (9.3%) | 39 (4.0%) |
| 7:30 AM to 7:59 AM | 144 (11.7%) | 56 (5.7%) |
| 8:00 AM to 8:29 AM | 145 (11.8%) | 42 (4.3%) |
| 8:30 AM to 8:59 AM | 12 (1.0%) | 69 (7.0%) |
| 9:00 AM to 9:59 AM | 126 (10.2%) | 158 (16.1%) |
| 10:00 AM to 10:59 AM | 47 (3.8%) | 46 (4.7%) |
| 11:00 AM to 11:59 AM | 7 (0.6%) | 72 (7.3%) |
| 12:00 PM to 3:59 PM | 119 (9.7%) | 113 (11.5%) |
| 4:00 PM to 11:59 PM | 21 (1.7%) | 0 (0.0%) |
| Total | 1,230 (100.0%) | 981 (100.0%) |
Housing Occupancy in Wailea
Occupancy by Ownership in Wailea
Of the total 2,857 dwellings in Wailea, owner-occupied units account for 1,840 (64.4%), while renter-occupied units make up 1,017 (35.6%).
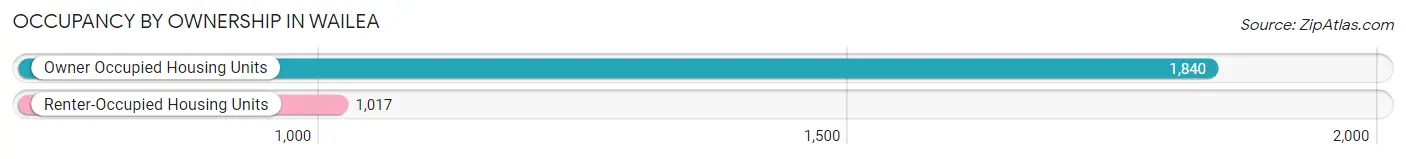
| Occupancy | # Housing Units | % Housing Units |
| Owner Occupied Housing Units | 1,840 | 64.4% |
| Renter-Occupied Housing Units | 1,017 | 35.6% |
| Total Occupied Housing Units | 2,857 | 100.0% |
Occupancy by Household Size in Wailea
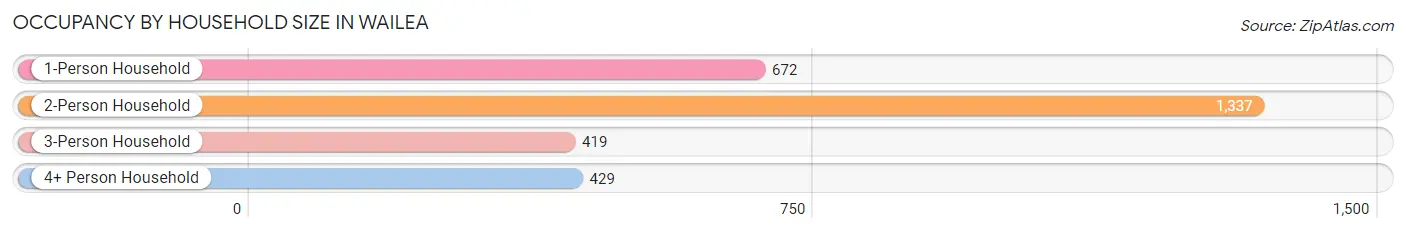
| Household Size | # Housing Units | % Housing Units |
| 1-Person Household | 672 | 23.5% |
| 2-Person Household | 1,337 | 46.8% |
| 3-Person Household | 419 | 14.7% |
| 4+ Person Household | 429 | 15.0% |
| Total Housing Units | 2,857 | 100.0% |
Occupancy by Ownership by Household Size in Wailea
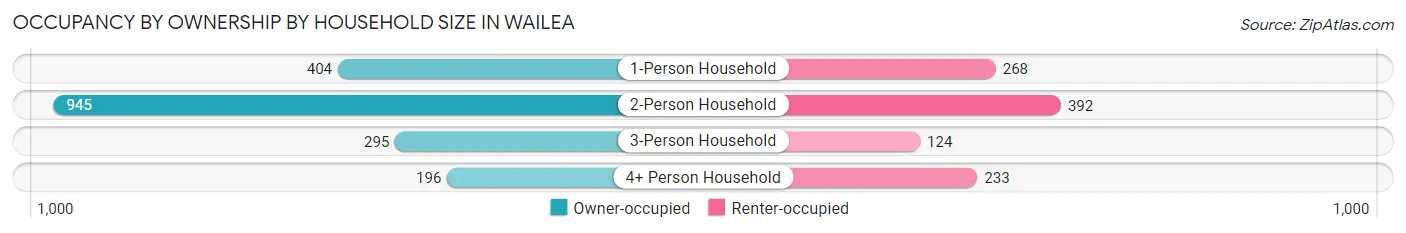
| Household Size | Owner-occupied | Renter-occupied |
| 1-Person Household | 404 (60.1%) | 268 (39.9%) |
| 2-Person Household | 945 (70.7%) | 392 (29.3%) |
| 3-Person Household | 295 (70.4%) | 124 (29.6%) |
| 4+ Person Household | 196 (45.7%) | 233 (54.3%) |
| Total Housing Units | 1,840 (64.4%) | 1,017 (35.6%) |
Occupancy by Educational Attainment in Wailea
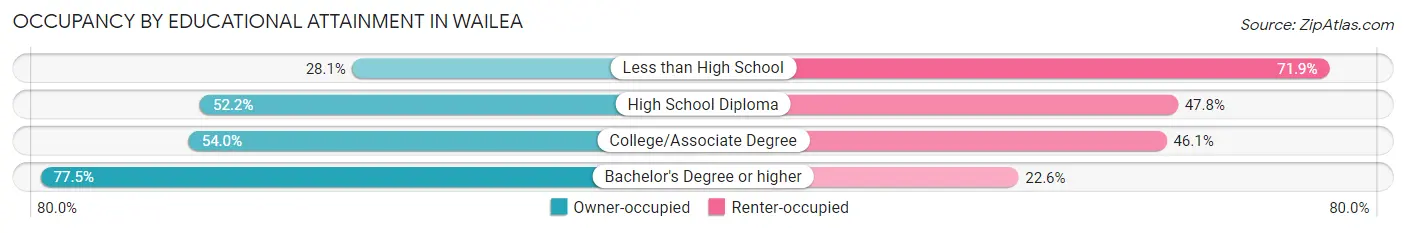
| Household Size | Owner-occupied | Renter-occupied |
| Less than High School | 9 (28.1%) | 23 (71.9%) |
| High School Diploma | 289 (52.2%) | 265 (47.8%) |
| College/Associate Degree | 498 (53.9%) | 425 (46.1%) |
| Bachelor's Degree or higher | 1,044 (77.4%) | 304 (22.6%) |
Occupancy by Age of Householder in Wailea
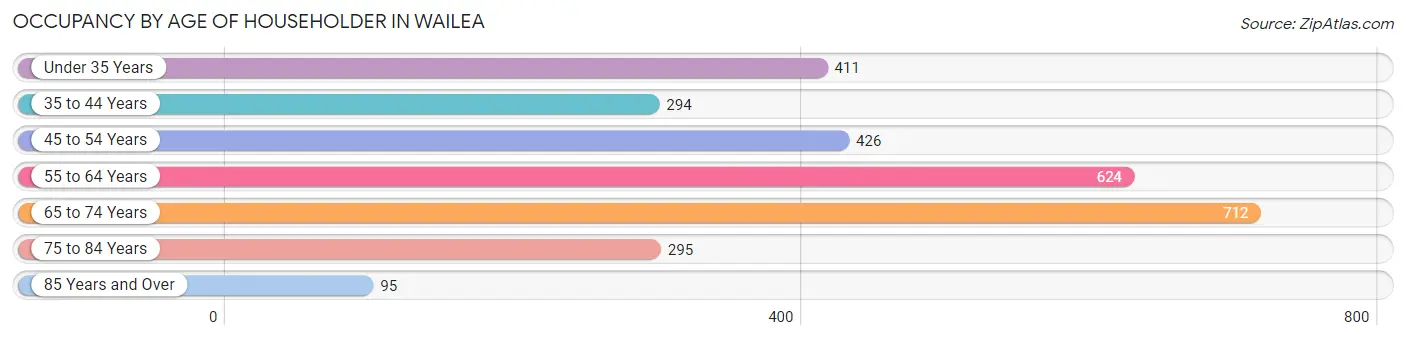
| Age Bracket | # Households | % Households |
| Under 35 Years | 411 | 14.4% |
| 35 to 44 Years | 294 | 10.3% |
| 45 to 54 Years | 426 | 14.9% |
| 55 to 64 Years | 624 | 21.8% |
| 65 to 74 Years | 712 | 24.9% |
| 75 to 84 Years | 295 | 10.3% |
| 85 Years and Over | 95 | 3.3% |
| Total | 2,857 | 100.0% |
Housing Finances in Wailea
Median Income by Occupancy in Wailea
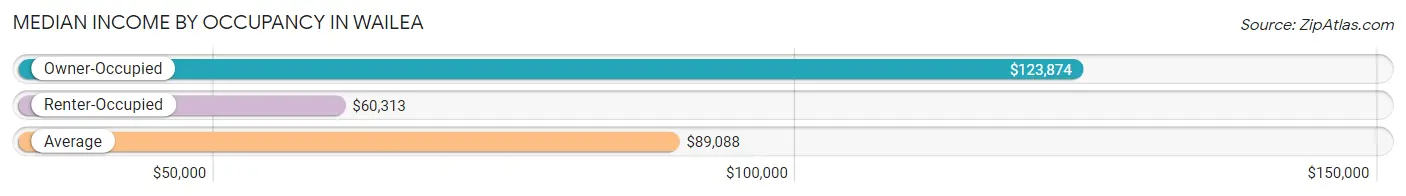
| Occupancy Type | # Households | Median Income |
| Owner-Occupied | 1,840 (64.4%) | $123,874 |
| Renter-Occupied | 1,017 (35.6%) | $60,313 |
| Average | 2,857 (100.0%) | $89,088 |
Occupancy by Householder Income Bracket in Wailea
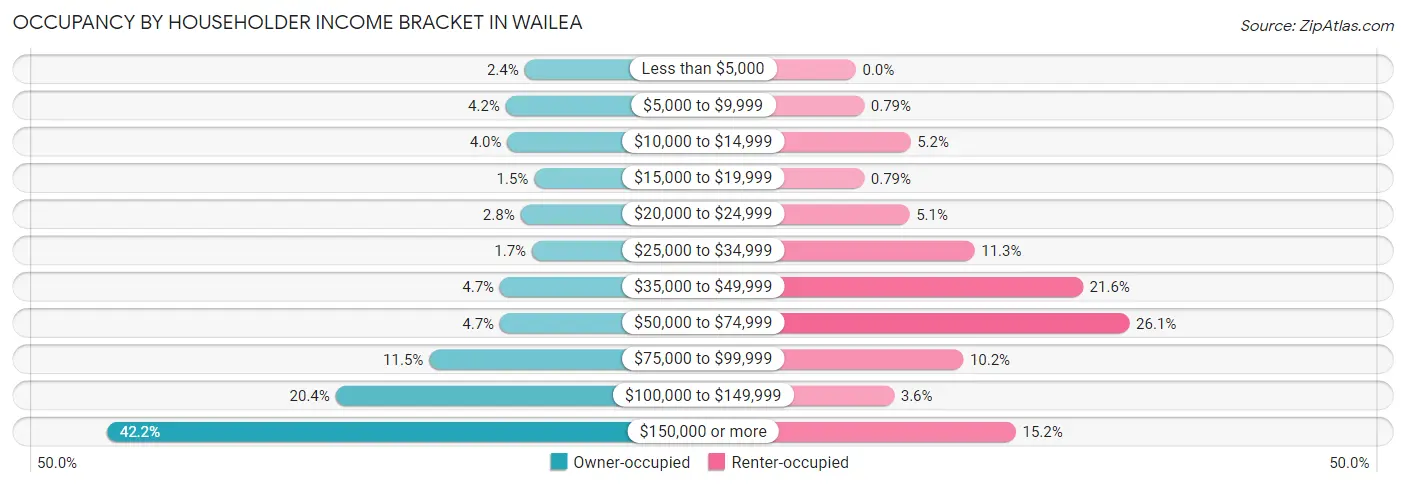
| Income Bracket | Owner-occupied | Renter-occupied |
| Less than $5,000 | 44 (2.4%) | 0 (0.0%) |
| $5,000 to $9,999 | 77 (4.2%) | 8 (0.8%) |
| $10,000 to $14,999 | 74 (4.0%) | 53 (5.2%) |
| $15,000 to $19,999 | 27 (1.5%) | 8 (0.8%) |
| $20,000 to $24,999 | 51 (2.8%) | 52 (5.1%) |
| $25,000 to $34,999 | 31 (1.7%) | 115 (11.3%) |
| $35,000 to $49,999 | 87 (4.7%) | 220 (21.6%) |
| $50,000 to $74,999 | 87 (4.7%) | 265 (26.1%) |
| $75,000 to $99,999 | 211 (11.5%) | 104 (10.2%) |
| $100,000 to $149,999 | 375 (20.4%) | 37 (3.6%) |
| $150,000 or more | 776 (42.2%) | 155 (15.2%) |
| Total | 1,840 (100.0%) | 1,017 (100.0%) |
Monthly Housing Cost Tiers in Wailea
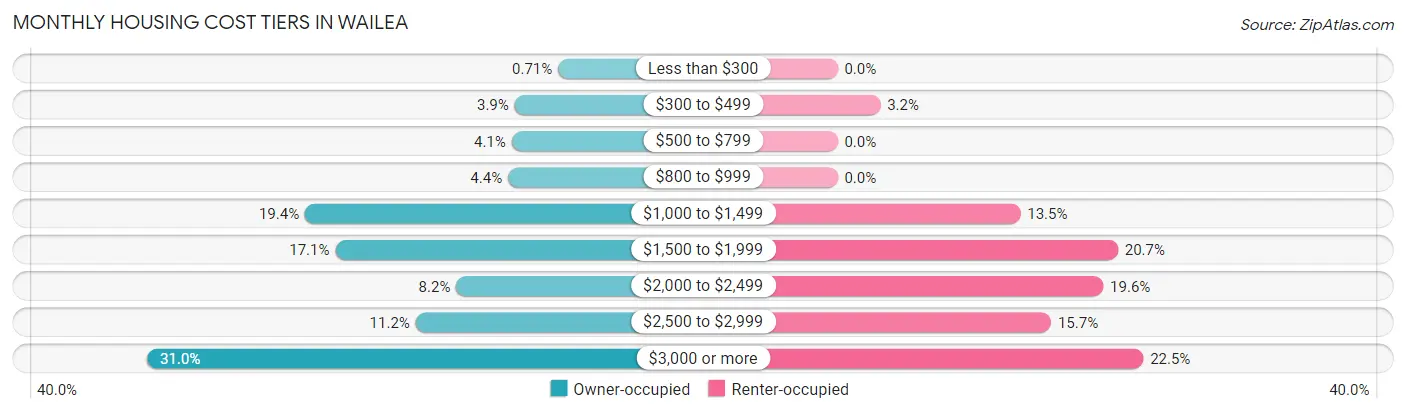
| Monthly Cost | Owner-occupied | Renter-occupied |
| Less than $300 | 13 (0.7%) | 0 (0.0%) |
| $300 to $499 | 72 (3.9%) | 32 (3.2%) |
| $500 to $799 | 76 (4.1%) | 0 (0.0%) |
| $800 to $999 | 81 (4.4%) | 0 (0.0%) |
| $1,000 to $1,499 | 356 (19.4%) | 137 (13.5%) |
| $1,500 to $1,999 | 315 (17.1%) | 210 (20.6%) |
| $2,000 to $2,499 | 151 (8.2%) | 199 (19.6%) |
| $2,500 to $2,999 | 206 (11.2%) | 160 (15.7%) |
| $3,000 or more | 570 (31.0%) | 229 (22.5%) |
| Total | 1,840 (100.0%) | 1,017 (100.0%) |
Physical Housing Characteristics in Wailea
Housing Structures in Wailea
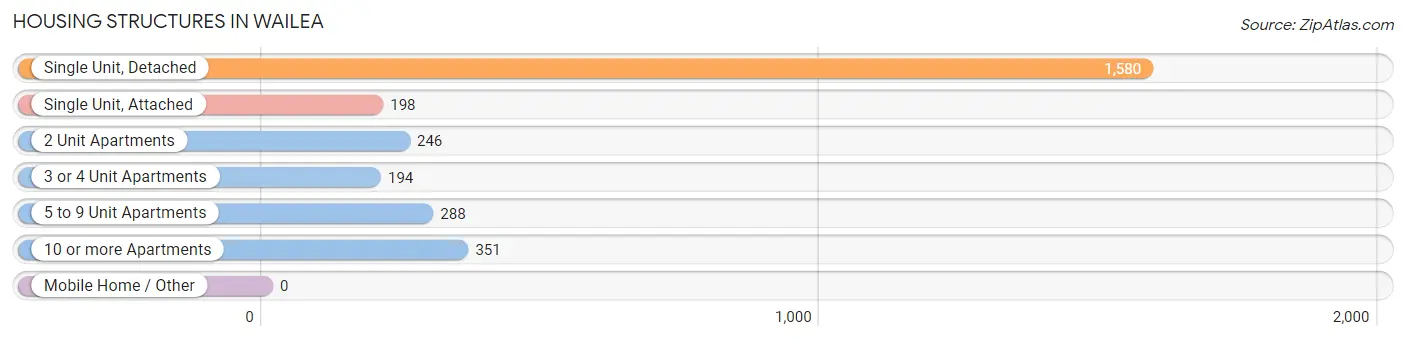
| Structure Type | # Housing Units | % Housing Units |
| Single Unit, Detached | 1,580 | 55.3% |
| Single Unit, Attached | 198 | 6.9% |
| 2 Unit Apartments | 246 | 8.6% |
| 3 or 4 Unit Apartments | 194 | 6.8% |
| 5 to 9 Unit Apartments | 288 | 10.1% |
| 10 or more Apartments | 351 | 12.3% |
| Mobile Home / Other | 0 | 0.0% |
| Total | 2,857 | 100.0% |
Housing Structures by Occupancy in Wailea
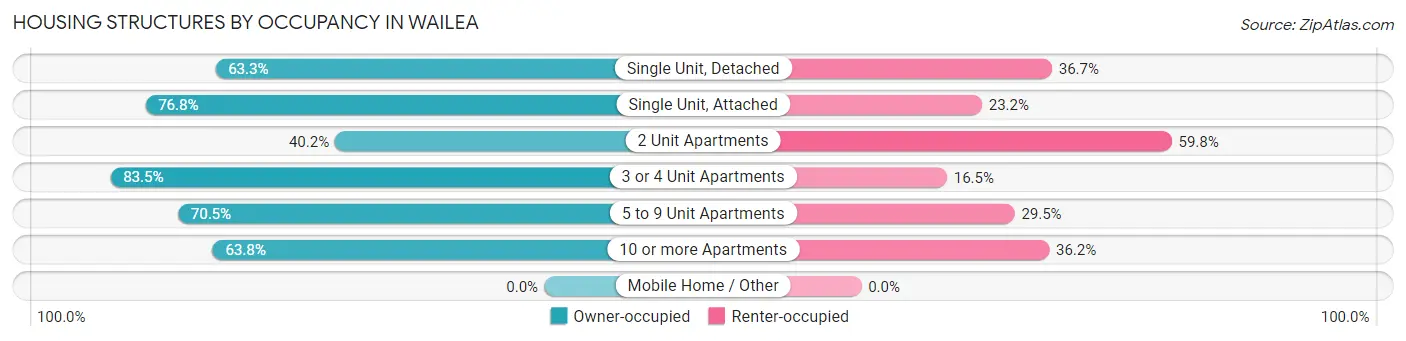
| Structure Type | Owner-occupied | Renter-occupied |
| Single Unit, Detached | 1,000 (63.3%) | 580 (36.7%) |
| Single Unit, Attached | 152 (76.8%) | 46 (23.2%) |
| 2 Unit Apartments | 99 (40.2%) | 147 (59.8%) |
| 3 or 4 Unit Apartments | 162 (83.5%) | 32 (16.5%) |
| 5 to 9 Unit Apartments | 203 (70.5%) | 85 (29.5%) |
| 10 or more Apartments | 224 (63.8%) | 127 (36.2%) |
| Mobile Home / Other | 0 (0.0%) | 0 (0.0%) |
| Total | 1,840 (64.4%) | 1,017 (35.6%) |
Housing Structures by Number of Rooms in Wailea
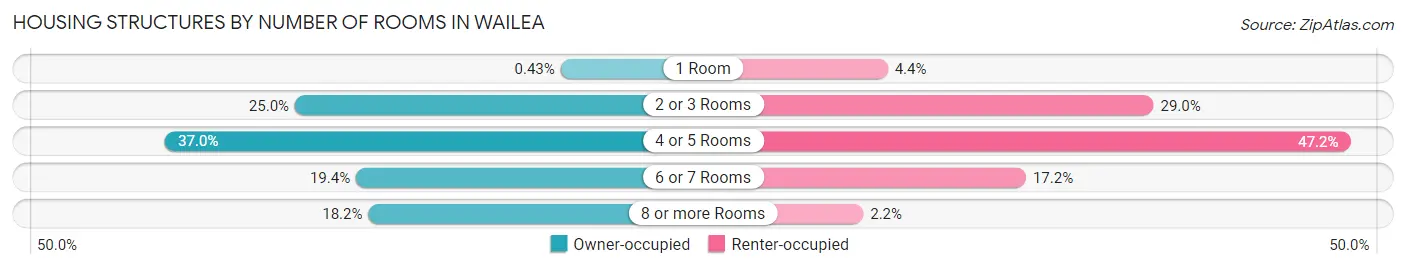
| Number of Rooms | Owner-occupied | Renter-occupied |
| 1 Room | 8 (0.4%) | 45 (4.4%) |
| 2 or 3 Rooms | 460 (25.0%) | 295 (29.0%) |
| 4 or 5 Rooms | 681 (37.0%) | 480 (47.2%) |
| 6 or 7 Rooms | 356 (19.4%) | 175 (17.2%) |
| 8 or more Rooms | 335 (18.2%) | 22 (2.2%) |
| Total | 1,840 (100.0%) | 1,017 (100.0%) |
Housing Structure by Heating Type in Wailea
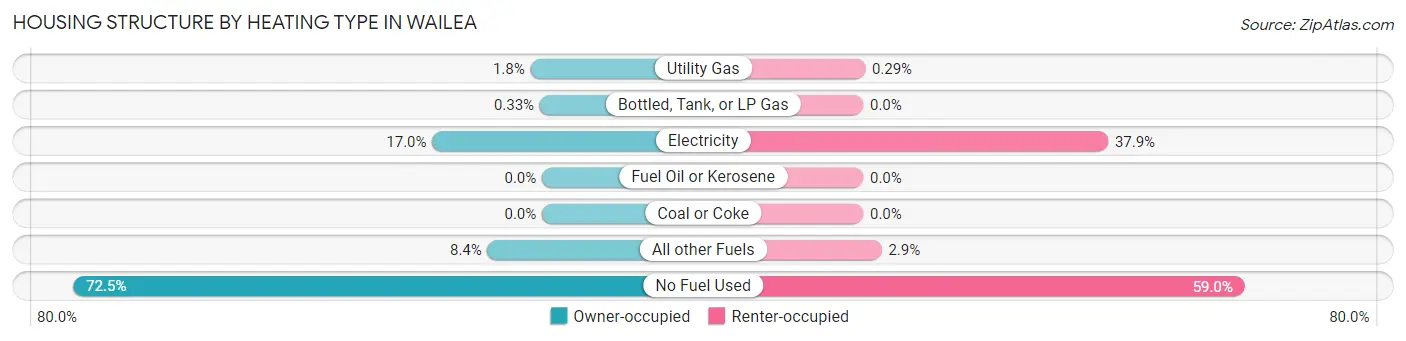
| Heating Type | Owner-occupied | Renter-occupied |
| Utility Gas | 33 (1.8%) | 3 (0.3%) |
| Bottled, Tank, or LP Gas | 6 (0.3%) | 0 (0.0%) |
| Electricity | 312 (17.0%) | 385 (37.9%) |
| Fuel Oil or Kerosene | 0 (0.0%) | 0 (0.0%) |
| Coal or Coke | 0 (0.0%) | 0 (0.0%) |
| All other Fuels | 155 (8.4%) | 29 (2.9%) |
| No Fuel Used | 1,334 (72.5%) | 600 (59.0%) |
| Total | 1,840 (100.0%) | 1,017 (100.0%) |
Household Vehicle Usage in Wailea
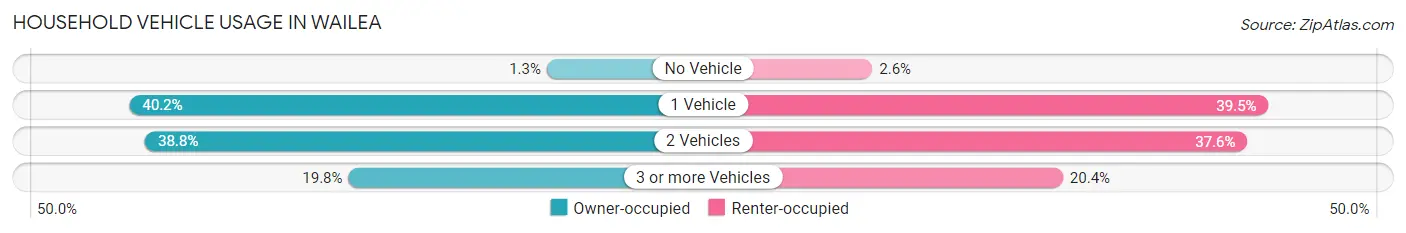
| Vehicles per Household | Owner-occupied | Renter-occupied |
| No Vehicle | 23 (1.3%) | 26 (2.6%) |
| 1 Vehicle | 740 (40.2%) | 402 (39.5%) |
| 2 Vehicles | 713 (38.8%) | 382 (37.6%) |
| 3 or more Vehicles | 364 (19.8%) | 207 (20.3%) |
| Total | 1,840 (100.0%) | 1,017 (100.0%) |
Real Estate & Mortgages in Wailea
Real Estate and Mortgage Overview in Wailea
| Characteristic | Without Mortgage | With Mortgage |
| Housing Units | 822 | 1,018 |
| Median Property Value | $1,350,000 | $1,287,300 |
| Median Household Income | $122,857 | $480 |
| Monthly Housing Costs | $1,234 | $528 |
| Real Estate Taxes | $3,869 | $9 |
Property Value by Mortgage Status in Wailea
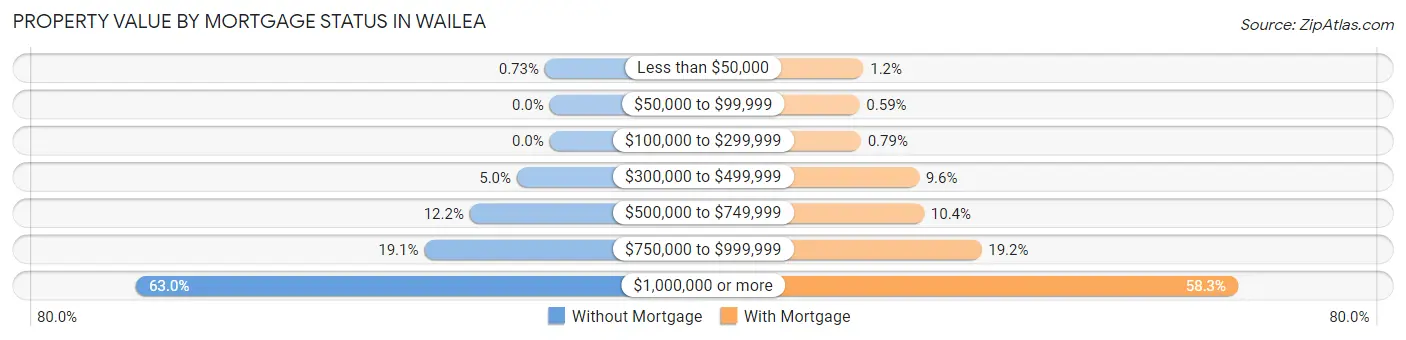
| Property Value | Without Mortgage | With Mortgage |
| Less than $50,000 | 6 (0.7%) | 12 (1.2%) |
| $50,000 to $99,999 | 0 (0.0%) | 6 (0.6%) |
| $100,000 to $299,999 | 0 (0.0%) | 8 (0.8%) |
| $300,000 to $499,999 | 41 (5.0%) | 98 (9.6%) |
| $500,000 to $749,999 | 100 (12.2%) | 106 (10.4%) |
| $750,000 to $999,999 | 157 (19.1%) | 195 (19.2%) |
| $1,000,000 or more | 518 (63.0%) | 593 (58.3%) |
| Total | 822 (100.0%) | 1,018 (100.0%) |
Household Income by Mortgage Status in Wailea
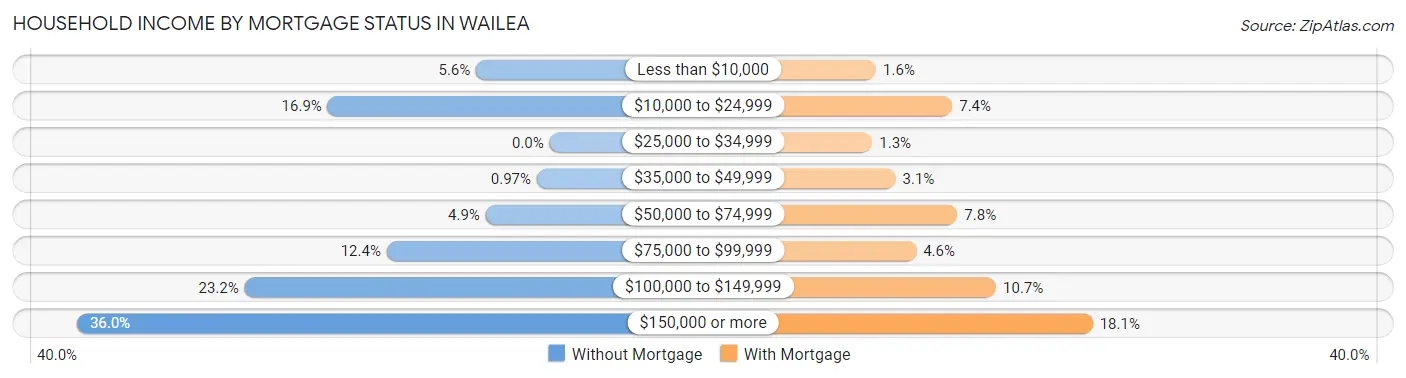
| Household Income | Without Mortgage | With Mortgage |
| Less than $10,000 | 46 (5.6%) | 16 (1.6%) |
| $10,000 to $24,999 | 139 (16.9%) | 75 (7.4%) |
| $25,000 to $34,999 | 0 (0.0%) | 13 (1.3%) |
| $35,000 to $49,999 | 8 (1.0%) | 31 (3.0%) |
| $50,000 to $74,999 | 40 (4.9%) | 79 (7.8%) |
| $75,000 to $99,999 | 102 (12.4%) | 47 (4.6%) |
| $100,000 to $149,999 | 191 (23.2%) | 109 (10.7%) |
| $150,000 or more | 296 (36.0%) | 184 (18.1%) |
| Total | 822 (100.0%) | 1,018 (100.0%) |
Property Value to Household Income Ratio in Wailea
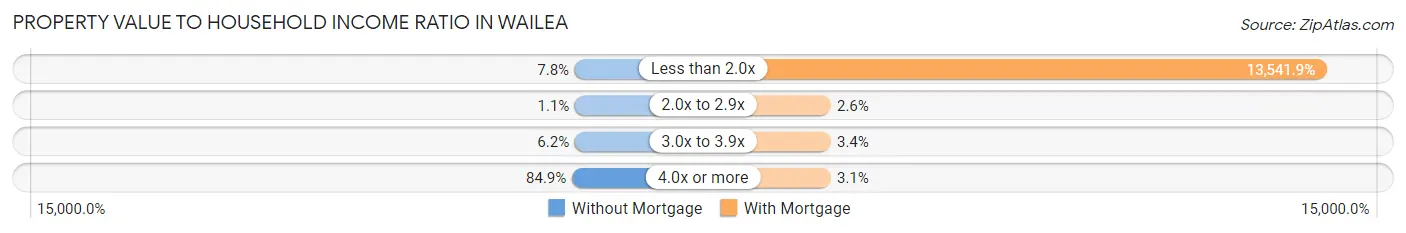
| Value-to-Income Ratio | Without Mortgage | With Mortgage |
| Less than 2.0x | 64 (7.8%) | 137,857 (13,541.9%) |
| 2.0x to 2.9x | 9 (1.1%) | 26 (2.5%) |
| 3.0x to 3.9x | 51 (6.2%) | 35 (3.4%) |
| 4.0x or more | 698 (84.9%) | 32 (3.1%) |
| Total | 822 (100.0%) | 1,018 (100.0%) |
Real Estate Taxes by Mortgage Status in Wailea
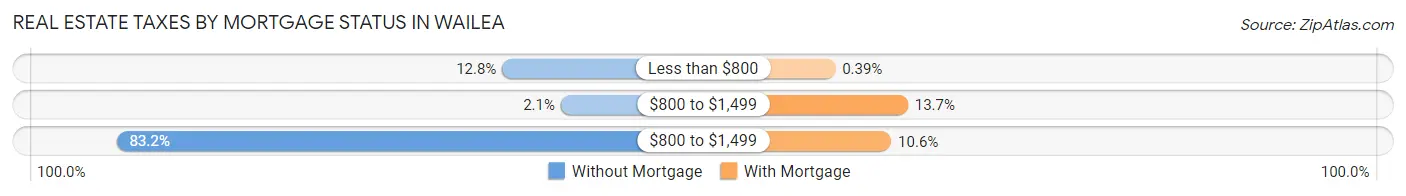
| Property Taxes | Without Mortgage | With Mortgage |
| Less than $800 | 105 (12.8%) | 4 (0.4%) |
| $800 to $1,499 | 17 (2.1%) | 139 (13.7%) |
| $800 to $1,499 | 684 (83.2%) | 108 (10.6%) |
| Total | 822 (100.0%) | 1,018 (100.0%) |
Health & Disability in Wailea
Health Insurance Coverage by Age in Wailea
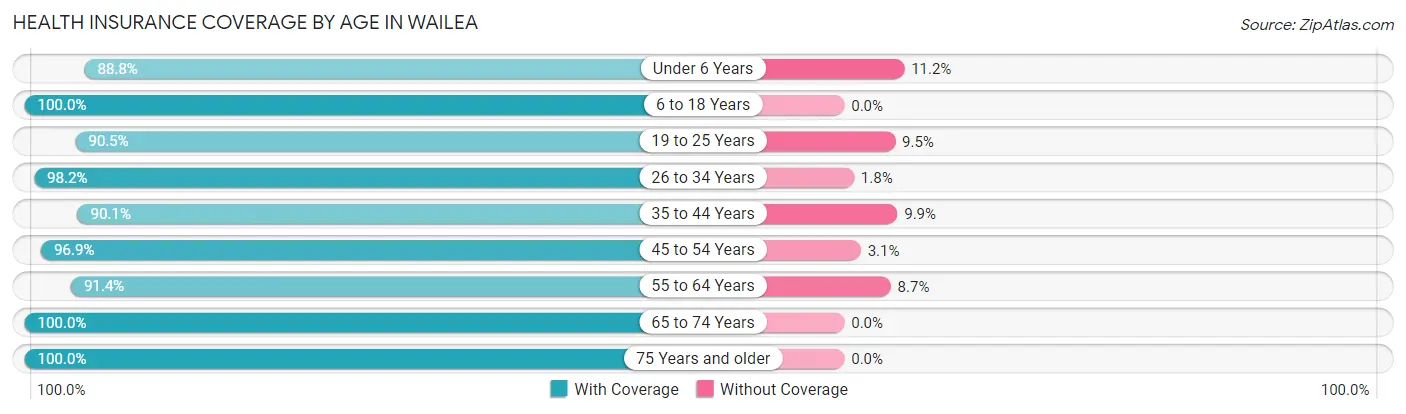
| Age Bracket | With Coverage | Without Coverage |
| Under 6 Years | 167 (88.8%) | 21 (11.2%) |
| 6 to 18 Years | 698 (100.0%) | 0 (0.0%) |
| 19 to 25 Years | 344 (90.5%) | 36 (9.5%) |
| 26 to 34 Years | 605 (98.2%) | 11 (1.8%) |
| 35 to 44 Years | 620 (90.1%) | 68 (9.9%) |
| 45 to 54 Years | 729 (96.9%) | 23 (3.1%) |
| 55 to 64 Years | 1,067 (91.3%) | 101 (8.6%) |
| 65 to 74 Years | 1,202 (100.0%) | 0 (0.0%) |
| 75 Years and older | 804 (100.0%) | 0 (0.0%) |
| Total | 6,236 (96.0%) | 260 (4.0%) |
Health Insurance Coverage by Citizenship Status in Wailea
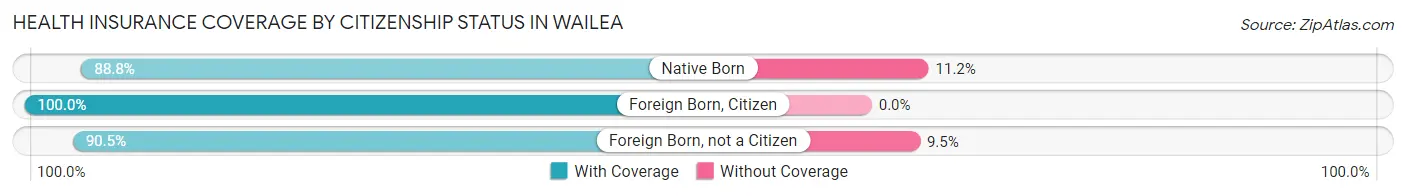
| Citizenship Status | With Coverage | Without Coverage |
| Native Born | 167 (88.8%) | 21 (11.2%) |
| Foreign Born, Citizen | 698 (100.0%) | 0 (0.0%) |
| Foreign Born, not a Citizen | 344 (90.5%) | 36 (9.5%) |
Health Insurance Coverage by Household Income in Wailea
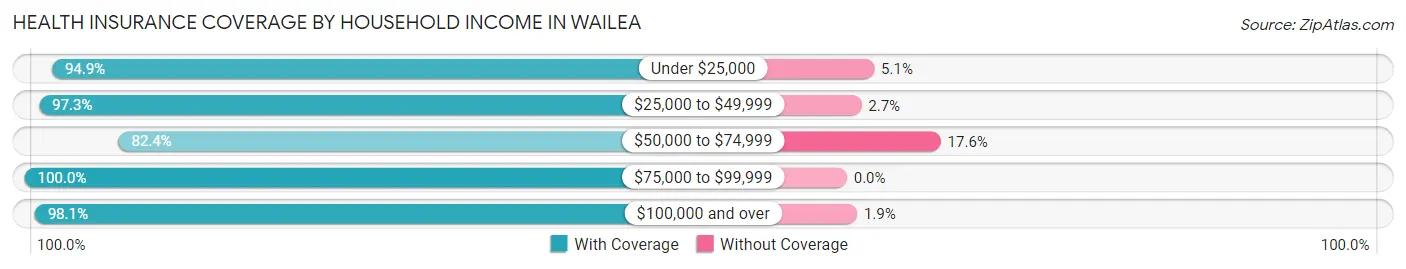
| Household Income | With Coverage | Without Coverage |
| Under $25,000 | 647 (94.9%) | 35 (5.1%) |
| $25,000 to $49,999 | 931 (97.3%) | 26 (2.7%) |
| $50,000 to $74,999 | 609 (82.4%) | 130 (17.6%) |
| $75,000 to $99,999 | 492 (100.0%) | 0 (0.0%) |
| $100,000 and over | 3,539 (98.1%) | 69 (1.9%) |
Public vs Private Health Insurance Coverage by Age in Wailea
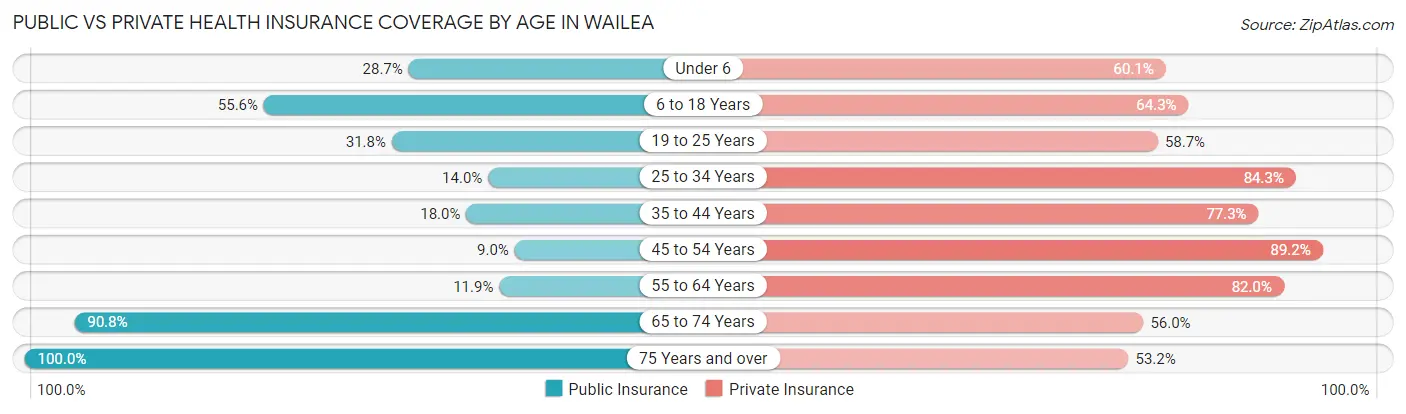
| Age Bracket | Public Insurance | Private Insurance |
| Under 6 | 54 (28.7%) | 113 (60.1%) |
| 6 to 18 Years | 388 (55.6%) | 449 (64.3%) |
| 19 to 25 Years | 121 (31.8%) | 223 (58.7%) |
| 25 to 34 Years | 86 (14.0%) | 519 (84.3%) |
| 35 to 44 Years | 124 (18.0%) | 532 (77.3%) |
| 45 to 54 Years | 68 (9.0%) | 671 (89.2%) |
| 55 to 64 Years | 139 (11.9%) | 958 (82.0%) |
| 65 to 74 Years | 1,091 (90.8%) | 673 (56.0%) |
| 75 Years and over | 804 (100.0%) | 428 (53.2%) |
| Total | 2,875 (44.3%) | 4,566 (70.3%) |
Disability Status by Sex by Age in Wailea
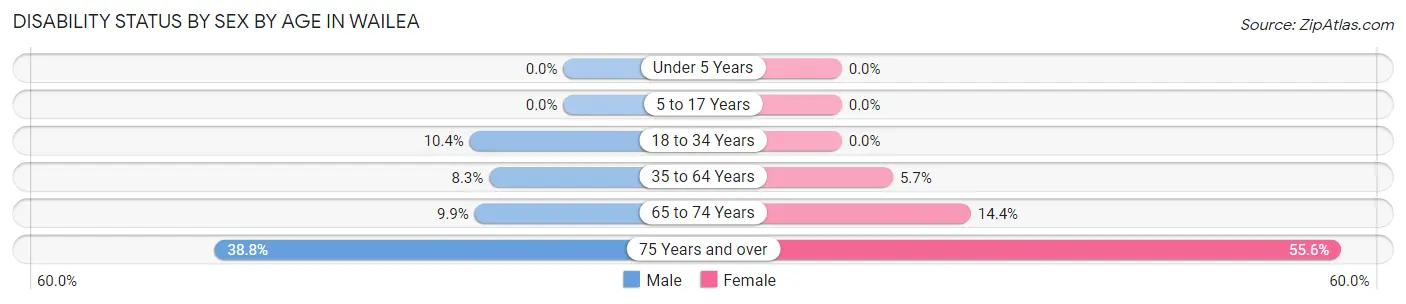
| Age Bracket | Male | Female |
| Under 5 Years | 0 (0.0%) | 0 (0.0%) |
| 5 to 17 Years | 0 (0.0%) | 0 (0.0%) |
| 18 to 34 Years | 58 (10.4%) | 0 (0.0%) |
| 35 to 64 Years | 117 (8.3%) | 68 (5.7%) |
| 65 to 74 Years | 72 (9.9%) | 68 (14.4%) |
| 75 Years and over | 139 (38.8%) | 248 (55.6%) |
Disability Class by Sex by Age in Wailea
Disability Class: Hearing Difficulty
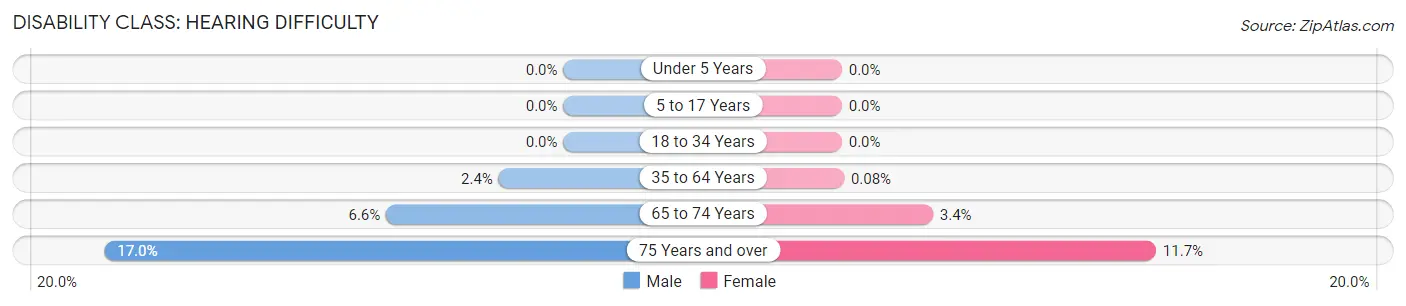
| Age Bracket | Male | Female |
| Under 5 Years | 0 (0.0%) | 0 (0.0%) |
| 5 to 17 Years | 0 (0.0%) | 0 (0.0%) |
| 18 to 34 Years | 0 (0.0%) | 0 (0.0%) |
| 35 to 64 Years | 34 (2.4%) | 1 (0.1%) |
| 65 to 74 Years | 48 (6.6%) | 16 (3.4%) |
| 75 Years and over | 61 (17.0%) | 52 (11.7%) |
Disability Class: Vision Difficulty
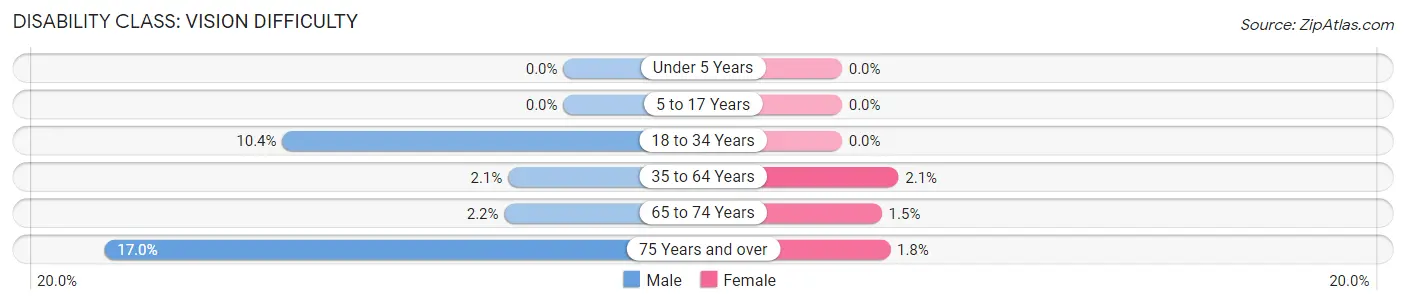
| Age Bracket | Male | Female |
| Under 5 Years | 0 (0.0%) | 0 (0.0%) |
| 5 to 17 Years | 0 (0.0%) | 0 (0.0%) |
| 18 to 34 Years | 58 (10.4%) | 0 (0.0%) |
| 35 to 64 Years | 29 (2.1%) | 25 (2.1%) |
| 65 to 74 Years | 16 (2.2%) | 7 (1.5%) |
| 75 Years and over | 61 (17.0%) | 8 (1.8%) |
Disability Class: Cognitive Difficulty
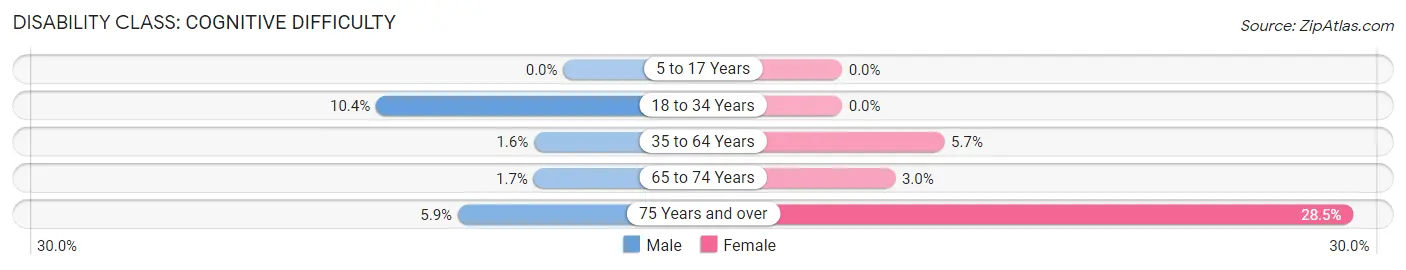
| Age Bracket | Male | Female |
| 5 to 17 Years | 0 (0.0%) | 0 (0.0%) |
| 18 to 34 Years | 58 (10.4%) | 0 (0.0%) |
| 35 to 64 Years | 23 (1.6%) | 68 (5.7%) |
| 65 to 74 Years | 12 (1.7%) | 14 (3.0%) |
| 75 Years and over | 21 (5.9%) | 127 (28.5%) |
Disability Class: Ambulatory Difficulty
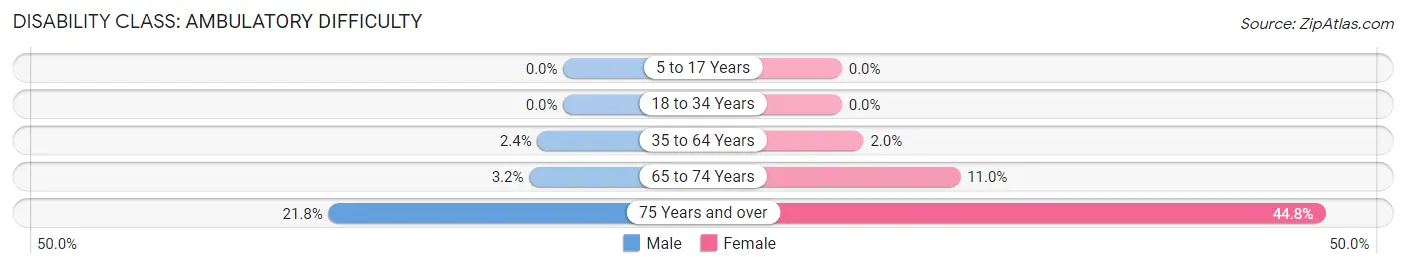
| Age Bracket | Male | Female |
| 5 to 17 Years | 0 (0.0%) | 0 (0.0%) |
| 18 to 34 Years | 0 (0.0%) | 0 (0.0%) |
| 35 to 64 Years | 34 (2.4%) | 24 (2.0%) |
| 65 to 74 Years | 23 (3.2%) | 52 (11.0%) |
| 75 Years and over | 78 (21.8%) | 200 (44.8%) |
Disability Class: Self-Care Difficulty
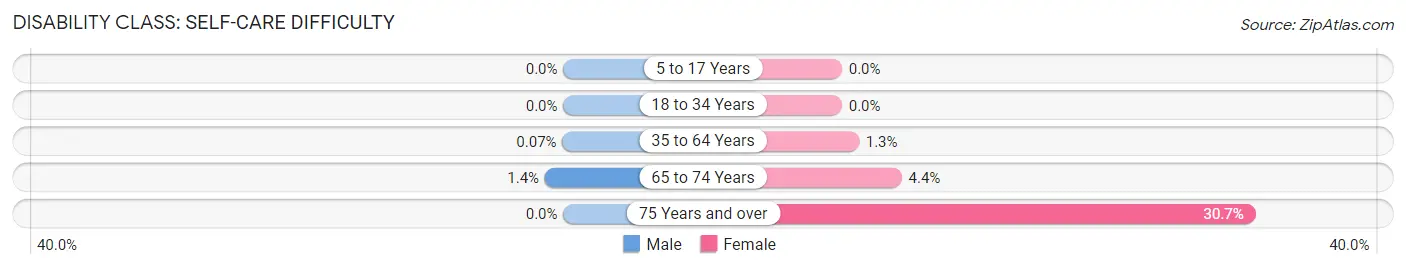
| Age Bracket | Male | Female |
| 5 to 17 Years | 0 (0.0%) | 0 (0.0%) |
| 18 to 34 Years | 0 (0.0%) | 0 (0.0%) |
| 35 to 64 Years | 1 (0.1%) | 15 (1.3%) |
| 65 to 74 Years | 10 (1.4%) | 21 (4.4%) |
| 75 Years and over | 0 (0.0%) | 137 (30.7%) |
Technology Access in Wailea
Computing Device Access in Wailea
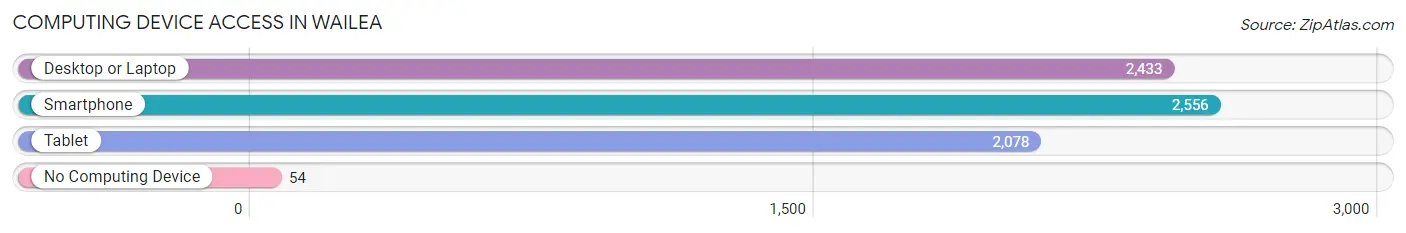
| Device Type | # Households | % Households |
| Desktop or Laptop | 2,433 | 85.2% |
| Smartphone | 2,556 | 89.5% |
| Tablet | 2,078 | 72.7% |
| No Computing Device | 54 | 1.9% |
| Total | 2,857 | 100.0% |
Internet Access in Wailea
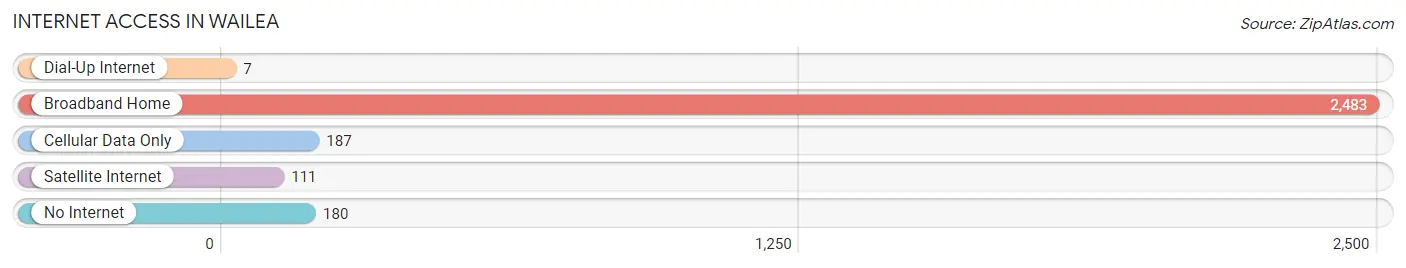
| Internet Type | # Households | % Households |
| Dial-Up Internet | 7 | 0.3% |
| Broadband Home | 2,483 | 86.9% |
| Cellular Data Only | 187 | 6.6% |
| Satellite Internet | 111 | 3.9% |
| No Internet | 180 | 6.3% |
| Total | 2,857 | 100.0% |
Wailea Summary
Wailea is a census-designated place (CDP) located in Maui County, Hawaii, United States. The population was 5,674 at the 2010 census. Wailea is located on the south shore of the island of Maui, and is known for its luxury resorts, golf courses, and beaches.
History
The area now known as Wailea was once a part of the ahupuaʻa of Mākena, which was a traditional Hawaiian land division. The ahupuaʻa was divided into three sections: the upper section, which was the uplands; the middle section, which was the agricultural lands; and the lower section, which was the shoreline. The ahupuaʻa was managed by the aliʻi, or Hawaiian chiefs, who were responsible for the land and its resources.
In the late 19th century, the ahupuaʻa of Mākena was divided into several smaller parcels and sold to private individuals. In the 1950s, the area was developed as a resort destination, and the first hotel, the Mākena Beach and Golf Resort, opened in 1965. Since then, the area has become a popular destination for tourists and locals alike.
Geography
Wailea is located on the south shore of the island of Maui, at 20°45'17" North, 156°26'17" West (20.754722, -156.438333). It is bordered to the north by the town of Kihei, to the east by Mākena, and to the west by the Pacific Ocean.
The CDP has a total area of 4.2 square miles, of which 4.1 square miles is land and 0.1 square miles is water.
Economy
Wailea is a popular tourist destination, and the economy is largely driven by tourism. The area is home to several luxury resorts, including the Grand Wailea, the Four Seasons Resort Maui, and the Fairmont Kea Lani. In addition, there are several golf courses, including the Wailea Golf Club, the Wailea Blue Golf Course, and the Wailea Emerald Golf Course.
The area is also home to several restaurants shops and other businesses
Demographics
As of the 2010 census, there were 5,674 people, 2,541 households, and 1,541 families residing in the CDP. The population density was 1,377.7 people per square mile. There were 3,845 housing units at an average density of 937.3 per square mile.
The racial makeup of the CDP was 68.2% White, 0.7% African American, 0.3% Native American, 15.2% Asian, 0.2% Pacific Islander, 8.2% from other races, and 7.2% from two or more races. Hispanic or Latino of any race were 16.2% of the population.
There were 2,541 households, out of which 20.2% had children under the age of 18 living with them, 48.2% were married couples living together, 8.2% had a female householder with no husband present, and 39.7% were non-families. 32.2% of all households were made up of individuals, and 8.2% had someone living alone who was 65 years of age or older. The average household size was 2.22 and the average family size was 2.81.
In the CDP, the population was spread out, with 17.2% under the age of 18, 6.2% from 18 to 24, 28.2% from 25 to 44, 33.2% from 45 to 64, and 15.2% who were 65 years of age or older. The median age was 44 years. For every 100 females, there were 97.2 males. For every 100 females age 18 and over, there were 95.2 males.
The median income for a household in the CDP was $76,945, and the median income for a family was $90,938. Males had a median income of $60,000 versus $41,250 for females. The per capita income for the CDP was $50,945. About 4.2% of families and 6.2% of the population were below the poverty line, including 8.2% of those under age 18 and 3.2% of those age 65 or over.
Common Questions
What is Per Capita Income in Wailea?
Per Capita income in Wailea is $70,735.
What is the Median Family Income in Wailea?
Median Family Income in Wailea is $102,365.
What is the Median Household income in Wailea?
Median Household Income in Wailea is $89,088.
What is Income or Wage Gap in Wailea?
Income or Wage Gap in Wailea is 44.4%.
Women in Wailea earn 55.6 cents for every dollar earned by a man.
What is Inequality or Gini Index in Wailea?
Inequality or Gini Index in Wailea is 0.57.
What is the Total Population of Wailea?
Total Population of Wailea is 6,517.
What is the Total Male Population of Wailea?
Total Male Population of Wailea is 3,412.
What is the Total Female Population of Wailea?
Total Female Population of Wailea is 3,105.
What is the Ratio of Males per 100 Females in Wailea?
There are 109.89 Males per 100 Females in Wailea.
What is the Ratio of Females per 100 Males in Wailea?
There are 91.00 Females per 100 Males in Wailea.
What is the Median Population Age in Wailea?
Median Population Age in Wailea is 54.2 Years.
What is the Average Family Size in Wailea
Average Family Size in Wailea is 2.6 People.
What is the Average Household Size in Wailea
Average Household Size in Wailea is 2.3 People.
How Large is the Labor Force in Wailea?
There are 3,221 People in the Labor Forcein in Wailea.
What is the Percentage of People in the Labor Force in Wailea?
54.7% of People are in the Labor Force in Wailea.
What is the Unemployment Rate in Wailea?
Unemployment Rate in Wailea is 5.8%.