Maunaloa, HI Map & Demographics
Maunaloa Map
Maunaloa Overview
$22,765
PER CAPITA INCOME
$54,063
AVG FAMILY INCOME
$51,842
AVG HOUSEHOLD INCOME
52.2%
WAGE / INCOME GAP [ % ]
47.8¢/ $1
WAGE / INCOME GAP [ $ ]
0.31
INEQUALITY / GINI INDEX
279
TOTAL POPULATION
107
MALE POPULATION
172
FEMALE POPULATION
62.21
MALES / 100 FEMALES
160.75
FEMALES / 100 MALES
36.1
MEDIAN AGE
3.1
AVG FAMILY SIZE
2.6
AVG HOUSEHOLD SIZE
127
LABOR FORCE [ PEOPLE ]
66.8%
PERCENT IN LABOR FORCE
2.4%
UNEMPLOYMENT RATE
Maunaloa Zip Codes
Maunaloa Area Codes
Income in Maunaloa
Income Overview in Maunaloa
Per Capita Income in Maunaloa is $22,765, while median incomes of families and households are $54,063 and $51,842 respectively.
| Characteristic | Number | Measure |
| Per Capita Income | 279 | $22,765 |
| Median Family Income | 78 | $54,063 |
| Mean Family Income | 78 | $74,403 |
| Median Household Income | 106 | $51,842 |
| Mean Household Income | 106 | $63,295 |
| Income Deficit | 78 | $0 |
| Wage / Income Gap (%) | 279 | 52.22% |
| Wage / Income Gap ($) | 279 | 47.78¢ per $1 |
| Gini / Inequality Index | 279 | 0.31 |
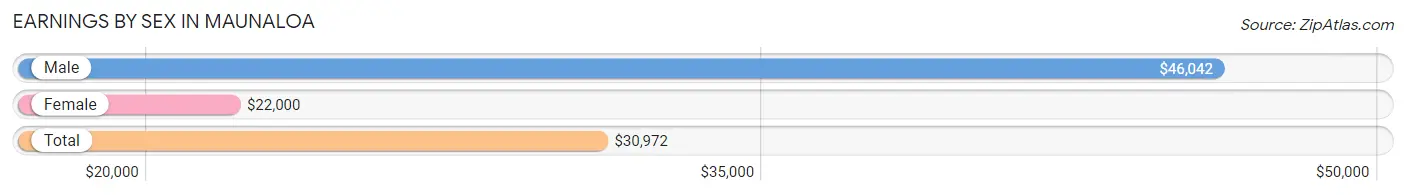
Earnings by Sex in Maunaloa
Average Earnings in Maunaloa are $30,972, $46,042 for men and $22,000 for women, a difference of 52.2%.
| Sex | Number | Average Earnings |
| Male | 41 (32.3%) | $46,042 |
| Female | 86 (67.7%) | $22,000 |
| Total | 127 (100.0%) | $30,972 |
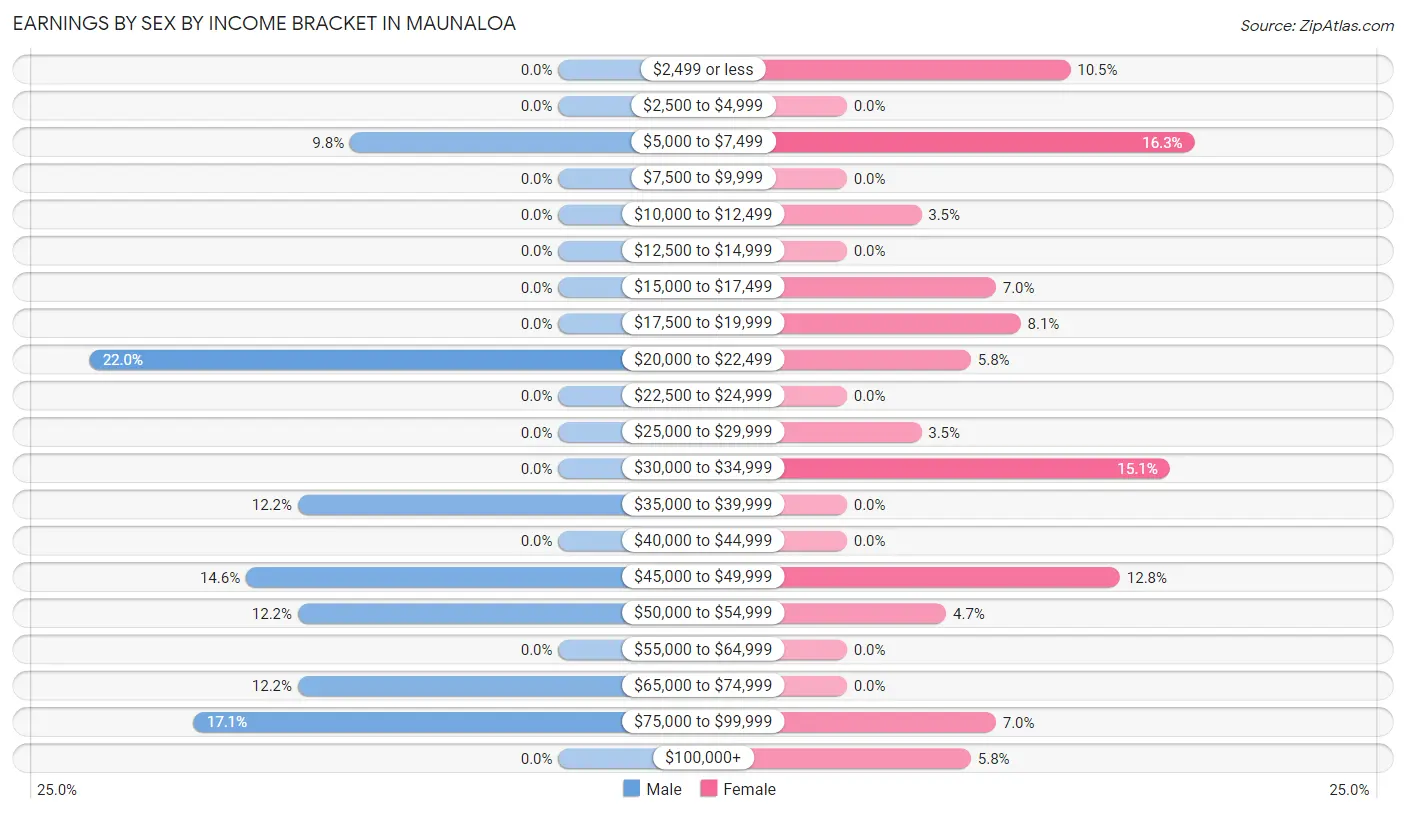
Earnings by Sex by Income Bracket in Maunaloa
The most common earnings brackets in Maunaloa are $20,000 to $22,499 for men (9 | 22.0%) and $5,000 to $7,499 for women (14 | 16.3%).
| Income | Male | Female |
| $2,499 or less | 0 (0.0%) | 9 (10.5%) |
| $2,500 to $4,999 | 0 (0.0%) | 0 (0.0%) |
| $5,000 to $7,499 | 4 (9.8%) | 14 (16.3%) |
| $7,500 to $9,999 | 0 (0.0%) | 0 (0.0%) |
| $10,000 to $12,499 | 0 (0.0%) | 3 (3.5%) |
| $12,500 to $14,999 | 0 (0.0%) | 0 (0.0%) |
| $15,000 to $17,499 | 0 (0.0%) | 6 (7.0%) |
| $17,500 to $19,999 | 0 (0.0%) | 7 (8.1%) |
| $20,000 to $22,499 | 9 (22.0%) | 5 (5.8%) |
| $22,500 to $24,999 | 0 (0.0%) | 0 (0.0%) |
| $25,000 to $29,999 | 0 (0.0%) | 3 (3.5%) |
| $30,000 to $34,999 | 0 (0.0%) | 13 (15.1%) |
| $35,000 to $39,999 | 5 (12.2%) | 0 (0.0%) |
| $40,000 to $44,999 | 0 (0.0%) | 0 (0.0%) |
| $45,000 to $49,999 | 6 (14.6%) | 11 (12.8%) |
| $50,000 to $54,999 | 5 (12.2%) | 4 (4.6%) |
| $55,000 to $64,999 | 0 (0.0%) | 0 (0.0%) |
| $65,000 to $74,999 | 5 (12.2%) | 0 (0.0%) |
| $75,000 to $99,999 | 7 (17.1%) | 6 (7.0%) |
| $100,000+ | 0 (0.0%) | 5 (5.8%) |
| Total | 41 (100.0%) | 86 (100.0%) |
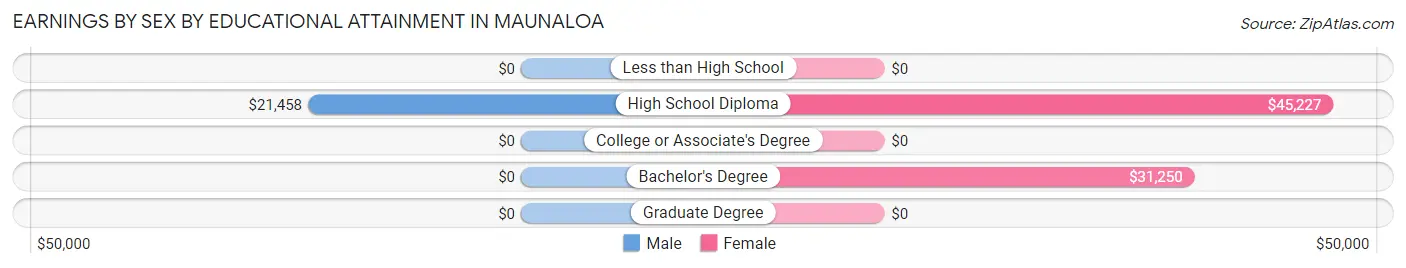
Earnings by Sex by Educational Attainment in Maunaloa
Average earnings in Maunaloa are $46,042 for men and $30,000 for women, a difference of 34.8%. Men with an educational attainment of high school diploma enjoy the highest average annual earnings of $21,458, while those with high school diploma education earn the least with $21,458. Women with an educational attainment of high school diploma earn the most with the average annual earnings of $45,227, while those with bachelor's degree education have the smallest earnings of $31,250.
| Educational Attainment | Male Income | Female Income |
| Less than High School | - | - |
| High School Diploma | $21,458 | $45,227 |
| College or Associate's Degree | - | - |
| Bachelor's Degree | - | - |
| Graduate Degree | - | - |
| Total | $46,042 | $30,000 |
Family Income in Maunaloa
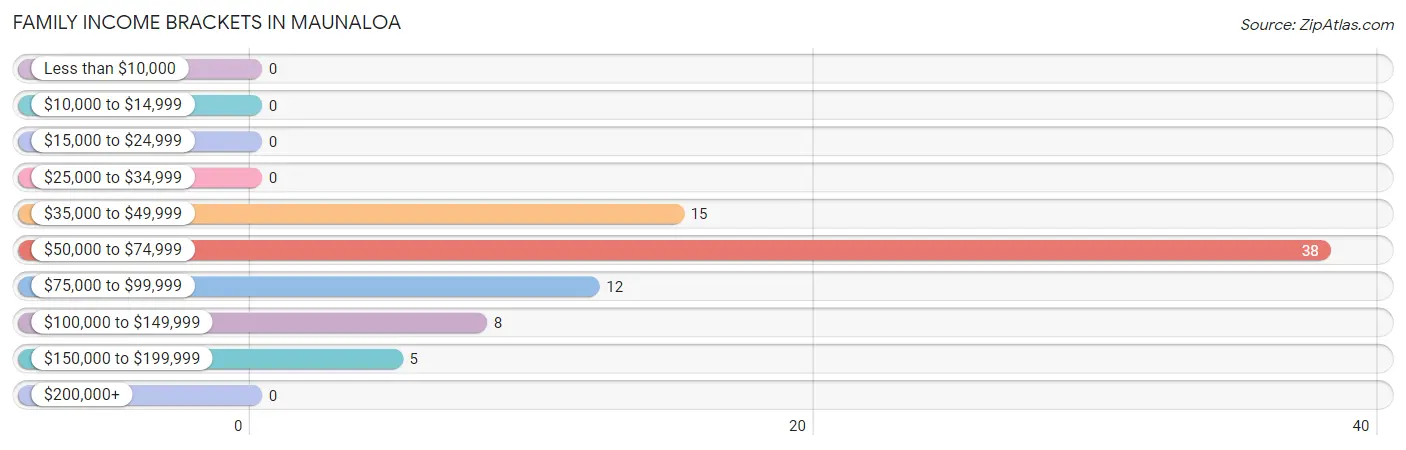
Family Income Brackets in Maunaloa
According to the Maunaloa family income data, there are 38 families falling into the $50,000 to $74,999 income range, which is the most common income bracket and makes up 48.7% of all families.
| Income Bracket | # Families | % Families |
| Less than $10,000 | 0 | 0.0% |
| $10,000 to $14,999 | 0 | 0.0% |
| $15,000 to $24,999 | 0 | 0.0% |
| $25,000 to $34,999 | 0 | 0.0% |
| $35,000 to $49,999 | 15 | 19.2% |
| $50,000 to $74,999 | 38 | 48.7% |
| $75,000 to $99,999 | 12 | 15.4% |
| $100,000 to $149,999 | 8 | 10.3% |
| $150,000 to $199,999 | 5 | 6.4% |
| $200,000+ | 0 | 0.0% |
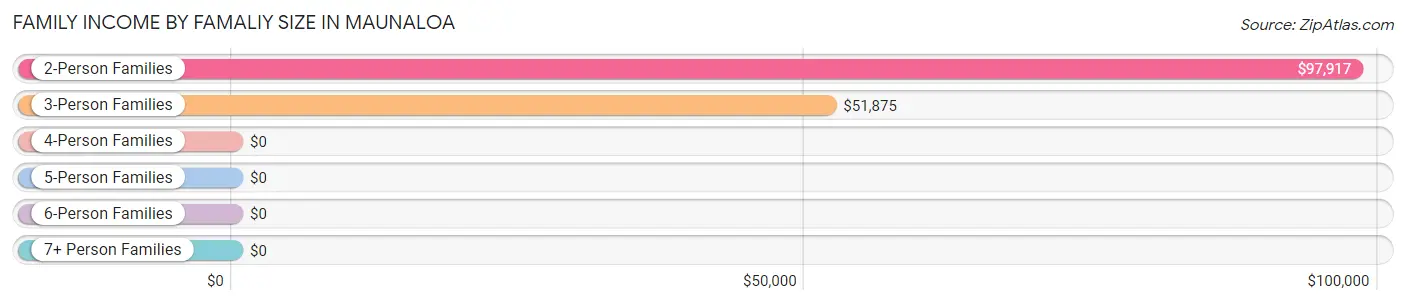
Family Income by Famaliy Size in Maunaloa
2-person families (36 | 46.2%) account for the highest median family income in Maunaloa with $97,917 per family, while 2-person families (36 | 46.2%) have the highest median income of $48,958 per family member.
| Income Bracket | # Families | Median Income |
| 2-Person Families | 36 (46.2%) | $97,917 |
| 3-Person Families | 24 (30.8%) | $51,875 |
| 4-Person Families | 11 (14.1%) | $0 |
| 5-Person Families | 3 (3.8%) | $0 |
| 6-Person Families | 4 (5.1%) | $0 |
| 7+ Person Families | 0 (0.0%) | $0 |
| Total | 78 (100.0%) | $54,063 |
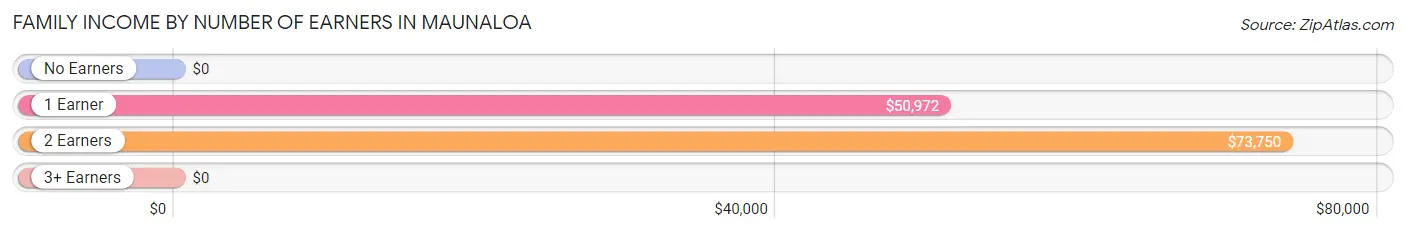
Family Income by Number of Earners in Maunaloa
| Number of Earners | # Families | Median Income |
| No Earners | 8 (10.3%) | $0 |
| 1 Earner | 37 (47.4%) | $50,972 |
| 2 Earners | 26 (33.3%) | $73,750 |
| 3+ Earners | 7 (9.0%) | $0 |
| Total | 78 (100.0%) | $54,063 |
Household Income in Maunaloa
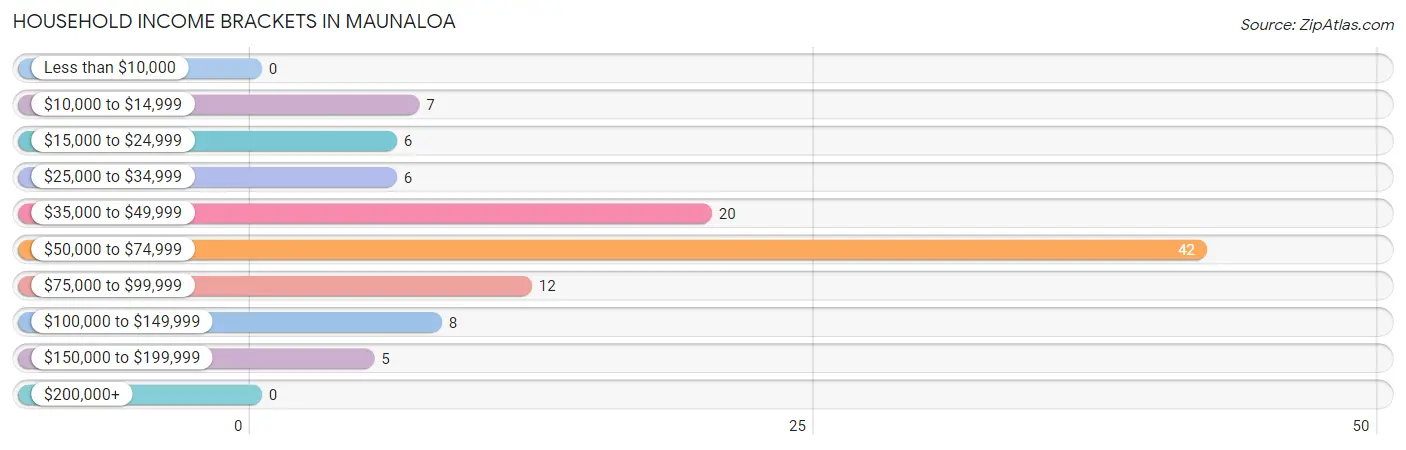
Household Income Brackets in Maunaloa
With 42 households falling in the category, the $50,000 to $74,999 income range is the most frequent in Maunaloa, accounting for 39.6% of all households.
| Income Bracket | # Households | % Households |
| Less than $10,000 | 0 | 0.0% |
| $10,000 to $14,999 | 7 | 6.6% |
| $15,000 to $24,999 | 6 | 5.7% |
| $25,000 to $34,999 | 6 | 5.7% |
| $35,000 to $49,999 | 20 | 18.9% |
| $50,000 to $74,999 | 42 | 39.6% |
| $75,000 to $99,999 | 12 | 11.3% |
| $100,000 to $149,999 | 8 | 7.5% |
| $150,000 to $199,999 | 5 | 4.7% |
| $200,000+ | 0 | 0.0% |
Household Income by Householder Age in Maunaloa
The median household income in Maunaloa is $51,842, with the highest median household income of $52,969 found in the 45 to 64 years age bracket for the primary householder. A total of 61 households (57.6%) fall into this category.
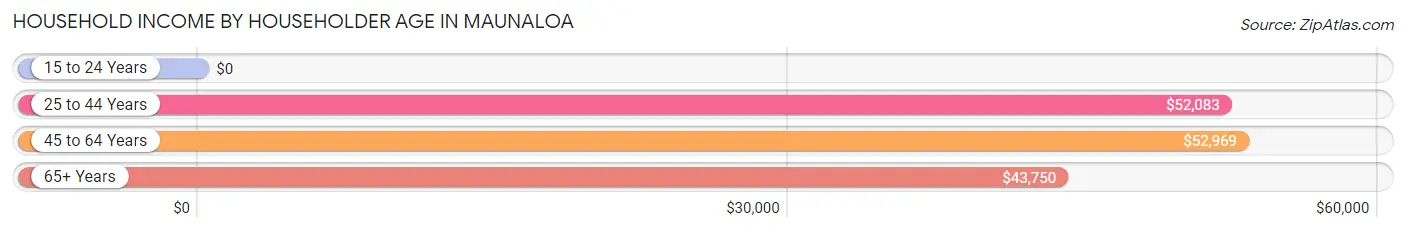
| Income Bracket | # Households | Median Income |
| 15 to 24 Years | 0 (0.0%) | $0 |
| 25 to 44 Years | 33 (31.1%) | $52,083 |
| 45 to 64 Years | 61 (57.6%) | $52,969 |
| 65+ Years | 12 (11.3%) | $43,750 |
| Total | 106 (100.0%) | $51,842 |
Poverty in Maunaloa
Income Below Poverty by Sex and Age in Maunaloa
With 16.8% poverty level for males and 16.9% for females among the residents of Maunaloa, 5 year old males and 6 to 11 year old females are the most vulnerable to poverty, with 12 males (100.0%) and 10 females (71.4%) in their respective age groups living below the poverty level.
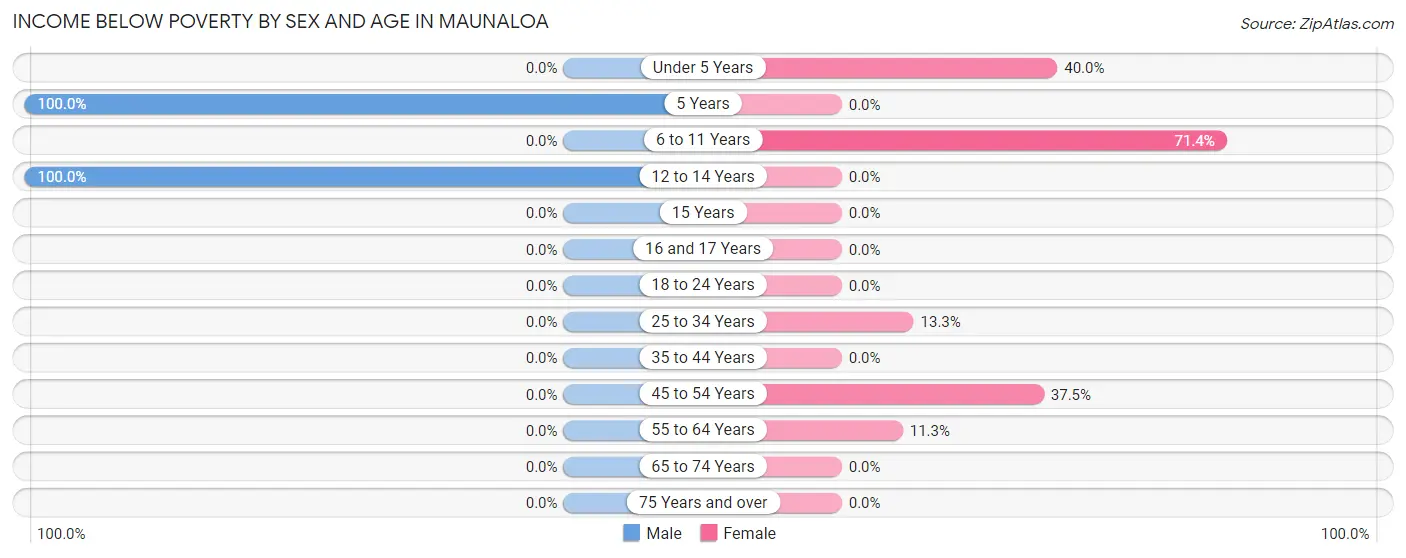
| Age Bracket | Male | Female |
| Under 5 Years | 0 (0.0%) | 6 (40.0%) |
| 5 Years | 12 (100.0%) | 0 (0.0%) |
| 6 to 11 Years | 0 (0.0%) | 10 (71.4%) |
| 12 to 14 Years | 6 (100.0%) | 0 (0.0%) |
| 15 Years | 0 (0.0%) | 0 (0.0%) |
| 16 and 17 Years | 0 (0.0%) | 0 (0.0%) |
| 18 to 24 Years | 0 (0.0%) | 0 (0.0%) |
| 25 to 34 Years | 0 (0.0%) | 4 (13.3%) |
| 35 to 44 Years | 0 (0.0%) | 0 (0.0%) |
| 45 to 54 Years | 0 (0.0%) | 3 (37.5%) |
| 55 to 64 Years | 0 (0.0%) | 6 (11.3%) |
| 65 to 74 Years | 0 (0.0%) | 0 (0.0%) |
| 75 Years and over | 0 (0.0%) | 0 (0.0%) |
| Total | 18 (16.8%) | 29 (16.9%) |
Income Above Poverty by Sex and Age in Maunaloa
According to the poverty statistics in Maunaloa, males aged under 5 years and females aged 12 to 14 years are the age groups that are most secure financially, with 100.0% of males and 100.0% of females in these age groups living above the poverty line.
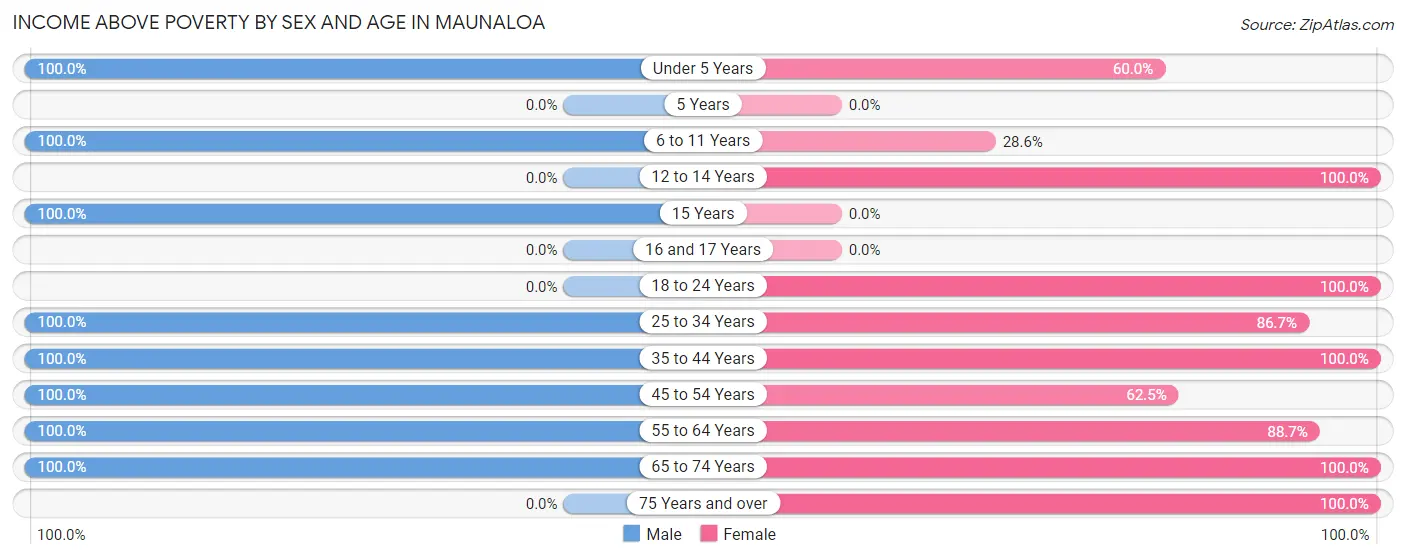
| Age Bracket | Male | Female |
| Under 5 Years | 14 (100.0%) | 9 (60.0%) |
| 5 Years | 0 (0.0%) | 0 (0.0%) |
| 6 to 11 Years | 15 (100.0%) | 4 (28.6%) |
| 12 to 14 Years | 0 (0.0%) | 9 (100.0%) |
| 15 Years | 4 (100.0%) | 0 (0.0%) |
| 16 and 17 Years | 0 (0.0%) | 0 (0.0%) |
| 18 to 24 Years | 0 (0.0%) | 17 (100.0%) |
| 25 to 34 Years | 3 (100.0%) | 26 (86.7%) |
| 35 to 44 Years | 17 (100.0%) | 17 (100.0%) |
| 45 to 54 Years | 3 (100.0%) | 5 (62.5%) |
| 55 to 64 Years | 25 (100.0%) | 47 (88.7%) |
| 65 to 74 Years | 8 (100.0%) | 6 (100.0%) |
| 75 Years and over | 0 (0.0%) | 3 (100.0%) |
| Total | 89 (83.2%) | 143 (83.1%) |
Income Below Poverty Among Married-Couple Families in Maunaloa
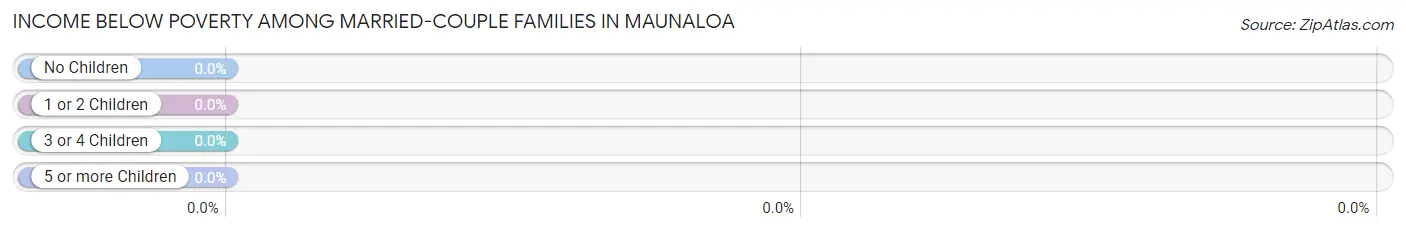
| Children | Above Poverty | Below Poverty |
| No Children | 39 (100.0%) | 0 (0.0%) |
| 1 or 2 Children | 6 (100.0%) | 0 (0.0%) |
| 3 or 4 Children | 3 (100.0%) | 0 (0.0%) |
| 5 or more Children | 0 (0.0%) | 0 (0.0%) |
| Total | 48 (100.0%) | 0 (0.0%) |
Income Below Poverty Among Single-Parent Households in Maunaloa
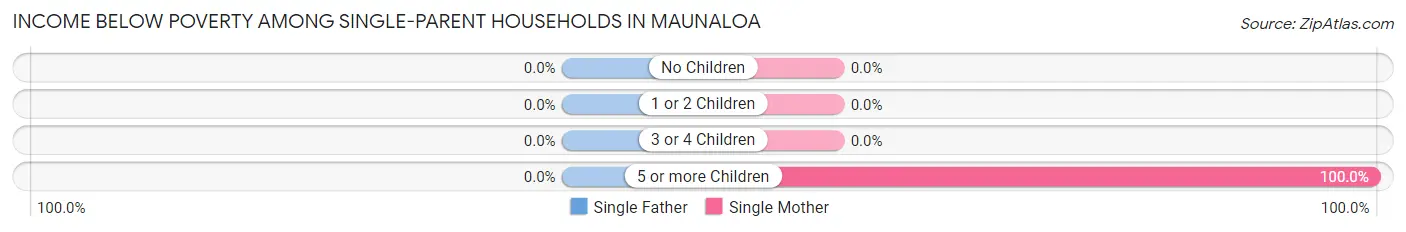
| Children | Single Father | Single Mother |
| No Children | 0 (0.0%) | 0 (0.0%) |
| 1 or 2 Children | 0 (0.0%) | 0 (0.0%) |
| 3 or 4 Children | 0 (0.0%) | 0 (0.0%) |
| 5 or more Children | 0 (0.0%) | 4 (100.0%) |
| Total | 0 (0.0%) | 4 (13.3%) |
Income Below Poverty Among Married-Couple vs Single-Parent Households in Maunaloa
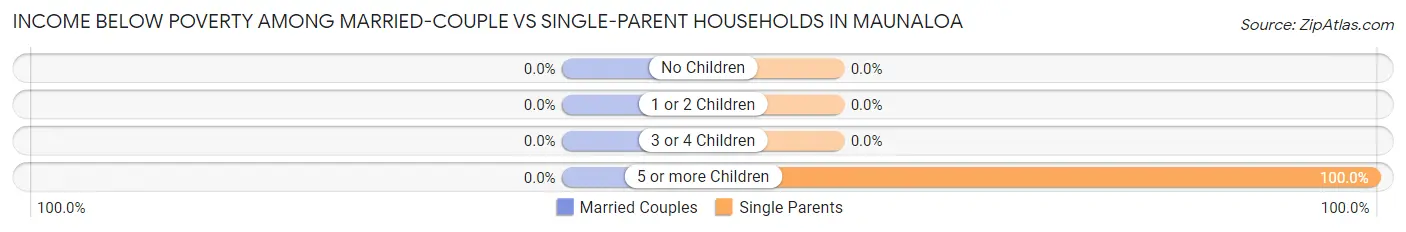
| Children | Married-Couple Families | Single-Parent Households |
| No Children | 0 (0.0%) | 0 (0.0%) |
| 1 or 2 Children | 0 (0.0%) | 0 (0.0%) |
| 3 or 4 Children | 0 (0.0%) | 0 (0.0%) |
| 5 or more Children | 0 (0.0%) | 4 (100.0%) |
| Total | 0 (0.0%) | 4 (13.3%) |
Race in Maunaloa
The most populous races in Maunaloa are Hawaiian / Pacific (127 | 45.5%), Two or more Races (101 | 36.2%), and White / Caucasian (30 | 10.7%).
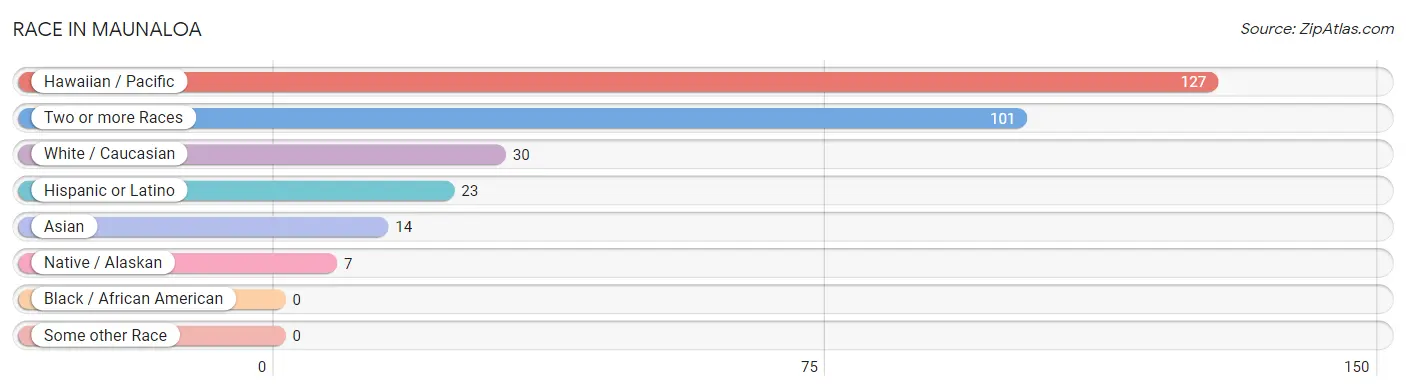
| Race | # Population | % Population |
| Asian | 14 | 5.0% |
| Black / African American | 0 | 0.0% |
| Hawaiian / Pacific | 127 | 45.5% |
| Hispanic or Latino | 23 | 8.2% |
| Native / Alaskan | 7 | 2.5% |
| White / Caucasian | 30 | 10.7% |
| Two or more Races | 101 | 36.2% |
| Some other Race | 0 | 0.0% |
| Total | 279 | 100.0% |
Ancestry in Maunaloa
The most populous ancestries reported in Maunaloa are Native Hawaiian (219 | 78.5%), Korean (78 | 28.0%), Indian (Asian) (43 | 15.4%), Portuguese (25 | 9.0%), and Scottish (25 | 9.0%), together accounting for 139.8% of all Maunaloa residents.
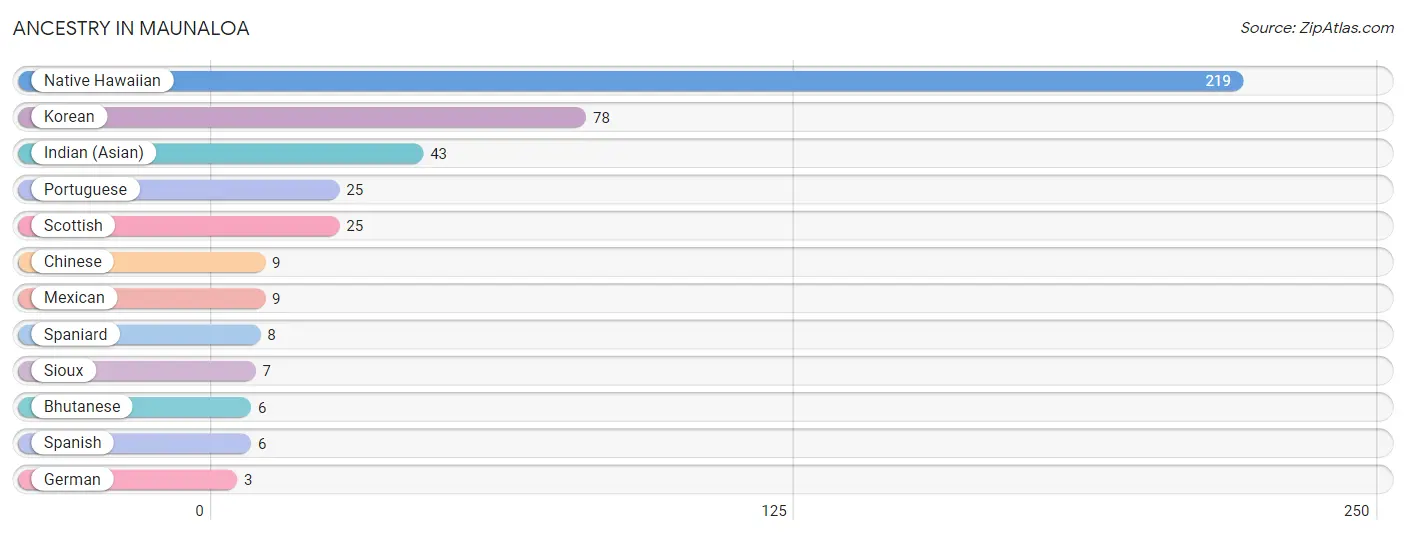
| Ancestry | # Population | % Population |
| Bhutanese | 6 | 2.1% |
| Chinese | 9 | 3.2% |
| German | 3 | 1.1% |
| Indian (Asian) | 43 | 15.4% |
| Korean | 78 | 28.0% |
| Mexican | 9 | 3.2% |
| Native Hawaiian | 219 | 78.5% |
| Portuguese | 25 | 9.0% |
| Scottish | 25 | 9.0% |
| Sioux | 7 | 2.5% |
| Spaniard | 8 | 2.9% |
| Spanish | 6 | 2.1% | View All 12 Rows |
Immigrants in Maunaloa
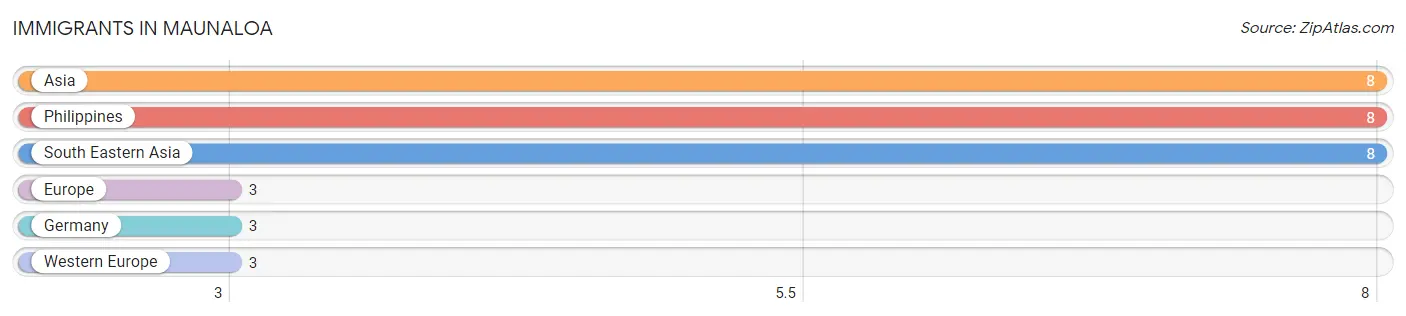
The most numerous immigrant groups reported in Maunaloa came from Asia (8 | 2.9%), Philippines (8 | 2.9%), South Eastern Asia (8 | 2.9%), Europe (3 | 1.1%), and Germany (3 | 1.1%), together accounting for 10.8% of all Maunaloa residents.
| Immigration Origin | # Population | % Population |
| Asia | 8 | 2.9% |
| Europe | 3 | 1.1% |
| Germany | 3 | 1.1% |
| Philippines | 8 | 2.9% |
| South Eastern Asia | 8 | 2.9% |
| Western Europe | 3 | 1.1% | View All 6 Rows |
Sex and Age in Maunaloa
Sex and Age in Maunaloa
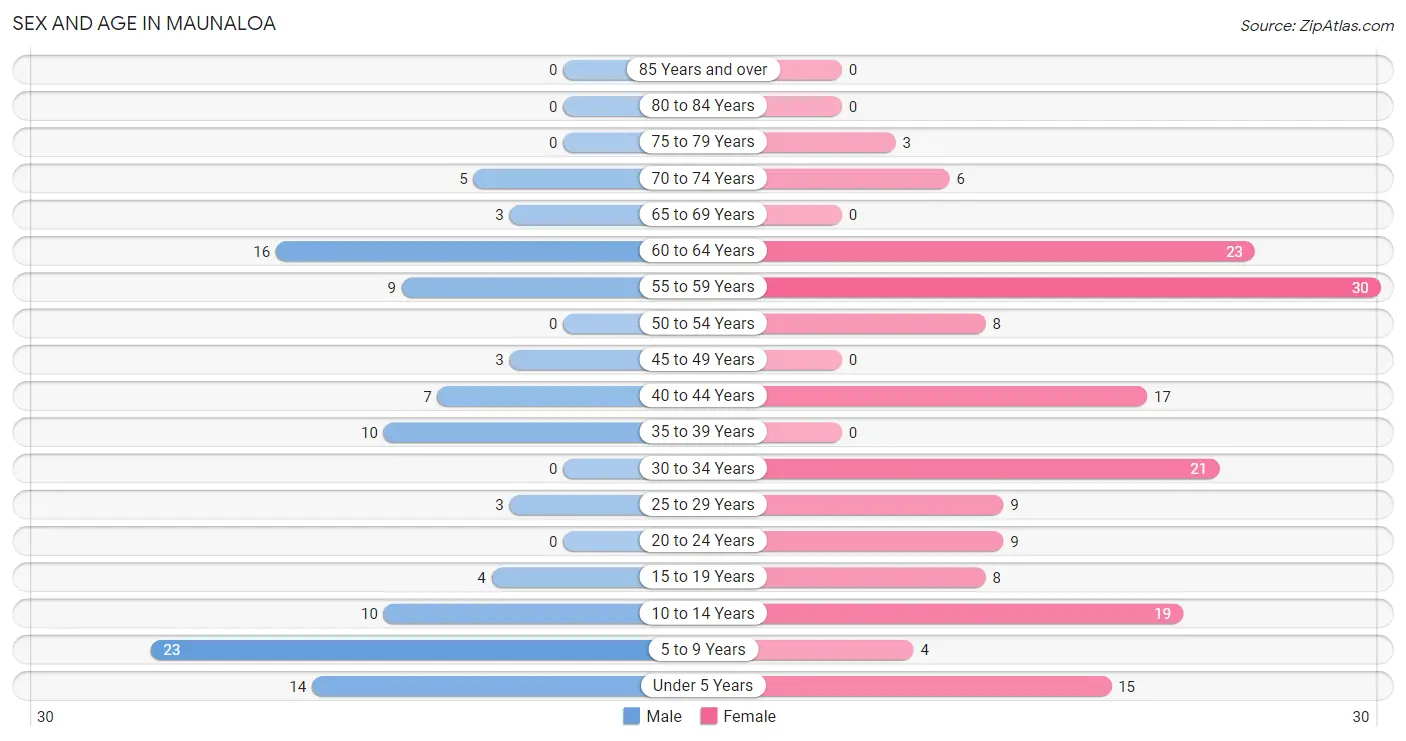
The most populous age groups in Maunaloa are 5 to 9 Years (23 | 21.5%) for men and 55 to 59 Years (30 | 17.4%) for women.
| Age Bracket | Male | Female |
| Under 5 Years | 14 (13.1%) | 15 (8.7%) |
| 5 to 9 Years | 23 (21.5%) | 4 (2.3%) |
| 10 to 14 Years | 10 (9.3%) | 19 (11.1%) |
| 15 to 19 Years | 4 (3.7%) | 8 (4.6%) |
| 20 to 24 Years | 0 (0.0%) | 9 (5.2%) |
| 25 to 29 Years | 3 (2.8%) | 9 (5.2%) |
| 30 to 34 Years | 0 (0.0%) | 21 (12.2%) |
| 35 to 39 Years | 10 (9.3%) | 0 (0.0%) |
| 40 to 44 Years | 7 (6.5%) | 17 (9.9%) |
| 45 to 49 Years | 3 (2.8%) | 0 (0.0%) |
| 50 to 54 Years | 0 (0.0%) | 8 (4.6%) |
| 55 to 59 Years | 9 (8.4%) | 30 (17.4%) |
| 60 to 64 Years | 16 (14.9%) | 23 (13.4%) |
| 65 to 69 Years | 3 (2.8%) | 0 (0.0%) |
| 70 to 74 Years | 5 (4.7%) | 6 (3.5%) |
| 75 to 79 Years | 0 (0.0%) | 3 (1.7%) |
| 80 to 84 Years | 0 (0.0%) | 0 (0.0%) |
| 85 Years and over | 0 (0.0%) | 0 (0.0%) |
| Total | 107 (100.0%) | 172 (100.0%) |
Families and Households in Maunaloa
Median Family Size in Maunaloa
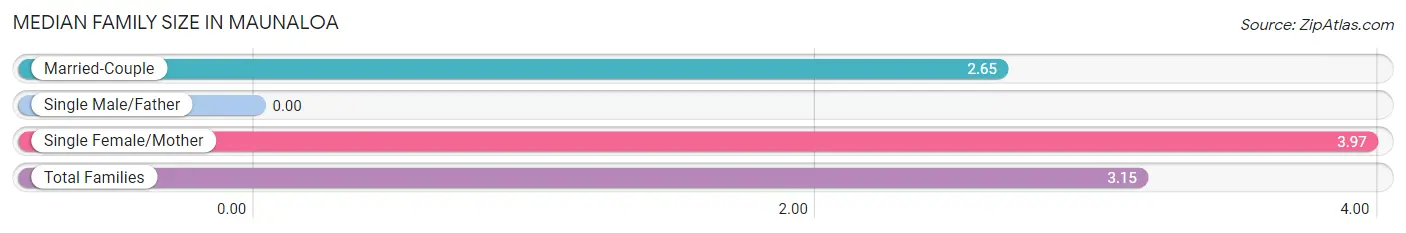
| Family Type | # Families | Family Size |
| Married-Couple | 48 (61.5%) | 2.65 |
| Single Male/Father | 0 (0.0%) | - |
| Single Female/Mother | 30 (38.5%) | 3.97 |
| Total Families | 78 (100.0%) | 3.15 |
Median Household Size in Maunaloa
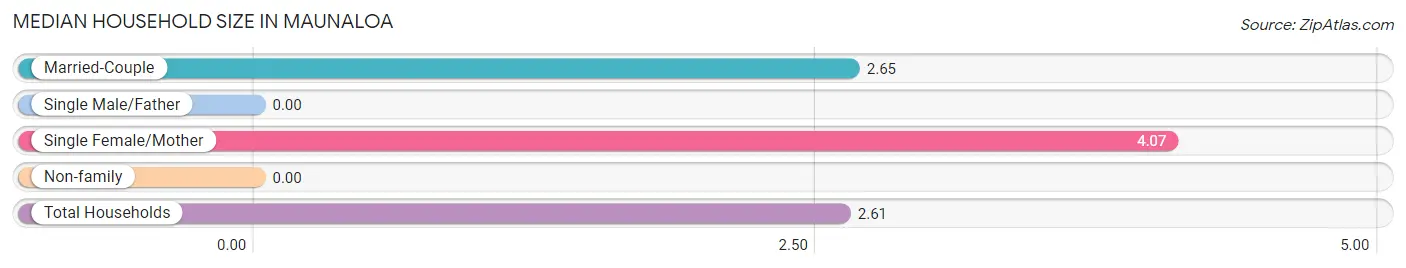
| Household Type | # Households | Household Size |
| Married-Couple | 48 (45.3%) | 2.65 |
| Single Male/Father | 0 (0.0%) | - |
| Single Female/Mother | 30 (28.3%) | 4.07 |
| Non-family | 28 (26.4%) | - |
| Total Households | 106 (100.0%) | 2.61 |
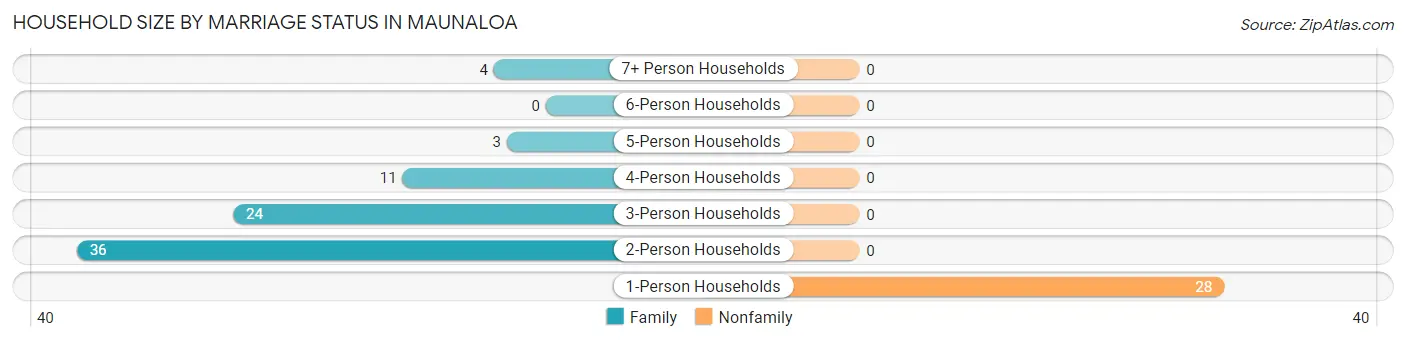
Household Size by Marriage Status in Maunaloa
Out of a total of 106 households in Maunaloa, 78 (73.6%) are family households, while 28 (26.4%) are nonfamily households. The most numerous type of family households are 2-person households, comprising 36, and the most common type of nonfamily households are 1-person households, comprising 28.
| Household Size | Family Households | Nonfamily Households |
| 1-Person Households | - | 28 (26.4%) |
| 2-Person Households | 36 (34.0%) | 0 (0.0%) |
| 3-Person Households | 24 (22.6%) | 0 (0.0%) |
| 4-Person Households | 11 (10.4%) | 0 (0.0%) |
| 5-Person Households | 3 (2.8%) | 0 (0.0%) |
| 6-Person Households | 0 (0.0%) | 0 (0.0%) |
| 7+ Person Households | 4 (3.8%) | 0 (0.0%) |
| Total | 78 (73.6%) | 28 (26.4%) |
Female Fertility in Maunaloa
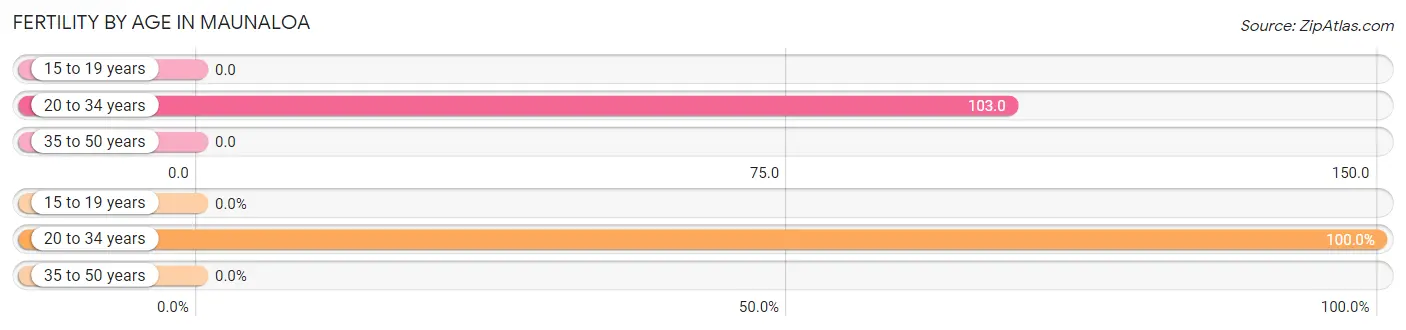
Fertility by Age in Maunaloa
Average fertility rate in Maunaloa is 63.0 births per 1,000 women. Women in the age bracket of 20 to 34 years have the highest fertility rate with 103.0 births per 1,000 women. Women in the age bracket of 20 to 34 years acount for 100.0% of all women with births.
| Age Bracket | Women with Births | Births / 1,000 Women |
| 15 to 19 years | 0 (0.0%) | 0.0 |
| 20 to 34 years | 4 (100.0%) | 103.0 |
| 35 to 50 years | 0 (0.0%) | 0.0 |
| Total | 4 (100.0%) | 63.0 |
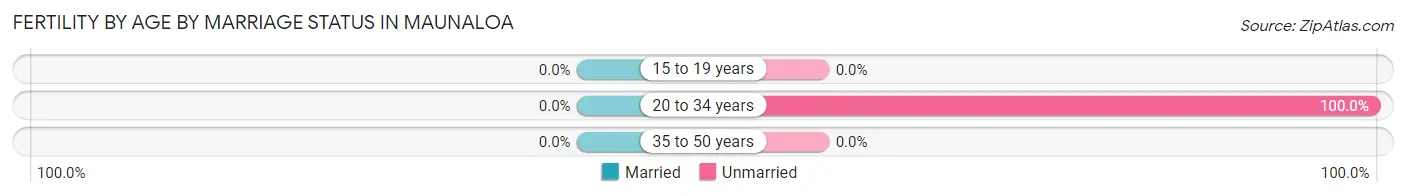
Fertility by Age by Marriage Status in Maunaloa
| Age Bracket | Married | Unmarried |
| 15 to 19 years | 0 (0.0%) | 0 (0.0%) |
| 20 to 34 years | 0 (0.0%) | 4 (100.0%) |
| 35 to 50 years | 0 (0.0%) | 0 (0.0%) |
| Total | 0 (0.0%) | 4 (100.0%) |
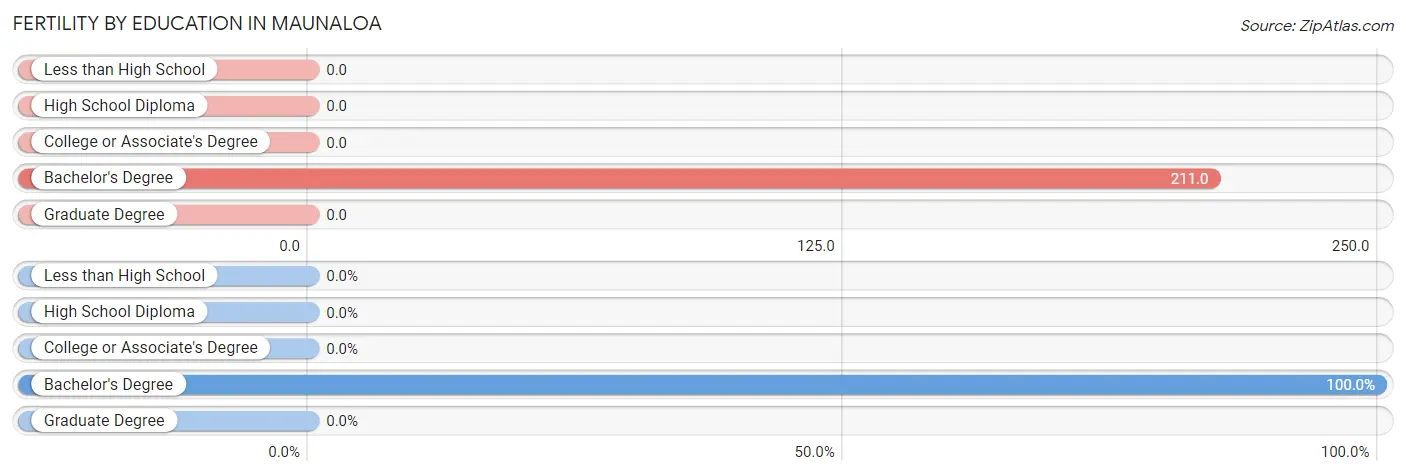
Fertility by Education in Maunaloa
| Educational Attainment | Women with Births | Births / 1,000 Women |
| Less than High School | 0 (0.0%) | 0.0 |
| High School Diploma | 0 (0.0%) | 0.0 |
| College or Associate's Degree | 0 (0.0%) | 0.0 |
| Bachelor's Degree | 4 (100.0%) | 211.0 |
| Graduate Degree | 0 (0.0%) | 0.0 |
| Total | 4 (100.0%) | 63.0 |
Fertility by Education by Marriage Status in Maunaloa
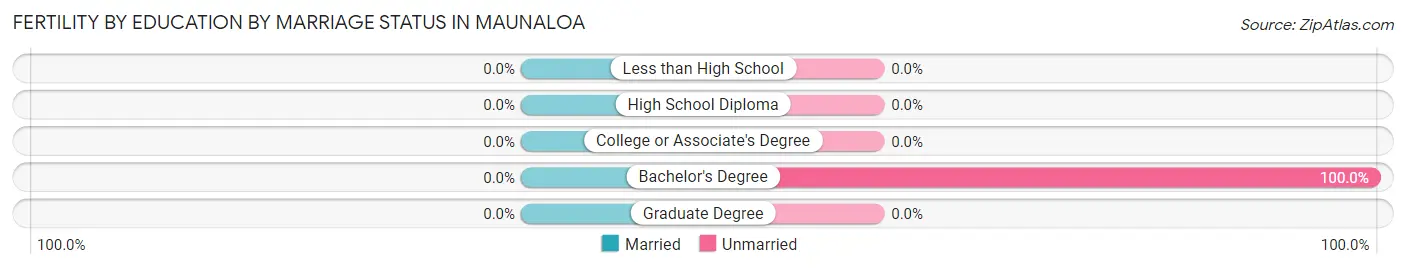
| Educational Attainment | Married | Unmarried |
| Less than High School | 0 (0.0%) | 0 (0.0%) |
| High School Diploma | 0 (0.0%) | 0 (0.0%) |
| College or Associate's Degree | 0 (0.0%) | 0 (0.0%) |
| Bachelor's Degree | 0 (0.0%) | 4 (100.0%) |
| Graduate Degree | 0 (0.0%) | 0 (0.0%) |
| Total | 0 (0.0%) | 4 (100.0%) |
Employment Characteristics in Maunaloa
Employment by Class of Employer in Maunaloa
Among the 124 employed individuals in Maunaloa, private company employees (56 | 45.2%), state government employees (40 | 32.3%), and self-employed (incorporated) (13 | 10.5%) make up the most common classes of employment.
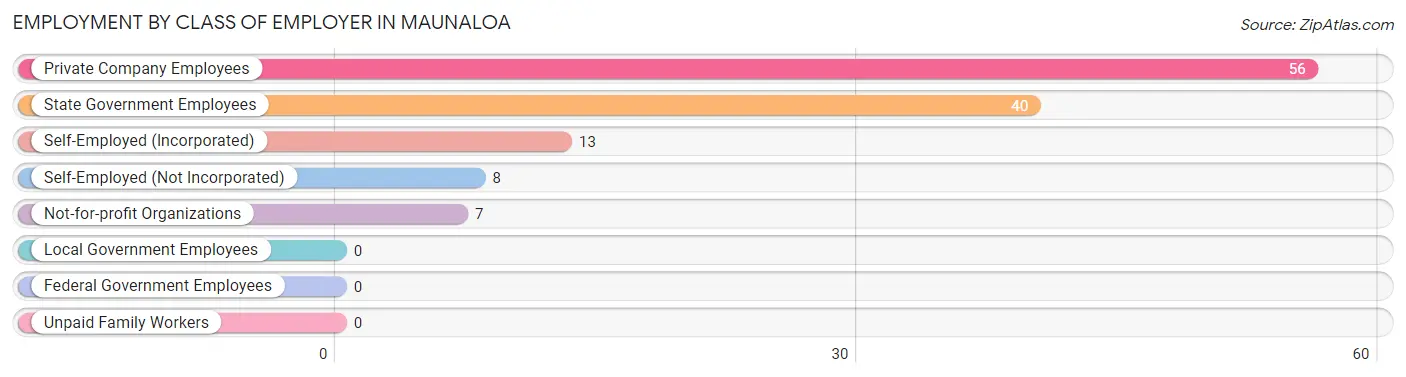
| Employer Class | # Employees | % Employees |
| Private Company Employees | 56 | 45.2% |
| Self-Employed (Incorporated) | 13 | 10.5% |
| Self-Employed (Not Incorporated) | 8 | 6.5% |
| Not-for-profit Organizations | 7 | 5.7% |
| Local Government Employees | 0 | 0.0% |
| State Government Employees | 40 | 32.3% |
| Federal Government Employees | 0 | 0.0% |
| Unpaid Family Workers | 0 | 0.0% |
| Total | 124 | 100.0% |
Employment Status by Age in Maunaloa
According to the labor force statistics for Maunaloa, out of the total population over 16 years of age (190), 66.8% or 127 individuals are in the labor force, with 2.4% or 3 of them unemployed. The age group with the highest labor force participation rate is 16 to 19 years, with 100.0% or 8 individuals in the labor force. Within the labor force, the 45 to 54 years age range has the highest percentage of unemployed individuals, with 27.3% or 3 of them being unemployed.
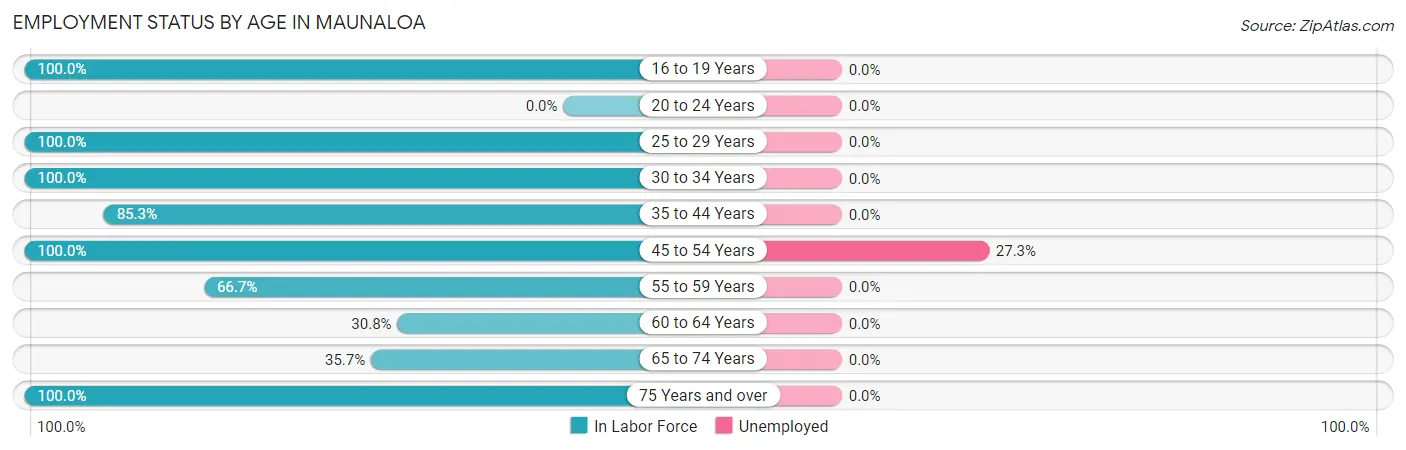
| Age Bracket | In Labor Force | Unemployed |
| 16 to 19 Years | 8 (100.0%) | 0 (0.0%) |
| 20 to 24 Years | 0 (0.0%) | 0 (0.0%) |
| 25 to 29 Years | 12 (100.0%) | 0 (0.0%) |
| 30 to 34 Years | 21 (100.0%) | 0 (0.0%) |
| 35 to 44 Years | 29 (85.3%) | 0 (0.0%) |
| 45 to 54 Years | 11 (100.0%) | 3 (27.3%) |
| 55 to 59 Years | 26 (66.7%) | 0 (0.0%) |
| 60 to 64 Years | 12 (30.8%) | 0 (0.0%) |
| 65 to 74 Years | 5 (35.7%) | 0 (0.0%) |
| 75 Years and over | 3 (100.0%) | 0 (0.0%) |
| Total | 127 (66.8%) | 3 (2.4%) |
Employment Status by Educational Attainment in Maunaloa
According to labor force statistics for Maunaloa, 71.2% of individuals (111) out of the total population between 25 and 64 years of age (156) are in the labor force, with 2.7% or 3 of them being unemployed. The group with the highest labor force participation rate are those with the educational attainment of high school diploma, with 100.0% or 27 individuals in the labor force. Within the labor force, individuals with college / associate degree education have the highest percentage of unemployment, with 6.5% or 3 of them being unemployed.
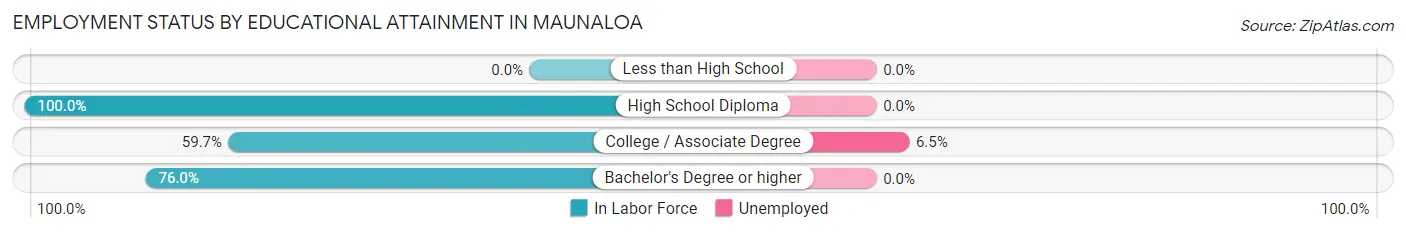
| Educational Attainment | In Labor Force | Unemployed |
| Less than High School | 0 (0.0%) | 0 (0.0%) |
| High School Diploma | 27 (100.0%) | 0 (0.0%) |
| College / Associate Degree | 46 (59.7%) | 5 (6.5%) |
| Bachelor's Degree or higher | 38 (76.0%) | 0 (0.0%) |
| Total | 111 (71.2%) | 4 (2.7%) |
Employment Occupations by Sex in Maunaloa
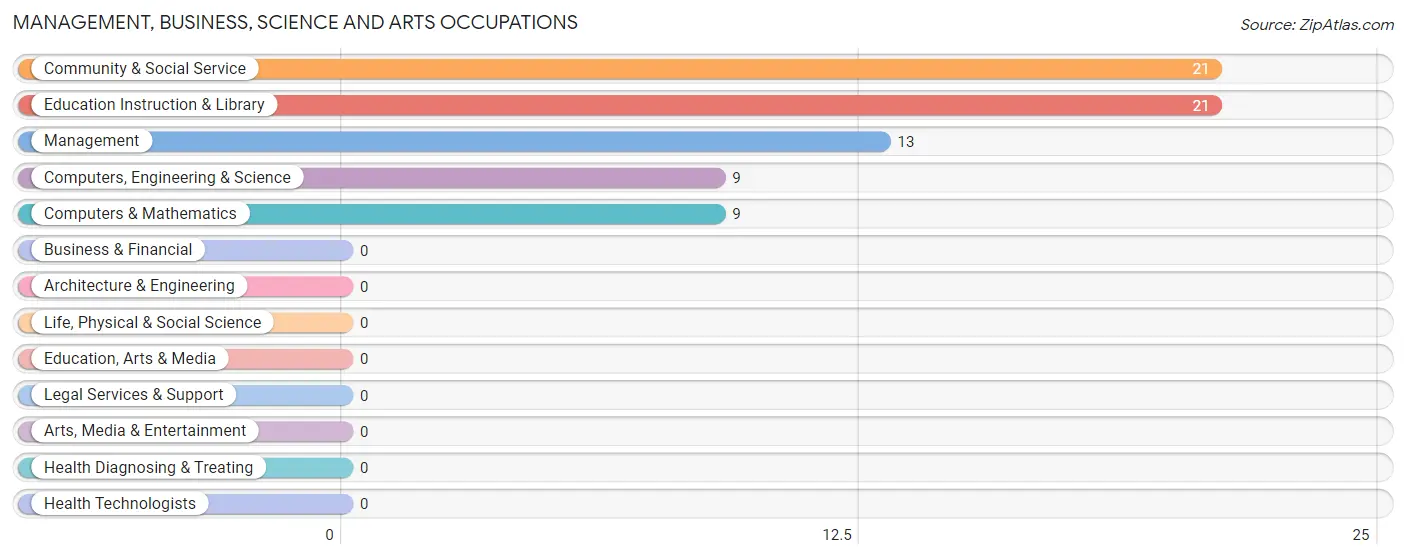
Management, Business, Science and Arts Occupations
The most common Management, Business, Science and Arts occupations in Maunaloa are Community & Social Service (21 | 16.9%), Education Instruction & Library (21 | 16.9%), Management (13 | 10.5%), Computers, Engineering & Science (9 | 7.3%), and Computers & Mathematics (9 | 7.3%).
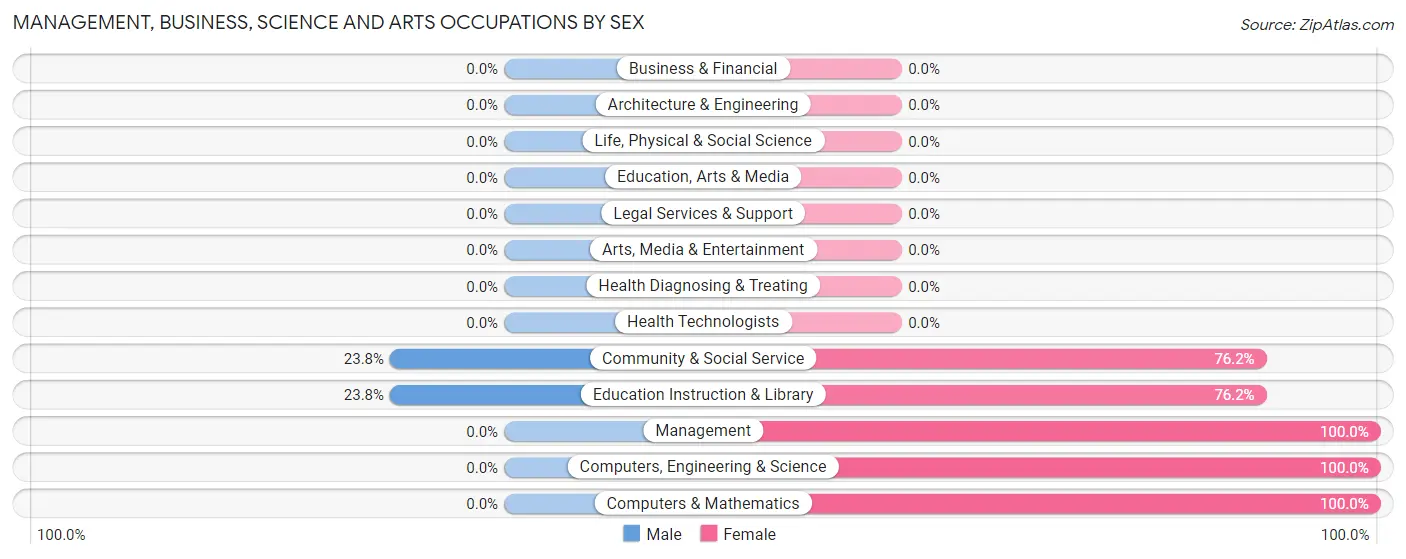
Management, Business, Science and Arts Occupations by Sex
Within the Management, Business, Science and Arts occupations in Maunaloa, the most male-oriented occupations are Community & Social Service (23.8%), and Education Instruction & Library (23.8%), while the most female-oriented occupations are Management (100.0%), Computers, Engineering & Science (100.0%), and Computers & Mathematics (100.0%).
| Occupation | Male | Female |
| Management | 0 (0.0%) | 13 (100.0%) |
| Business & Financial | 0 (0.0%) | 0 (0.0%) |
| Computers, Engineering & Science | 0 (0.0%) | 9 (100.0%) |
| Computers & Mathematics | 0 (0.0%) | 9 (100.0%) |
| Architecture & Engineering | 0 (0.0%) | 0 (0.0%) |
| Life, Physical & Social Science | 0 (0.0%) | 0 (0.0%) |
| Community & Social Service | 5 (23.8%) | 16 (76.2%) |
| Education, Arts & Media | 0 (0.0%) | 0 (0.0%) |
| Legal Services & Support | 0 (0.0%) | 0 (0.0%) |
| Education Instruction & Library | 5 (23.8%) | 16 (76.2%) |
| Arts, Media & Entertainment | 0 (0.0%) | 0 (0.0%) |
| Health Diagnosing & Treating | 0 (0.0%) | 0 (0.0%) |
| Health Technologists | 0 (0.0%) | 0 (0.0%) |
| Total (Category) | 5 (11.6%) | 38 (88.4%) |
| Total (Overall) | 38 (30.6%) | 86 (69.4%) |
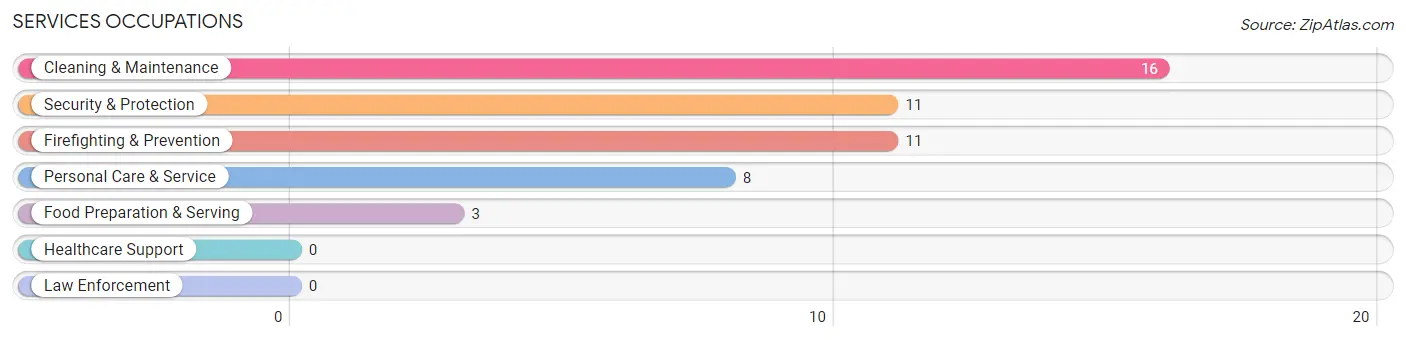
Services Occupations
The most common Services occupations in Maunaloa are Cleaning & Maintenance (16 | 12.9%), Security & Protection (11 | 8.9%), Firefighting & Prevention (11 | 8.9%), Personal Care & Service (8 | 6.5%), and Food Preparation & Serving (3 | 2.4%).
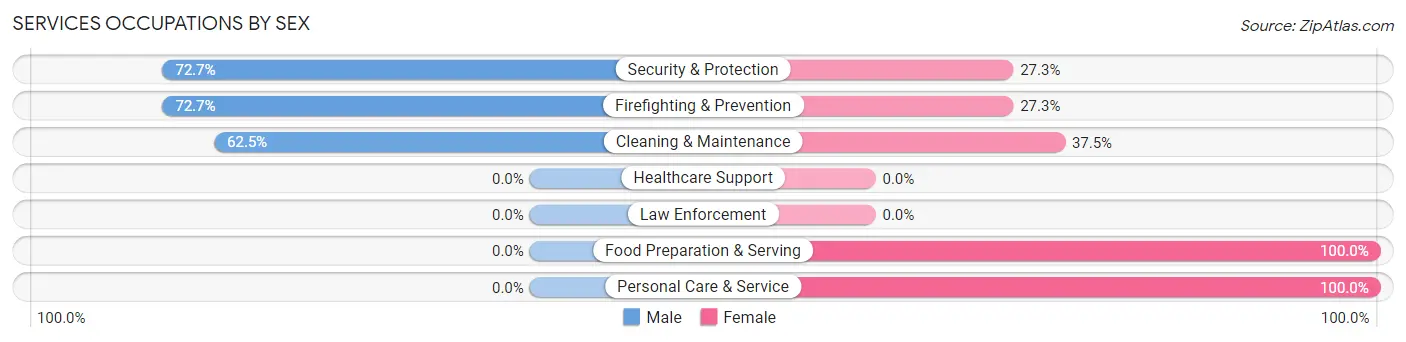
Services Occupations by Sex
Within the Services occupations in Maunaloa, the most male-oriented occupations are Security & Protection (72.7%), Firefighting & Prevention (72.7%), and Cleaning & Maintenance (62.5%), while the most female-oriented occupations are Food Preparation & Serving (100.0%), Personal Care & Service (100.0%), and Cleaning & Maintenance (37.5%).
| Occupation | Male | Female |
| Healthcare Support | 0 (0.0%) | 0 (0.0%) |
| Security & Protection | 8 (72.7%) | 3 (27.3%) |
| Firefighting & Prevention | 8 (72.7%) | 3 (27.3%) |
| Law Enforcement | 0 (0.0%) | 0 (0.0%) |
| Food Preparation & Serving | 0 (0.0%) | 3 (100.0%) |
| Cleaning & Maintenance | 10 (62.5%) | 6 (37.5%) |
| Personal Care & Service | 0 (0.0%) | 8 (100.0%) |
| Total (Category) | 18 (47.4%) | 20 (52.6%) |
| Total (Overall) | 38 (30.6%) | 86 (69.4%) |
Sales and Office Occupations
The most common Sales and Office occupations in Maunaloa are Office & Administration (17 | 13.7%), and Sales & Related (12 | 9.7%).
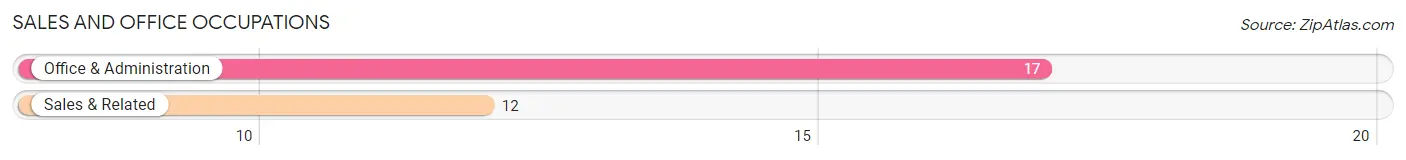
Sales and Office Occupations by Sex
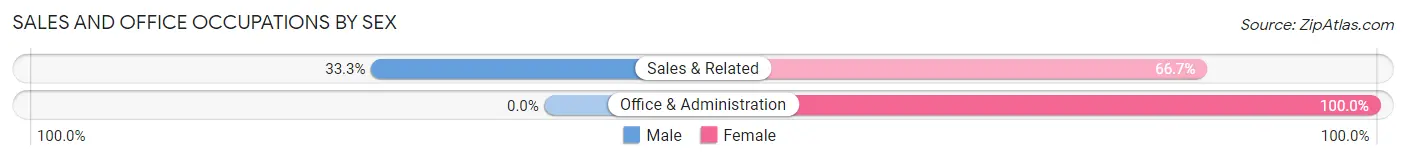
| Occupation | Male | Female |
| Sales & Related | 4 (33.3%) | 8 (66.7%) |
| Office & Administration | 0 (0.0%) | 17 (100.0%) |
| Total (Category) | 4 (13.8%) | 25 (86.2%) |
| Total (Overall) | 38 (30.6%) | 86 (69.4%) |
Natural Resources, Construction and Maintenance Occupations
The most common Natural Resources, Construction and Maintenance occupations in Maunaloa are Construction & Extraction (9 | 7.3%), and Farming, Fishing & Forestry (5 | 4.0%).
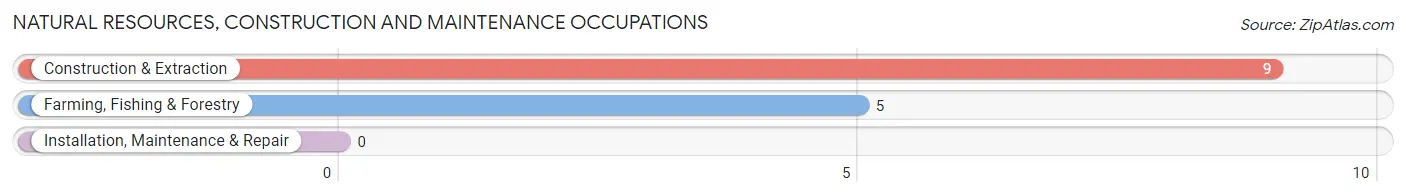
Natural Resources, Construction and Maintenance Occupations by Sex
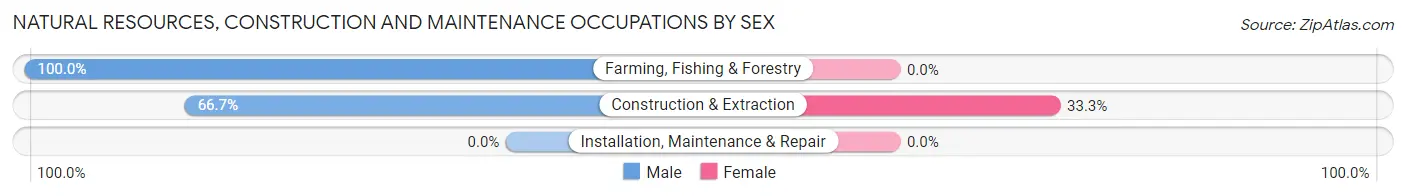
| Occupation | Male | Female |
| Farming, Fishing & Forestry | 5 (100.0%) | 0 (0.0%) |
| Construction & Extraction | 6 (66.7%) | 3 (33.3%) |
| Installation, Maintenance & Repair | 0 (0.0%) | 0 (0.0%) |
| Total (Category) | 11 (78.6%) | 3 (21.4%) |
| Total (Overall) | 38 (30.6%) | 86 (69.4%) |
Production, Transportation and Moving Occupations
Production, Transportation and Moving Occupations by Sex
| Occupation | Male | Female |
| Production | 0 (0.0%) | 0 (0.0%) |
| Transportation | 0 (0.0%) | 0 (0.0%) |
| Material Moving | 0 (0.0%) | 0 (0.0%) |
| Total (Category) | 0 (0.0%) | 0 (0.0%) |
| Total (Overall) | 38 (30.6%) | 86 (69.4%) |
Employment Industries by Sex in Maunaloa
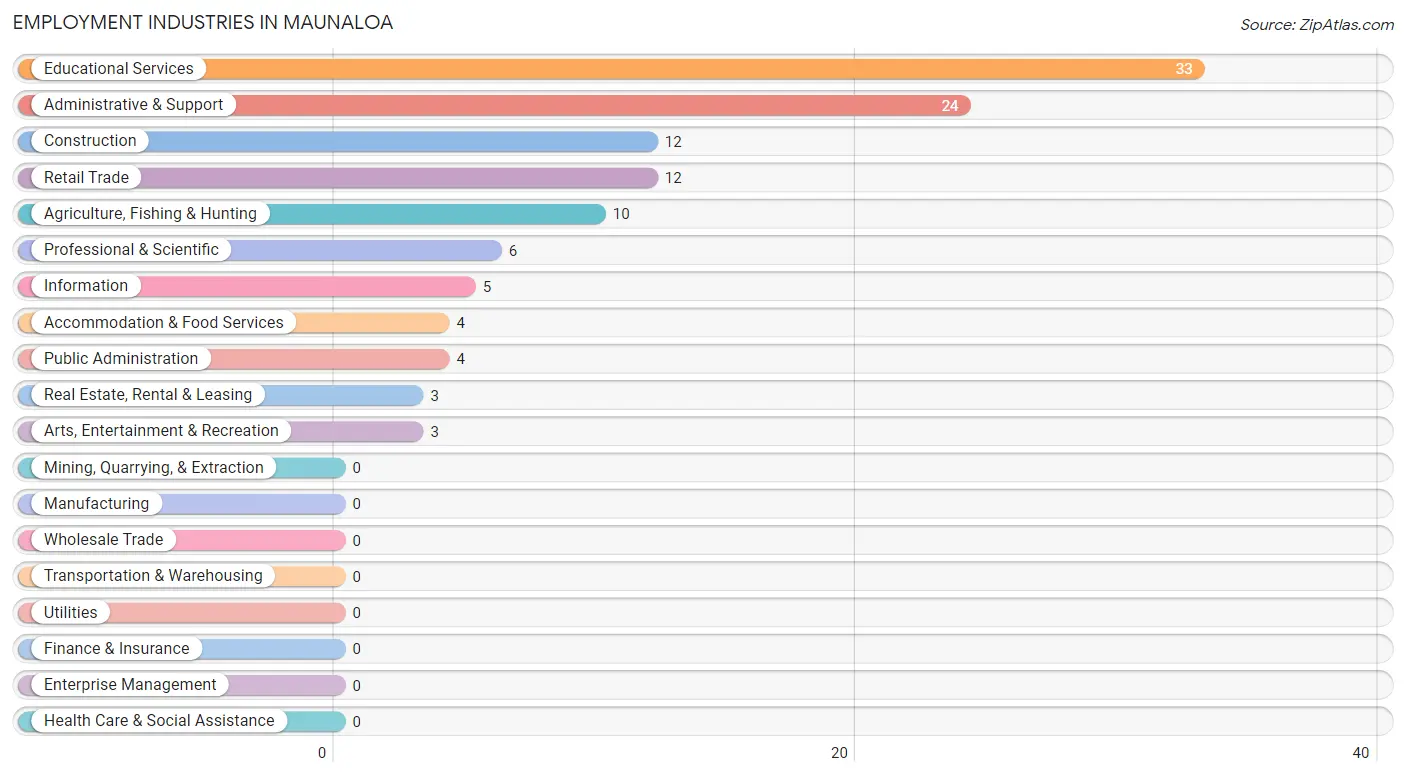
Employment Industries in Maunaloa
The major employment industries in Maunaloa include Educational Services (33 | 26.6%), Administrative & Support (24 | 19.4%), Construction (12 | 9.7%), Retail Trade (12 | 9.7%), and Agriculture, Fishing & Hunting (10 | 8.1%).
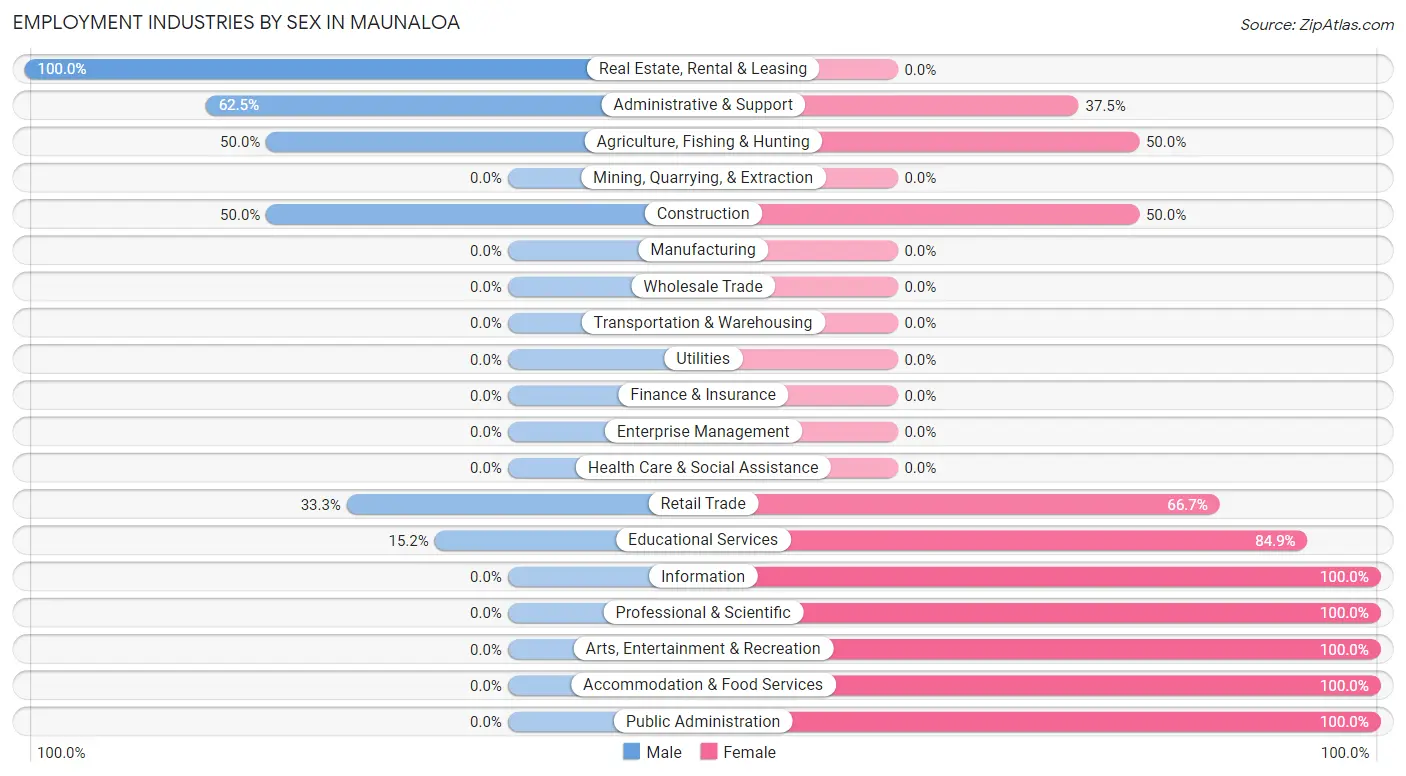
Employment Industries by Sex in Maunaloa
The Maunaloa industries that see more men than women are Real Estate, Rental & Leasing (100.0%), Administrative & Support (62.5%), and Agriculture, Fishing & Hunting (50.0%), whereas the industries that tend to have a higher number of women are Information (100.0%), Professional & Scientific (100.0%), and Arts, Entertainment & Recreation (100.0%).
| Industry | Male | Female |
| Agriculture, Fishing & Hunting | 5 (50.0%) | 5 (50.0%) |
| Mining, Quarrying, & Extraction | 0 (0.0%) | 0 (0.0%) |
| Construction | 6 (50.0%) | 6 (50.0%) |
| Manufacturing | 0 (0.0%) | 0 (0.0%) |
| Wholesale Trade | 0 (0.0%) | 0 (0.0%) |
| Retail Trade | 4 (33.3%) | 8 (66.7%) |
| Transportation & Warehousing | 0 (0.0%) | 0 (0.0%) |
| Utilities | 0 (0.0%) | 0 (0.0%) |
| Information | 0 (0.0%) | 5 (100.0%) |
| Finance & Insurance | 0 (0.0%) | 0 (0.0%) |
| Real Estate, Rental & Leasing | 3 (100.0%) | 0 (0.0%) |
| Professional & Scientific | 0 (0.0%) | 6 (100.0%) |
| Enterprise Management | 0 (0.0%) | 0 (0.0%) |
| Administrative & Support | 15 (62.5%) | 9 (37.5%) |
| Educational Services | 5 (15.1%) | 28 (84.9%) |
| Health Care & Social Assistance | 0 (0.0%) | 0 (0.0%) |
| Arts, Entertainment & Recreation | 0 (0.0%) | 3 (100.0%) |
| Accommodation & Food Services | 0 (0.0%) | 4 (100.0%) |
| Public Administration | 0 (0.0%) | 4 (100.0%) |
| Total | 38 (30.6%) | 86 (69.4%) |
Education in Maunaloa
School Enrollment in Maunaloa
The most common levels of schooling among the 80 students in Maunaloa are middle school (20 | 25.0%), college / undergraduate (20 | 25.0%), and high school (13 | 16.3%).
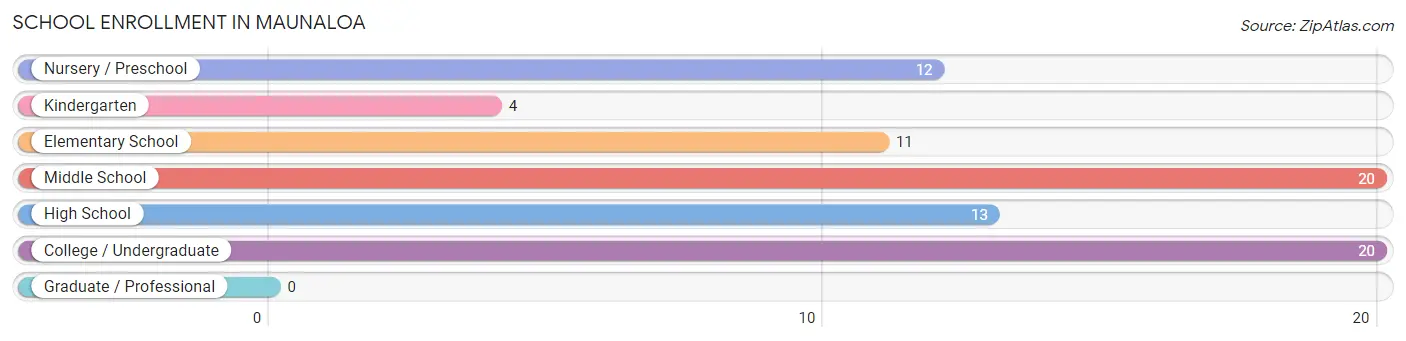
| School Level | # Students | % Students |
| Nursery / Preschool | 12 | 15.0% |
| Kindergarten | 4 | 5.0% |
| Elementary School | 11 | 13.8% |
| Middle School | 20 | 25.0% |
| High School | 13 | 16.3% |
| College / Undergraduate | 20 | 25.0% |
| Graduate / Professional | 0 | 0.0% |
| Total | 80 | 100.0% |
School Enrollment by Age by Funding Source in Maunaloa
Out of a total of 80 students who are enrolled in schools in Maunaloa, 14 (17.5%) attend a private institution, while the remaining 66 (82.5%) are enrolled in public schools. The age group of 25 to 34 year olds has the highest likelihood of being enrolled in private schools, with 9 (100.0% in the age bracket) enrolled. Conversely, the age group of 5 to 9 year old has the lowest likelihood of being enrolled in a private school, with 27 (100.0% in the age bracket) attending a public institution.
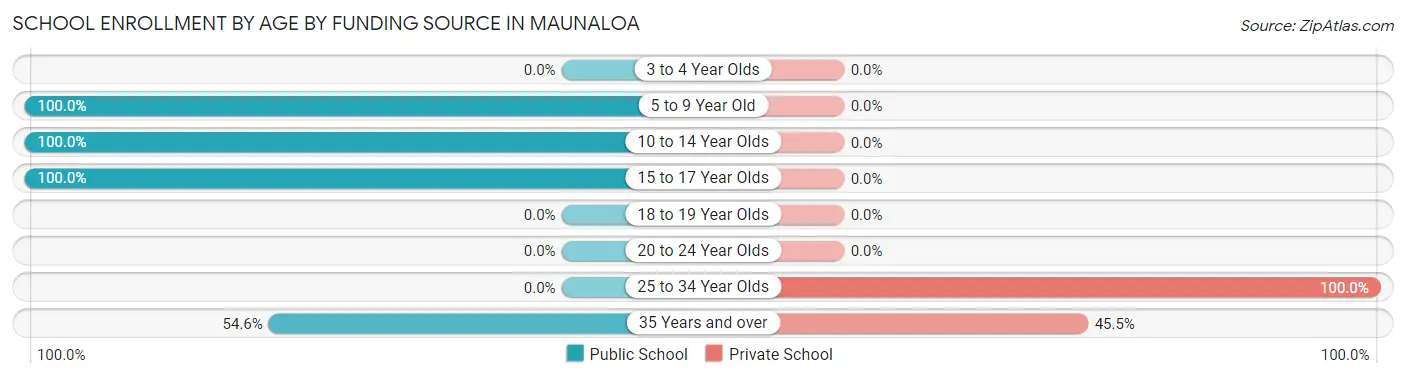
| Age Bracket | Public School | Private School |
| 3 to 4 Year Olds | 0 (0.0%) | 0 (0.0%) |
| 5 to 9 Year Old | 27 (100.0%) | 0 (0.0%) |
| 10 to 14 Year Olds | 29 (100.0%) | 0 (0.0%) |
| 15 to 17 Year Olds | 4 (100.0%) | 0 (0.0%) |
| 18 to 19 Year Olds | 0 (0.0%) | 0 (0.0%) |
| 20 to 24 Year Olds | 0 (0.0%) | 0 (0.0%) |
| 25 to 34 Year Olds | 0 (0.0%) | 9 (100.0%) |
| 35 Years and over | 6 (54.5%) | 5 (45.5%) |
| Total | 66 (82.5%) | 14 (17.5%) |
Educational Attainment by Field of Study in Maunaloa
Education (14 | 24.1%), engineering (8 | 13.8%), business (8 | 13.8%), visual & performing arts (8 | 13.8%), and arts & humanities (8 | 13.8%) are the most common fields of study among 58 individuals in Maunaloa who have obtained a bachelor's degree or higher.
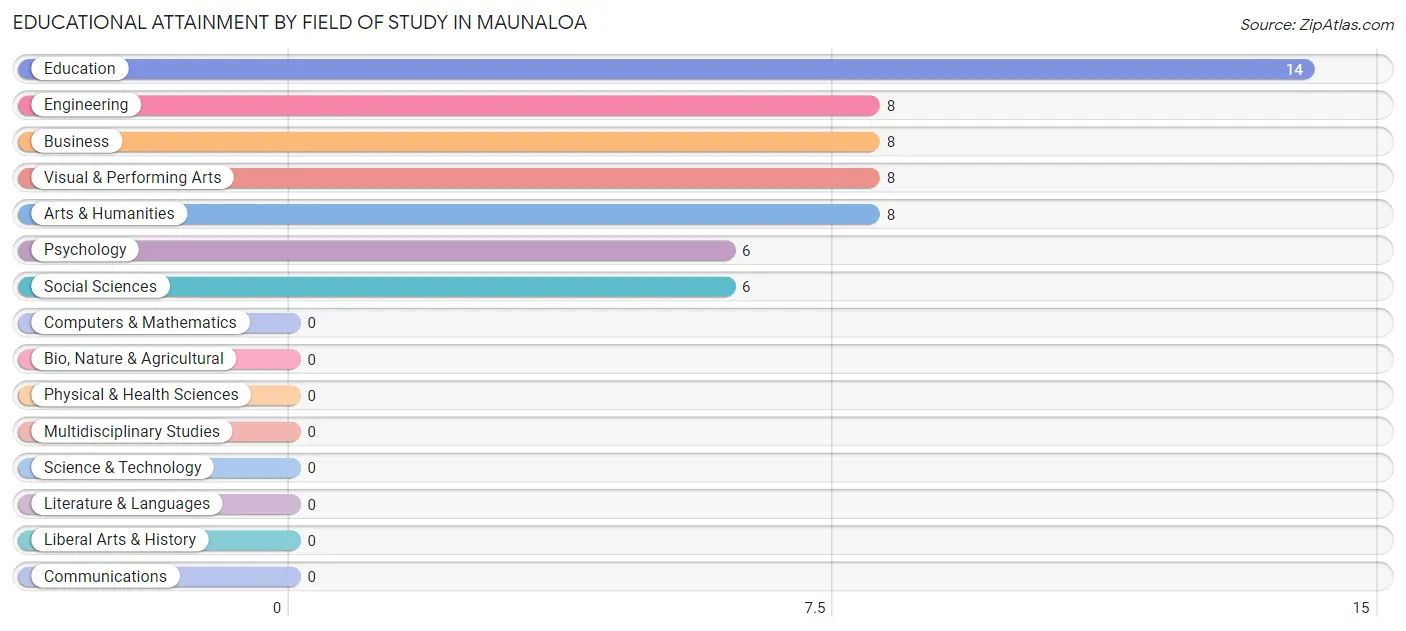
| Field of Study | # Graduates | % Graduates |
| Computers & Mathematics | 0 | 0.0% |
| Bio, Nature & Agricultural | 0 | 0.0% |
| Physical & Health Sciences | 0 | 0.0% |
| Psychology | 6 | 10.3% |
| Social Sciences | 6 | 10.3% |
| Engineering | 8 | 13.8% |
| Multidisciplinary Studies | 0 | 0.0% |
| Science & Technology | 0 | 0.0% |
| Business | 8 | 13.8% |
| Education | 14 | 24.1% |
| Literature & Languages | 0 | 0.0% |
| Liberal Arts & History | 0 | 0.0% |
| Visual & Performing Arts | 8 | 13.8% |
| Communications | 0 | 0.0% |
| Arts & Humanities | 8 | 13.8% |
| Total | 58 | 100.0% |
Transportation & Commute in Maunaloa
Vehicle Availability by Sex in Maunaloa
The most prevalent vehicle ownership categories in Maunaloa are males with 3 vehicles (15, accounting for 39.5%) and females with 3 vehicles (3, making up 17.4%).
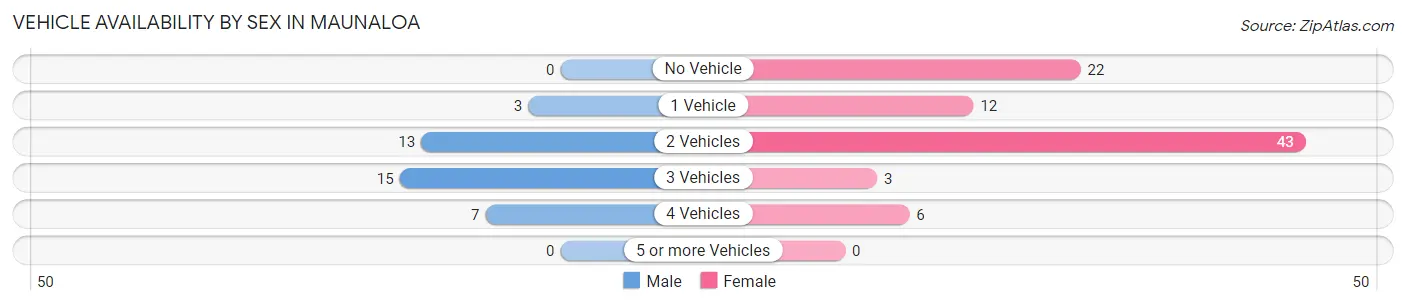
| Vehicles Available | Male | Female |
| No Vehicle | 0 (0.0%) | 22 (25.6%) |
| 1 Vehicle | 3 (7.9%) | 12 (14.0%) |
| 2 Vehicles | 13 (34.2%) | 43 (50.0%) |
| 3 Vehicles | 15 (39.5%) | 3 (3.5%) |
| 4 Vehicles | 7 (18.4%) | 6 (7.0%) |
| 5 or more Vehicles | 0 (0.0%) | 0 (0.0%) |
| Total | 38 (100.0%) | 86 (100.0%) |
Commute Time in Maunaloa
The most frequently occuring commute durations in Maunaloa are 30 to 34 minutes (29 commuters, 24.6%), 5 to 9 minutes (25 commuters, 21.2%), and less than 5 minutes (21 commuters, 17.8%).
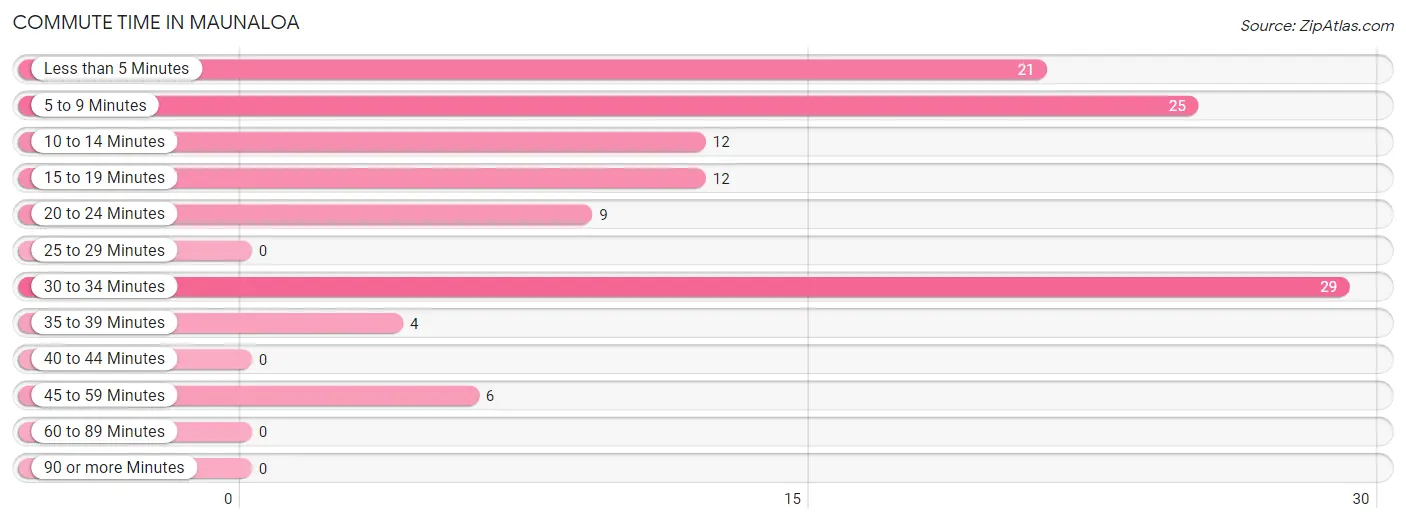
| Commute Time | # Commuters | % Commuters |
| Less than 5 Minutes | 21 | 17.8% |
| 5 to 9 Minutes | 25 | 21.2% |
| 10 to 14 Minutes | 12 | 10.2% |
| 15 to 19 Minutes | 12 | 10.2% |
| 20 to 24 Minutes | 9 | 7.6% |
| 25 to 29 Minutes | 0 | 0.0% |
| 30 to 34 Minutes | 29 | 24.6% |
| 35 to 39 Minutes | 4 | 3.4% |
| 40 to 44 Minutes | 0 | 0.0% |
| 45 to 59 Minutes | 6 | 5.1% |
| 60 to 89 Minutes | 0 | 0.0% |
| 90 or more Minutes | 0 | 0.0% |
Commute Time by Sex in Maunaloa
The most common commute times in Maunaloa are 30 to 34 minutes (8 commuters, 21.0%) for males and 5 to 9 minutes (25 commuters, 31.2%) for females.
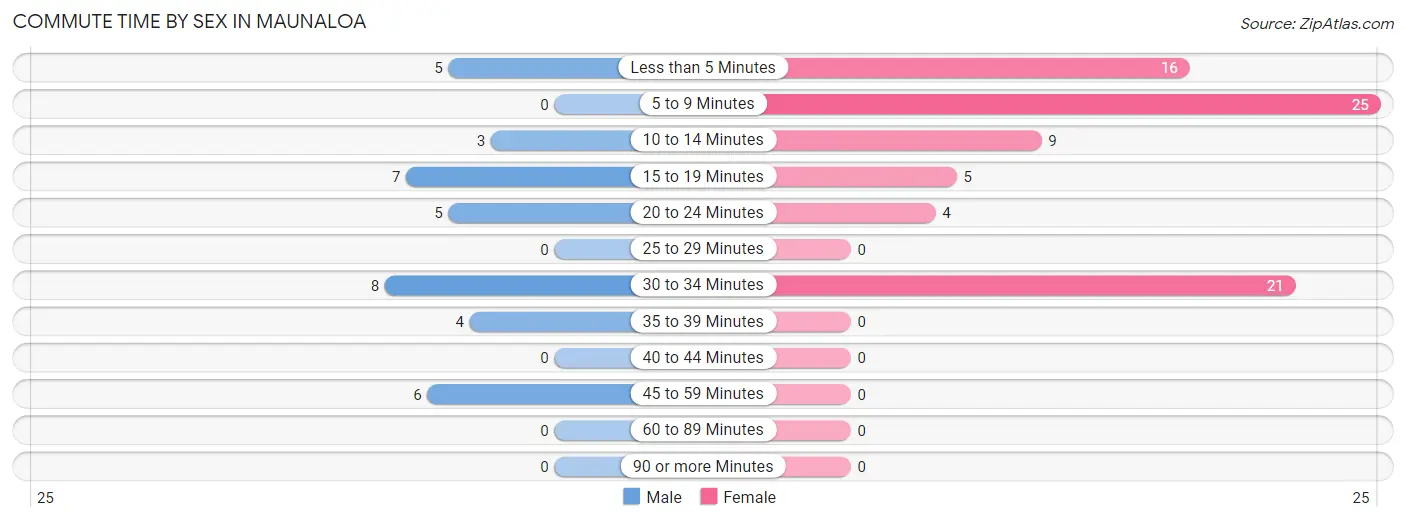
| Commute Time | Male | Female |
| Less than 5 Minutes | 5 (13.2%) | 16 (20.0%) |
| 5 to 9 Minutes | 0 (0.0%) | 25 (31.2%) |
| 10 to 14 Minutes | 3 (7.9%) | 9 (11.3%) |
| 15 to 19 Minutes | 7 (18.4%) | 5 (6.2%) |
| 20 to 24 Minutes | 5 (13.2%) | 4 (5.0%) |
| 25 to 29 Minutes | 0 (0.0%) | 0 (0.0%) |
| 30 to 34 Minutes | 8 (21.0%) | 21 (26.3%) |
| 35 to 39 Minutes | 4 (10.5%) | 0 (0.0%) |
| 40 to 44 Minutes | 0 (0.0%) | 0 (0.0%) |
| 45 to 59 Minutes | 6 (15.8%) | 0 (0.0%) |
| 60 to 89 Minutes | 0 (0.0%) | 0 (0.0%) |
| 90 or more Minutes | 0 (0.0%) | 0 (0.0%) |
Time of Departure to Work by Sex in Maunaloa
The most frequent times of departure to work in Maunaloa are 7:00 AM to 7:29 AM (12, 31.6%) for males and 6:30 AM to 6:59 AM (39, 48.7%) for females.
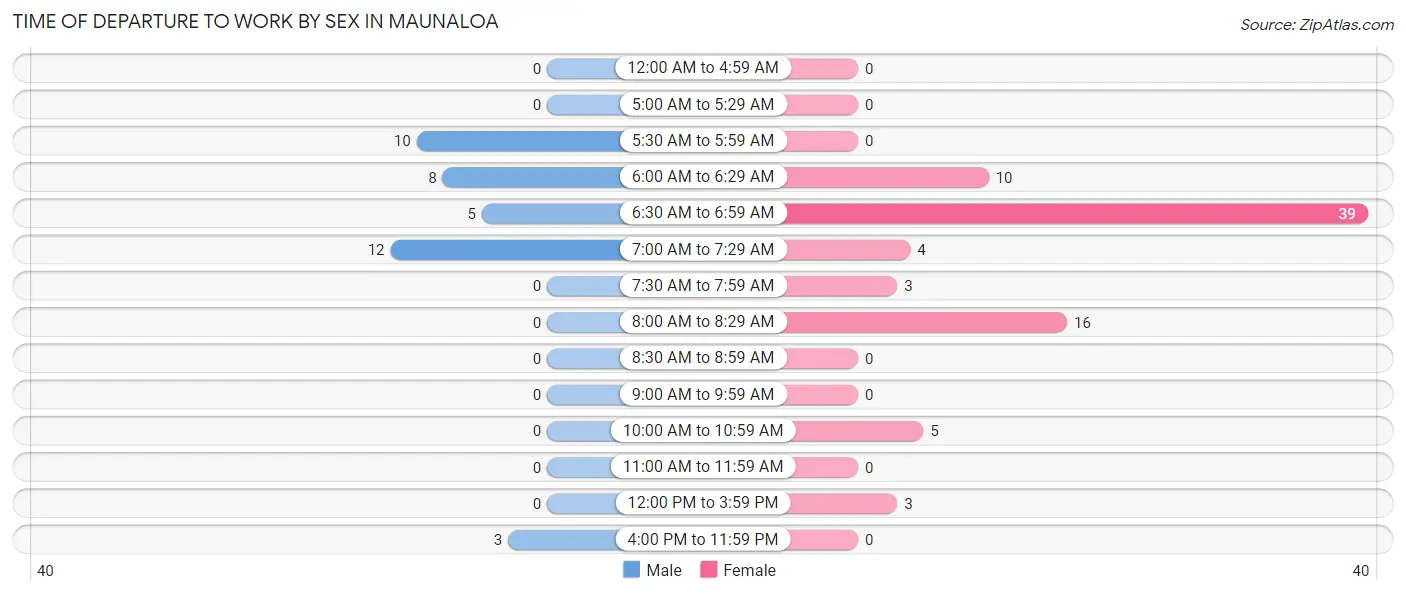
| Time of Departure | Male | Female |
| 12:00 AM to 4:59 AM | 0 (0.0%) | 0 (0.0%) |
| 5:00 AM to 5:29 AM | 0 (0.0%) | 0 (0.0%) |
| 5:30 AM to 5:59 AM | 10 (26.3%) | 0 (0.0%) |
| 6:00 AM to 6:29 AM | 8 (21.0%) | 10 (12.5%) |
| 6:30 AM to 6:59 AM | 5 (13.2%) | 39 (48.7%) |
| 7:00 AM to 7:29 AM | 12 (31.6%) | 4 (5.0%) |
| 7:30 AM to 7:59 AM | 0 (0.0%) | 3 (3.7%) |
| 8:00 AM to 8:29 AM | 0 (0.0%) | 16 (20.0%) |
| 8:30 AM to 8:59 AM | 0 (0.0%) | 0 (0.0%) |
| 9:00 AM to 9:59 AM | 0 (0.0%) | 0 (0.0%) |
| 10:00 AM to 10:59 AM | 0 (0.0%) | 5 (6.2%) |
| 11:00 AM to 11:59 AM | 0 (0.0%) | 0 (0.0%) |
| 12:00 PM to 3:59 PM | 0 (0.0%) | 3 (3.7%) |
| 4:00 PM to 11:59 PM | 3 (7.9%) | 0 (0.0%) |
| Total | 38 (100.0%) | 80 (100.0%) |
Housing Occupancy in Maunaloa
Occupancy by Ownership in Maunaloa
Of the total 106 dwellings in Maunaloa, owner-occupied units account for 36 (34.0%), while renter-occupied units make up 70 (66.0%).
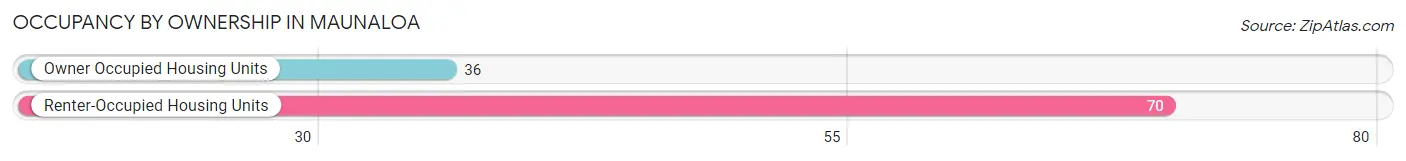
| Occupancy | # Housing Units | % Housing Units |
| Owner Occupied Housing Units | 36 | 34.0% |
| Renter-Occupied Housing Units | 70 | 66.0% |
| Total Occupied Housing Units | 106 | 100.0% |
Occupancy by Household Size in Maunaloa
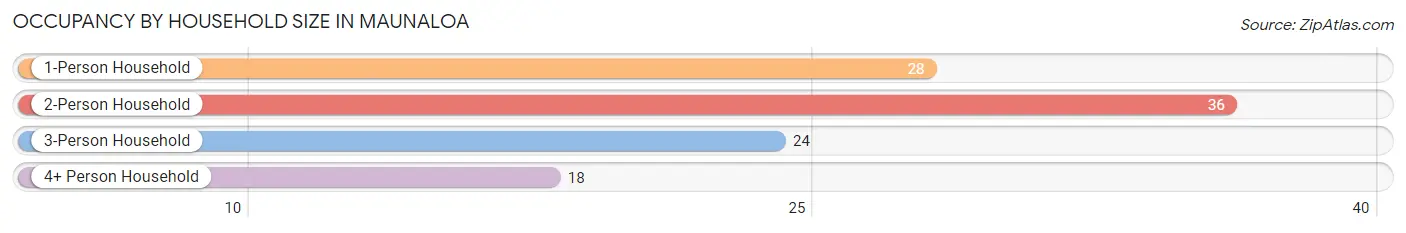
| Household Size | # Housing Units | % Housing Units |
| 1-Person Household | 28 | 26.4% |
| 2-Person Household | 36 | 34.0% |
| 3-Person Household | 24 | 22.6% |
| 4+ Person Household | 18 | 17.0% |
| Total Housing Units | 106 | 100.0% |
Occupancy by Ownership by Household Size in Maunaloa
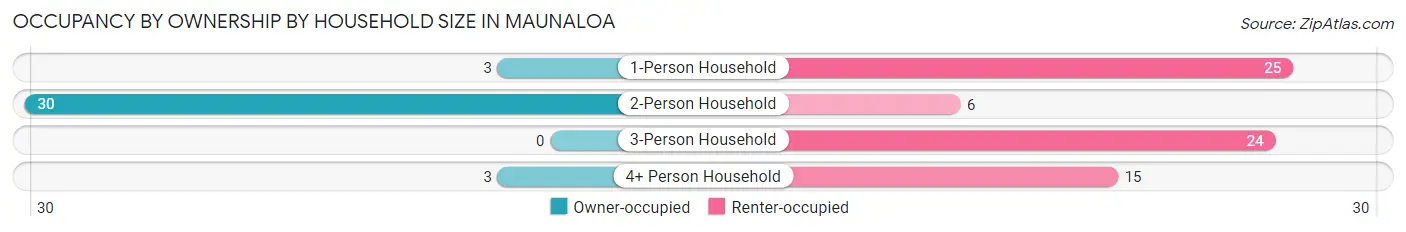
| Household Size | Owner-occupied | Renter-occupied |
| 1-Person Household | 3 (10.7%) | 25 (89.3%) |
| 2-Person Household | 30 (83.3%) | 6 (16.7%) |
| 3-Person Household | 0 (0.0%) | 24 (100.0%) |
| 4+ Person Household | 3 (16.7%) | 15 (83.3%) |
| Total Housing Units | 36 (34.0%) | 70 (66.0%) |
Occupancy by Educational Attainment in Maunaloa
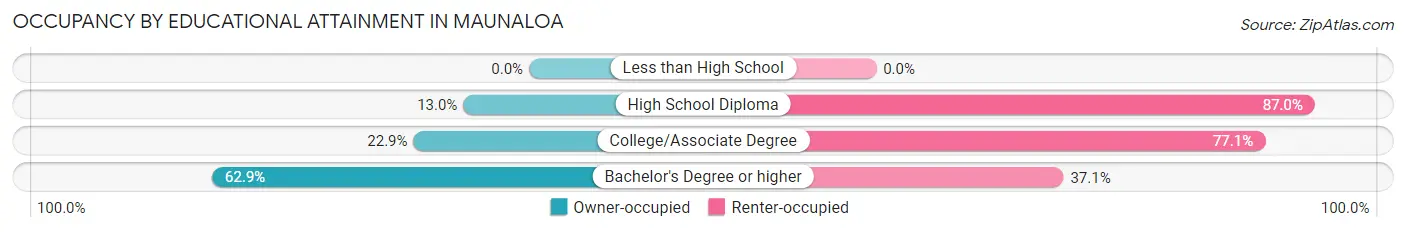
| Household Size | Owner-occupied | Renter-occupied |
| Less than High School | 0 (0.0%) | 0 (0.0%) |
| High School Diploma | 3 (13.0%) | 20 (87.0%) |
| College/Associate Degree | 11 (22.9%) | 37 (77.1%) |
| Bachelor's Degree or higher | 22 (62.9%) | 13 (37.1%) |
Occupancy by Age of Householder in Maunaloa
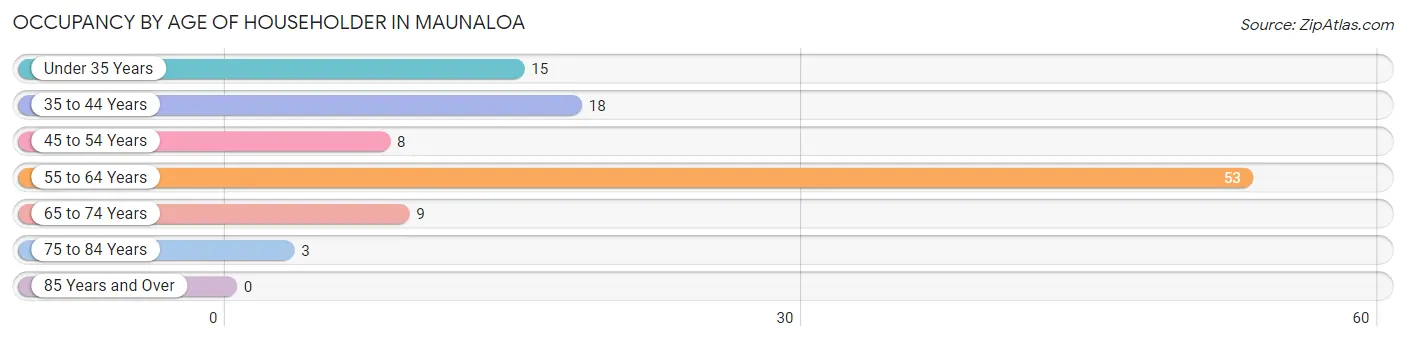
| Age Bracket | # Households | % Households |
| Under 35 Years | 15 | 14.1% |
| 35 to 44 Years | 18 | 17.0% |
| 45 to 54 Years | 8 | 7.5% |
| 55 to 64 Years | 53 | 50.0% |
| 65 to 74 Years | 9 | 8.5% |
| 75 to 84 Years | 3 | 2.8% |
| 85 Years and Over | 0 | 0.0% |
| Total | 106 | 100.0% |
Housing Finances in Maunaloa
Median Income by Occupancy in Maunaloa
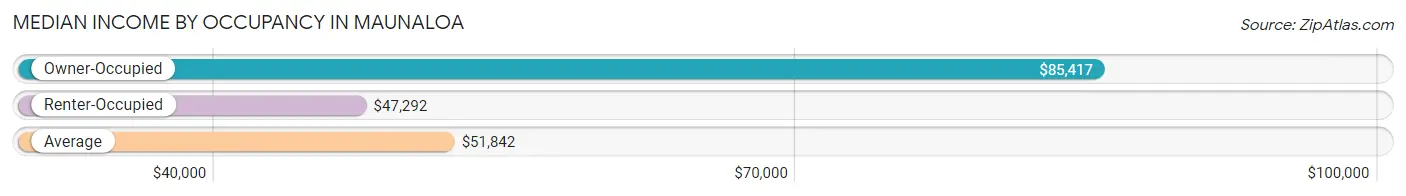
| Occupancy Type | # Households | Median Income |
| Owner-Occupied | 36 (34.0%) | $85,417 |
| Renter-Occupied | 70 (66.0%) | $47,292 |
| Average | 106 (100.0%) | $51,842 |
Occupancy by Householder Income Bracket in Maunaloa
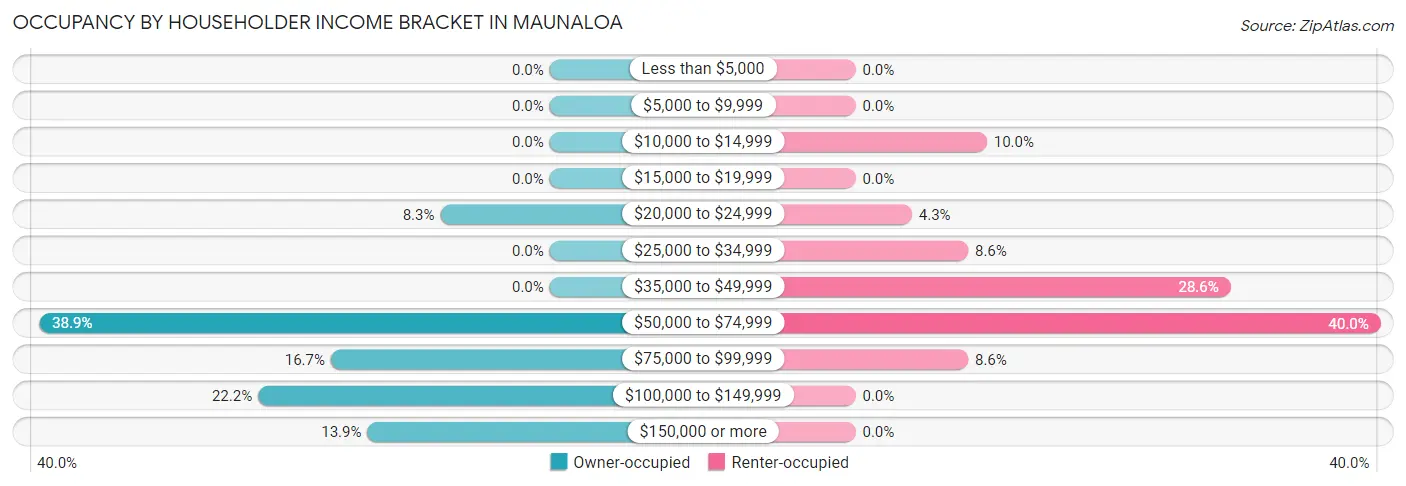
| Income Bracket | Owner-occupied | Renter-occupied |
| Less than $5,000 | 0 (0.0%) | 0 (0.0%) |
| $5,000 to $9,999 | 0 (0.0%) | 0 (0.0%) |
| $10,000 to $14,999 | 0 (0.0%) | 7 (10.0%) |
| $15,000 to $19,999 | 0 (0.0%) | 0 (0.0%) |
| $20,000 to $24,999 | 3 (8.3%) | 3 (4.3%) |
| $25,000 to $34,999 | 0 (0.0%) | 6 (8.6%) |
| $35,000 to $49,999 | 0 (0.0%) | 20 (28.6%) |
| $50,000 to $74,999 | 14 (38.9%) | 28 (40.0%) |
| $75,000 to $99,999 | 6 (16.7%) | 6 (8.6%) |
| $100,000 to $149,999 | 8 (22.2%) | 0 (0.0%) |
| $150,000 or more | 5 (13.9%) | 0 (0.0%) |
| Total | 36 (100.0%) | 70 (100.0%) |
Monthly Housing Cost Tiers in Maunaloa
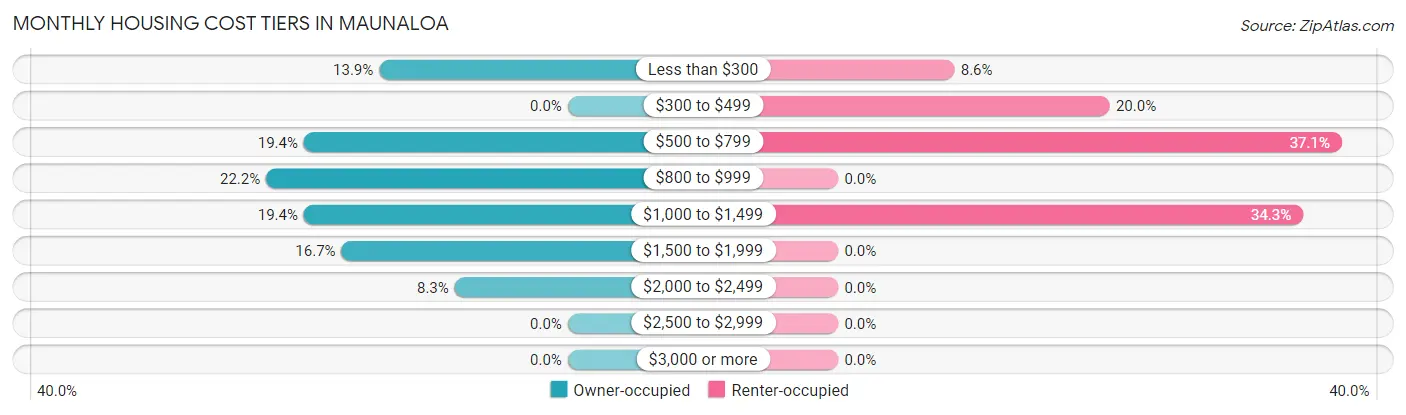
| Monthly Cost | Owner-occupied | Renter-occupied |
| Less than $300 | 5 (13.9%) | 6 (8.6%) |
| $300 to $499 | 0 (0.0%) | 14 (20.0%) |
| $500 to $799 | 7 (19.4%) | 26 (37.1%) |
| $800 to $999 | 8 (22.2%) | 0 (0.0%) |
| $1,000 to $1,499 | 7 (19.4%) | 24 (34.3%) |
| $1,500 to $1,999 | 6 (16.7%) | 0 (0.0%) |
| $2,000 to $2,499 | 3 (8.3%) | 0 (0.0%) |
| $2,500 to $2,999 | 0 (0.0%) | 0 (0.0%) |
| $3,000 or more | 0 (0.0%) | 0 (0.0%) |
| Total | 36 (100.0%) | 70 (100.0%) |
Physical Housing Characteristics in Maunaloa
Housing Structures in Maunaloa
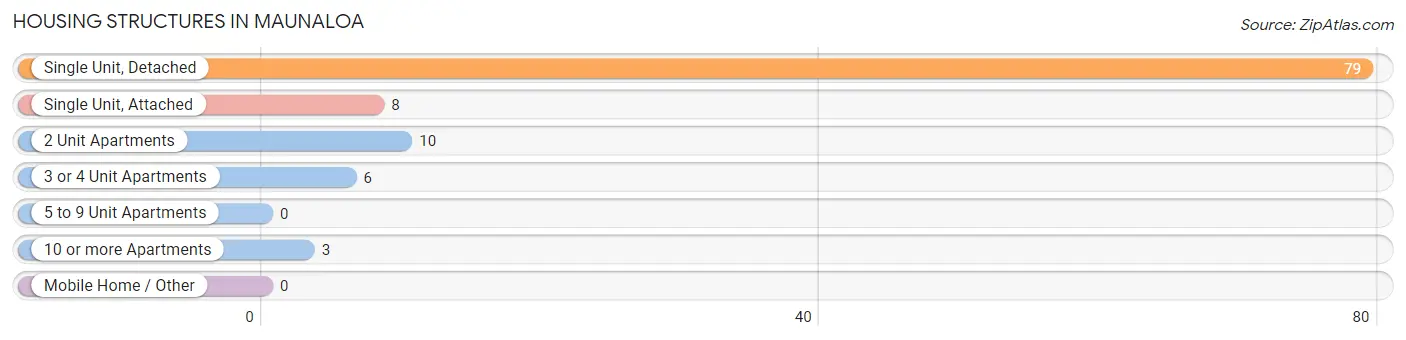
| Structure Type | # Housing Units | % Housing Units |
| Single Unit, Detached | 79 | 74.5% |
| Single Unit, Attached | 8 | 7.5% |
| 2 Unit Apartments | 10 | 9.4% |
| 3 or 4 Unit Apartments | 6 | 5.7% |
| 5 to 9 Unit Apartments | 0 | 0.0% |
| 10 or more Apartments | 3 | 2.8% |
| Mobile Home / Other | 0 | 0.0% |
| Total | 106 | 100.0% |
Housing Structures by Occupancy in Maunaloa
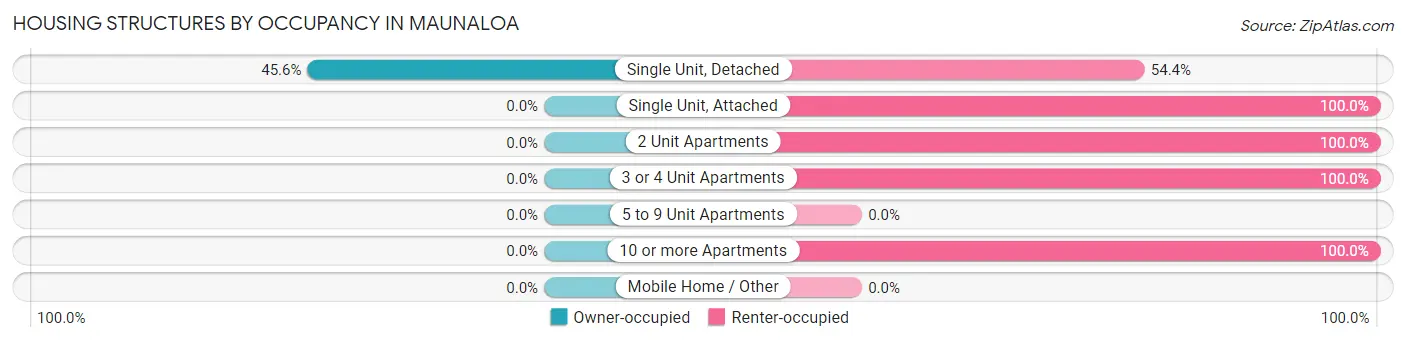
| Structure Type | Owner-occupied | Renter-occupied |
| Single Unit, Detached | 36 (45.6%) | 43 (54.4%) |
| Single Unit, Attached | 0 (0.0%) | 8 (100.0%) |
| 2 Unit Apartments | 0 (0.0%) | 10 (100.0%) |
| 3 or 4 Unit Apartments | 0 (0.0%) | 6 (100.0%) |
| 5 to 9 Unit Apartments | 0 (0.0%) | 0 (0.0%) |
| 10 or more Apartments | 0 (0.0%) | 3 (100.0%) |
| Mobile Home / Other | 0 (0.0%) | 0 (0.0%) |
| Total | 36 (34.0%) | 70 (66.0%) |
Housing Structures by Number of Rooms in Maunaloa
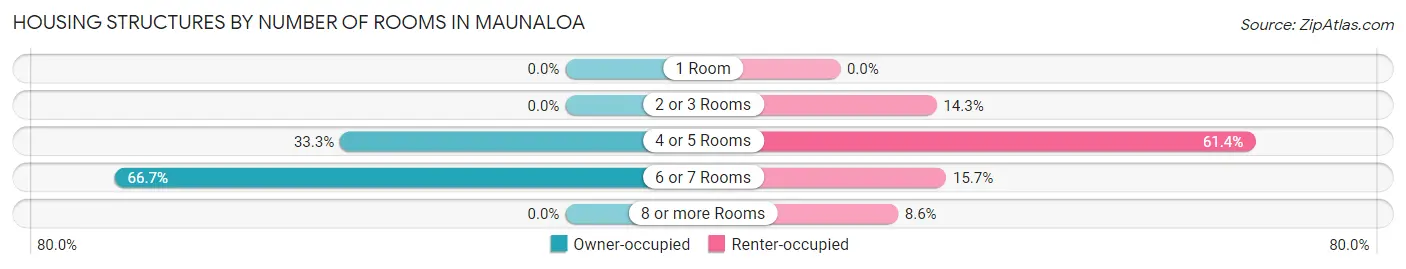
| Number of Rooms | Owner-occupied | Renter-occupied |
| 1 Room | 0 (0.0%) | 0 (0.0%) |
| 2 or 3 Rooms | 0 (0.0%) | 10 (14.3%) |
| 4 or 5 Rooms | 12 (33.3%) | 43 (61.4%) |
| 6 or 7 Rooms | 24 (66.7%) | 11 (15.7%) |
| 8 or more Rooms | 0 (0.0%) | 6 (8.6%) |
| Total | 36 (100.0%) | 70 (100.0%) |
Housing Structure by Heating Type in Maunaloa
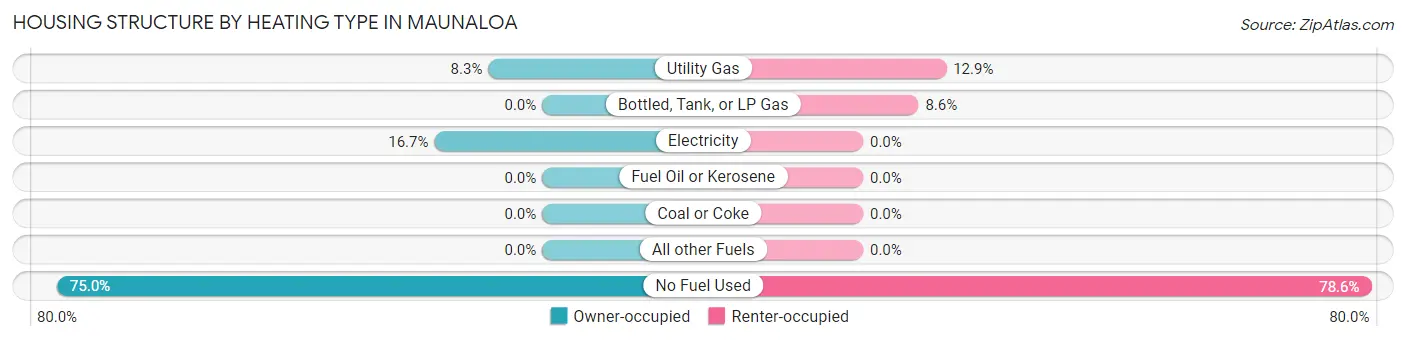
| Heating Type | Owner-occupied | Renter-occupied |
| Utility Gas | 3 (8.3%) | 9 (12.9%) |
| Bottled, Tank, or LP Gas | 0 (0.0%) | 6 (8.6%) |
| Electricity | 6 (16.7%) | 0 (0.0%) |
| Fuel Oil or Kerosene | 0 (0.0%) | 0 (0.0%) |
| Coal or Coke | 0 (0.0%) | 0 (0.0%) |
| All other Fuels | 0 (0.0%) | 0 (0.0%) |
| No Fuel Used | 27 (75.0%) | 55 (78.6%) |
| Total | 36 (100.0%) | 70 (100.0%) |
Household Vehicle Usage in Maunaloa
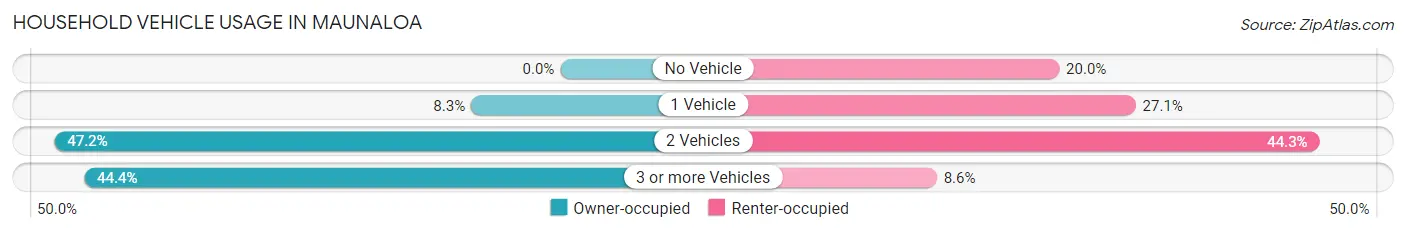
| Vehicles per Household | Owner-occupied | Renter-occupied |
| No Vehicle | 0 (0.0%) | 14 (20.0%) |
| 1 Vehicle | 3 (8.3%) | 19 (27.1%) |
| 2 Vehicles | 17 (47.2%) | 31 (44.3%) |
| 3 or more Vehicles | 16 (44.4%) | 6 (8.6%) |
| Total | 36 (100.0%) | 70 (100.0%) |
Real Estate & Mortgages in Maunaloa
Real Estate and Mortgage Overview in Maunaloa
| Characteristic | Without Mortgage | With Mortgage |
| Housing Units | 5 | 31 |
| Median Property Value | - | - |
| Median Household Income | - | - |
| Monthly Housing Costs | - | - |
| Real Estate Taxes | - | - |
Property Value by Mortgage Status in Maunaloa
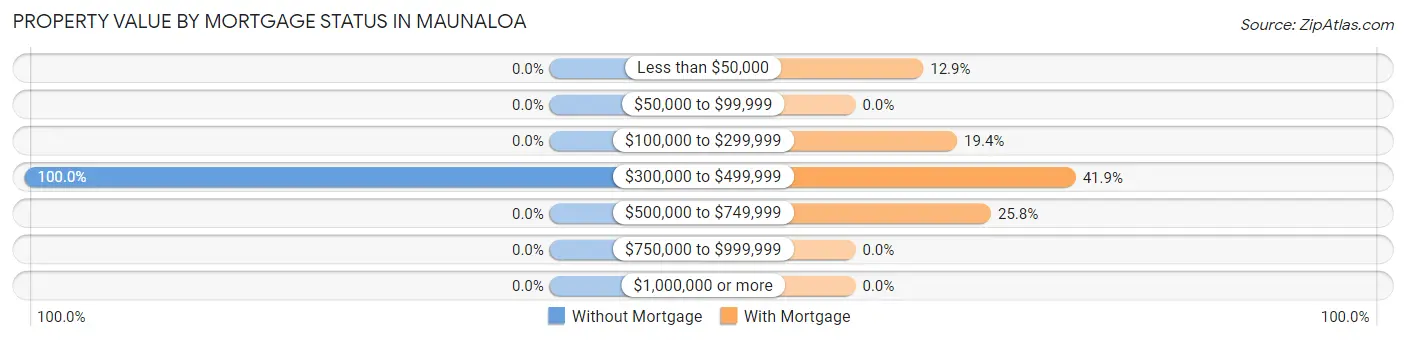
| Property Value | Without Mortgage | With Mortgage |
| Less than $50,000 | 0 (0.0%) | 4 (12.9%) |
| $50,000 to $99,999 | 0 (0.0%) | 0 (0.0%) |
| $100,000 to $299,999 | 0 (0.0%) | 6 (19.4%) |
| $300,000 to $499,999 | 5 (100.0%) | 13 (41.9%) |
| $500,000 to $749,999 | 0 (0.0%) | 8 (25.8%) |
| $750,000 to $999,999 | 0 (0.0%) | 0 (0.0%) |
| $1,000,000 or more | 0 (0.0%) | 0 (0.0%) |
| Total | 5 (100.0%) | 31 (100.0%) |
Household Income by Mortgage Status in Maunaloa
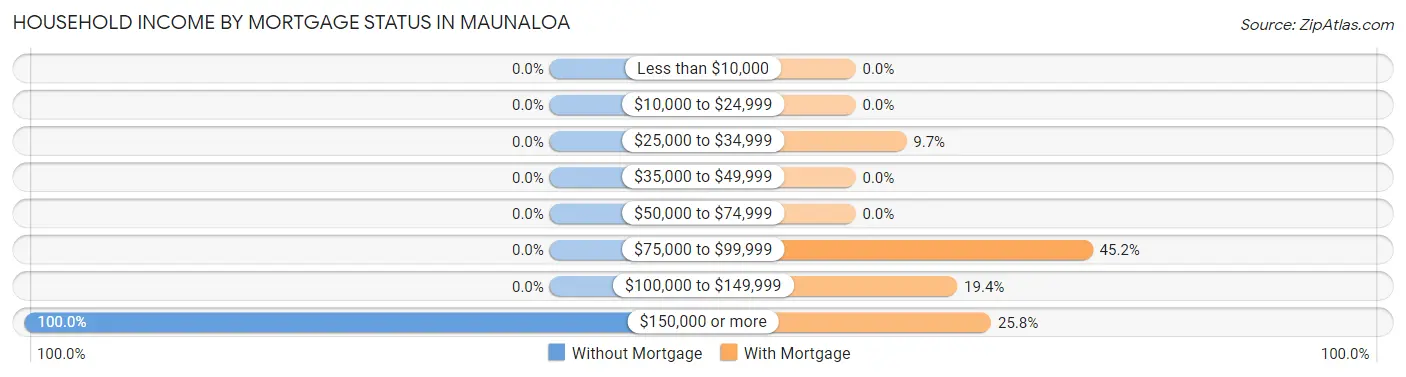
| Household Income | Without Mortgage | With Mortgage |
| Less than $10,000 | 0 (0.0%) | 0 (0.0%) |
| $10,000 to $24,999 | 0 (0.0%) | 0 (0.0%) |
| $25,000 to $34,999 | 0 (0.0%) | 3 (9.7%) |
| $35,000 to $49,999 | 0 (0.0%) | 0 (0.0%) |
| $50,000 to $74,999 | 0 (0.0%) | 0 (0.0%) |
| $75,000 to $99,999 | 0 (0.0%) | 14 (45.2%) |
| $100,000 to $149,999 | 0 (0.0%) | 6 (19.4%) |
| $150,000 or more | 5 (100.0%) | 8 (25.8%) |
| Total | 5 (100.0%) | 31 (100.0%) |
Property Value to Household Income Ratio in Maunaloa
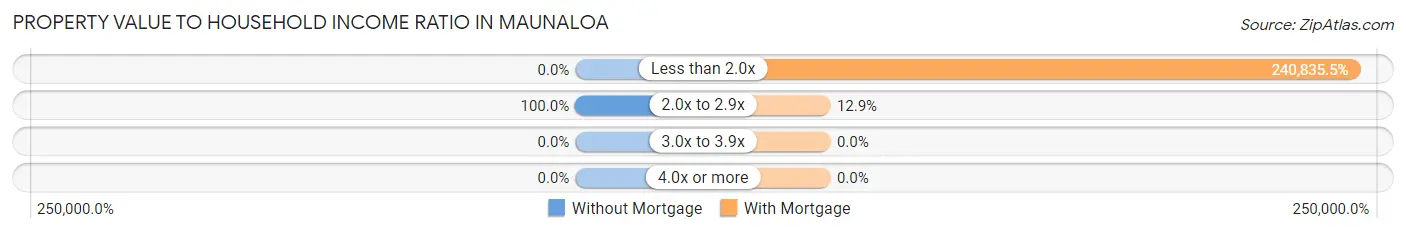
| Value-to-Income Ratio | Without Mortgage | With Mortgage |
| Less than 2.0x | 0 (0.0%) | 74,659 (240,835.5%) |
| 2.0x to 2.9x | 5 (100.0%) | 4 (12.9%) |
| 3.0x to 3.9x | 0 (0.0%) | 0 (0.0%) |
| 4.0x or more | 0 (0.0%) | 0 (0.0%) |
| Total | 5 (100.0%) | 31 (100.0%) |
Real Estate Taxes by Mortgage Status in Maunaloa
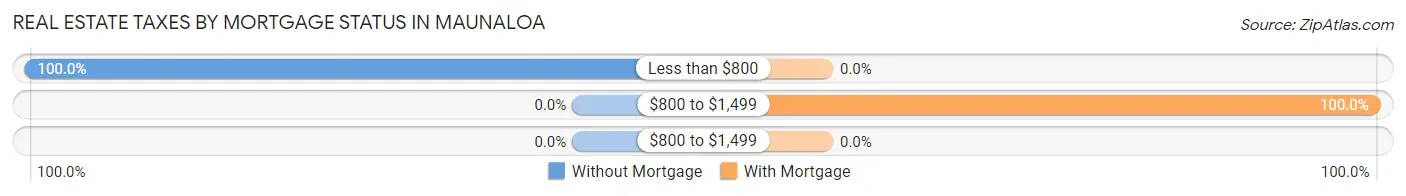
| Property Taxes | Without Mortgage | With Mortgage |
| Less than $800 | 5 (100.0%) | 0 (0.0%) |
| $800 to $1,499 | 0 (0.0%) | 31 (100.0%) |
| $800 to $1,499 | 0 (0.0%) | 0 (0.0%) |
| Total | 5 (100.0%) | 31 (100.0%) |
Health & Disability in Maunaloa
Health Insurance Coverage by Age in Maunaloa
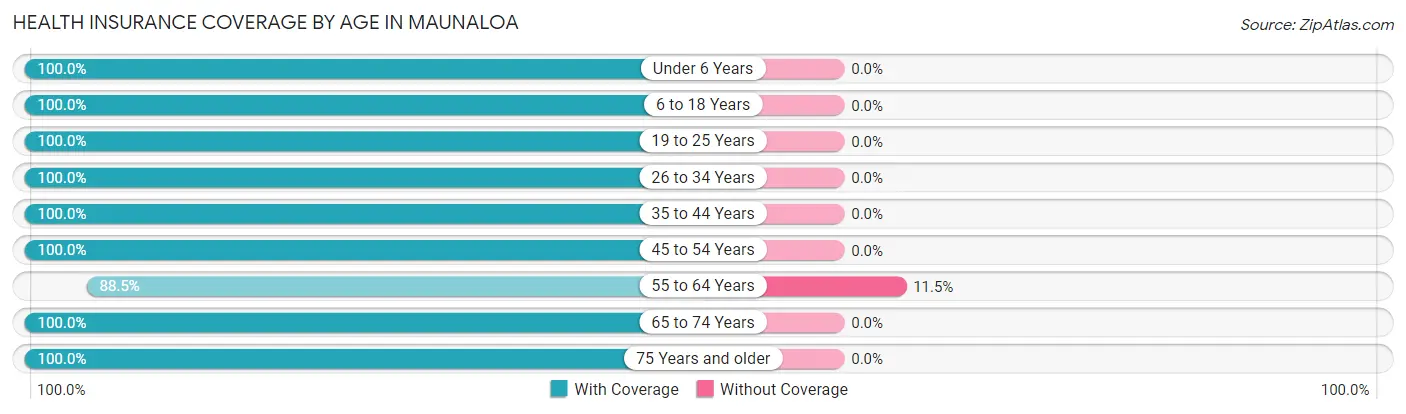
| Age Bracket | With Coverage | Without Coverage |
| Under 6 Years | 41 (100.0%) | 0 (0.0%) |
| 6 to 18 Years | 48 (100.0%) | 0 (0.0%) |
| 19 to 25 Years | 17 (100.0%) | 0 (0.0%) |
| 26 to 34 Years | 33 (100.0%) | 0 (0.0%) |
| 35 to 44 Years | 34 (100.0%) | 0 (0.0%) |
| 45 to 54 Years | 11 (100.0%) | 0 (0.0%) |
| 55 to 64 Years | 69 (88.5%) | 9 (11.5%) |
| 65 to 74 Years | 14 (100.0%) | 0 (0.0%) |
| 75 Years and older | 3 (100.0%) | 0 (0.0%) |
| Total | 270 (96.8%) | 9 (3.2%) |
Health Insurance Coverage by Citizenship Status in Maunaloa
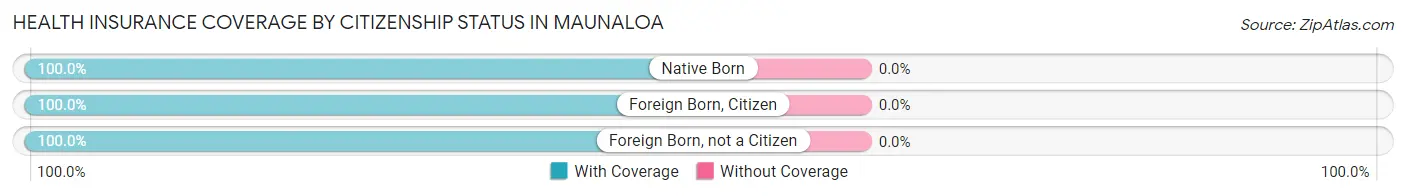
| Citizenship Status | With Coverage | Without Coverage |
| Native Born | 41 (100.0%) | 0 (0.0%) |
| Foreign Born, Citizen | 48 (100.0%) | 0 (0.0%) |
| Foreign Born, not a Citizen | 17 (100.0%) | 0 (0.0%) |
Health Insurance Coverage by Household Income in Maunaloa
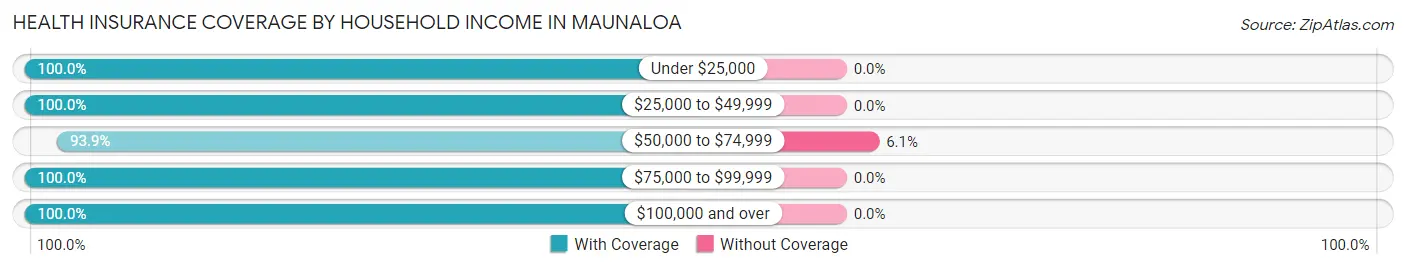
| Household Income | With Coverage | Without Coverage |
| Under $25,000 | 13 (100.0%) | 0 (0.0%) |
| $25,000 to $49,999 | 66 (100.0%) | 0 (0.0%) |
| $50,000 to $74,999 | 139 (93.9%) | 9 (6.1%) |
| $75,000 to $99,999 | 26 (100.0%) | 0 (0.0%) |
| $100,000 and over | 24 (100.0%) | 0 (0.0%) |
Public vs Private Health Insurance Coverage by Age in Maunaloa
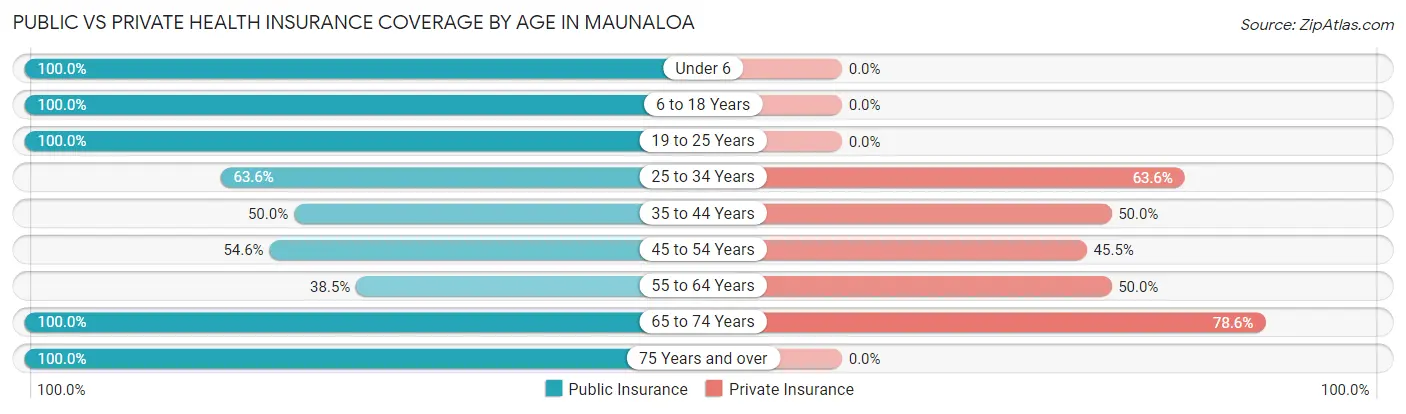
| Age Bracket | Public Insurance | Private Insurance |
| Under 6 | 41 (100.0%) | 0 (0.0%) |
| 6 to 18 Years | 48 (100.0%) | 0 (0.0%) |
| 19 to 25 Years | 17 (100.0%) | 0 (0.0%) |
| 25 to 34 Years | 21 (63.6%) | 21 (63.6%) |
| 35 to 44 Years | 17 (50.0%) | 17 (50.0%) |
| 45 to 54 Years | 6 (54.5%) | 5 (45.5%) |
| 55 to 64 Years | 30 (38.5%) | 39 (50.0%) |
| 65 to 74 Years | 14 (100.0%) | 11 (78.6%) |
| 75 Years and over | 3 (100.0%) | 0 (0.0%) |
| Total | 197 (70.6%) | 93 (33.3%) |
Disability Status by Sex by Age in Maunaloa
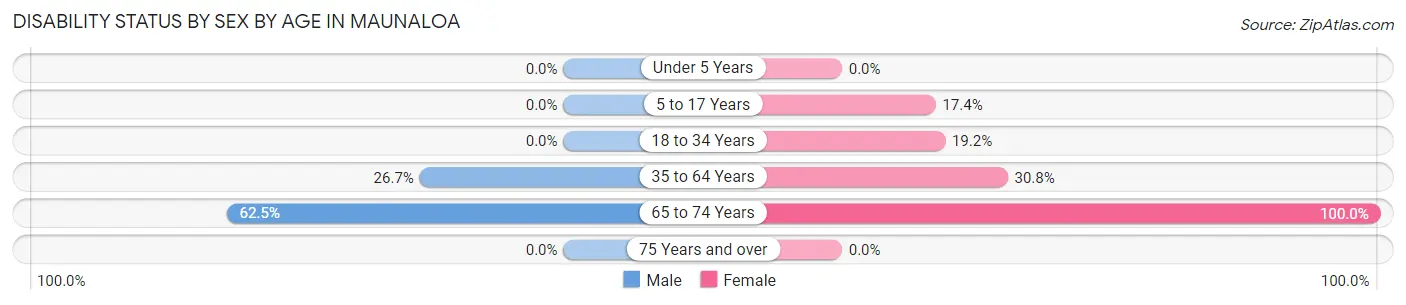
| Age Bracket | Male | Female |
| Under 5 Years | 0 (0.0%) | 0 (0.0%) |
| 5 to 17 Years | 0 (0.0%) | 4 (17.4%) |
| 18 to 34 Years | 0 (0.0%) | 9 (19.2%) |
| 35 to 64 Years | 12 (26.7%) | 24 (30.8%) |
| 65 to 74 Years | 5 (62.5%) | 6 (100.0%) |
| 75 Years and over | 0 (0.0%) | 0 (0.0%) |
Disability Class by Sex by Age in Maunaloa
Disability Class: Hearing Difficulty
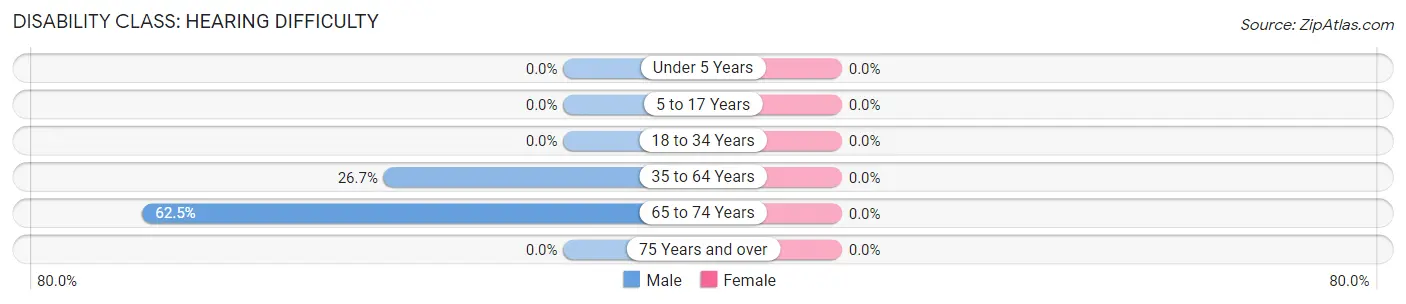
| Age Bracket | Male | Female |
| Under 5 Years | 0 (0.0%) | 0 (0.0%) |
| 5 to 17 Years | 0 (0.0%) | 0 (0.0%) |
| 18 to 34 Years | 0 (0.0%) | 0 (0.0%) |
| 35 to 64 Years | 12 (26.7%) | 0 (0.0%) |
| 65 to 74 Years | 5 (62.5%) | 0 (0.0%) |
| 75 Years and over | 0 (0.0%) | 0 (0.0%) |
Disability Class: Vision Difficulty
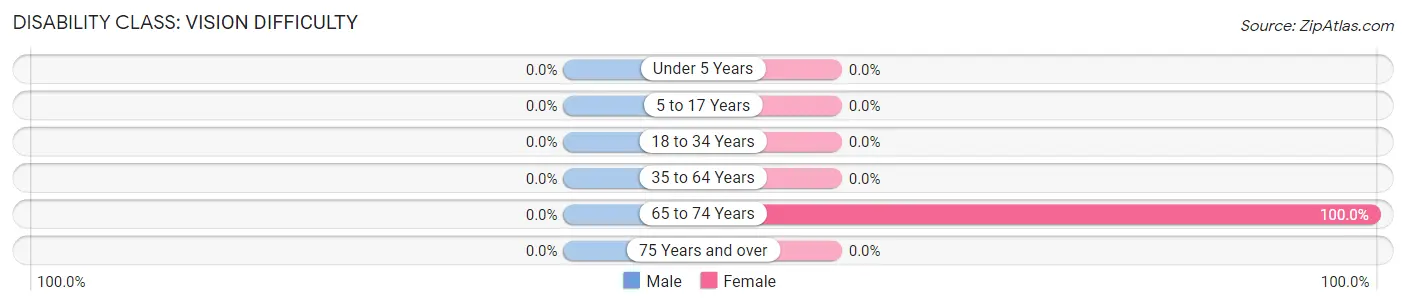
| Age Bracket | Male | Female |
| Under 5 Years | 0 (0.0%) | 0 (0.0%) |
| 5 to 17 Years | 0 (0.0%) | 0 (0.0%) |
| 18 to 34 Years | 0 (0.0%) | 0 (0.0%) |
| 35 to 64 Years | 0 (0.0%) | 0 (0.0%) |
| 65 to 74 Years | 0 (0.0%) | 6 (100.0%) |
| 75 Years and over | 0 (0.0%) | 0 (0.0%) |
Disability Class: Cognitive Difficulty
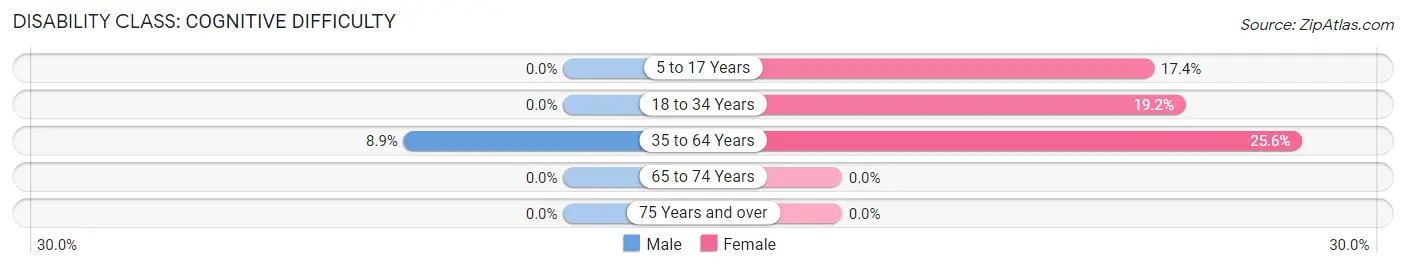
| Age Bracket | Male | Female |
| 5 to 17 Years | 0 (0.0%) | 4 (17.4%) |
| 18 to 34 Years | 0 (0.0%) | 9 (19.2%) |
| 35 to 64 Years | 4 (8.9%) | 20 (25.6%) |
| 65 to 74 Years | 0 (0.0%) | 0 (0.0%) |
| 75 Years and over | 0 (0.0%) | 0 (0.0%) |
Disability Class: Ambulatory Difficulty
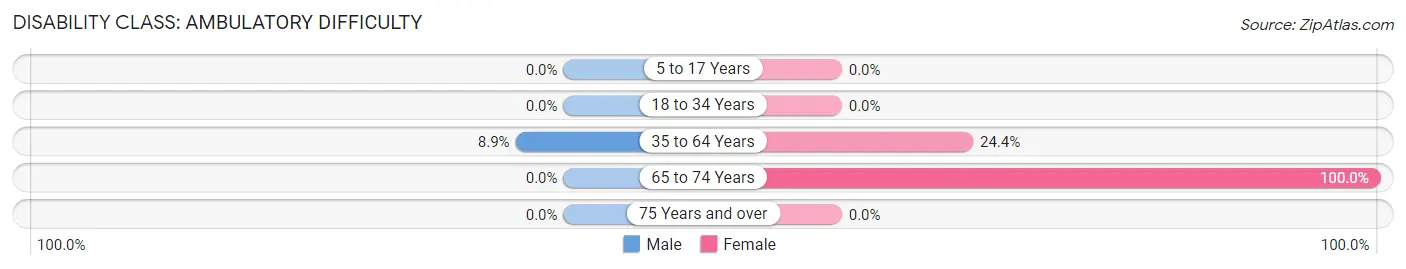
| Age Bracket | Male | Female |
| 5 to 17 Years | 0 (0.0%) | 0 (0.0%) |
| 18 to 34 Years | 0 (0.0%) | 0 (0.0%) |
| 35 to 64 Years | 4 (8.9%) | 19 (24.4%) |
| 65 to 74 Years | 0 (0.0%) | 6 (100.0%) |
| 75 Years and over | 0 (0.0%) | 0 (0.0%) |
Disability Class: Self-Care Difficulty
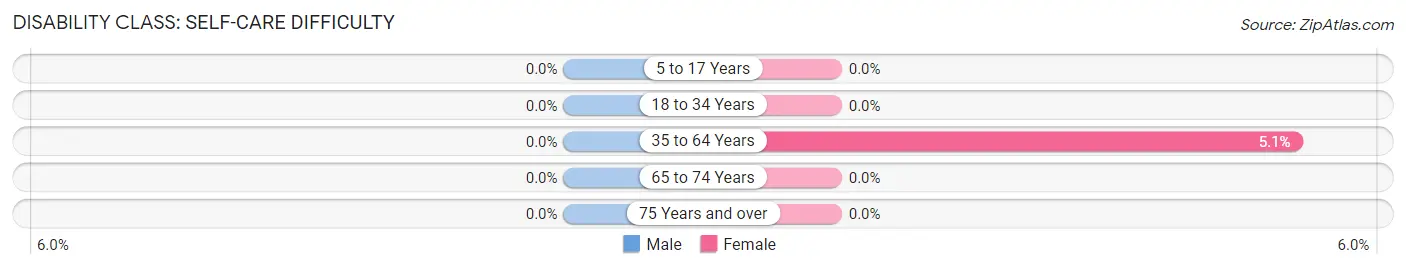
| Age Bracket | Male | Female |
| 5 to 17 Years | 0 (0.0%) | 0 (0.0%) |
| 18 to 34 Years | 0 (0.0%) | 0 (0.0%) |
| 35 to 64 Years | 0 (0.0%) | 4 (5.1%) |
| 65 to 74 Years | 0 (0.0%) | 0 (0.0%) |
| 75 Years and over | 0 (0.0%) | 0 (0.0%) |
Technology Access in Maunaloa
Computing Device Access in Maunaloa
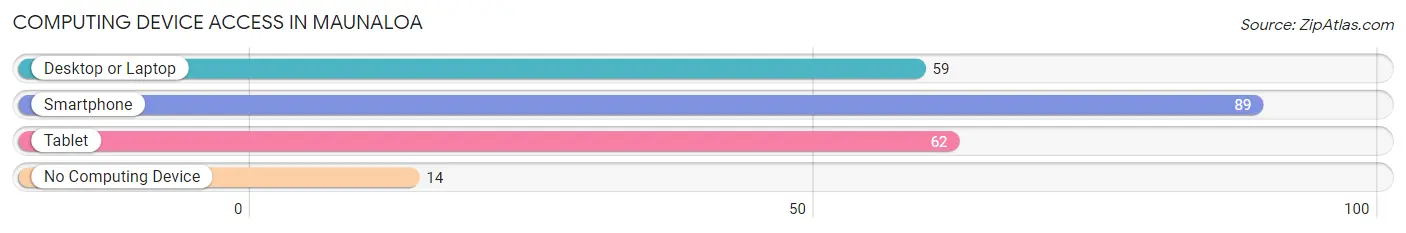
| Device Type | # Households | % Households |
| Desktop or Laptop | 59 | 55.7% |
| Smartphone | 89 | 84.0% |
| Tablet | 62 | 58.5% |
| No Computing Device | 14 | 13.2% |
| Total | 106 | 100.0% |
Internet Access in Maunaloa
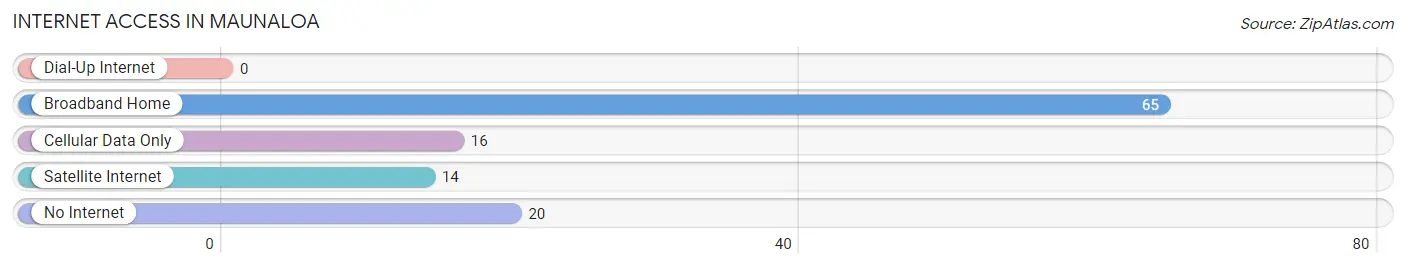
| Internet Type | # Households | % Households |
| Dial-Up Internet | 0 | 0.0% |
| Broadband Home | 65 | 61.3% |
| Cellular Data Only | 16 | 15.1% |
| Satellite Internet | 14 | 13.2% |
| No Internet | 20 | 18.9% |
| Total | 106 | 100.0% |
Maunaloa Summary
Maunaloa, Hawaii is a small town located on the western side of the island of Molokai in the Hawaiian Islands. It is the largest town on the island and is home to approximately 1,500 people. The town is located on the slopes of Mauna Loa, the world’s largest active volcano, and is surrounded by lush tropical rainforest.
History
Maunaloa was first settled by Polynesian voyagers in the late 1700s. The town was originally called Kaunakakai, which means “the place of the gods” in Hawaiian. The town was a major port of call for whaling ships in the 1800s and was also a major center for the production of sugar cane. In the early 1900s, the town was renamed Maunaloa, which means “long mountain” in Hawaiian.
In the early 1900s, Maunaloa was a bustling port town with a population of over 2,000 people. The town was home to a number of businesses, including a hotel, a bank, a post office, and a movie theater. The town was also home to a number of churches, including the Church of Jesus Christ of Latter-day Saints, the Catholic Church, and the Congregational Church.
In the 1950s, the town began to decline as the sugar industry moved away from the island. The population of Maunaloa decreased to just over 1,000 people by the 1970s. In the 1980s, the town began to experience a resurgence as tourism to the island increased. Today, Maunaloa is a popular tourist destination and is home to a number of hotels, restaurants, and shops.
Geography
Maunaloa is located on the western side of the island of Molokai in the Hawaiian Islands. The town is situated on the slopes of Mauna Loa, the world’s largest active volcano. The town is surrounded by lush tropical rainforest and is home to a number of beaches, including Papohaku Beach, which is one of the longest white sand beaches in the Hawaiian Islands.
The town is located approximately 25 miles from the island of Oahu and is accessible by ferry or plane. The nearest airport is Molokai Airport, which is located just outside of town.
Economy
Maunaloa’s economy is largely based on tourism. The town is home to a number of hotels, restaurants, and shops that cater to tourists. The town is also home to a number of fishing charters and boat tours that offer visitors the chance to explore the surrounding waters.
The town is also home to a number of agricultural operations, including a macadamia nut farm and a coffee plantation. The town is also home to a number of small businesses, including a bakery, a grocery store, and a hardware store.
Demographics
As of the 2010 census, Maunaloa had a population of 1,521 people. The town is predominantly Native Hawaiian, with approximately 75% of the population identifying as Native Hawaiian or part Native Hawaiian. The town is also home to a number of other ethnic groups, including Filipino, Japanese, and Chinese.
The median household income in Maunaloa is $45,000, which is slightly lower than the median household income for the state of Hawaii. The town has a poverty rate of 11.3%, which is slightly higher than the state average of 10.2%. The town also has a higher than average unemployment rate of 8.2%, which is higher than the state average of 6.2%.
Common Questions
What is Per Capita Income in Maunaloa?
Per Capita income in Maunaloa is $22,765.
What is the Median Family Income in Maunaloa?
Median Family Income in Maunaloa is $54,063.
What is the Median Household income in Maunaloa?
Median Household Income in Maunaloa is $51,842.
What is Income or Wage Gap in Maunaloa?
Income or Wage Gap in Maunaloa is 52.2%.
Women in Maunaloa earn 47.8 cents for every dollar earned by a man.
What is Inequality or Gini Index in Maunaloa?
Inequality or Gini Index in Maunaloa is 0.31.
What is the Total Population of Maunaloa?
Total Population of Maunaloa is 279.
What is the Total Male Population of Maunaloa?
Total Male Population of Maunaloa is 107.
What is the Total Female Population of Maunaloa?
Total Female Population of Maunaloa is 172.
What is the Ratio of Males per 100 Females in Maunaloa?
There are 62.21 Males per 100 Females in Maunaloa.
What is the Ratio of Females per 100 Males in Maunaloa?
There are 160.75 Females per 100 Males in Maunaloa.
What is the Median Population Age in Maunaloa?
Median Population Age in Maunaloa is 36.1 Years.
What is the Average Family Size in Maunaloa
Average Family Size in Maunaloa is 3.1 People.
What is the Average Household Size in Maunaloa
Average Household Size in Maunaloa is 2.6 People.
How Large is the Labor Force in Maunaloa?
There are 127 People in the Labor Forcein in Maunaloa.
What is the Percentage of People in the Labor Force in Maunaloa?
66.8% of People are in the Labor Force in Maunaloa.
What is the Unemployment Rate in Maunaloa?
Unemployment Rate in Maunaloa is 2.4%.