Ko Olina, HI Map & Demographics
Ko Olina Map
Ko Olina Overview
$66,791
PER CAPITA INCOME
$116,538
AVG FAMILY INCOME
$122,614
AVG HOUSEHOLD INCOME
28.3%
WAGE / INCOME GAP [ % ]
71.7¢/ $1
WAGE / INCOME GAP [ $ ]
$15,778
FAMILY INCOME DEFICIT
0.43
INEQUALITY / GINI INDEX
1,871
TOTAL POPULATION
914
MALE POPULATION
957
FEMALE POPULATION
95.51
MALES / 100 FEMALES
104.70
FEMALES / 100 MALES
42.3
MEDIAN AGE
2.6
AVG FAMILY SIZE
2.2
AVG HOUSEHOLD SIZE
961
LABOR FORCE [ PEOPLE ]
59.6%
PERCENT IN LABOR FORCE
3.0%
UNEMPLOYMENT RATE
Income in Ko Olina
Income Overview in Ko Olina
Per Capita Income in Ko Olina is $66,791, while median incomes of families and households are $116,538 and $122,614 respectively.
| Characteristic | Number | Measure |
| Per Capita Income | 1,871 | $66,791 |
| Median Family Income | 546 | $116,538 |
| Mean Family Income | 546 | $165,976 |
| Median Household Income | 854 | $122,614 |
| Mean Household Income | 854 | $148,526 |
| Income Deficit | 546 | $15,778 |
| Wage / Income Gap (%) | 1,871 | 28.30% |
| Wage / Income Gap ($) | 1,871 | 71.70¢ per $1 |
| Gini / Inequality Index | 1,871 | 0.43 |
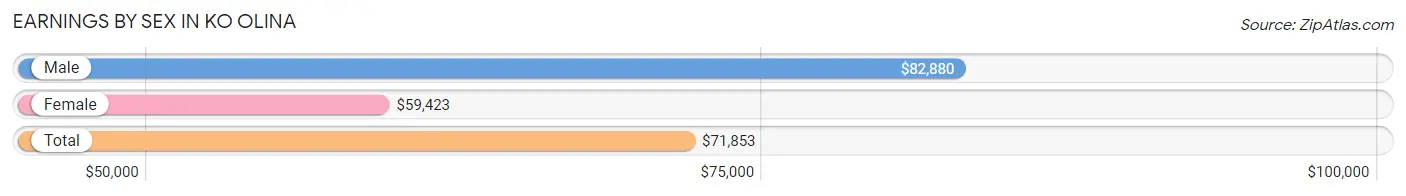
Earnings by Sex in Ko Olina
Average Earnings in Ko Olina are $71,853, $82,880 for men and $59,423 for women, a difference of 28.3%.
| Sex | Number | Average Earnings |
| Male | 565 (55.4%) | $82,880 |
| Female | 454 (44.6%) | $59,423 |
| Total | 1,019 (100.0%) | $71,853 |
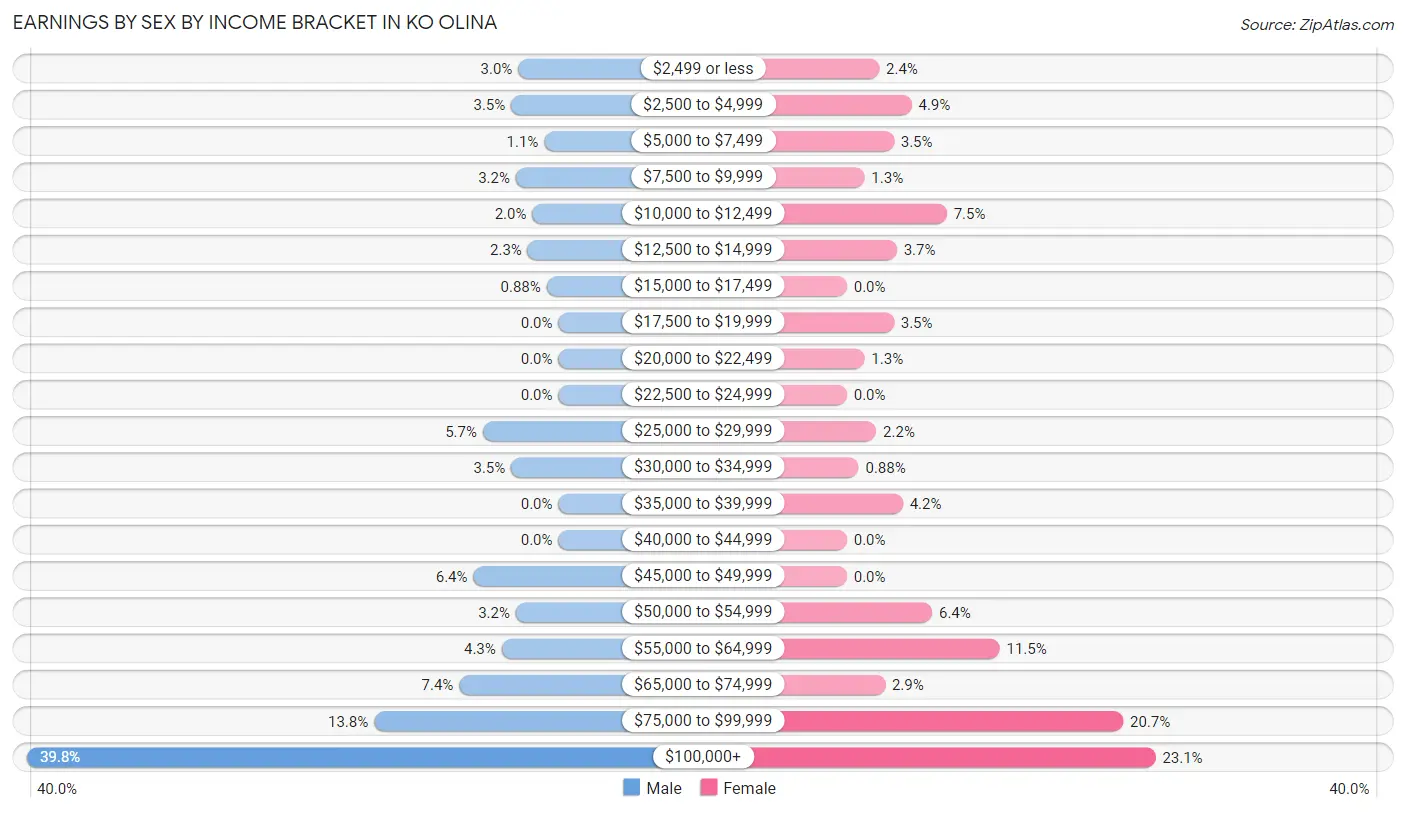
Earnings by Sex by Income Bracket in Ko Olina
The most common earnings brackets in Ko Olina are $100,000+ for men (225 | 39.8%) and $100,000+ for women (105 | 23.1%).
| Income | Male | Female |
| $2,499 or less | 17 (3.0%) | 11 (2.4%) |
| $2,500 to $4,999 | 20 (3.5%) | 22 (4.9%) |
| $5,000 to $7,499 | 6 (1.1%) | 16 (3.5%) |
| $7,500 to $9,999 | 18 (3.2%) | 6 (1.3%) |
| $10,000 to $12,499 | 11 (1.9%) | 34 (7.5%) |
| $12,500 to $14,999 | 13 (2.3%) | 17 (3.7%) |
| $15,000 to $17,499 | 5 (0.9%) | 0 (0.0%) |
| $17,500 to $19,999 | 0 (0.0%) | 16 (3.5%) |
| $20,000 to $22,499 | 0 (0.0%) | 6 (1.3%) |
| $22,500 to $24,999 | 0 (0.0%) | 0 (0.0%) |
| $25,000 to $29,999 | 32 (5.7%) | 10 (2.2%) |
| $30,000 to $34,999 | 20 (3.5%) | 4 (0.9%) |
| $35,000 to $39,999 | 0 (0.0%) | 19 (4.2%) |
| $40,000 to $44,999 | 0 (0.0%) | 0 (0.0%) |
| $45,000 to $49,999 | 36 (6.4%) | 0 (0.0%) |
| $50,000 to $54,999 | 18 (3.2%) | 29 (6.4%) |
| $55,000 to $64,999 | 24 (4.3%) | 52 (11.5%) |
| $65,000 to $74,999 | 42 (7.4%) | 13 (2.9%) |
| $75,000 to $99,999 | 78 (13.8%) | 94 (20.7%) |
| $100,000+ | 225 (39.8%) | 105 (23.1%) |
| Total | 565 (100.0%) | 454 (100.0%) |
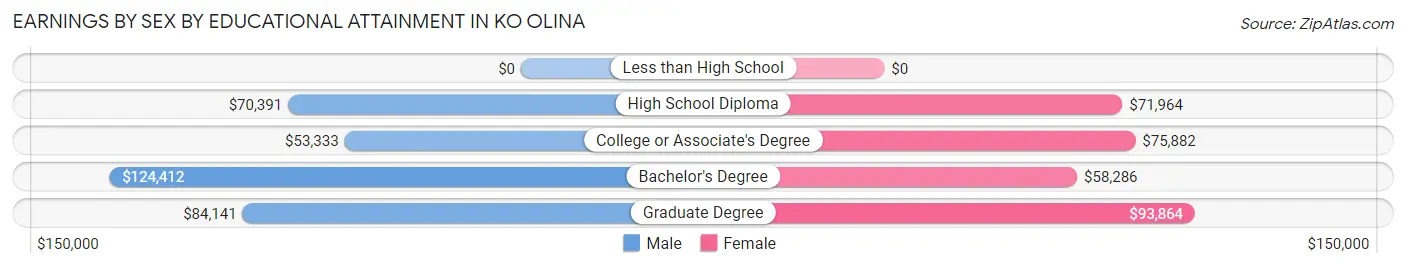
Earnings by Sex by Educational Attainment in Ko Olina
Average earnings in Ko Olina are $83,587 for men and $71,250 for women, a difference of 14.8%. Men with an educational attainment of bachelor's degree enjoy the highest average annual earnings of $124,412, while those with college or associate's degree education earn the least with $53,333. Women with an educational attainment of graduate degree earn the most with the average annual earnings of $93,864, while those with bachelor's degree education have the smallest earnings of $58,286.
| Educational Attainment | Male Income | Female Income |
| Less than High School | - | - |
| High School Diploma | $70,391 | $71,964 |
| College or Associate's Degree | $53,333 | $75,882 |
| Bachelor's Degree | $124,412 | $58,286 |
| Graduate Degree | $84,141 | $93,864 |
| Total | $83,587 | $71,250 |
Family Income in Ko Olina
Family Income Brackets in Ko Olina
According to the Ko Olina family income data, there are 174 families falling into the $100,000 to $149,999 income range, which is the most common income bracket and makes up 31.9% of all families. Conversely, the $10,000 to $14,999 income bracket is the least frequent group with only 5 families (0.9%) belonging to this category.
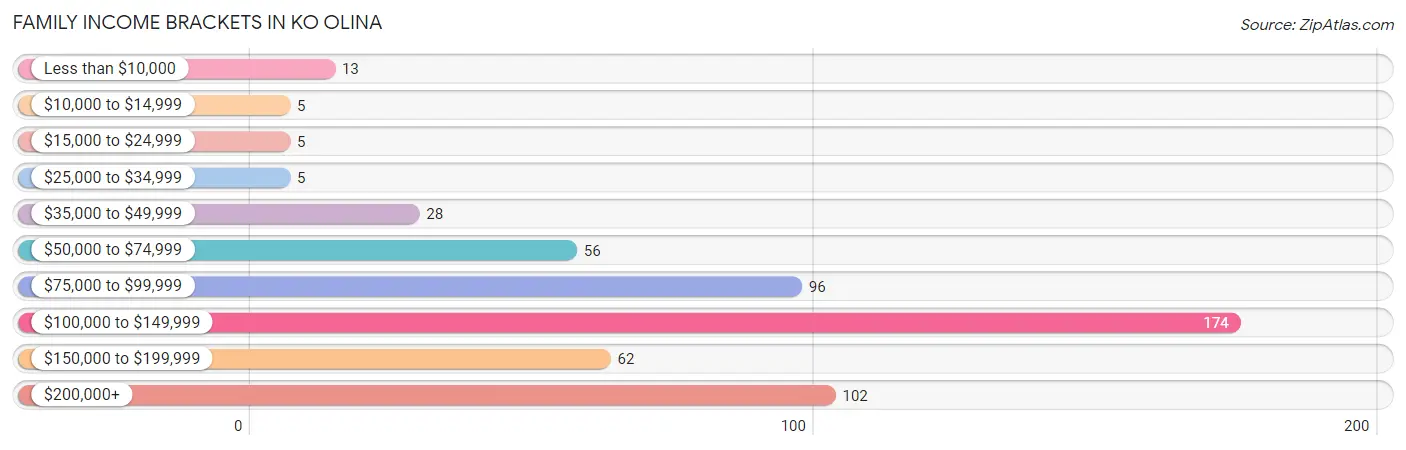
| Income Bracket | # Families | % Families |
| Less than $10,000 | 13 | 2.4% |
| $10,000 to $14,999 | 5 | 0.9% |
| $15,000 to $24,999 | 5 | 0.9% |
| $25,000 to $34,999 | 5 | 0.9% |
| $35,000 to $49,999 | 28 | 5.1% |
| $50,000 to $74,999 | 56 | 10.3% |
| $75,000 to $99,999 | 96 | 17.6% |
| $100,000 to $149,999 | 174 | 31.9% |
| $150,000 to $199,999 | 62 | 11.4% |
| $200,000+ | 102 | 18.7% |
Family Income by Famaliy Size in Ko Olina
4-person families (77 | 14.1%) account for the highest median family income in Ko Olina with $139,427 per family, while 2-person families (366 | 67.0%) have the highest median income of $54,659 per family member.
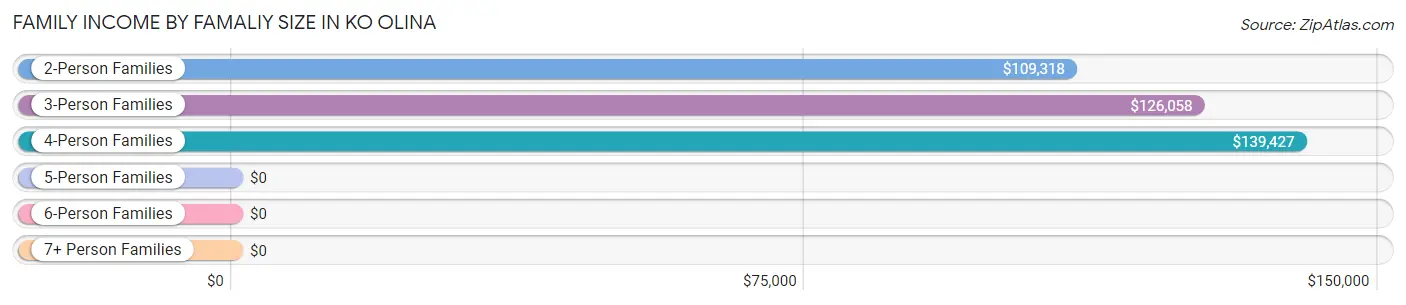
| Income Bracket | # Families | Median Income |
| 2-Person Families | 366 (67.0%) | $109,318 |
| 3-Person Families | 89 (16.3%) | $126,058 |
| 4-Person Families | 77 (14.1%) | $139,427 |
| 5-Person Families | 14 (2.6%) | $0 |
| 6-Person Families | 0 (0.0%) | $0 |
| 7+ Person Families | 0 (0.0%) | $0 |
| Total | 546 (100.0%) | $116,538 |
Family Income by Number of Earners in Ko Olina
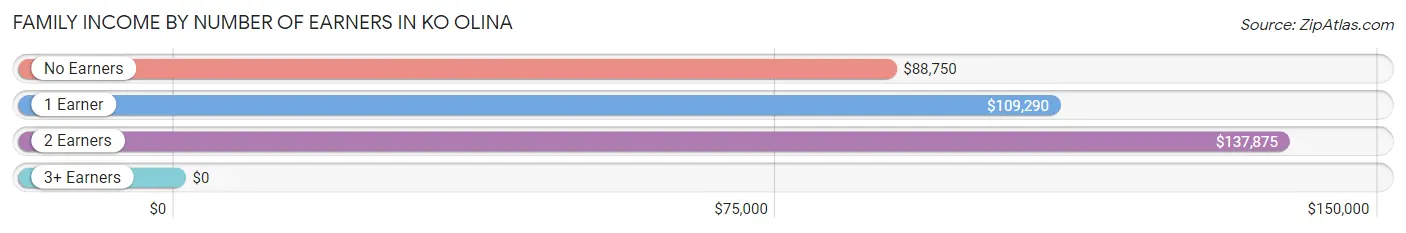
| Number of Earners | # Families | Median Income |
| No Earners | 118 (21.6%) | $88,750 |
| 1 Earner | 229 (41.9%) | $109,290 |
| 2 Earners | 189 (34.6%) | $137,875 |
| 3+ Earners | 10 (1.8%) | $0 |
| Total | 546 (100.0%) | $116,538 |
Household Income in Ko Olina
Household Income Brackets in Ko Olina
With 293 households falling in the category, the $100,000 to $149,999 income range is the most frequent in Ko Olina, accounting for 34.3% of all households. In contrast, only 5 households (0.6%) fall into the $10,000 to $14,999 income bracket, making it the least populous group.
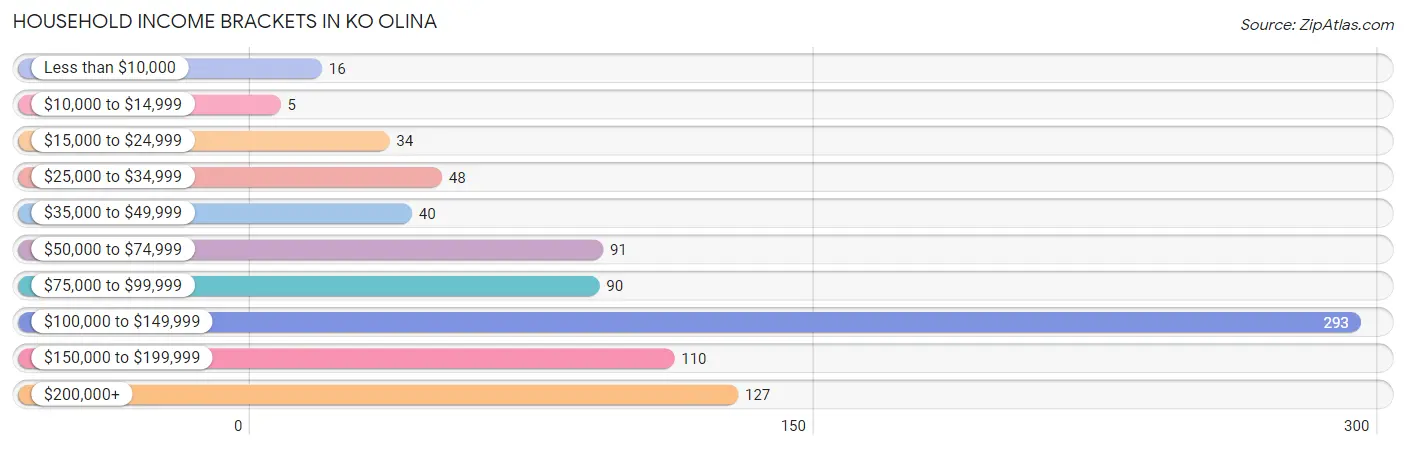
| Income Bracket | # Households | % Households |
| Less than $10,000 | 16 | 1.9% |
| $10,000 to $14,999 | 5 | 0.6% |
| $15,000 to $24,999 | 34 | 4.0% |
| $25,000 to $34,999 | 48 | 5.6% |
| $35,000 to $49,999 | 40 | 4.7% |
| $50,000 to $74,999 | 91 | 10.7% |
| $75,000 to $99,999 | 90 | 10.5% |
| $100,000 to $149,999 | 293 | 34.3% |
| $150,000 to $199,999 | 110 | 12.9% |
| $200,000+ | 127 | 14.9% |
Household Income by Householder Age in Ko Olina
The median household income in Ko Olina is $122,614, with the highest median household income of $125,170 found in the 25 to 44 years age bracket for the primary householder. A total of 321 households (37.6%) fall into this category. Meanwhile, the 15 to 24 years age bracket for the primary householder has the lowest median household income of $0, with 7 households (0.8%) in this group.
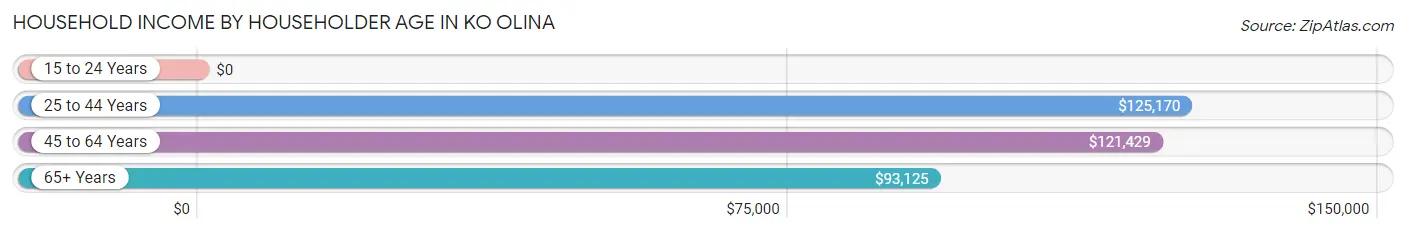
| Income Bracket | # Households | Median Income |
| 15 to 24 Years | 7 (0.8%) | $0 |
| 25 to 44 Years | 321 (37.6%) | $125,170 |
| 45 to 64 Years | 314 (36.8%) | $121,429 |
| 65+ Years | 212 (24.8%) | $93,125 |
| Total | 854 (100.0%) | $122,614 |
Poverty in Ko Olina
Income Below Poverty by Sex and Age in Ko Olina
With 6.1% poverty level for males and 7.0% for females among the residents of Ko Olina, 55 to 64 year old males and 15 year old females are the most vulnerable to poverty, with 30 males (25.2%) and 6 females (60.0%) in their respective age groups living below the poverty level.
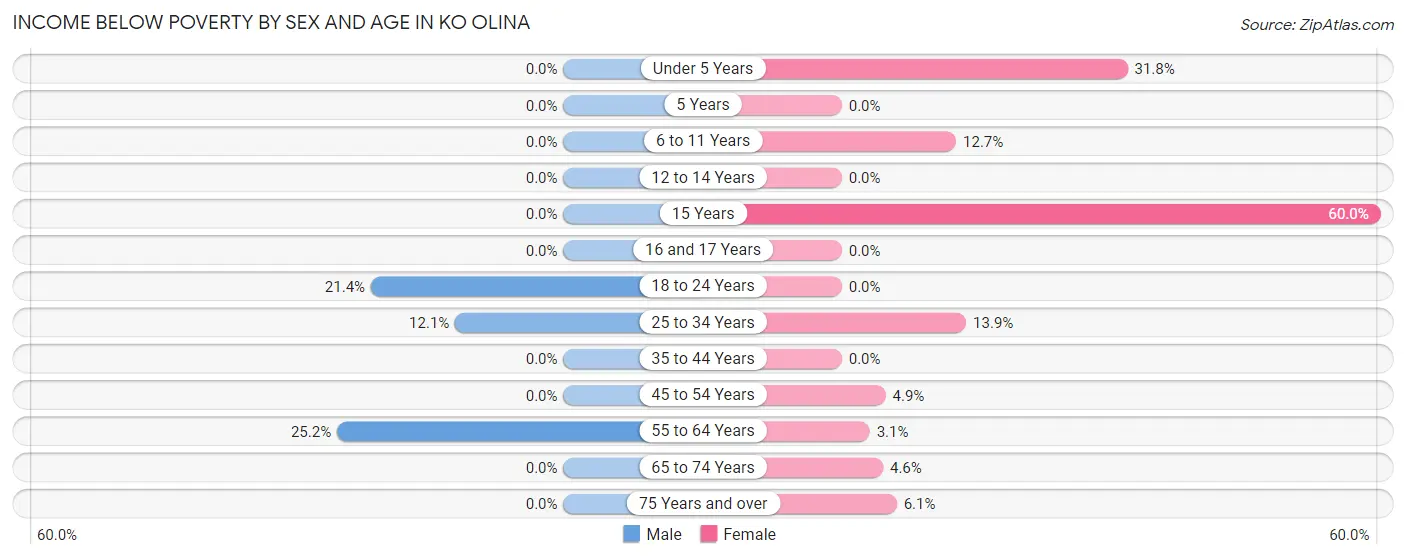
| Age Bracket | Male | Female |
| Under 5 Years | 0 (0.0%) | 14 (31.8%) |
| 5 Years | 0 (0.0%) | 0 (0.0%) |
| 6 to 11 Years | 0 (0.0%) | 7 (12.7%) |
| 12 to 14 Years | 0 (0.0%) | 0 (0.0%) |
| 15 Years | 0 (0.0%) | 6 (60.0%) |
| 16 and 17 Years | 0 (0.0%) | 0 (0.0%) |
| 18 to 24 Years | 6 (21.4%) | 0 (0.0%) |
| 25 to 34 Years | 20 (12.0%) | 18 (13.9%) |
| 35 to 44 Years | 0 (0.0%) | 0 (0.0%) |
| 45 to 54 Years | 0 (0.0%) | 6 (4.9%) |
| 55 to 64 Years | 30 (25.2%) | 5 (3.1%) |
| 65 to 74 Years | 0 (0.0%) | 5 (4.6%) |
| 75 Years and over | 0 (0.0%) | 6 (6.1%) |
| Total | 56 (6.1%) | 67 (7.0%) |
Income Above Poverty by Sex and Age in Ko Olina
According to the poverty statistics in Ko Olina, males aged under 5 years and females aged 12 to 14 years are the age groups that are most secure financially, with 100.0% of males and 100.0% of females in these age groups living above the poverty line.
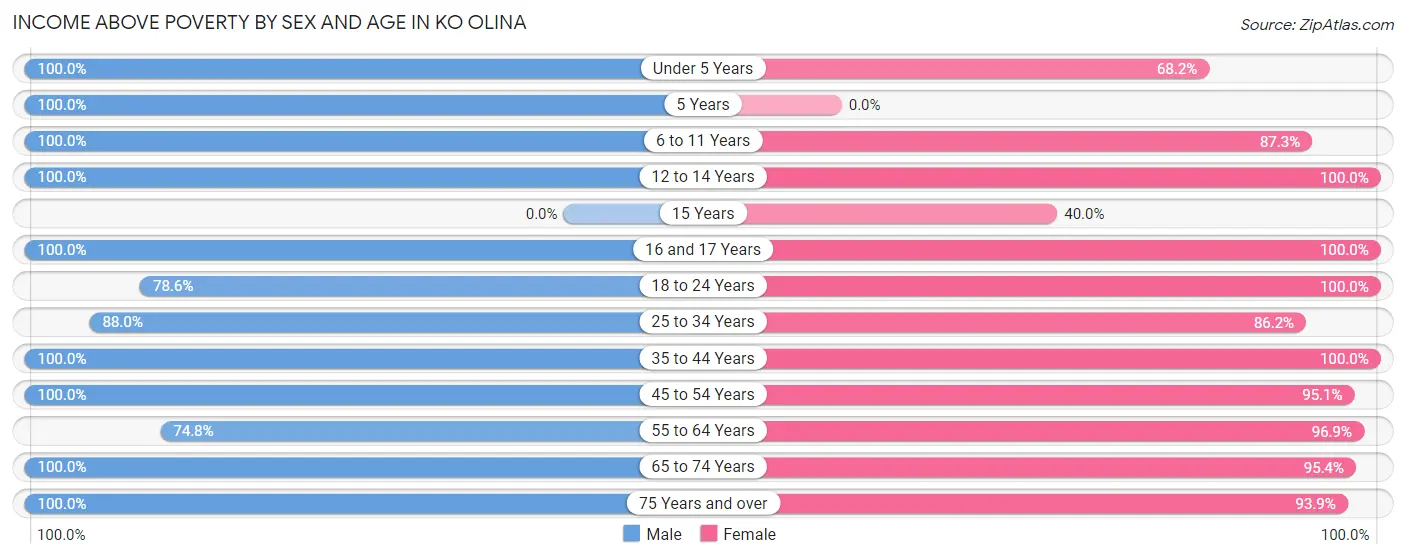
| Age Bracket | Male | Female |
| Under 5 Years | 60 (100.0%) | 30 (68.2%) |
| 5 Years | 6 (100.0%) | 0 (0.0%) |
| 6 to 11 Years | 61 (100.0%) | 48 (87.3%) |
| 12 to 14 Years | 6 (100.0%) | 16 (100.0%) |
| 15 Years | 0 (0.0%) | 4 (40.0%) |
| 16 and 17 Years | 10 (100.0%) | 16 (100.0%) |
| 18 to 24 Years | 22 (78.6%) | 49 (100.0%) |
| 25 to 34 Years | 146 (87.9%) | 112 (86.2%) |
| 35 to 44 Years | 166 (100.0%) | 146 (100.0%) |
| 45 to 54 Years | 110 (100.0%) | 117 (95.1%) |
| 55 to 64 Years | 89 (74.8%) | 156 (96.9%) |
| 65 to 74 Years | 117 (100.0%) | 104 (95.4%) |
| 75 Years and over | 65 (100.0%) | 92 (93.9%) |
| Total | 858 (93.9%) | 890 (93.0%) |
Income Below Poverty Among Married-Couple Families in Ko Olina
The poverty statistics for married-couple families in Ko Olina show that 4.9% or 23 of the total 467 families live below the poverty line. Families with 1 or 2 children have the highest poverty rate of 12.0%, comprising of 18 families. On the other hand, families with no children have the lowest poverty rate of 1.6%, which includes 5 families.
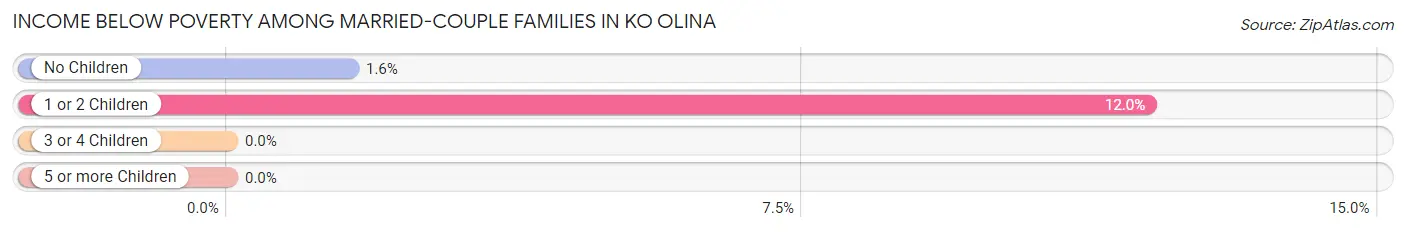
| Children | Above Poverty | Below Poverty |
| No Children | 312 (98.4%) | 5 (1.6%) |
| 1 or 2 Children | 132 (88.0%) | 18 (12.0%) |
| 3 or 4 Children | 0 (0.0%) | 0 (0.0%) |
| 5 or more Children | 0 (0.0%) | 0 (0.0%) |
| Total | 444 (95.1%) | 23 (4.9%) |
Income Below Poverty Among Single-Parent Households in Ko Olina
| Children | Single Father | Single Mother |
| No Children | 0 (0.0%) | 0 (0.0%) |
| 1 or 2 Children | 0 (0.0%) | 0 (0.0%) |
| 3 or 4 Children | 0 (0.0%) | 0 (0.0%) |
| 5 or more Children | 0 (0.0%) | 0 (0.0%) |
| Total | 0 (0.0%) | 0 (0.0%) |
Income Below Poverty Among Married-Couple vs Single-Parent Households in Ko Olina
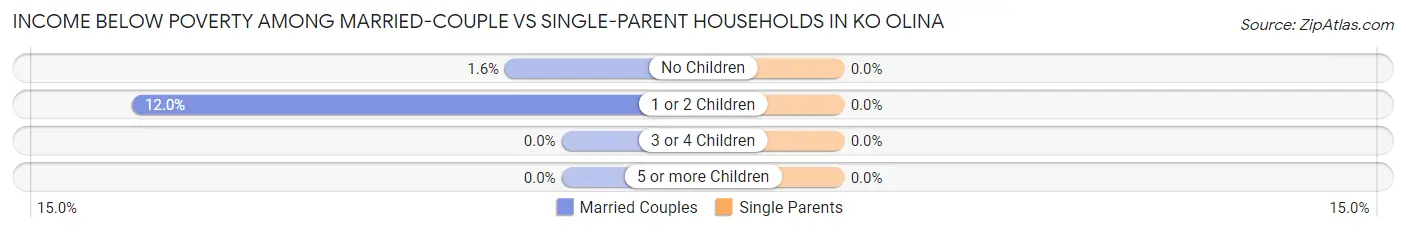
| Children | Married-Couple Families | Single-Parent Households |
| No Children | 5 (1.6%) | 0 (0.0%) |
| 1 or 2 Children | 18 (12.0%) | 0 (0.0%) |
| 3 or 4 Children | 0 (0.0%) | 0 (0.0%) |
| 5 or more Children | 0 (0.0%) | 0 (0.0%) |
| Total | 23 (4.9%) | 0 (0.0%) |
Race in Ko Olina
The most populous races in Ko Olina are White / Caucasian (1,067 | 57.0%), Two or more Races (297 | 15.9%), and Asian (287 | 15.3%).
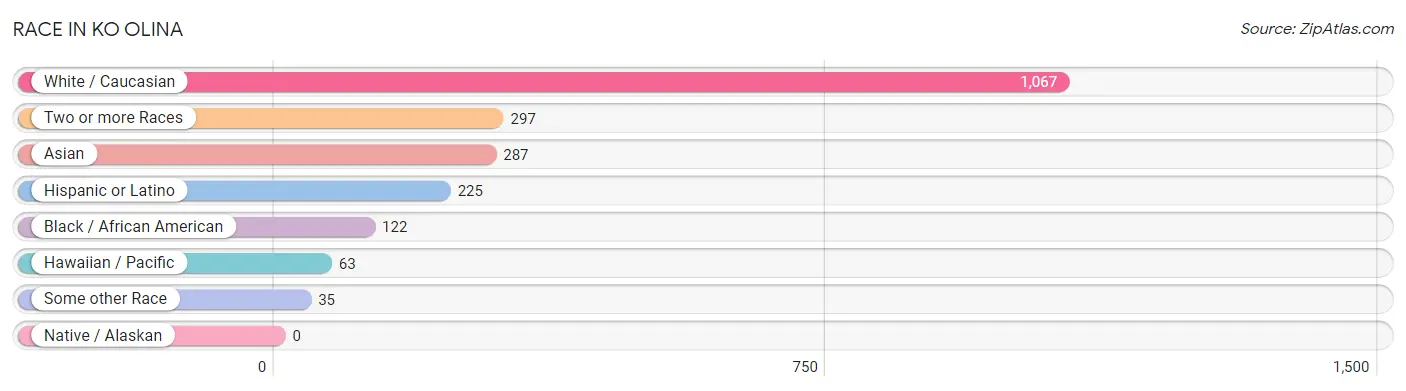
| Race | # Population | % Population |
| Asian | 287 | 15.3% |
| Black / African American | 122 | 6.5% |
| Hawaiian / Pacific | 63 | 3.4% |
| Hispanic or Latino | 225 | 12.0% |
| Native / Alaskan | 0 | 0.0% |
| White / Caucasian | 1,067 | 57.0% |
| Two or more Races | 297 | 15.9% |
| Some other Race | 35 | 1.9% |
| Total | 1,871 | 100.0% |
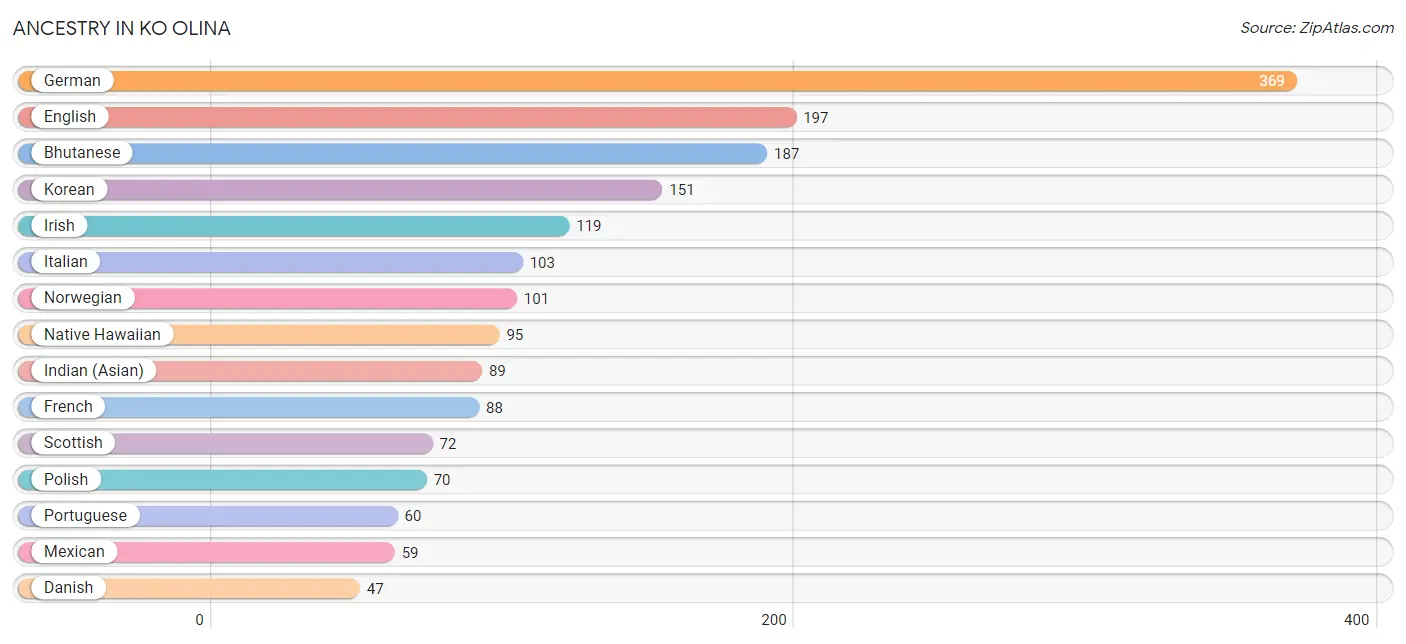
Ancestry in Ko Olina
The most populous ancestries reported in Ko Olina are German (369 | 19.7%), English (197 | 10.5%), Bhutanese (187 | 10.0%), Korean (151 | 8.1%), and Irish (119 | 6.4%), together accounting for 54.7% of all Ko Olina residents.
| Ancestry | # Population | % Population |
| American | 25 | 1.3% |
| Bhutanese | 187 | 10.0% |
| British | 9 | 0.5% |
| Burmese | 34 | 1.8% |
| Canadian | 10 | 0.5% |
| Central American | 21 | 1.1% |
| Cherokee | 6 | 0.3% |
| Colombian | 5 | 0.3% |
| Danish | 47 | 2.5% |
| Dutch | 21 | 1.1% |
| English | 197 | 10.5% |
| European | 19 | 1.0% |
| French | 88 | 4.7% |
| French Canadian | 17 | 0.9% |
| German | 369 | 19.7% |
| Greek | 4 | 0.2% |
| Guamanian / Chamorro | 9 | 0.5% |
| Guatemalan | 5 | 0.3% |
| Haitian | 7 | 0.4% |
| Indian (Asian) | 89 | 4.8% |
| Iranian | 5 | 0.3% |
| Irish | 119 | 6.4% |
| Italian | 103 | 5.5% |
| Korean | 151 | 8.1% |
| Malaysian | 5 | 0.3% |
| Mexican | 59 | 3.2% |
| Native Hawaiian | 95 | 5.1% |
| Northern European | 6 | 0.3% |
| Norwegian | 101 | 5.4% |
| Pakistani | 15 | 0.8% |
| Peruvian | 9 | 0.5% |
| Polish | 70 | 3.7% |
| Portuguese | 60 | 3.2% |
| Puerto Rican | 30 | 1.6% |
| Romanian | 44 | 2.4% |
| Russian | 19 | 1.0% |
| Salvadoran | 16 | 0.9% |
| Samoan | 6 | 0.3% |
| Scandinavian | 21 | 1.1% |
| Scotch-Irish | 27 | 1.4% |
| Scottish | 72 | 3.8% |
| South American | 14 | 0.7% |
| Spaniard | 44 | 2.4% |
| Spanish | 11 | 0.6% |
| Sri Lankan | 17 | 0.9% |
| Swedish | 21 | 1.1% |
| Welsh | 10 | 0.5% | View All 47 Rows |
Immigrants in Ko Olina
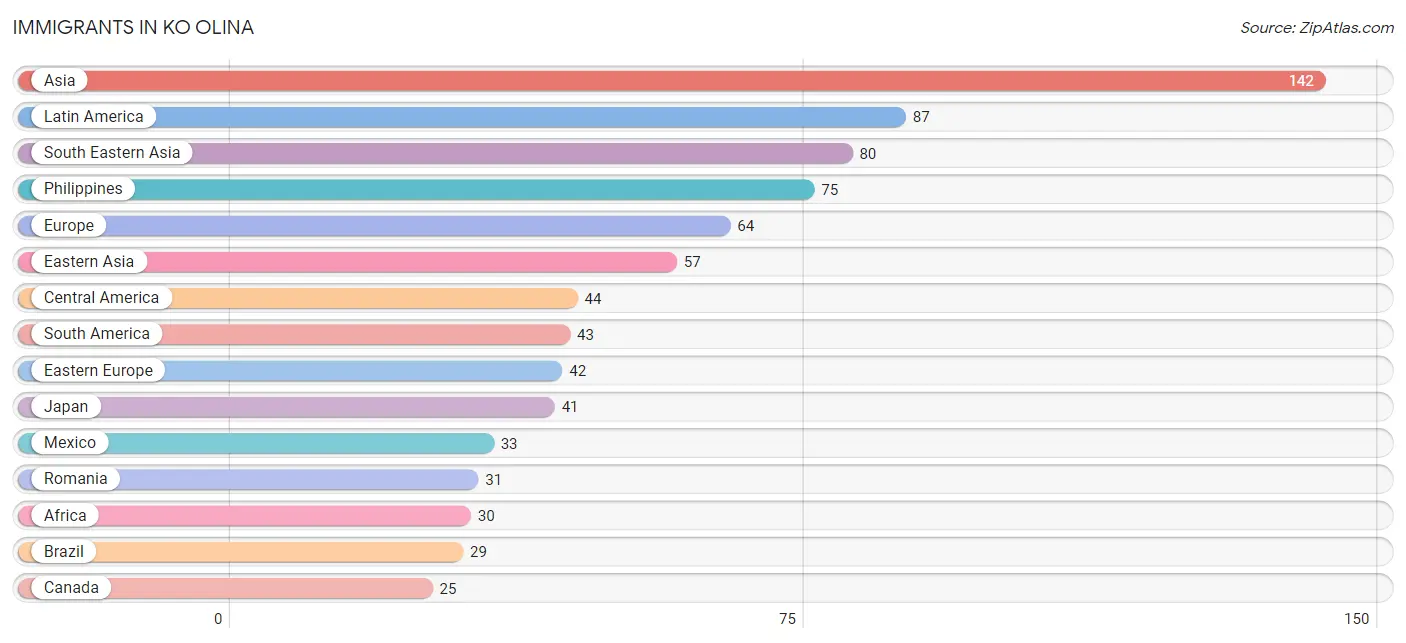
The most numerous immigrant groups reported in Ko Olina came from Asia (142 | 7.6%), Latin America (87 | 4.6%), South Eastern Asia (80 | 4.3%), Philippines (75 | 4.0%), and Europe (64 | 3.4%), together accounting for 23.9% of all Ko Olina residents.
| Immigration Origin | # Population | % Population |
| Africa | 30 | 1.6% |
| Asia | 142 | 7.6% |
| Australia | 16 | 0.9% |
| Brazil | 29 | 1.5% |
| Canada | 25 | 1.3% |
| Central America | 44 | 2.4% |
| China | 11 | 0.6% |
| Colombia | 5 | 0.3% |
| Eastern Africa | 18 | 1.0% |
| Eastern Asia | 57 | 3.0% |
| Eastern Europe | 42 | 2.2% |
| El Salvador | 6 | 0.3% |
| Europe | 64 | 3.4% |
| France | 6 | 0.3% |
| Guatemala | 5 | 0.3% |
| Japan | 41 | 2.2% |
| Kenya | 18 | 1.0% |
| Korea | 5 | 0.3% |
| Latin America | 87 | 4.6% |
| Mexico | 33 | 1.8% |
| Netherlands | 6 | 0.3% |
| Northern Europe | 5 | 0.3% |
| Oceania | 20 | 1.1% |
| Peru | 9 | 0.5% |
| Philippines | 75 | 4.0% |
| Poland | 5 | 0.3% |
| Romania | 31 | 1.7% |
| Russia | 6 | 0.3% |
| South America | 43 | 2.3% |
| South Central Asia | 5 | 0.3% |
| South Eastern Asia | 80 | 4.3% |
| Southern Europe | 5 | 0.3% |
| Spain | 5 | 0.3% |
| Sri Lanka | 5 | 0.3% |
| Sweden | 5 | 0.3% |
| Taiwan | 6 | 0.3% |
| Thailand | 5 | 0.3% |
| Western Africa | 12 | 0.6% |
| Western Europe | 12 | 0.6% | View All 39 Rows |
Sex and Age in Ko Olina
Sex and Age in Ko Olina
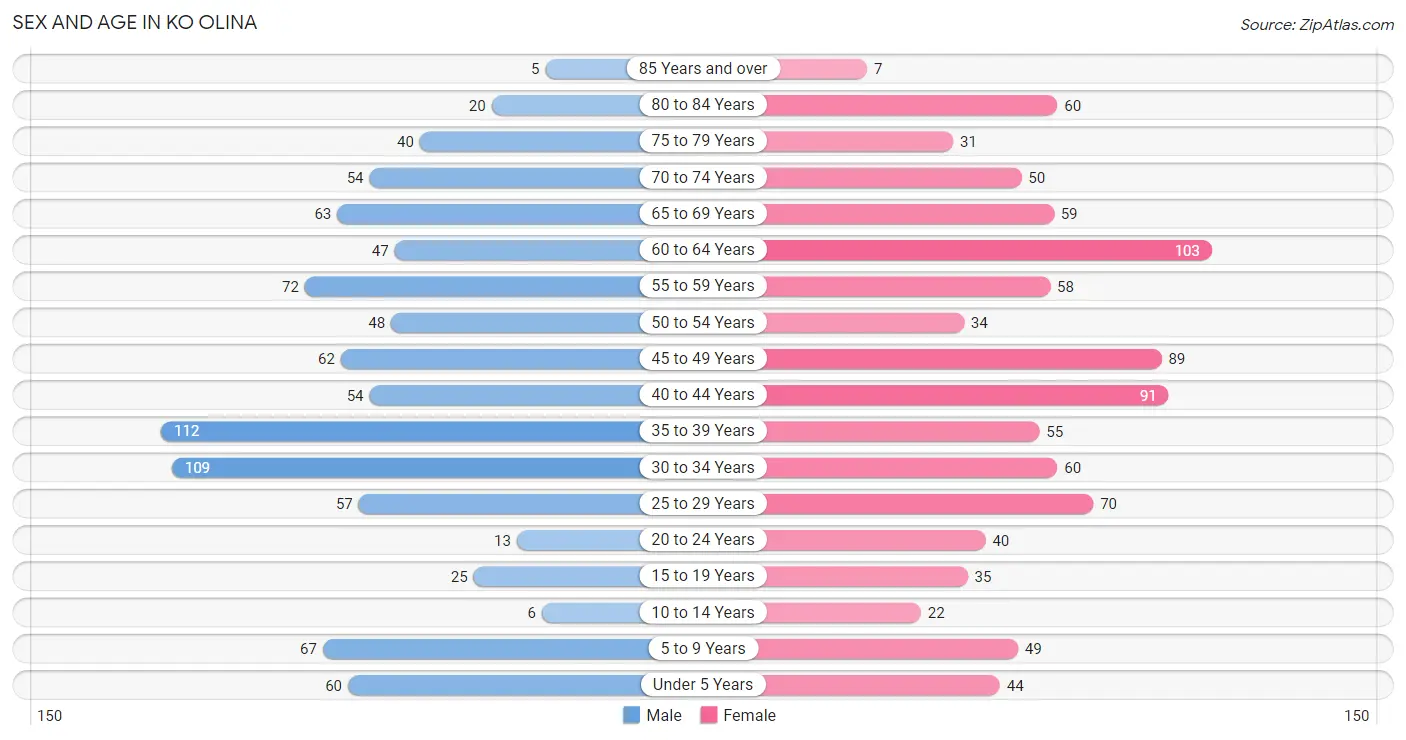
The most populous age groups in Ko Olina are 35 to 39 Years (112 | 12.2%) for men and 60 to 64 Years (103 | 10.8%) for women.
| Age Bracket | Male | Female |
| Under 5 Years | 60 (6.6%) | 44 (4.6%) |
| 5 to 9 Years | 67 (7.3%) | 49 (5.1%) |
| 10 to 14 Years | 6 (0.7%) | 22 (2.3%) |
| 15 to 19 Years | 25 (2.7%) | 35 (3.7%) |
| 20 to 24 Years | 13 (1.4%) | 40 (4.2%) |
| 25 to 29 Years | 57 (6.2%) | 70 (7.3%) |
| 30 to 34 Years | 109 (11.9%) | 60 (6.3%) |
| 35 to 39 Years | 112 (12.2%) | 55 (5.8%) |
| 40 to 44 Years | 54 (5.9%) | 91 (9.5%) |
| 45 to 49 Years | 62 (6.8%) | 89 (9.3%) |
| 50 to 54 Years | 48 (5.2%) | 34 (3.5%) |
| 55 to 59 Years | 72 (7.9%) | 58 (6.1%) |
| 60 to 64 Years | 47 (5.1%) | 103 (10.8%) |
| 65 to 69 Years | 63 (6.9%) | 59 (6.2%) |
| 70 to 74 Years | 54 (5.9%) | 50 (5.2%) |
| 75 to 79 Years | 40 (4.4%) | 31 (3.2%) |
| 80 to 84 Years | 20 (2.2%) | 60 (6.3%) |
| 85 Years and over | 5 (0.5%) | 7 (0.7%) |
| Total | 914 (100.0%) | 957 (100.0%) |
Families and Households in Ko Olina
Median Family Size in Ko Olina
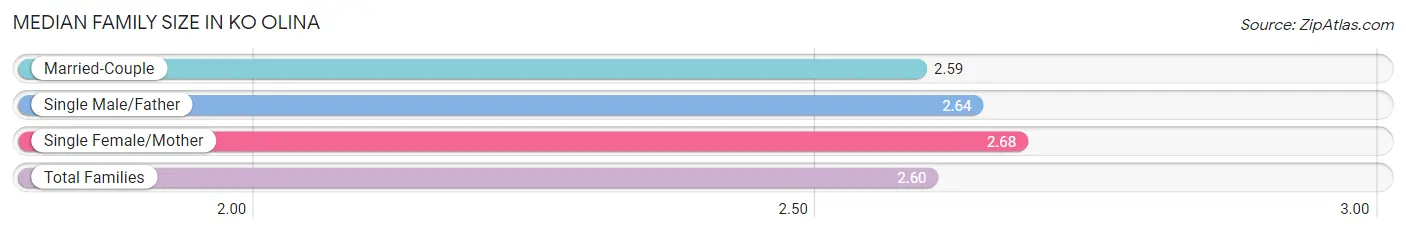
The median family size in Ko Olina is 2.60 persons per family, with single female/mother families (68 | 12.4%) accounting for the largest median family size of 2.68 persons per family. On the other hand, married-couple families (467 | 85.5%) represent the smallest median family size with 2.59 persons per family.
| Family Type | # Families | Family Size |
| Married-Couple | 467 (85.5%) | 2.59 |
| Single Male/Father | 11 (2.0%) | 2.64 |
| Single Female/Mother | 68 (12.4%) | 2.68 |
| Total Families | 546 (100.0%) | 2.60 |
Median Household Size in Ko Olina
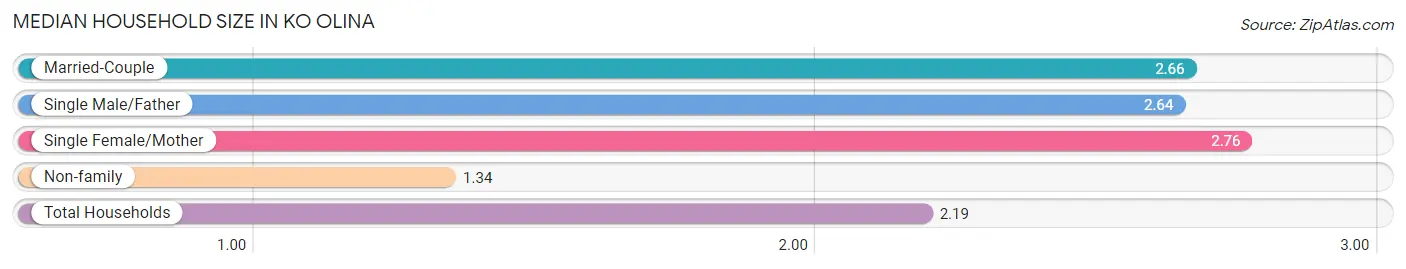
The median household size in Ko Olina is 2.19 persons per household, with single female/mother households (68 | 8.0%) accounting for the largest median household size of 2.76 persons per household. non-family households (308 | 36.1%) represent the smallest median household size with 1.34 persons per household.
| Household Type | # Households | Household Size |
| Married-Couple | 467 (54.7%) | 2.66 |
| Single Male/Father | 11 (1.3%) | 2.64 |
| Single Female/Mother | 68 (8.0%) | 2.76 |
| Non-family | 308 (36.1%) | 1.34 |
| Total Households | 854 (100.0%) | 2.19 |
Household Size by Marriage Status in Ko Olina
Out of a total of 854 households in Ko Olina, 546 (63.9%) are family households, while 308 (36.1%) are nonfamily households. The most numerous type of family households are 2-person households, comprising 345, and the most common type of nonfamily households are 1-person households, comprising 236.
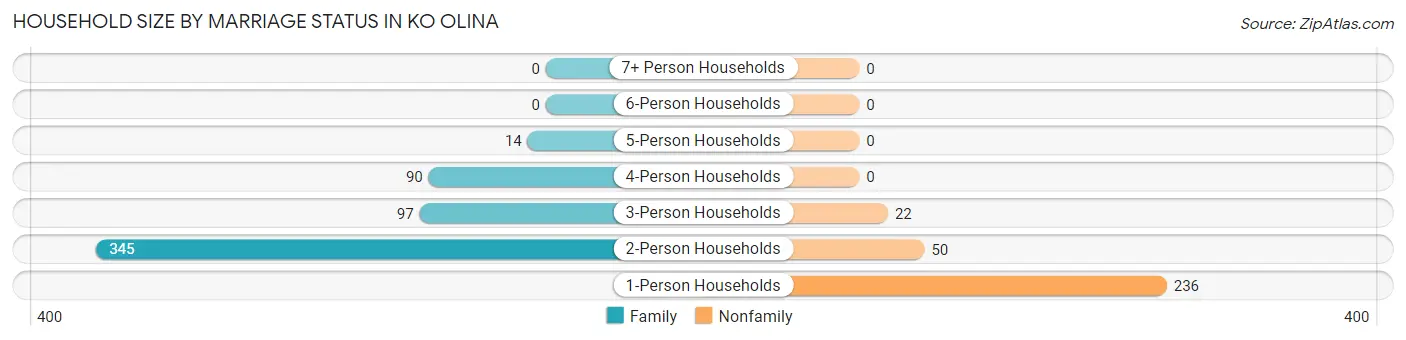
| Household Size | Family Households | Nonfamily Households |
| 1-Person Households | - | 236 (27.6%) |
| 2-Person Households | 345 (40.4%) | 50 (5.9%) |
| 3-Person Households | 97 (11.4%) | 22 (2.6%) |
| 4-Person Households | 90 (10.5%) | 0 (0.0%) |
| 5-Person Households | 14 (1.6%) | 0 (0.0%) |
| 6-Person Households | 0 (0.0%) | 0 (0.0%) |
| 7+ Person Households | 0 (0.0%) | 0 (0.0%) |
| Total | 546 (63.9%) | 308 (36.1%) |
Female Fertility in Ko Olina
Fertility by Age in Ko Olina
Average fertility rate in Ko Olina is 82.0 births per 1,000 women. Women in the age bracket of 35 to 50 years have the highest fertility rate with 110.0 births per 1,000 women. Women in the age bracket of 35 to 50 years acount for 73.0% of all women with births.
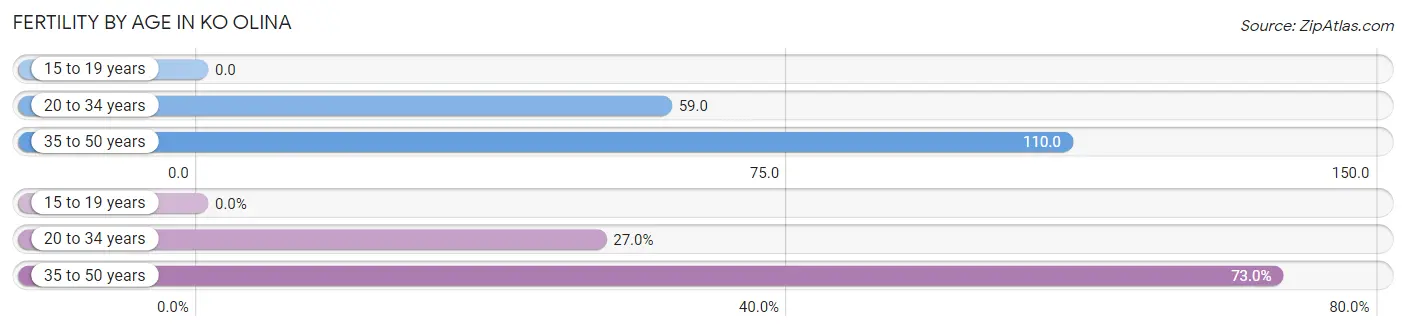
| Age Bracket | Women with Births | Births / 1,000 Women |
| 15 to 19 years | 0 (0.0%) | 0.0 |
| 20 to 34 years | 10 (27.0%) | 59.0 |
| 35 to 50 years | 27 (73.0%) | 110.0 |
| Total | 37 (100.0%) | 82.0 |
Fertility by Age by Marriage Status in Ko Olina
89.2% of women with births (37) in Ko Olina are married. The highest percentage of unmarried women with births falls into 35 to 50 years age bracket with 14.8% of them unmarried at the time of birth, while the lowest percentage of unmarried women with births belong to 20 to 34 years age bracket with 0.0% of them unmarried.
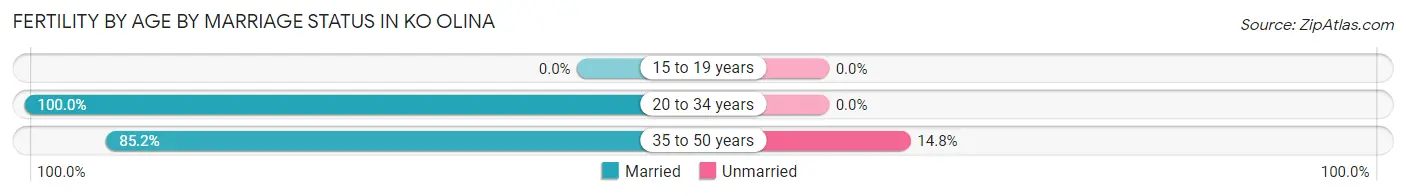
| Age Bracket | Married | Unmarried |
| 15 to 19 years | 0 (0.0%) | 0 (0.0%) |
| 20 to 34 years | 10 (100.0%) | 0 (0.0%) |
| 35 to 50 years | 23 (85.2%) | 4 (14.8%) |
| Total | 33 (89.2%) | 4 (10.8%) |
Fertility by Education in Ko Olina
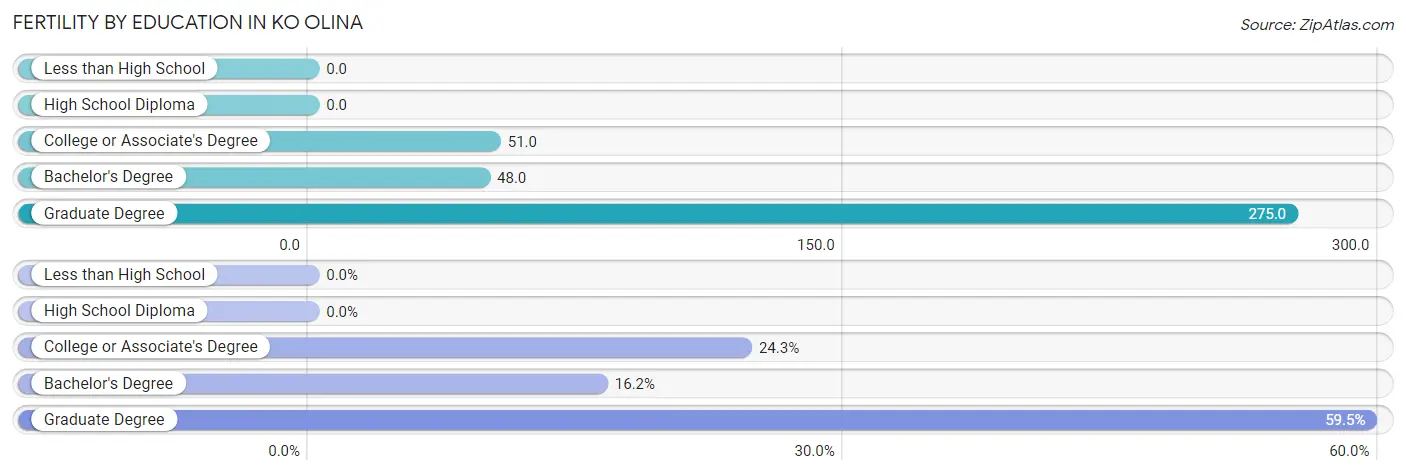
| Educational Attainment | Women with Births | Births / 1,000 Women |
| Less than High School | 0 (0.0%) | 0.0 |
| High School Diploma | 0 (0.0%) | 0.0 |
| College or Associate's Degree | 9 (24.3%) | 51.0 |
| Bachelor's Degree | 6 (16.2%) | 48.0 |
| Graduate Degree | 22 (59.5%) | 275.0 |
| Total | 37 (100.0%) | 82.0 |
Fertility by Education by Marriage Status in Ko Olina
10.8% of women with births in Ko Olina are unmarried. Women with the educational attainment of bachelor's degree are most likely to be married with 100.0% of them married at childbirth, while women with the educational attainment of college or associate's degree are least likely to be married with 44.4% of them unmarried at childbirth.
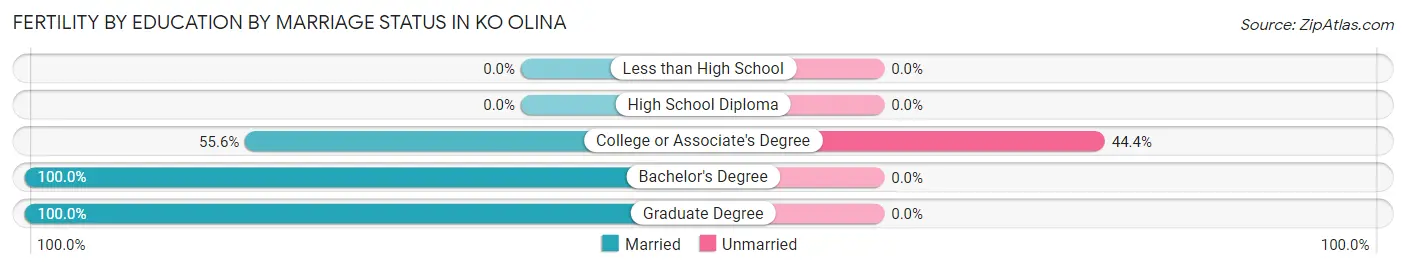
| Educational Attainment | Married | Unmarried |
| Less than High School | 0 (0.0%) | 0 (0.0%) |
| High School Diploma | 0 (0.0%) | 0 (0.0%) |
| College or Associate's Degree | 5 (55.6%) | 4 (44.4%) |
| Bachelor's Degree | 6 (100.0%) | 0 (0.0%) |
| Graduate Degree | 22 (100.0%) | 0 (0.0%) |
| Total | 33 (89.2%) | 4 (10.8%) |
Employment Characteristics in Ko Olina
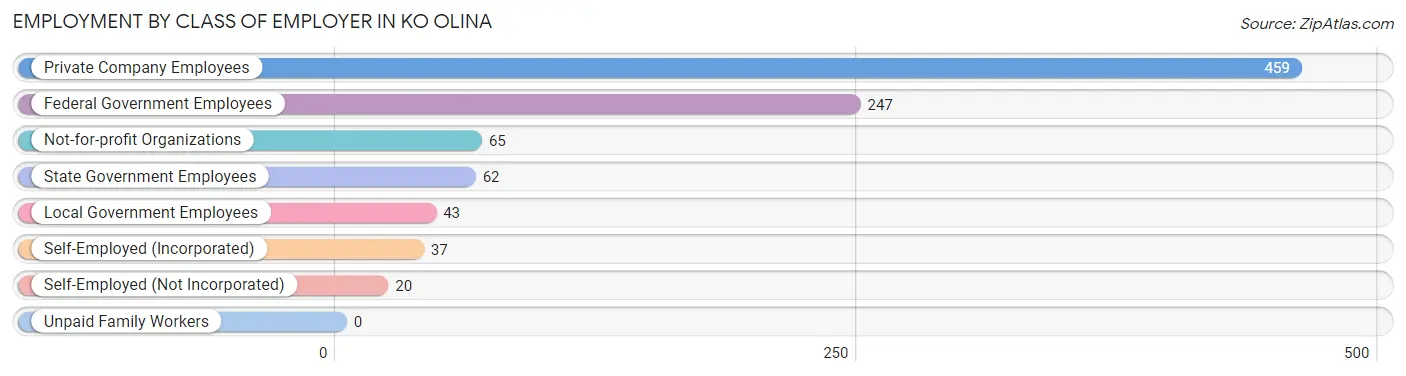
Employment by Class of Employer in Ko Olina
Among the 933 employed individuals in Ko Olina, private company employees (459 | 49.2%), federal government employees (247 | 26.5%), and not-for-profit organizations (65 | 7.0%) make up the most common classes of employment.
| Employer Class | # Employees | % Employees |
| Private Company Employees | 459 | 49.2% |
| Self-Employed (Incorporated) | 37 | 4.0% |
| Self-Employed (Not Incorporated) | 20 | 2.1% |
| Not-for-profit Organizations | 65 | 7.0% |
| Local Government Employees | 43 | 4.6% |
| State Government Employees | 62 | 6.7% |
| Federal Government Employees | 247 | 26.5% |
| Unpaid Family Workers | 0 | 0.0% |
| Total | 933 | 100.0% |
Employment Status by Age in Ko Olina
According to the labor force statistics for Ko Olina, out of the total population over 16 years of age (1,613), 59.6% or 961 individuals are in the labor force, with 3.0% or 29 of them unemployed. The age group with the highest labor force participation rate is 30 to 34 years, with 90.5% or 153 individuals in the labor force. Within the labor force, the 20 to 24 years age range has the highest percentage of unemployed individuals, with 40.0% or 12 of them being unemployed.
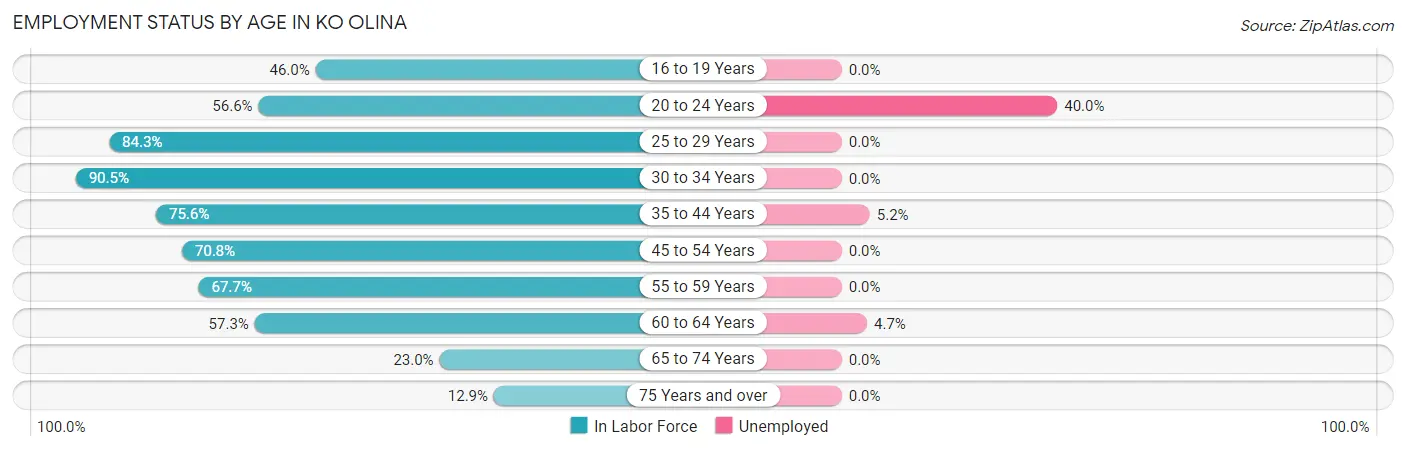
| Age Bracket | In Labor Force | Unemployed |
| 16 to 19 Years | 23 (46.0%) | 0 (0.0%) |
| 20 to 24 Years | 30 (56.6%) | 12 (40.0%) |
| 25 to 29 Years | 107 (84.3%) | 0 (0.0%) |
| 30 to 34 Years | 153 (90.5%) | 0 (0.0%) |
| 35 to 44 Years | 236 (75.6%) | 12 (5.2%) |
| 45 to 54 Years | 165 (70.8%) | 0 (0.0%) |
| 55 to 59 Years | 88 (67.7%) | 0 (0.0%) |
| 60 to 64 Years | 86 (57.3%) | 4 (4.7%) |
| 65 to 74 Years | 52 (23.0%) | 0 (0.0%) |
| 75 Years and over | 21 (12.9%) | 0 (0.0%) |
| Total | 961 (59.6%) | 29 (3.0%) |
Employment Status by Educational Attainment in Ko Olina
According to labor force statistics for Ko Olina, 74.5% of individuals (835) out of the total population between 25 and 64 years of age (1,121) are in the labor force, with 1.7% or 14 of them being unemployed. The group with the highest labor force participation rate are those with the educational attainment of high school diploma, with 82.6% or 76 individuals in the labor force. Within the labor force, individuals with high school diploma education have the highest percentage of unemployment, with 6.7% or 5 of them being unemployed.
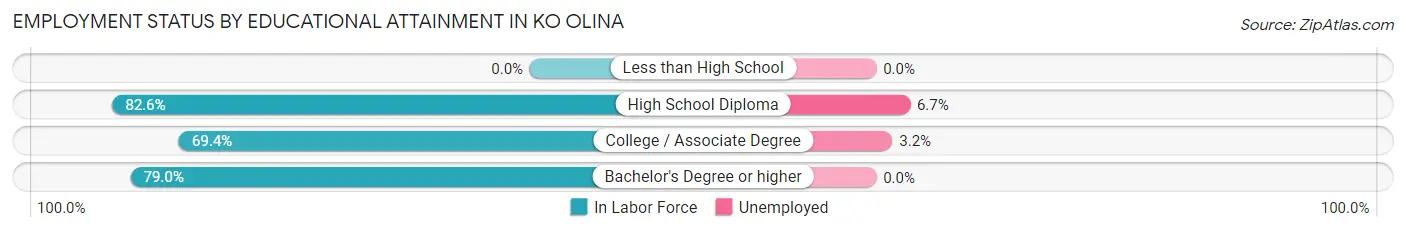
| Educational Attainment | In Labor Force | Unemployed |
| Less than High School | 0 (0.0%) | 0 (0.0%) |
| High School Diploma | 76 (82.6%) | 6 (6.7%) |
| College / Associate Degree | 270 (69.4%) | 12 (3.2%) |
| Bachelor's Degree or higher | 489 (79.0%) | 0 (0.0%) |
| Total | 835 (74.5%) | 19 (1.7%) |
Employment Occupations by Sex in Ko Olina
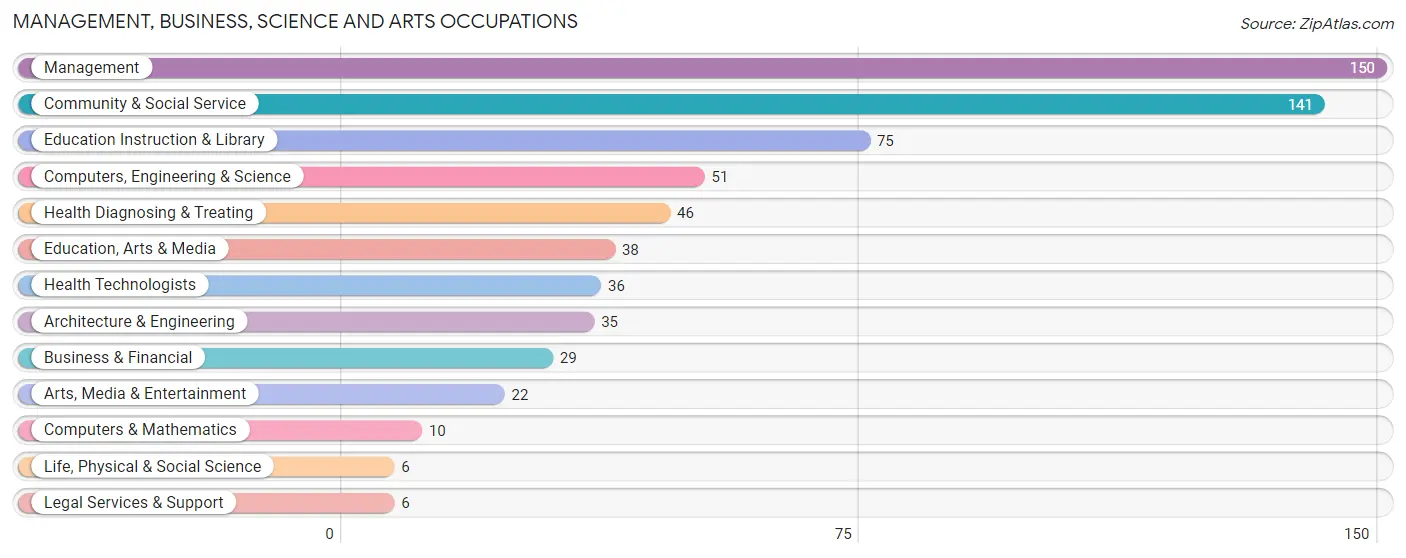
Management, Business, Science and Arts Occupations
The most common Management, Business, Science and Arts occupations in Ko Olina are Management (150 | 19.9%), Community & Social Service (141 | 18.7%), Education Instruction & Library (75 | 10.0%), Computers, Engineering & Science (51 | 6.8%), and Health Diagnosing & Treating (46 | 6.1%).
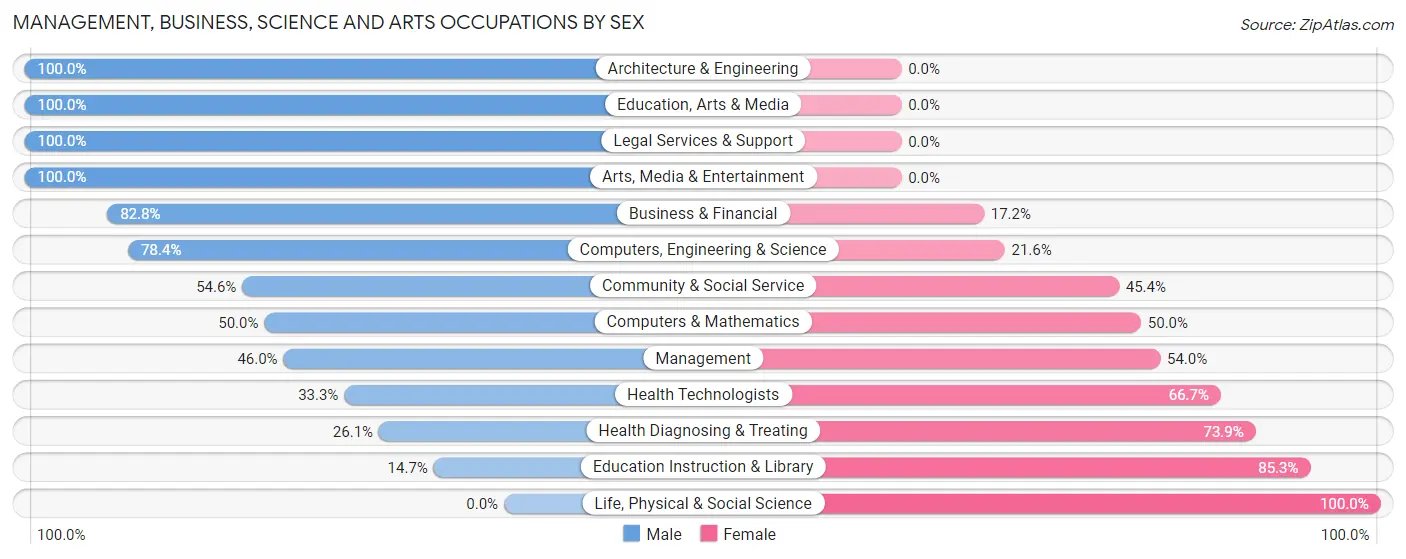
Management, Business, Science and Arts Occupations by Sex
Within the Management, Business, Science and Arts occupations in Ko Olina, the most male-oriented occupations are Architecture & Engineering (100.0%), Education, Arts & Media (100.0%), and Legal Services & Support (100.0%), while the most female-oriented occupations are Life, Physical & Social Science (100.0%), Education Instruction & Library (85.3%), and Health Diagnosing & Treating (73.9%).
| Occupation | Male | Female |
| Management | 69 (46.0%) | 81 (54.0%) |
| Business & Financial | 24 (82.8%) | 5 (17.2%) |
| Computers, Engineering & Science | 40 (78.4%) | 11 (21.6%) |
| Computers & Mathematics | 5 (50.0%) | 5 (50.0%) |
| Architecture & Engineering | 35 (100.0%) | 0 (0.0%) |
| Life, Physical & Social Science | 0 (0.0%) | 6 (100.0%) |
| Community & Social Service | 77 (54.6%) | 64 (45.4%) |
| Education, Arts & Media | 38 (100.0%) | 0 (0.0%) |
| Legal Services & Support | 6 (100.0%) | 0 (0.0%) |
| Education Instruction & Library | 11 (14.7%) | 64 (85.3%) |
| Arts, Media & Entertainment | 22 (100.0%) | 0 (0.0%) |
| Health Diagnosing & Treating | 12 (26.1%) | 34 (73.9%) |
| Health Technologists | 12 (33.3%) | 24 (66.7%) |
| Total (Category) | 222 (53.2%) | 195 (46.8%) |
| Total (Overall) | 391 (51.9%) | 362 (48.1%) |
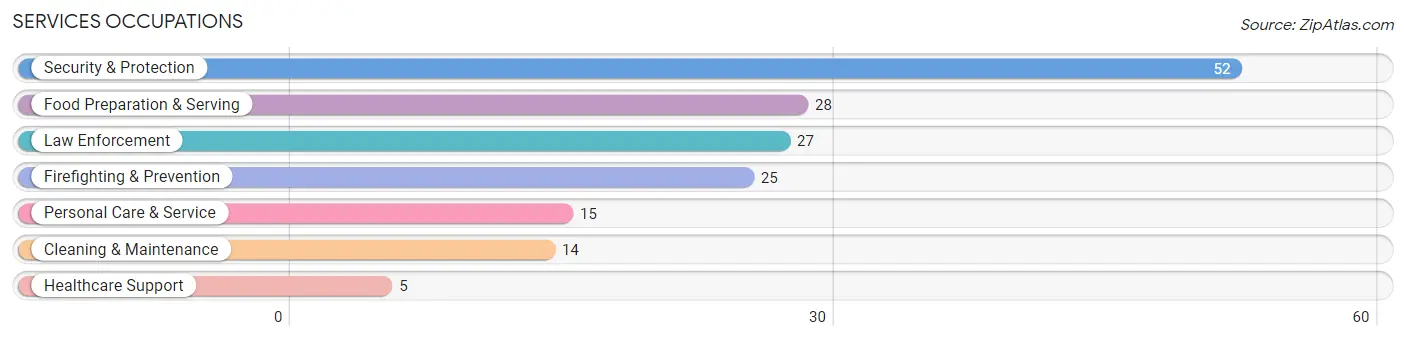
Services Occupations
The most common Services occupations in Ko Olina are Security & Protection (52 | 6.9%), Food Preparation & Serving (28 | 3.7%), Law Enforcement (27 | 3.6%), Firefighting & Prevention (25 | 3.3%), and Personal Care & Service (15 | 2.0%).
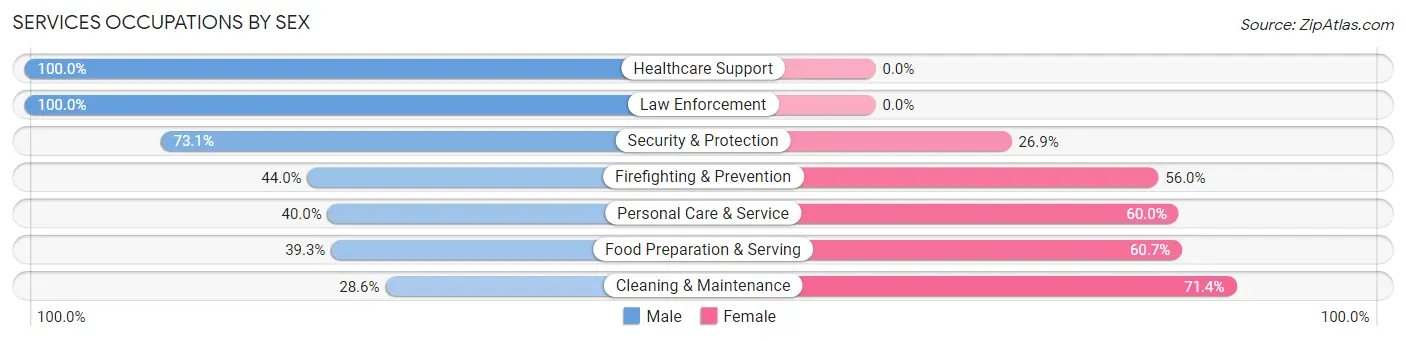
Services Occupations by Sex
Within the Services occupations in Ko Olina, the most male-oriented occupations are Healthcare Support (100.0%), Law Enforcement (100.0%), and Security & Protection (73.1%), while the most female-oriented occupations are Cleaning & Maintenance (71.4%), Food Preparation & Serving (60.7%), and Personal Care & Service (60.0%).
| Occupation | Male | Female |
| Healthcare Support | 5 (100.0%) | 0 (0.0%) |
| Security & Protection | 38 (73.1%) | 14 (26.9%) |
| Firefighting & Prevention | 11 (44.0%) | 14 (56.0%) |
| Law Enforcement | 27 (100.0%) | 0 (0.0%) |
| Food Preparation & Serving | 11 (39.3%) | 17 (60.7%) |
| Cleaning & Maintenance | 4 (28.6%) | 10 (71.4%) |
| Personal Care & Service | 6 (40.0%) | 9 (60.0%) |
| Total (Category) | 64 (56.1%) | 50 (43.9%) |
| Total (Overall) | 391 (51.9%) | 362 (48.1%) |
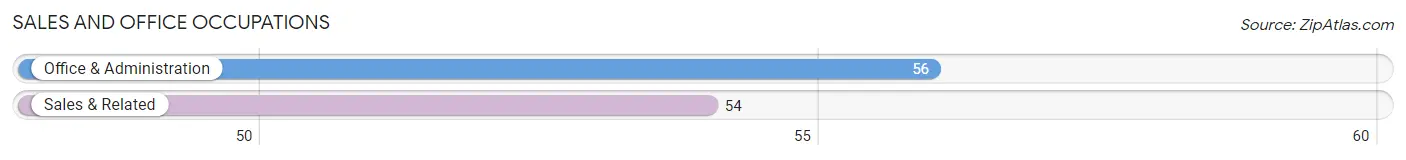
Sales and Office Occupations
The most common Sales and Office occupations in Ko Olina are Office & Administration (56 | 7.4%), and Sales & Related (54 | 7.2%).
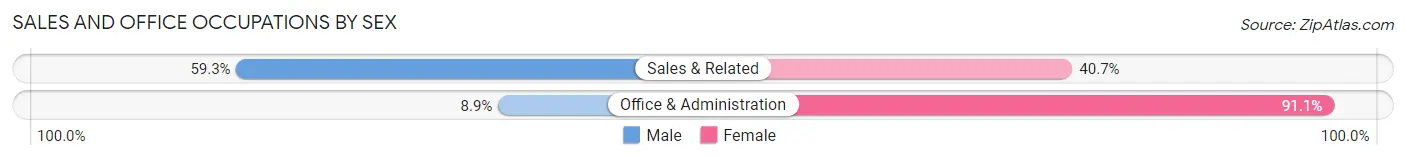
Sales and Office Occupations by Sex
| Occupation | Male | Female |
| Sales & Related | 32 (59.3%) | 22 (40.7%) |
| Office & Administration | 5 (8.9%) | 51 (91.1%) |
| Total (Category) | 37 (33.6%) | 73 (66.4%) |
| Total (Overall) | 391 (51.9%) | 362 (48.1%) |
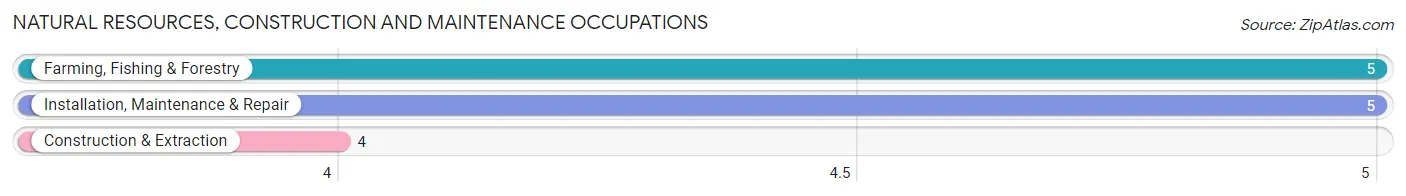
Natural Resources, Construction and Maintenance Occupations
The most common Natural Resources, Construction and Maintenance occupations in Ko Olina are Farming, Fishing & Forestry (5 | 0.7%), Installation, Maintenance & Repair (5 | 0.7%), and Construction & Extraction (4 | 0.5%).
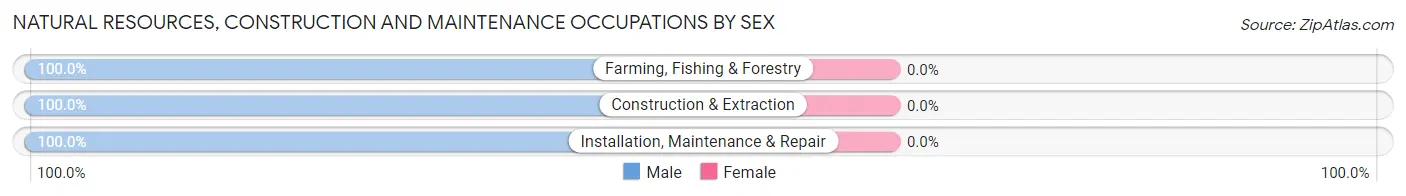
Natural Resources, Construction and Maintenance Occupations by Sex
| Occupation | Male | Female |
| Farming, Fishing & Forestry | 5 (100.0%) | 0 (0.0%) |
| Construction & Extraction | 4 (100.0%) | 0 (0.0%) |
| Installation, Maintenance & Repair | 5 (100.0%) | 0 (0.0%) |
| Total (Category) | 14 (100.0%) | 0 (0.0%) |
| Total (Overall) | 391 (51.9%) | 362 (48.1%) |
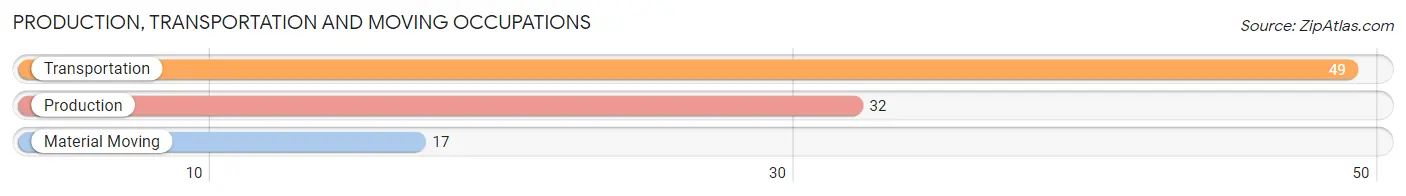
Production, Transportation and Moving Occupations
The most common Production, Transportation and Moving occupations in Ko Olina are Transportation (49 | 6.5%), Production (32 | 4.3%), and Material Moving (17 | 2.3%).
Production, Transportation and Moving Occupations by Sex
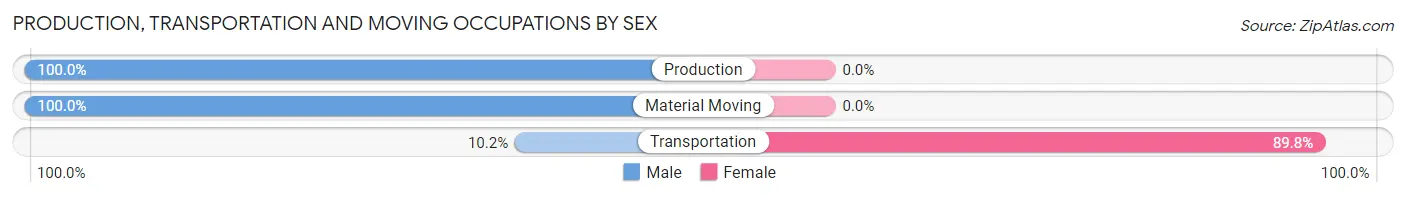
| Occupation | Male | Female |
| Production | 32 (100.0%) | 0 (0.0%) |
| Transportation | 5 (10.2%) | 44 (89.8%) |
| Material Moving | 17 (100.0%) | 0 (0.0%) |
| Total (Category) | 54 (55.1%) | 44 (44.9%) |
| Total (Overall) | 391 (51.9%) | 362 (48.1%) |
Employment Industries by Sex in Ko Olina
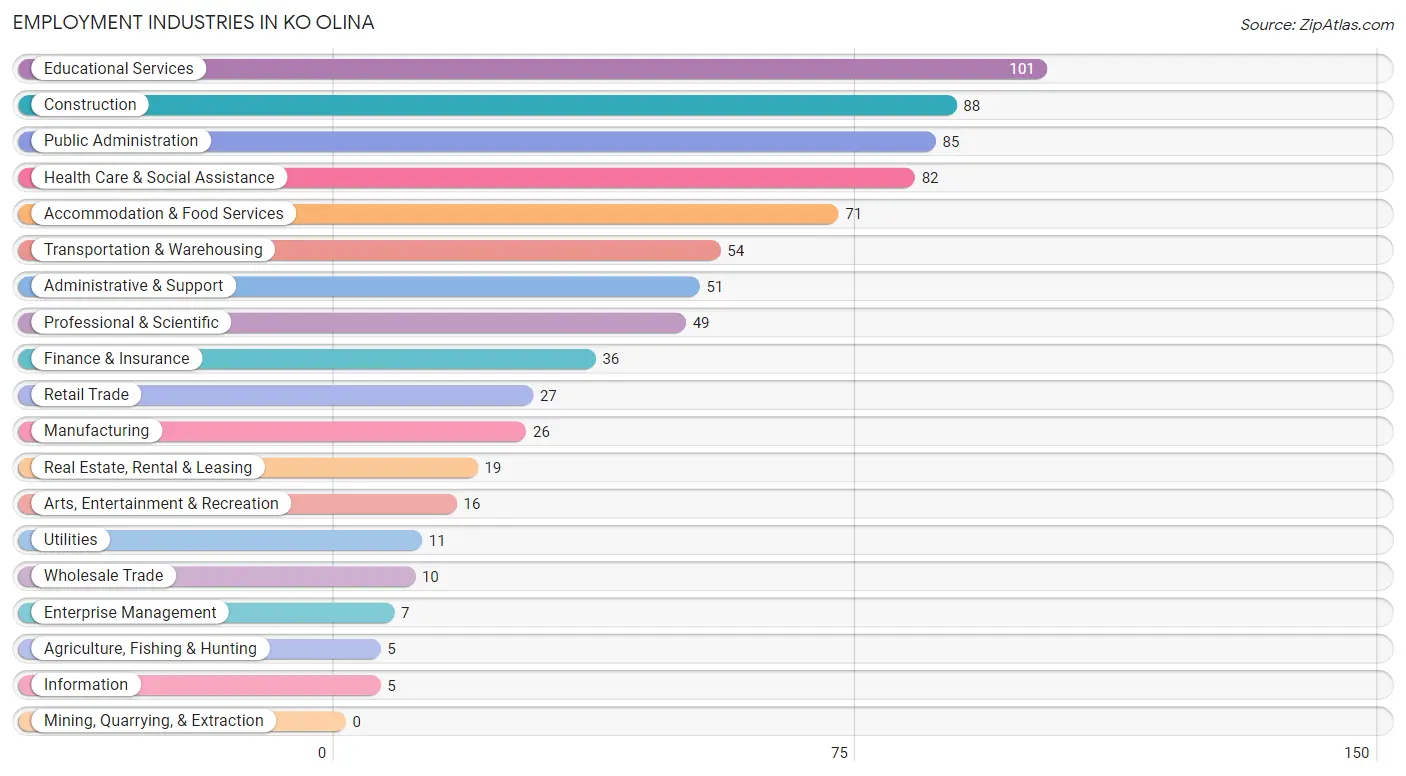
Employment Industries in Ko Olina
The major employment industries in Ko Olina include Educational Services (101 | 13.4%), Construction (88 | 11.7%), Public Administration (85 | 11.3%), Health Care & Social Assistance (82 | 10.9%), and Accommodation & Food Services (71 | 9.4%).
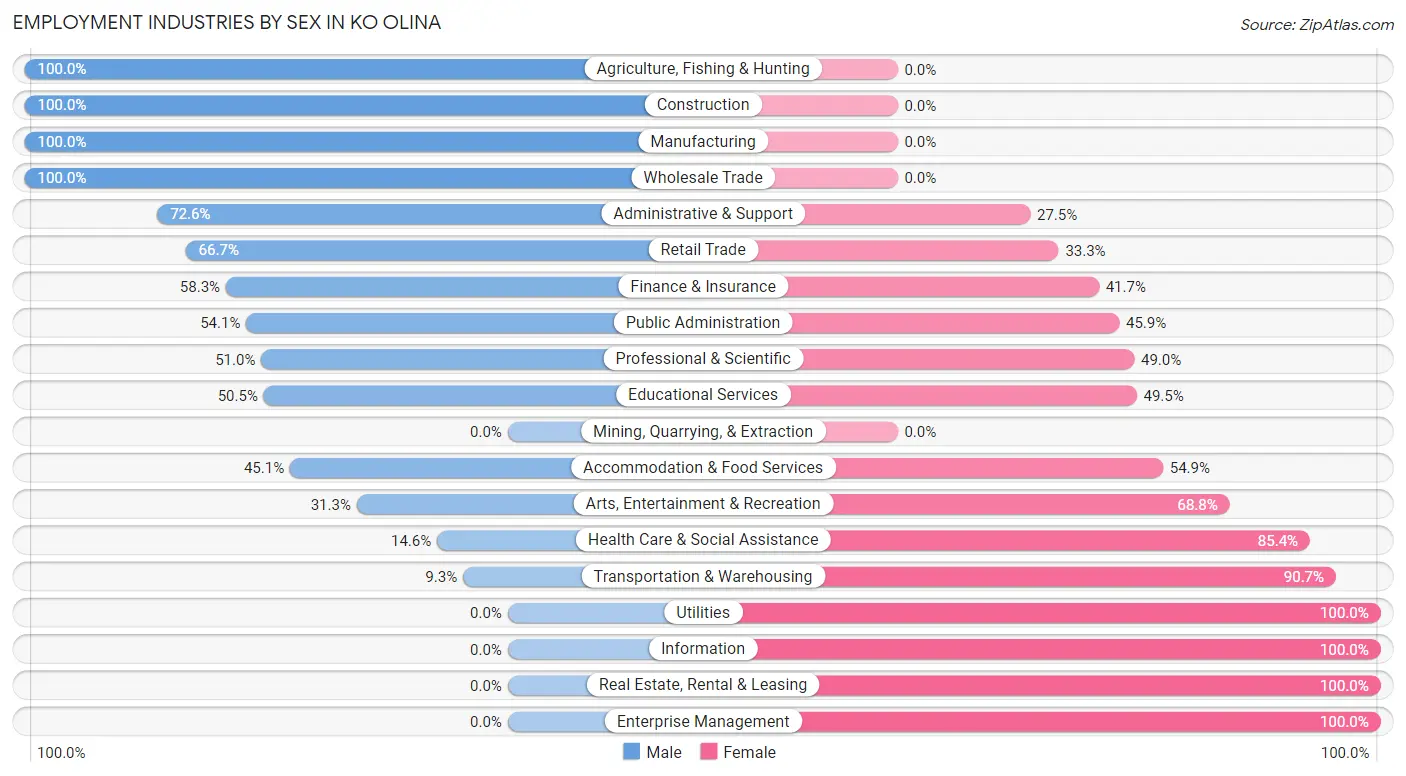
Employment Industries by Sex in Ko Olina
The Ko Olina industries that see more men than women are Agriculture, Fishing & Hunting (100.0%), Construction (100.0%), and Manufacturing (100.0%), whereas the industries that tend to have a higher number of women are Utilities (100.0%), Information (100.0%), and Real Estate, Rental & Leasing (100.0%).
| Industry | Male | Female |
| Agriculture, Fishing & Hunting | 5 (100.0%) | 0 (0.0%) |
| Mining, Quarrying, & Extraction | 0 (0.0%) | 0 (0.0%) |
| Construction | 88 (100.0%) | 0 (0.0%) |
| Manufacturing | 26 (100.0%) | 0 (0.0%) |
| Wholesale Trade | 10 (100.0%) | 0 (0.0%) |
| Retail Trade | 18 (66.7%) | 9 (33.3%) |
| Transportation & Warehousing | 5 (9.3%) | 49 (90.7%) |
| Utilities | 0 (0.0%) | 11 (100.0%) |
| Information | 0 (0.0%) | 5 (100.0%) |
| Finance & Insurance | 21 (58.3%) | 15 (41.7%) |
| Real Estate, Rental & Leasing | 0 (0.0%) | 19 (100.0%) |
| Professional & Scientific | 25 (51.0%) | 24 (49.0%) |
| Enterprise Management | 0 (0.0%) | 7 (100.0%) |
| Administrative & Support | 37 (72.6%) | 14 (27.5%) |
| Educational Services | 51 (50.5%) | 50 (49.5%) |
| Health Care & Social Assistance | 12 (14.6%) | 70 (85.4%) |
| Arts, Entertainment & Recreation | 5 (31.2%) | 11 (68.8%) |
| Accommodation & Food Services | 32 (45.1%) | 39 (54.9%) |
| Public Administration | 46 (54.1%) | 39 (45.9%) |
| Total | 391 (51.9%) | 362 (48.1%) |
Education in Ko Olina
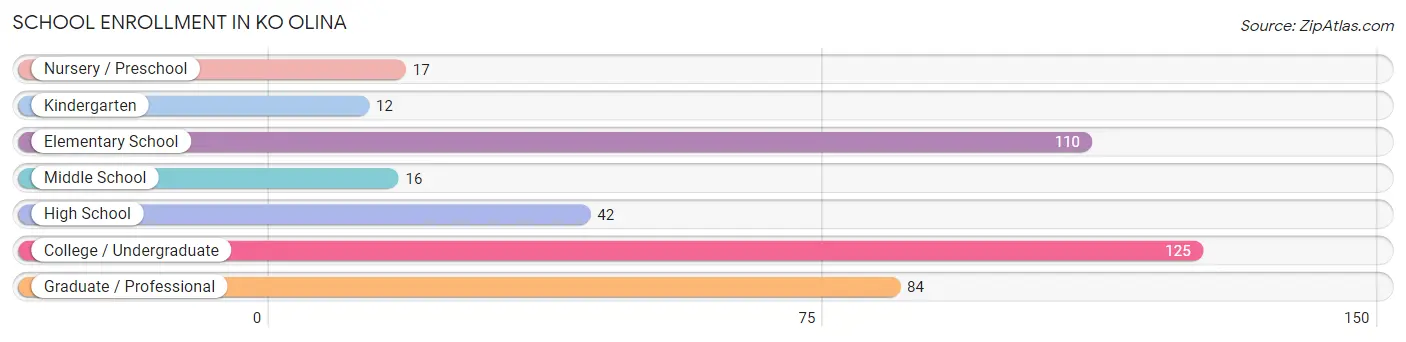
School Enrollment in Ko Olina
The most common levels of schooling among the 406 students in Ko Olina are college / undergraduate (125 | 30.8%), elementary school (110 | 27.1%), and graduate / professional (84 | 20.7%).
| School Level | # Students | % Students |
| Nursery / Preschool | 17 | 4.2% |
| Kindergarten | 12 | 3.0% |
| Elementary School | 110 | 27.1% |
| Middle School | 16 | 3.9% |
| High School | 42 | 10.3% |
| College / Undergraduate | 125 | 30.8% |
| Graduate / Professional | 84 | 20.7% |
| Total | 406 | 100.0% |
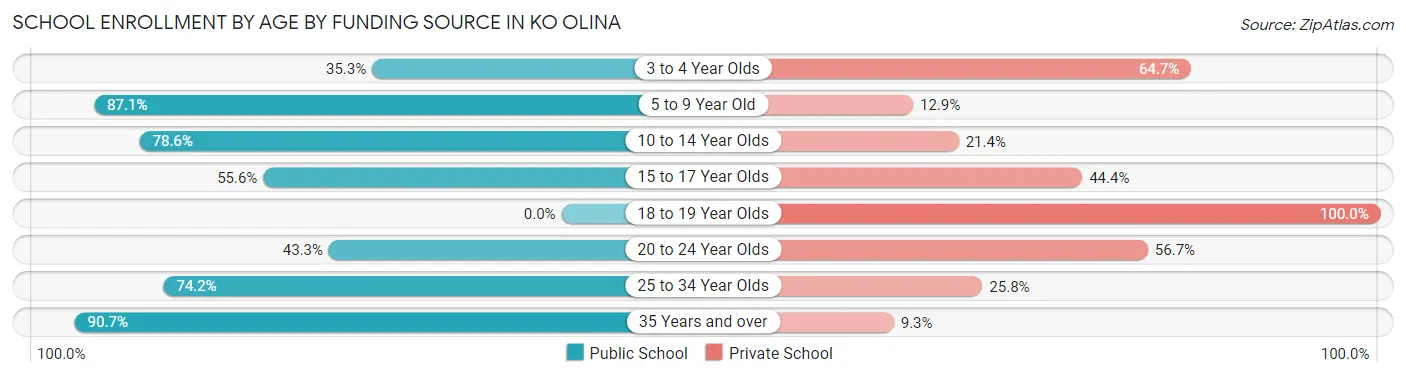
School Enrollment by Age by Funding Source in Ko Olina
Out of a total of 406 students who are enrolled in schools in Ko Olina, 110 (27.1%) attend a private institution, while the remaining 296 (72.9%) are enrolled in public schools. The age group of 18 to 19 year olds has the highest likelihood of being enrolled in private schools, with 15 (100.0% in the age bracket) enrolled. Conversely, the age group of 35 years and over has the lowest likelihood of being enrolled in a private school, with 68 (90.7% in the age bracket) attending a public institution.
| Age Bracket | Public School | Private School |
| 3 to 4 Year Olds | 6 (35.3%) | 11 (64.7%) |
| 5 to 9 Year Old | 101 (87.1%) | 15 (12.9%) |
| 10 to 14 Year Olds | 22 (78.6%) | 6 (21.4%) |
| 15 to 17 Year Olds | 20 (55.6%) | 16 (44.4%) |
| 18 to 19 Year Olds | 0 (0.0%) | 15 (100.0%) |
| 20 to 24 Year Olds | 13 (43.3%) | 17 (56.7%) |
| 25 to 34 Year Olds | 66 (74.2%) | 23 (25.8%) |
| 35 Years and over | 68 (90.7%) | 7 (9.3%) |
| Total | 296 (72.9%) | 110 (27.1%) |
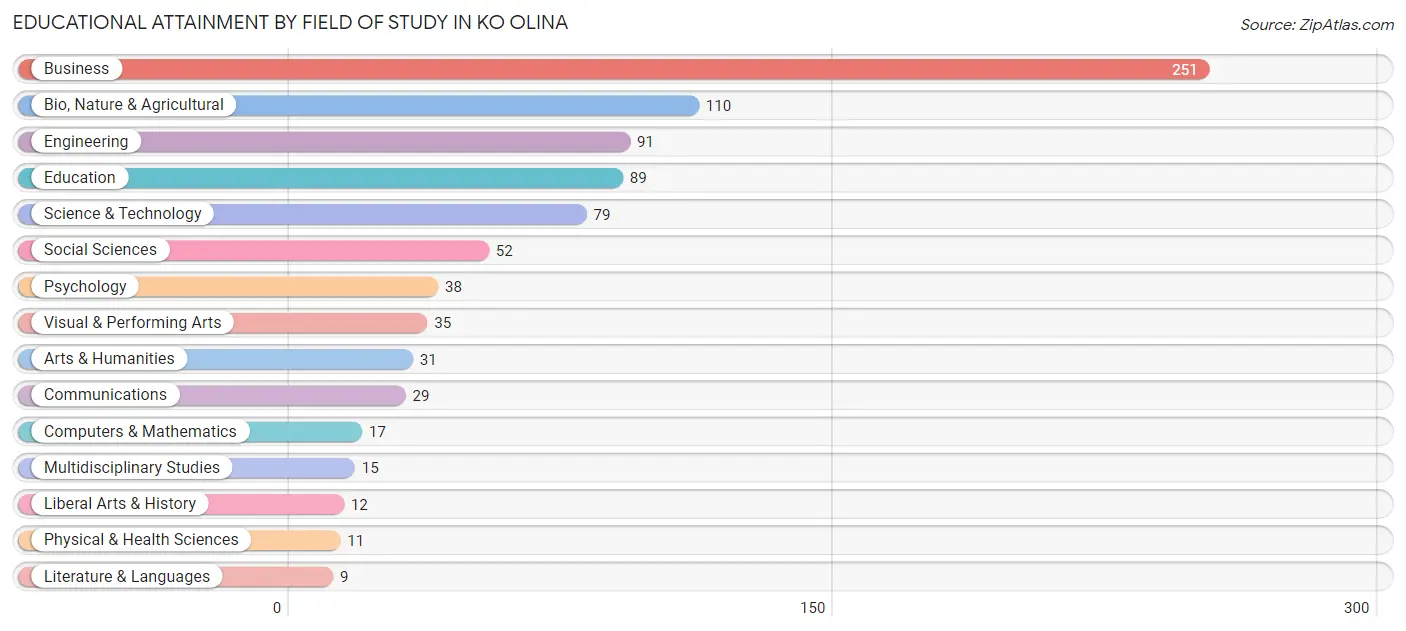
Educational Attainment by Field of Study in Ko Olina
Business (251 | 28.9%), bio, nature & agricultural (110 | 12.7%), engineering (91 | 10.5%), education (89 | 10.2%), and science & technology (79 | 9.1%) are the most common fields of study among 869 individuals in Ko Olina who have obtained a bachelor's degree or higher.
| Field of Study | # Graduates | % Graduates |
| Computers & Mathematics | 17 | 2.0% |
| Bio, Nature & Agricultural | 110 | 12.7% |
| Physical & Health Sciences | 11 | 1.3% |
| Psychology | 38 | 4.4% |
| Social Sciences | 52 | 6.0% |
| Engineering | 91 | 10.5% |
| Multidisciplinary Studies | 15 | 1.7% |
| Science & Technology | 79 | 9.1% |
| Business | 251 | 28.9% |
| Education | 89 | 10.2% |
| Literature & Languages | 9 | 1.0% |
| Liberal Arts & History | 12 | 1.4% |
| Visual & Performing Arts | 35 | 4.0% |
| Communications | 29 | 3.3% |
| Arts & Humanities | 31 | 3.6% |
| Total | 869 | 100.0% |
Transportation & Commute in Ko Olina
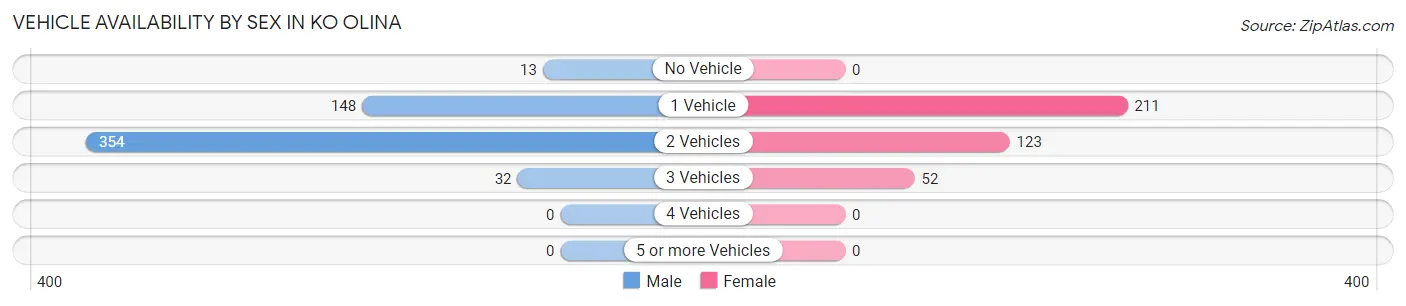
Vehicle Availability by Sex in Ko Olina
The most prevalent vehicle ownership categories in Ko Olina are males with 2 vehicles (354, accounting for 64.7%) and females with 2 vehicles (123, making up 91.7%).
| Vehicles Available | Male | Female |
| No Vehicle | 13 (2.4%) | 0 (0.0%) |
| 1 Vehicle | 148 (27.1%) | 211 (54.7%) |
| 2 Vehicles | 354 (64.7%) | 123 (31.9%) |
| 3 Vehicles | 32 (5.9%) | 52 (13.5%) |
| 4 Vehicles | 0 (0.0%) | 0 (0.0%) |
| 5 or more Vehicles | 0 (0.0%) | 0 (0.0%) |
| Total | 547 (100.0%) | 386 (100.0%) |
Commute Time in Ko Olina
The most frequently occuring commute durations in Ko Olina are 15 to 19 minutes (172 commuters, 19.9%), 20 to 24 minutes (129 commuters, 14.9%), and 45 to 59 minutes (127 commuters, 14.7%).
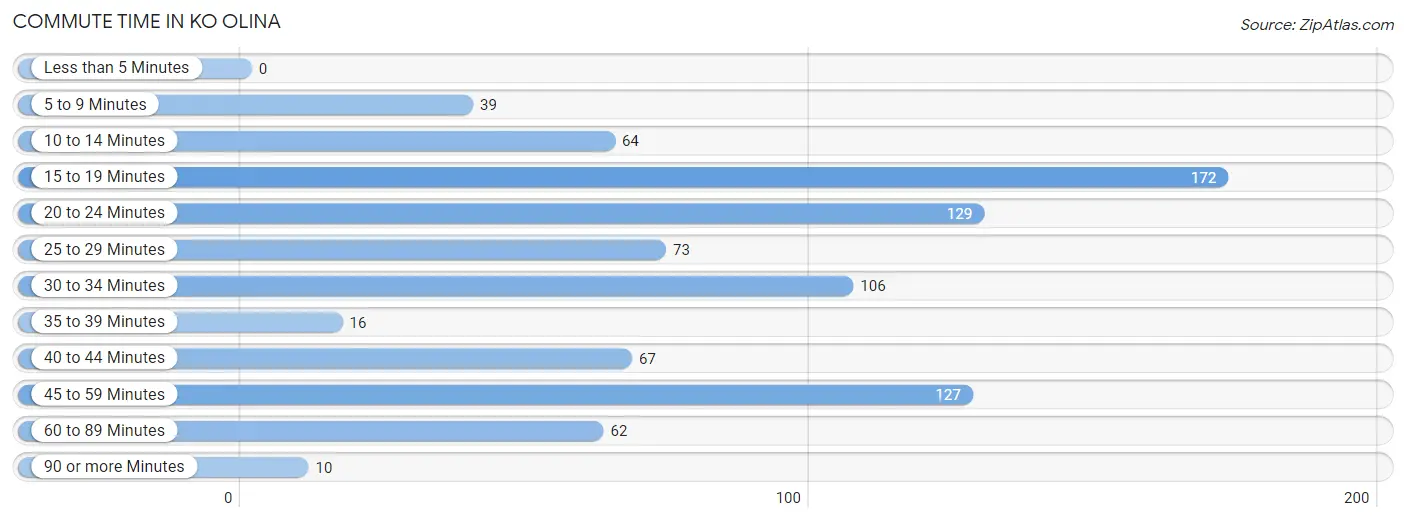
| Commute Time | # Commuters | % Commuters |
| Less than 5 Minutes | 0 | 0.0% |
| 5 to 9 Minutes | 39 | 4.5% |
| 10 to 14 Minutes | 64 | 7.4% |
| 15 to 19 Minutes | 172 | 19.9% |
| 20 to 24 Minutes | 129 | 14.9% |
| 25 to 29 Minutes | 73 | 8.4% |
| 30 to 34 Minutes | 106 | 12.2% |
| 35 to 39 Minutes | 16 | 1.8% |
| 40 to 44 Minutes | 67 | 7.7% |
| 45 to 59 Minutes | 127 | 14.7% |
| 60 to 89 Minutes | 62 | 7.2% |
| 90 or more Minutes | 10 | 1.2% |
Commute Time by Sex in Ko Olina
The most common commute times in Ko Olina are 15 to 19 minutes (143 commuters, 27.6%) for males and 20 to 24 minutes (113 commuters, 32.6%) for females.
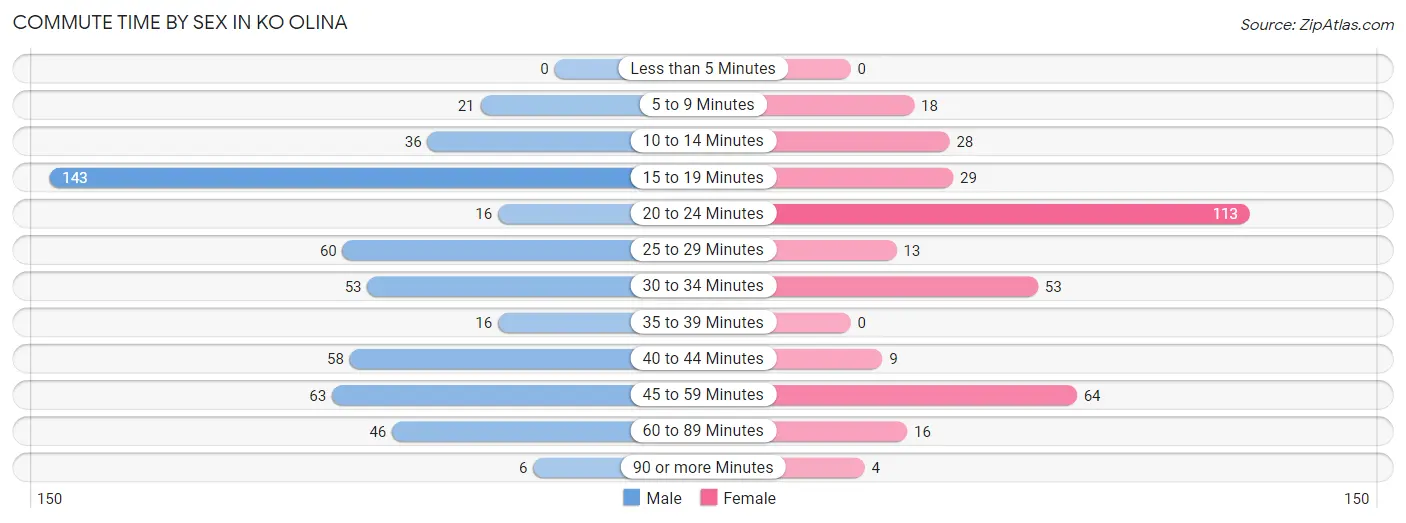
| Commute Time | Male | Female |
| Less than 5 Minutes | 0 (0.0%) | 0 (0.0%) |
| 5 to 9 Minutes | 21 (4.1%) | 18 (5.2%) |
| 10 to 14 Minutes | 36 (7.0%) | 28 (8.1%) |
| 15 to 19 Minutes | 143 (27.6%) | 29 (8.4%) |
| 20 to 24 Minutes | 16 (3.1%) | 113 (32.6%) |
| 25 to 29 Minutes | 60 (11.6%) | 13 (3.7%) |
| 30 to 34 Minutes | 53 (10.2%) | 53 (15.3%) |
| 35 to 39 Minutes | 16 (3.1%) | 0 (0.0%) |
| 40 to 44 Minutes | 58 (11.2%) | 9 (2.6%) |
| 45 to 59 Minutes | 63 (12.2%) | 64 (18.4%) |
| 60 to 89 Minutes | 46 (8.9%) | 16 (4.6%) |
| 90 or more Minutes | 6 (1.2%) | 4 (1.1%) |
Time of Departure to Work by Sex in Ko Olina
The most frequent times of departure to work in Ko Olina are 7:00 AM to 7:29 AM (105, 20.3%) for males and 7:00 AM to 7:29 AM (77, 22.2%) for females.
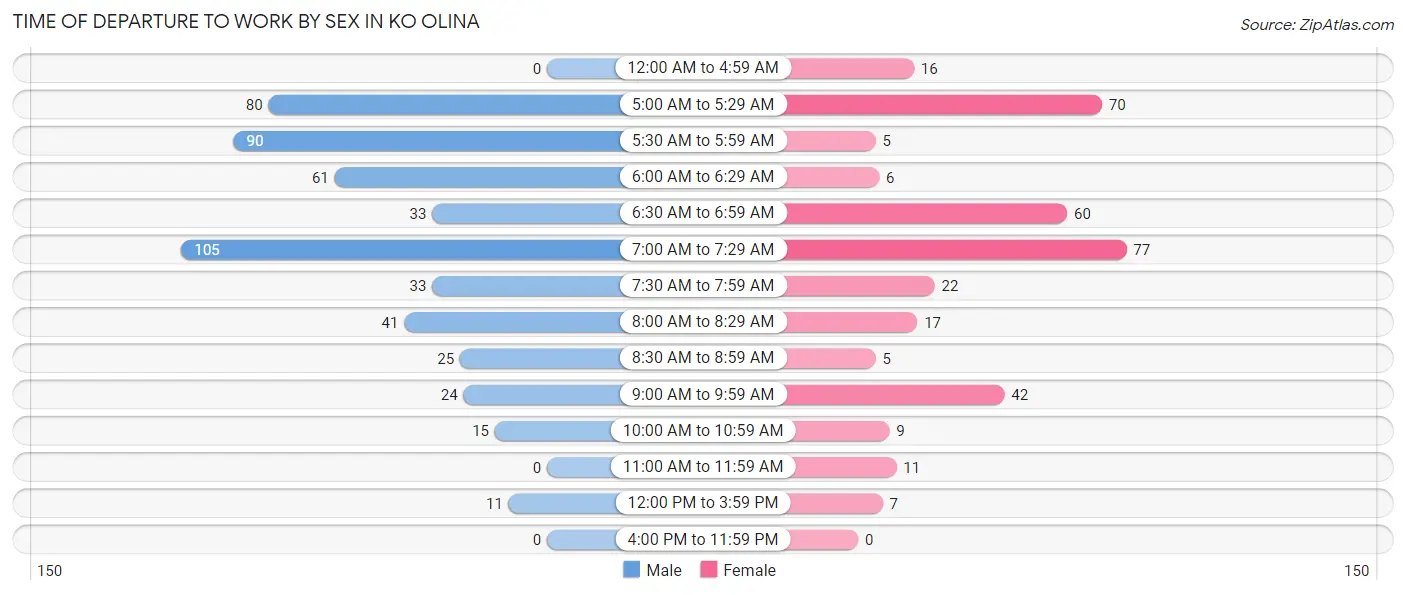
| Time of Departure | Male | Female |
| 12:00 AM to 4:59 AM | 0 (0.0%) | 16 (4.6%) |
| 5:00 AM to 5:29 AM | 80 (15.4%) | 70 (20.2%) |
| 5:30 AM to 5:59 AM | 90 (17.4%) | 5 (1.4%) |
| 6:00 AM to 6:29 AM | 61 (11.8%) | 6 (1.7%) |
| 6:30 AM to 6:59 AM | 33 (6.4%) | 60 (17.3%) |
| 7:00 AM to 7:29 AM | 105 (20.3%) | 77 (22.2%) |
| 7:30 AM to 7:59 AM | 33 (6.4%) | 22 (6.3%) |
| 8:00 AM to 8:29 AM | 41 (7.9%) | 17 (4.9%) |
| 8:30 AM to 8:59 AM | 25 (4.8%) | 5 (1.4%) |
| 9:00 AM to 9:59 AM | 24 (4.6%) | 42 (12.1%) |
| 10:00 AM to 10:59 AM | 15 (2.9%) | 9 (2.6%) |
| 11:00 AM to 11:59 AM | 0 (0.0%) | 11 (3.2%) |
| 12:00 PM to 3:59 PM | 11 (2.1%) | 7 (2.0%) |
| 4:00 PM to 11:59 PM | 0 (0.0%) | 0 (0.0%) |
| Total | 518 (100.0%) | 347 (100.0%) |
Housing Occupancy in Ko Olina
Occupancy by Ownership in Ko Olina
Of the total 854 dwellings in Ko Olina, owner-occupied units account for 549 (64.3%), while renter-occupied units make up 305 (35.7%).
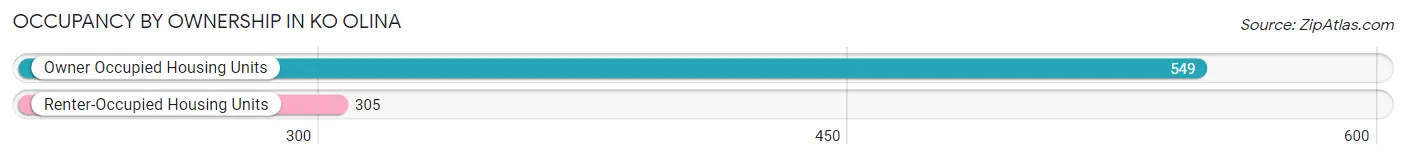
| Occupancy | # Housing Units | % Housing Units |
| Owner Occupied Housing Units | 549 | 64.3% |
| Renter-Occupied Housing Units | 305 | 35.7% |
| Total Occupied Housing Units | 854 | 100.0% |
Occupancy by Household Size in Ko Olina
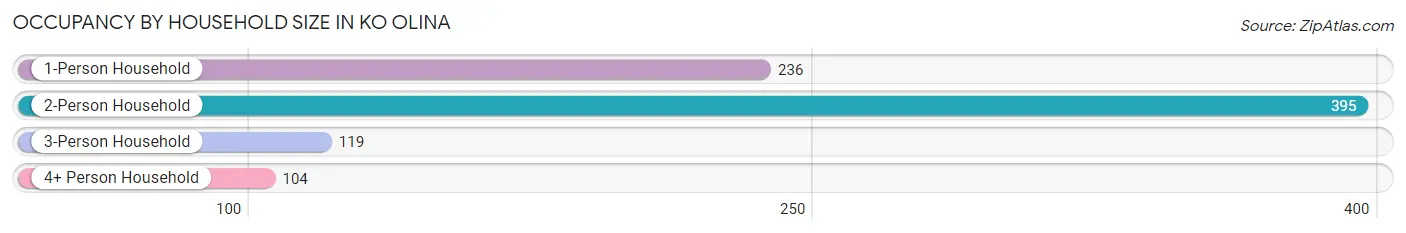
| Household Size | # Housing Units | % Housing Units |
| 1-Person Household | 236 | 27.6% |
| 2-Person Household | 395 | 46.3% |
| 3-Person Household | 119 | 13.9% |
| 4+ Person Household | 104 | 12.2% |
| Total Housing Units | 854 | 100.0% |
Occupancy by Ownership by Household Size in Ko Olina
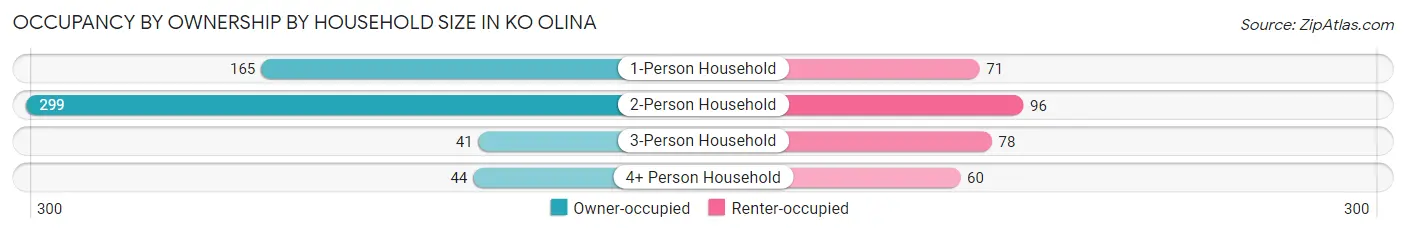
| Household Size | Owner-occupied | Renter-occupied |
| 1-Person Household | 165 (69.9%) | 71 (30.1%) |
| 2-Person Household | 299 (75.7%) | 96 (24.3%) |
| 3-Person Household | 41 (34.4%) | 78 (65.5%) |
| 4+ Person Household | 44 (42.3%) | 60 (57.7%) |
| Total Housing Units | 549 (64.3%) | 305 (35.7%) |
Occupancy by Educational Attainment in Ko Olina
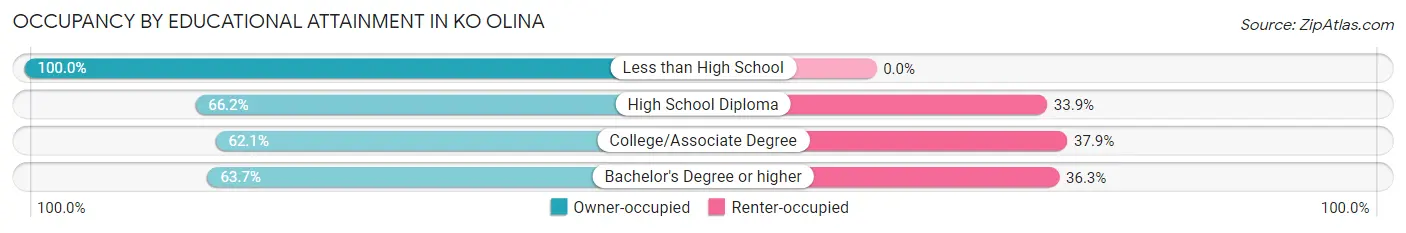
| Household Size | Owner-occupied | Renter-occupied |
| Less than High School | 21 (100.0%) | 0 (0.0%) |
| High School Diploma | 43 (66.1%) | 22 (33.9%) |
| College/Associate Degree | 174 (62.1%) | 106 (37.9%) |
| Bachelor's Degree or higher | 311 (63.7%) | 177 (36.3%) |
Occupancy by Age of Householder in Ko Olina
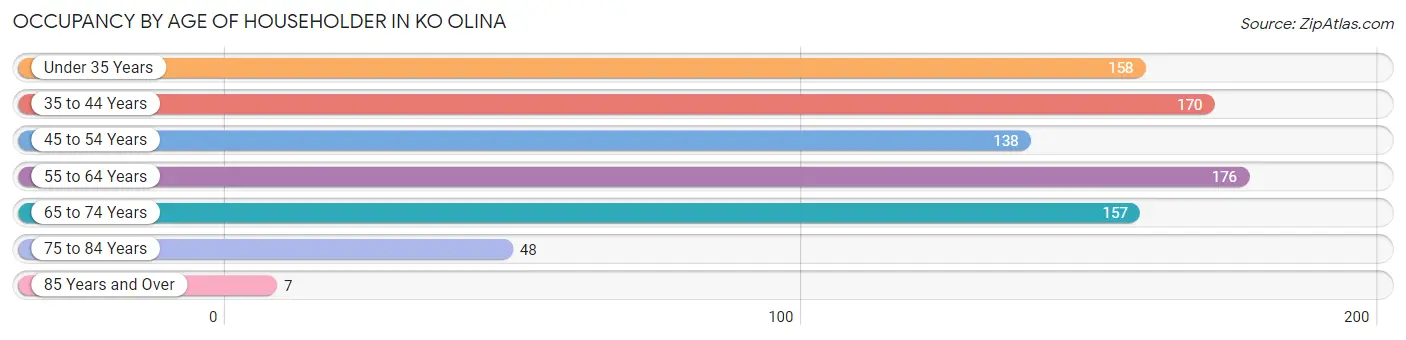
| Age Bracket | # Households | % Households |
| Under 35 Years | 158 | 18.5% |
| 35 to 44 Years | 170 | 19.9% |
| 45 to 54 Years | 138 | 16.2% |
| 55 to 64 Years | 176 | 20.6% |
| 65 to 74 Years | 157 | 18.4% |
| 75 to 84 Years | 48 | 5.6% |
| 85 Years and Over | 7 | 0.8% |
| Total | 854 | 100.0% |
Housing Finances in Ko Olina
Median Income by Occupancy in Ko Olina
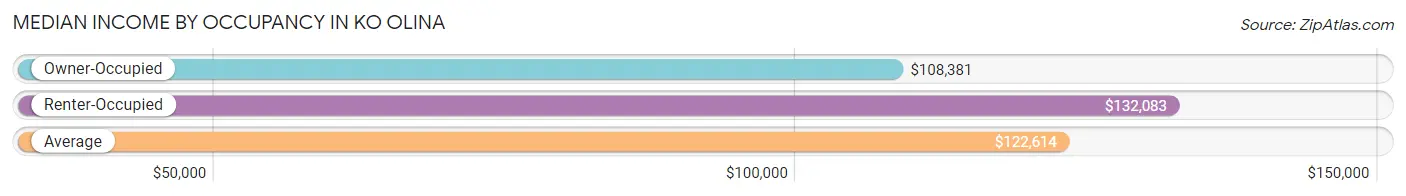
| Occupancy Type | # Households | Median Income |
| Owner-Occupied | 549 (64.3%) | $108,381 |
| Renter-Occupied | 305 (35.7%) | $132,083 |
| Average | 854 (100.0%) | $122,614 |
Occupancy by Householder Income Bracket in Ko Olina
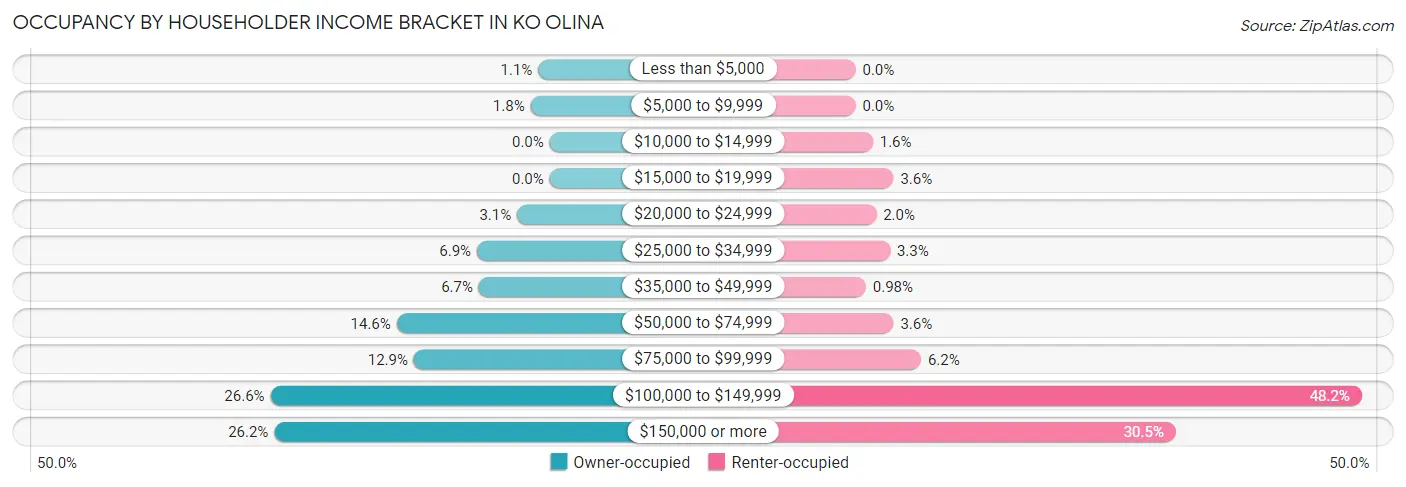
| Income Bracket | Owner-occupied | Renter-occupied |
| Less than $5,000 | 6 (1.1%) | 0 (0.0%) |
| $5,000 to $9,999 | 10 (1.8%) | 0 (0.0%) |
| $10,000 to $14,999 | 0 (0.0%) | 5 (1.6%) |
| $15,000 to $19,999 | 0 (0.0%) | 11 (3.6%) |
| $20,000 to $24,999 | 17 (3.1%) | 6 (2.0%) |
| $25,000 to $34,999 | 38 (6.9%) | 10 (3.3%) |
| $35,000 to $49,999 | 37 (6.7%) | 3 (1.0%) |
| $50,000 to $74,999 | 80 (14.6%) | 11 (3.6%) |
| $75,000 to $99,999 | 71 (12.9%) | 19 (6.2%) |
| $100,000 to $149,999 | 146 (26.6%) | 147 (48.2%) |
| $150,000 or more | 144 (26.2%) | 93 (30.5%) |
| Total | 549 (100.0%) | 305 (100.0%) |
Monthly Housing Cost Tiers in Ko Olina
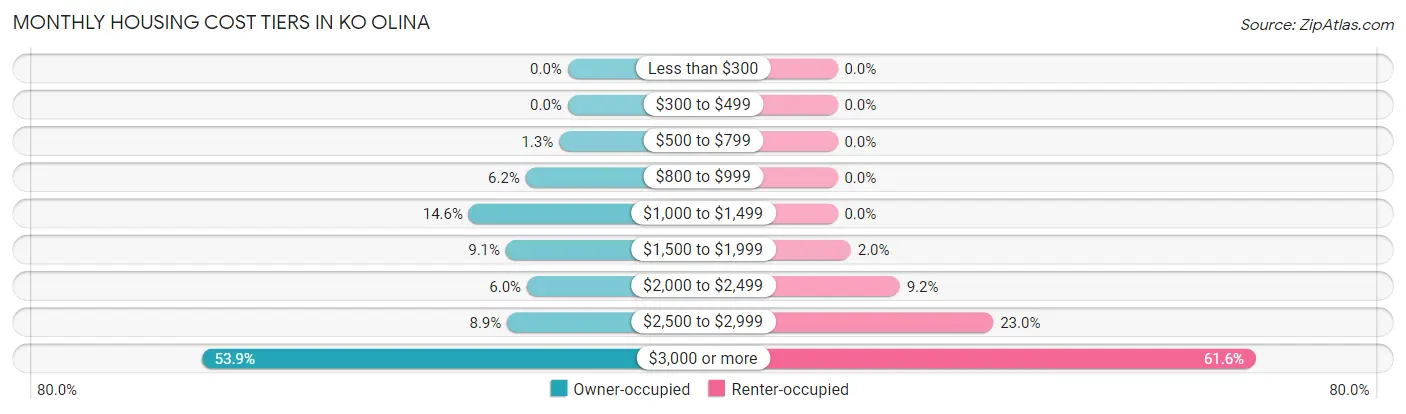
| Monthly Cost | Owner-occupied | Renter-occupied |
| Less than $300 | 0 (0.0%) | 0 (0.0%) |
| $300 to $499 | 0 (0.0%) | 0 (0.0%) |
| $500 to $799 | 7 (1.3%) | 0 (0.0%) |
| $800 to $999 | 34 (6.2%) | 0 (0.0%) |
| $1,000 to $1,499 | 80 (14.6%) | 0 (0.0%) |
| $1,500 to $1,999 | 50 (9.1%) | 6 (2.0%) |
| $2,000 to $2,499 | 33 (6.0%) | 28 (9.2%) |
| $2,500 to $2,999 | 49 (8.9%) | 70 (23.0%) |
| $3,000 or more | 296 (53.9%) | 188 (61.6%) |
| Total | 549 (100.0%) | 305 (100.0%) |
Physical Housing Characteristics in Ko Olina
Housing Structures in Ko Olina
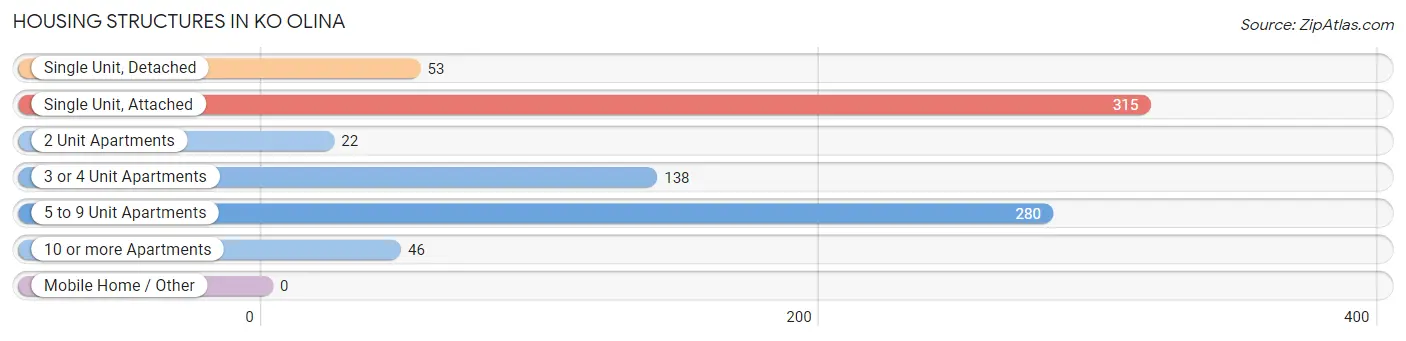
| Structure Type | # Housing Units | % Housing Units |
| Single Unit, Detached | 53 | 6.2% |
| Single Unit, Attached | 315 | 36.9% |
| 2 Unit Apartments | 22 | 2.6% |
| 3 or 4 Unit Apartments | 138 | 16.2% |
| 5 to 9 Unit Apartments | 280 | 32.8% |
| 10 or more Apartments | 46 | 5.4% |
| Mobile Home / Other | 0 | 0.0% |
| Total | 854 | 100.0% |
Housing Structures by Occupancy in Ko Olina
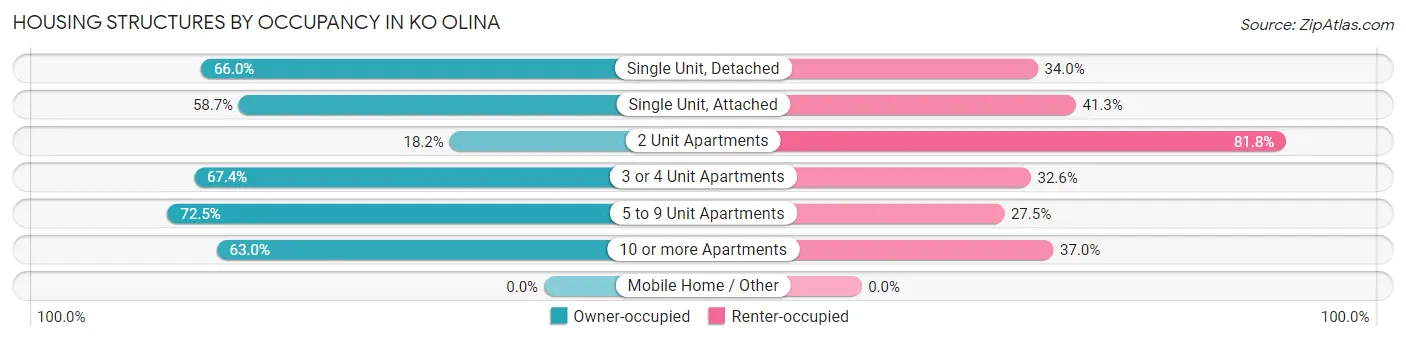
| Structure Type | Owner-occupied | Renter-occupied |
| Single Unit, Detached | 35 (66.0%) | 18 (34.0%) |
| Single Unit, Attached | 185 (58.7%) | 130 (41.3%) |
| 2 Unit Apartments | 4 (18.2%) | 18 (81.8%) |
| 3 or 4 Unit Apartments | 93 (67.4%) | 45 (32.6%) |
| 5 to 9 Unit Apartments | 203 (72.5%) | 77 (27.5%) |
| 10 or more Apartments | 29 (63.0%) | 17 (37.0%) |
| Mobile Home / Other | 0 (0.0%) | 0 (0.0%) |
| Total | 549 (64.3%) | 305 (35.7%) |
Housing Structures by Number of Rooms in Ko Olina
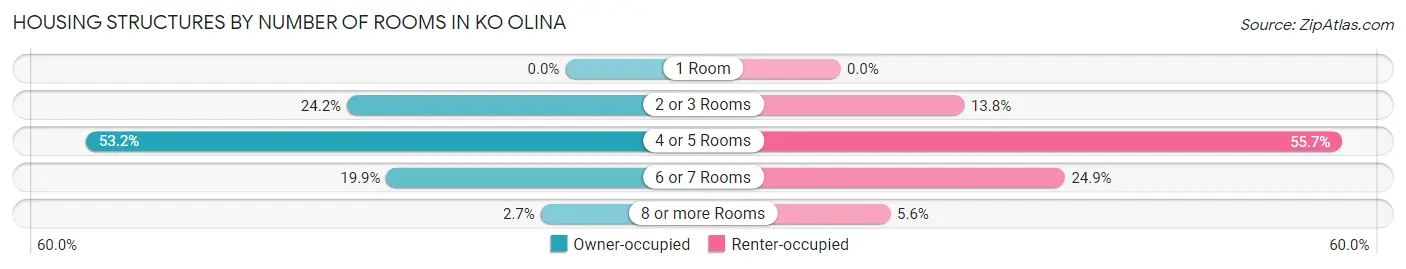
| Number of Rooms | Owner-occupied | Renter-occupied |
| 1 Room | 0 (0.0%) | 0 (0.0%) |
| 2 or 3 Rooms | 133 (24.2%) | 42 (13.8%) |
| 4 or 5 Rooms | 292 (53.2%) | 170 (55.7%) |
| 6 or 7 Rooms | 109 (19.9%) | 76 (24.9%) |
| 8 or more Rooms | 15 (2.7%) | 17 (5.6%) |
| Total | 549 (100.0%) | 305 (100.0%) |
Housing Structure by Heating Type in Ko Olina
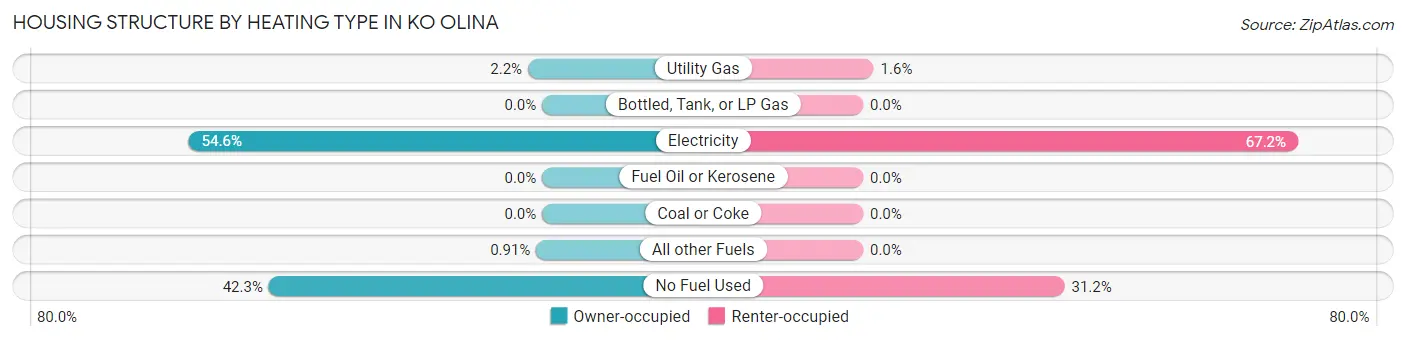
| Heating Type | Owner-occupied | Renter-occupied |
| Utility Gas | 12 (2.2%) | 5 (1.6%) |
| Bottled, Tank, or LP Gas | 0 (0.0%) | 0 (0.0%) |
| Electricity | 300 (54.6%) | 205 (67.2%) |
| Fuel Oil or Kerosene | 0 (0.0%) | 0 (0.0%) |
| Coal or Coke | 0 (0.0%) | 0 (0.0%) |
| All other Fuels | 5 (0.9%) | 0 (0.0%) |
| No Fuel Used | 232 (42.3%) | 95 (31.1%) |
| Total | 549 (100.0%) | 305 (100.0%) |
Household Vehicle Usage in Ko Olina
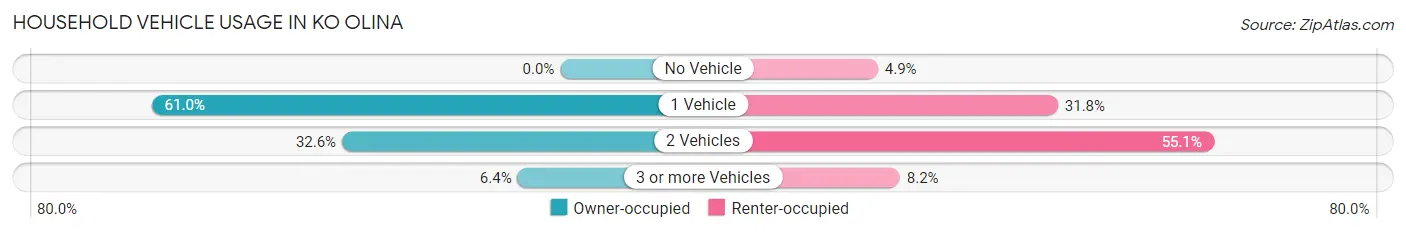
| Vehicles per Household | Owner-occupied | Renter-occupied |
| No Vehicle | 0 (0.0%) | 15 (4.9%) |
| 1 Vehicle | 335 (61.0%) | 97 (31.8%) |
| 2 Vehicles | 179 (32.6%) | 168 (55.1%) |
| 3 or more Vehicles | 35 (6.4%) | 25 (8.2%) |
| Total | 549 (100.0%) | 305 (100.0%) |
Real Estate & Mortgages in Ko Olina
Real Estate and Mortgage Overview in Ko Olina
| Characteristic | Without Mortgage | With Mortgage |
| Housing Units | 160 | 389 |
| Median Property Value | $912,300 | $722,300 |
| Median Household Income | $61,250 | $111 |
| Monthly Housing Costs | $1,150 | $296 |
| Real Estate Taxes | $2,306 | $0 |
Property Value by Mortgage Status in Ko Olina
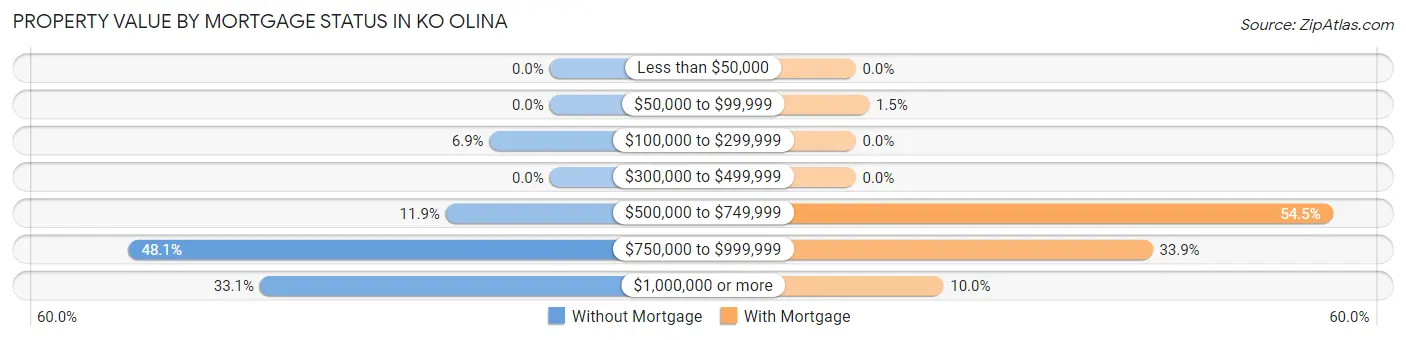
| Property Value | Without Mortgage | With Mortgage |
| Less than $50,000 | 0 (0.0%) | 0 (0.0%) |
| $50,000 to $99,999 | 0 (0.0%) | 6 (1.5%) |
| $100,000 to $299,999 | 11 (6.9%) | 0 (0.0%) |
| $300,000 to $499,999 | 0 (0.0%) | 0 (0.0%) |
| $500,000 to $749,999 | 19 (11.9%) | 212 (54.5%) |
| $750,000 to $999,999 | 77 (48.1%) | 132 (33.9%) |
| $1,000,000 or more | 53 (33.1%) | 39 (10.0%) |
| Total | 160 (100.0%) | 389 (100.0%) |
Household Income by Mortgage Status in Ko Olina
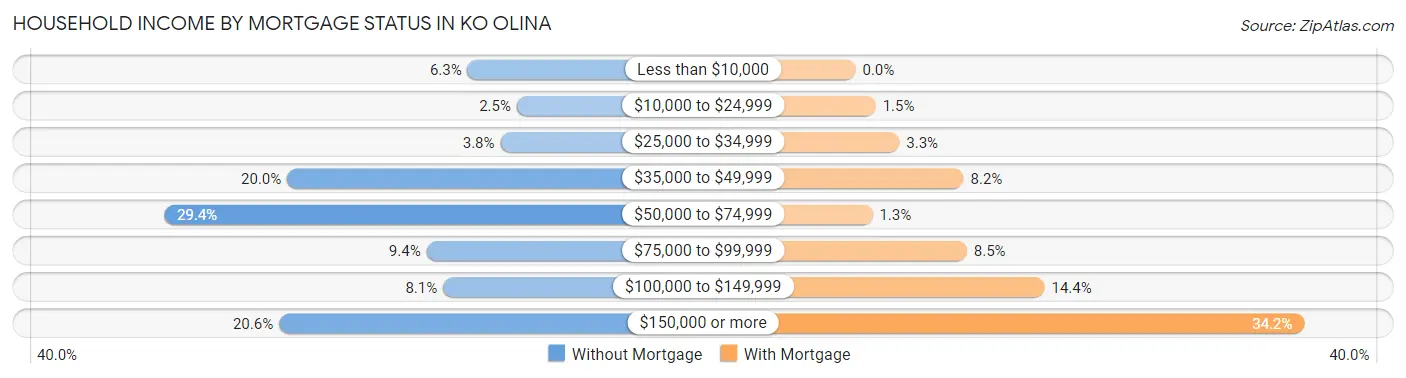
| Household Income | Without Mortgage | With Mortgage |
| Less than $10,000 | 10 (6.2%) | 0 (0.0%) |
| $10,000 to $24,999 | 4 (2.5%) | 6 (1.5%) |
| $25,000 to $34,999 | 6 (3.7%) | 13 (3.3%) |
| $35,000 to $49,999 | 32 (20.0%) | 32 (8.2%) |
| $50,000 to $74,999 | 47 (29.4%) | 5 (1.3%) |
| $75,000 to $99,999 | 15 (9.4%) | 33 (8.5%) |
| $100,000 to $149,999 | 13 (8.1%) | 56 (14.4%) |
| $150,000 or more | 33 (20.6%) | 133 (34.2%) |
| Total | 160 (100.0%) | 389 (100.0%) |
Property Value to Household Income Ratio in Ko Olina
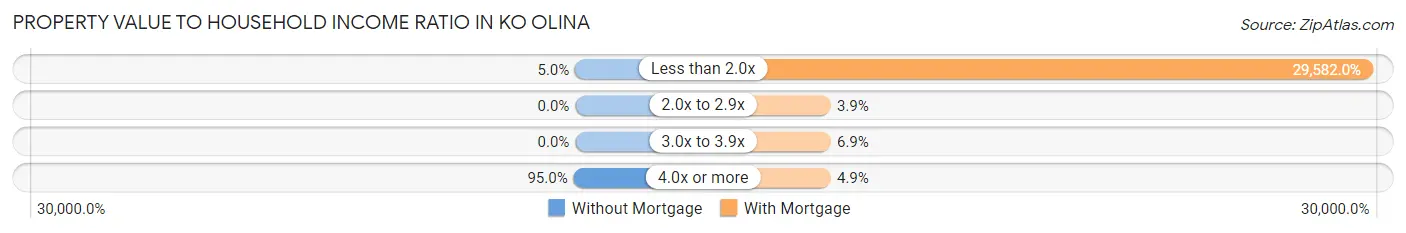
| Value-to-Income Ratio | Without Mortgage | With Mortgage |
| Less than 2.0x | 8 (5.0%) | 115,074 (29,582.0%) |
| 2.0x to 2.9x | 0 (0.0%) | 15 (3.9%) |
| 3.0x to 3.9x | 0 (0.0%) | 27 (6.9%) |
| 4.0x or more | 152 (95.0%) | 19 (4.9%) |
| Total | 160 (100.0%) | 389 (100.0%) |
Real Estate Taxes by Mortgage Status in Ko Olina
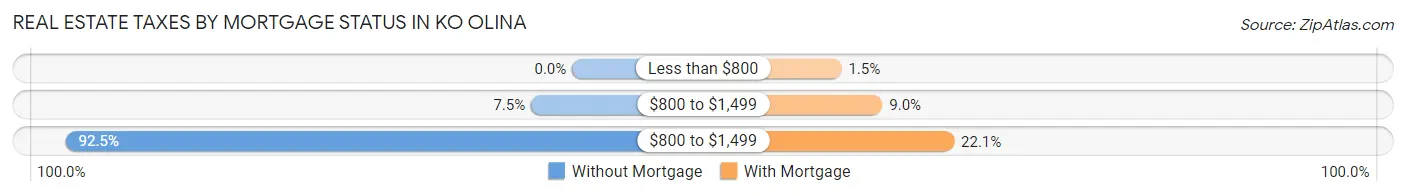
| Property Taxes | Without Mortgage | With Mortgage |
| Less than $800 | 0 (0.0%) | 6 (1.5%) |
| $800 to $1,499 | 12 (7.5%) | 35 (9.0%) |
| $800 to $1,499 | 148 (92.5%) | 86 (22.1%) |
| Total | 160 (100.0%) | 389 (100.0%) |
Health & Disability in Ko Olina
Health Insurance Coverage by Age in Ko Olina
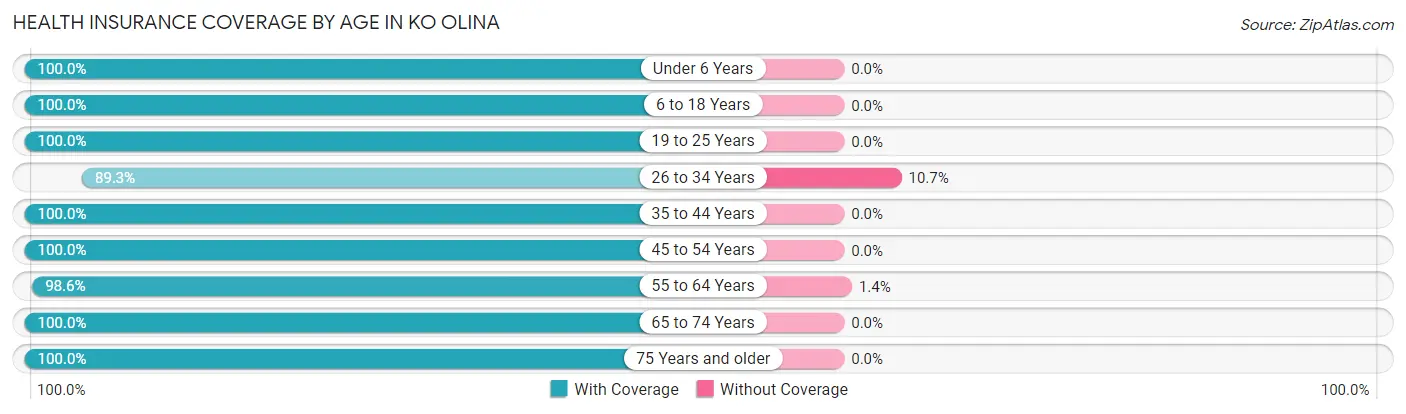
| Age Bracket | With Coverage | Without Coverage |
| Under 6 Years | 110 (100.0%) | 0 (0.0%) |
| 6 to 18 Years | 174 (100.0%) | 0 (0.0%) |
| 19 to 25 Years | 77 (100.0%) | 0 (0.0%) |
| 26 to 34 Years | 209 (89.3%) | 25 (10.7%) |
| 35 to 44 Years | 210 (100.0%) | 0 (0.0%) |
| 45 to 54 Years | 212 (100.0%) | 0 (0.0%) |
| 55 to 64 Years | 276 (98.6%) | 4 (1.4%) |
| 65 to 74 Years | 226 (100.0%) | 0 (0.0%) |
| 75 Years and older | 163 (100.0%) | 0 (0.0%) |
| Total | 1,657 (98.3%) | 29 (1.7%) |
Health Insurance Coverage by Citizenship Status in Ko Olina
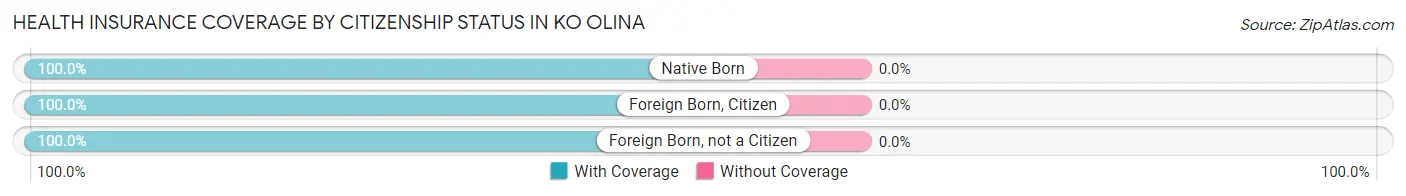
| Citizenship Status | With Coverage | Without Coverage |
| Native Born | 110 (100.0%) | 0 (0.0%) |
| Foreign Born, Citizen | 174 (100.0%) | 0 (0.0%) |
| Foreign Born, not a Citizen | 77 (100.0%) | 0 (0.0%) |
Health Insurance Coverage by Household Income in Ko Olina
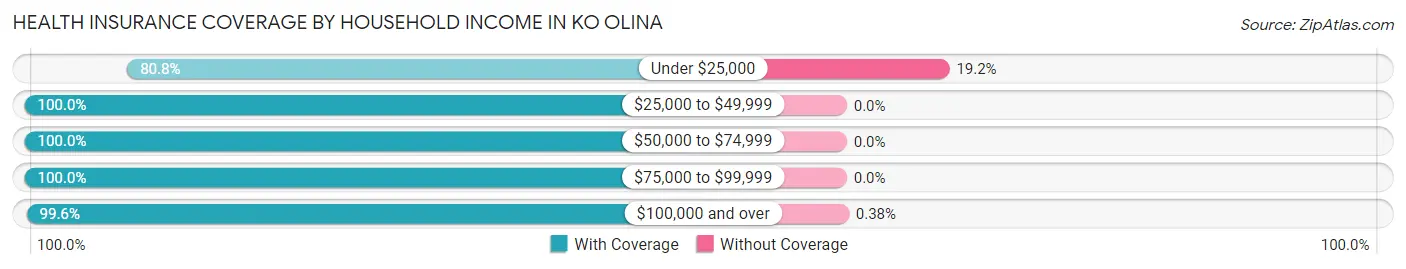
| Household Income | With Coverage | Without Coverage |
| Under $25,000 | 105 (80.8%) | 25 (19.2%) |
| $25,000 to $49,999 | 163 (100.0%) | 0 (0.0%) |
| $50,000 to $74,999 | 156 (100.0%) | 0 (0.0%) |
| $75,000 to $99,999 | 178 (100.0%) | 0 (0.0%) |
| $100,000 and over | 1,055 (99.6%) | 4 (0.4%) |
Public vs Private Health Insurance Coverage by Age in Ko Olina
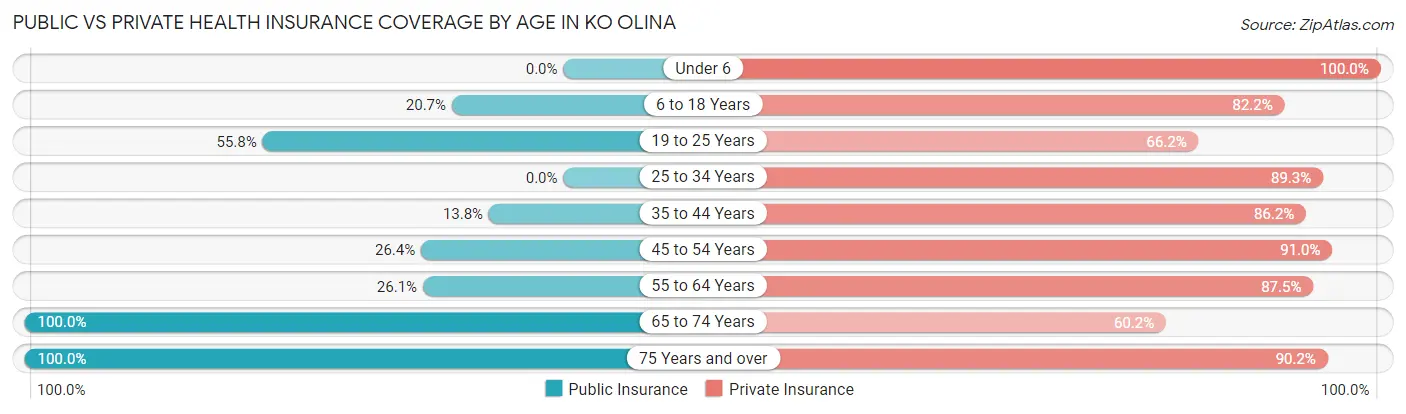
| Age Bracket | Public Insurance | Private Insurance |
| Under 6 | 0 (0.0%) | 110 (100.0%) |
| 6 to 18 Years | 36 (20.7%) | 143 (82.2%) |
| 19 to 25 Years | 43 (55.8%) | 51 (66.2%) |
| 25 to 34 Years | 0 (0.0%) | 209 (89.3%) |
| 35 to 44 Years | 29 (13.8%) | 181 (86.2%) |
| 45 to 54 Years | 56 (26.4%) | 193 (91.0%) |
| 55 to 64 Years | 73 (26.1%) | 245 (87.5%) |
| 65 to 74 Years | 226 (100.0%) | 136 (60.2%) |
| 75 Years and over | 163 (100.0%) | 147 (90.2%) |
| Total | 626 (37.1%) | 1,415 (83.9%) |
Disability Status by Sex by Age in Ko Olina
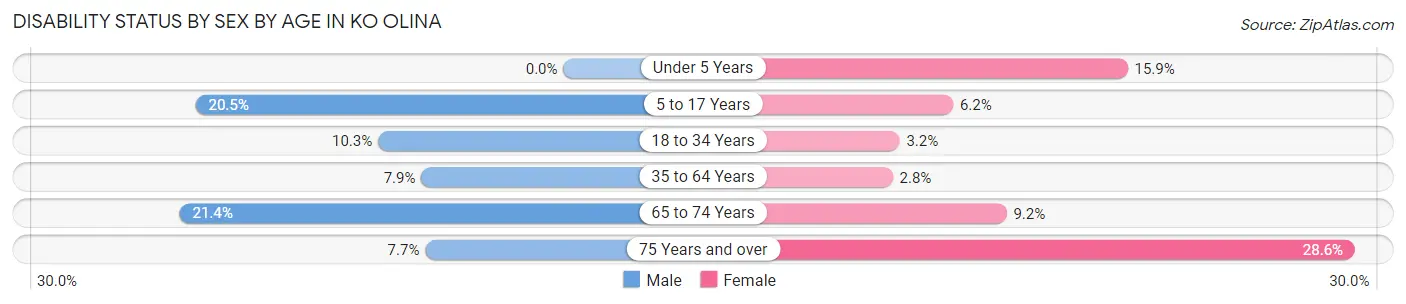
| Age Bracket | Male | Female |
| Under 5 Years | 0 (0.0%) | 7 (15.9%) |
| 5 to 17 Years | 17 (20.5%) | 6 (6.2%) |
| 18 to 34 Years | 16 (10.3%) | 5 (3.2%) |
| 35 to 64 Years | 22 (7.9%) | 12 (2.8%) |
| 65 to 74 Years | 25 (21.4%) | 10 (9.2%) |
| 75 Years and over | 5 (7.7%) | 28 (28.6%) |
Disability Class by Sex by Age in Ko Olina
Disability Class: Hearing Difficulty
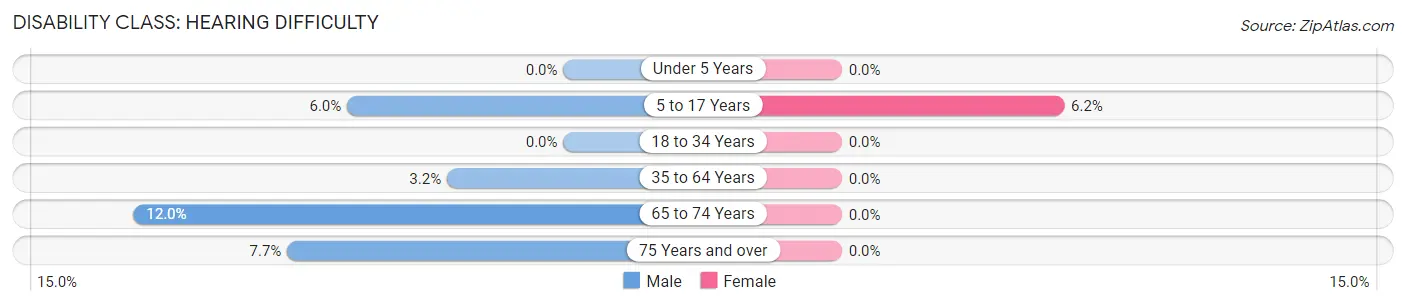
| Age Bracket | Male | Female |
| Under 5 Years | 0 (0.0%) | 0 (0.0%) |
| 5 to 17 Years | 5 (6.0%) | 6 (6.2%) |
| 18 to 34 Years | 0 (0.0%) | 0 (0.0%) |
| 35 to 64 Years | 9 (3.2%) | 0 (0.0%) |
| 65 to 74 Years | 14 (12.0%) | 0 (0.0%) |
| 75 Years and over | 5 (7.7%) | 0 (0.0%) |
Disability Class: Vision Difficulty
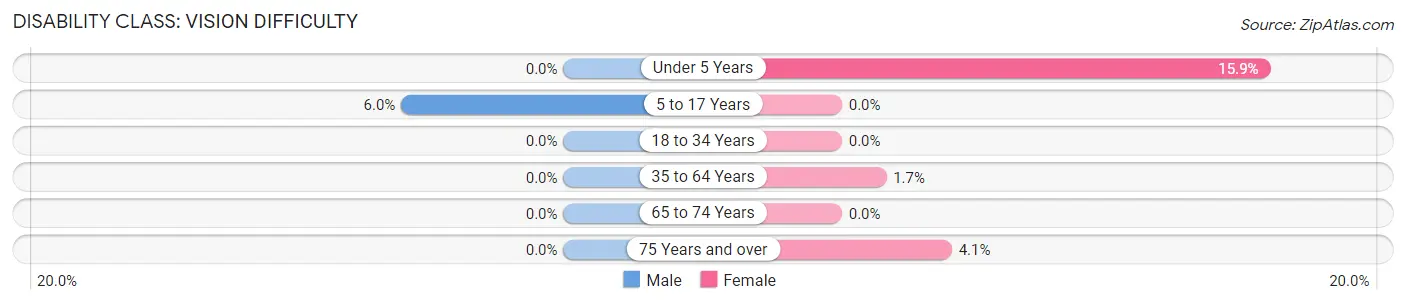
| Age Bracket | Male | Female |
| Under 5 Years | 0 (0.0%) | 7 (15.9%) |
| 5 to 17 Years | 5 (6.0%) | 0 (0.0%) |
| 18 to 34 Years | 0 (0.0%) | 0 (0.0%) |
| 35 to 64 Years | 0 (0.0%) | 7 (1.7%) |
| 65 to 74 Years | 0 (0.0%) | 0 (0.0%) |
| 75 Years and over | 0 (0.0%) | 4 (4.1%) |
Disability Class: Cognitive Difficulty
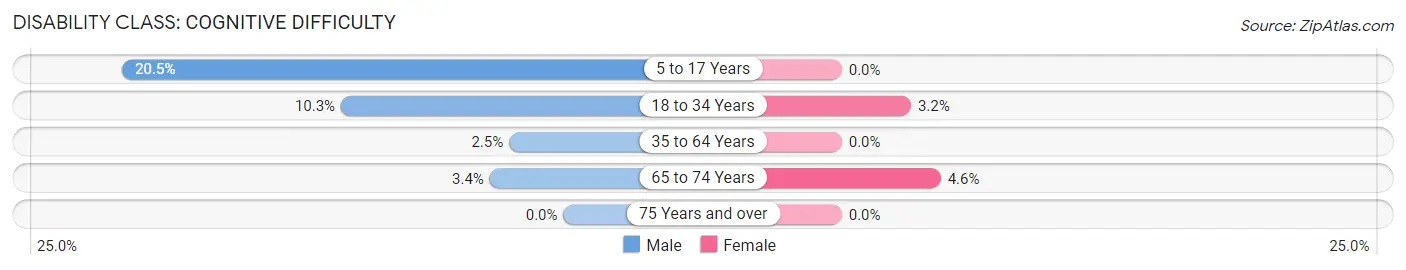
| Age Bracket | Male | Female |
| 5 to 17 Years | 17 (20.5%) | 0 (0.0%) |
| 18 to 34 Years | 16 (10.3%) | 5 (3.2%) |
| 35 to 64 Years | 7 (2.5%) | 0 (0.0%) |
| 65 to 74 Years | 4 (3.4%) | 5 (4.6%) |
| 75 Years and over | 0 (0.0%) | 0 (0.0%) |
Disability Class: Ambulatory Difficulty
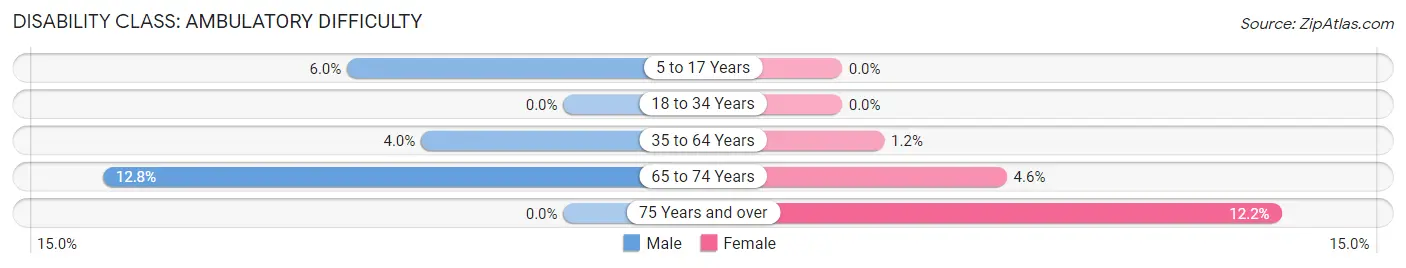
| Age Bracket | Male | Female |
| 5 to 17 Years | 5 (6.0%) | 0 (0.0%) |
| 18 to 34 Years | 0 (0.0%) | 0 (0.0%) |
| 35 to 64 Years | 11 (4.0%) | 5 (1.2%) |
| 65 to 74 Years | 15 (12.8%) | 5 (4.6%) |
| 75 Years and over | 0 (0.0%) | 12 (12.2%) |
Disability Class: Self-Care Difficulty
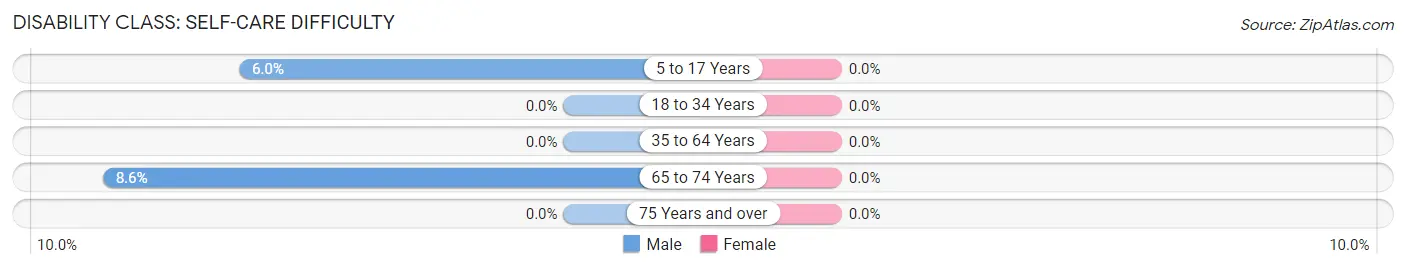
| Age Bracket | Male | Female |
| 5 to 17 Years | 5 (6.0%) | 0 (0.0%) |
| 18 to 34 Years | 0 (0.0%) | 0 (0.0%) |
| 35 to 64 Years | 0 (0.0%) | 0 (0.0%) |
| 65 to 74 Years | 10 (8.6%) | 0 (0.0%) |
| 75 Years and over | 0 (0.0%) | 0 (0.0%) |
Technology Access in Ko Olina
Computing Device Access in Ko Olina
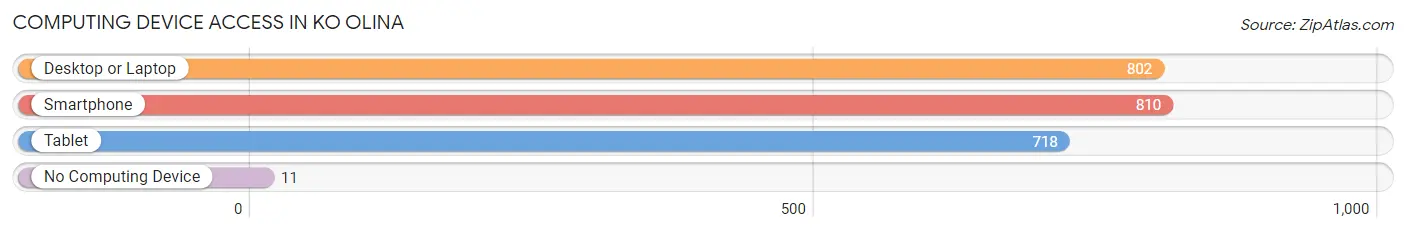
| Device Type | # Households | % Households |
| Desktop or Laptop | 802 | 93.9% |
| Smartphone | 810 | 94.9% |
| Tablet | 718 | 84.1% |
| No Computing Device | 11 | 1.3% |
| Total | 854 | 100.0% |
Internet Access in Ko Olina
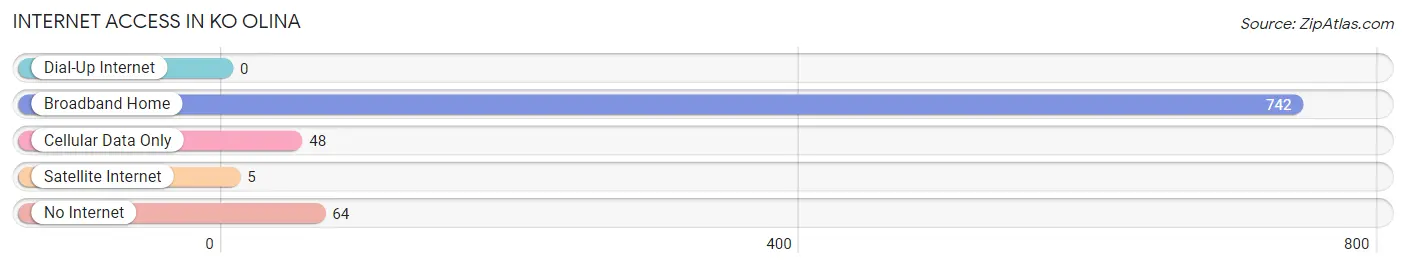
| Internet Type | # Households | % Households |
| Dial-Up Internet | 0 | 0.0% |
| Broadband Home | 742 | 86.9% |
| Cellular Data Only | 48 | 5.6% |
| Satellite Internet | 5 | 0.6% |
| No Internet | 64 | 7.5% |
| Total | 854 | 100.0% |
Ko Olina Summary
Olina, Hawaii is a small, unincorporated community located on the western side of the island of Oahu. It is situated on the Ko Olina Resort and Marina, a resort and marina complex that is owned and operated by the Ko Olina Resort and Marina Corporation. The resort and marina complex is located on the western side of the island, approximately 17 miles from Honolulu.
Geographically, Ko Olina is located on the western side of Oahu, approximately 17 miles from Honolulu. It is situated on the Ko Olina Resort and Marina, a resort and marina complex that is owned and operated by the Ko Olina Resort and Marina Corporation. The resort and marina complex is located on the western side of the island, approximately 17 miles from Honolulu. The area is surrounded by the Pacific Ocean and is home to a variety of beaches, lagoons, and other attractions.
The economy of Ko Olina is largely based on tourism. The resort and marina complex is home to a variety of hotels, restaurants, and other attractions that draw visitors from around the world. Additionally, the area is home to a variety of businesses that cater to the needs of the local population. These businesses include retail stores, restaurants, and other services.
The population of Ko Olina is estimated to be around 2,000 people. The majority of the population is of Hawaiian descent, with a small percentage of other ethnicities. The median age of the population is approximately 40 years old. The median household income is estimated to be around $50,000.
Ko Olina is a popular destination for tourists and locals alike. The area is home to a variety of attractions, including the Ko Olina Resort and Marina, the Ko Olina Golf Club, and the Ko Olina Lagoons. Additionally, the area is home to a variety of restaurants, retail stores, and other services.
Ko Olina is a unique and beautiful area of Hawaii. It is home to a variety of attractions, businesses, and services that make it a popular destination for tourists and locals alike. The area is also home to a variety of beaches, lagoons, and other attractions that make it a great place to visit.
Common Questions
What is Per Capita Income in Ko Olina?
Per Capita income in Ko Olina is $66,791.
What is the Median Family Income in Ko Olina?
Median Family Income in Ko Olina is $116,538.
What is the Median Household income in Ko Olina?
Median Household Income in Ko Olina is $122,614.
What is Income or Wage Gap in Ko Olina?
Income or Wage Gap in Ko Olina is 28.3%.
Women in Ko Olina earn 71.7 cents for every dollar earned by a man.
What is Family Income Deficit in Ko Olina?
Family Income Deficit in Ko Olina is $15,778.
Families that are below poverty line in Ko Olina earn $15,778 less on average than the poverty threshold level.
What is Inequality or Gini Index in Ko Olina?
Inequality or Gini Index in Ko Olina is 0.43.
What is the Total Population of Ko Olina?
Total Population of Ko Olina is 1,871.
What is the Total Male Population of Ko Olina?
Total Male Population of Ko Olina is 914.
What is the Total Female Population of Ko Olina?
Total Female Population of Ko Olina is 957.
What is the Ratio of Males per 100 Females in Ko Olina?
There are 95.51 Males per 100 Females in Ko Olina.
What is the Ratio of Females per 100 Males in Ko Olina?
There are 104.70 Females per 100 Males in Ko Olina.
What is the Median Population Age in Ko Olina?
Median Population Age in Ko Olina is 42.3 Years.
What is the Average Family Size in Ko Olina
Average Family Size in Ko Olina is 2.6 People.
What is the Average Household Size in Ko Olina
Average Household Size in Ko Olina is 2.2 People.
How Large is the Labor Force in Ko Olina?
There are 961 People in the Labor Forcein in Ko Olina.
What is the Percentage of People in the Labor Force in Ko Olina?
59.6% of People are in the Labor Force in Ko Olina.
What is the Unemployment Rate in Ko Olina?
Unemployment Rate in Ko Olina is 3.0%.