Eleele, HI Map & Demographics
Eleele Map
Eleele Overview
$34,271
PER CAPITA INCOME
$117,321
AVG FAMILY INCOME
$107,734
AVG HOUSEHOLD INCOME
23.7%
WAGE / INCOME GAP [ % ]
76.3¢/ $1
WAGE / INCOME GAP [ $ ]
0.35
INEQUALITY / GINI INDEX
2,255
TOTAL POPULATION
1,196
MALE POPULATION
1,059
FEMALE POPULATION
112.94
MALES / 100 FEMALES
88.55
FEMALES / 100 MALES
36.5
MEDIAN AGE
4.1
AVG FAMILY SIZE
3.5
AVG HOUSEHOLD SIZE
1,199
LABOR FORCE [ PEOPLE ]
70.8%
PERCENT IN LABOR FORCE
2.0%
UNEMPLOYMENT RATE
Eleele Zip Codes
Eleele Area Codes
Income in Eleele
Income Overview in Eleele
Per Capita Income in Eleele is $34,271, while median incomes of families and households are $117,321 and $107,734 respectively.
| Characteristic | Number | Measure |
| Per Capita Income | 2,255 | $34,271 |
| Median Family Income | 469 | $117,321 |
| Mean Family Income | 469 | $121,129 |
| Median Household Income | 641 | $107,734 |
| Mean Household Income | 641 | $111,524 |
| Income Deficit | 469 | $0 |
| Wage / Income Gap (%) | 2,255 | 23.74% |
| Wage / Income Gap ($) | 2,255 | 76.26¢ per $1 |
| Gini / Inequality Index | 2,255 | 0.35 |
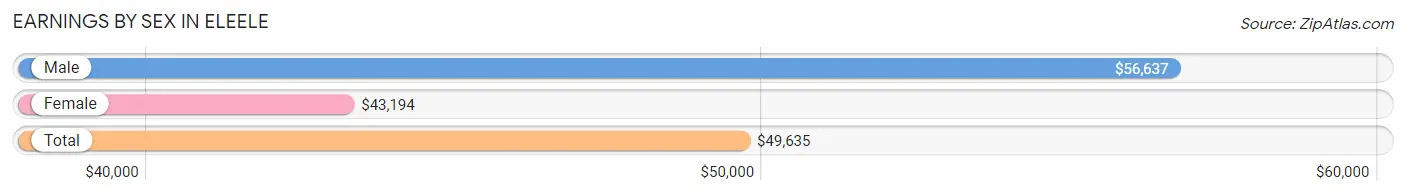
Earnings by Sex in Eleele
Average Earnings in Eleele are $49,635, $56,637 for men and $43,194 for women, a difference of 23.7%.
| Sex | Number | Average Earnings |
| Male | 616 (50.8%) | $56,637 |
| Female | 596 (49.2%) | $43,194 |
| Total | 1,212 (100.0%) | $49,635 |
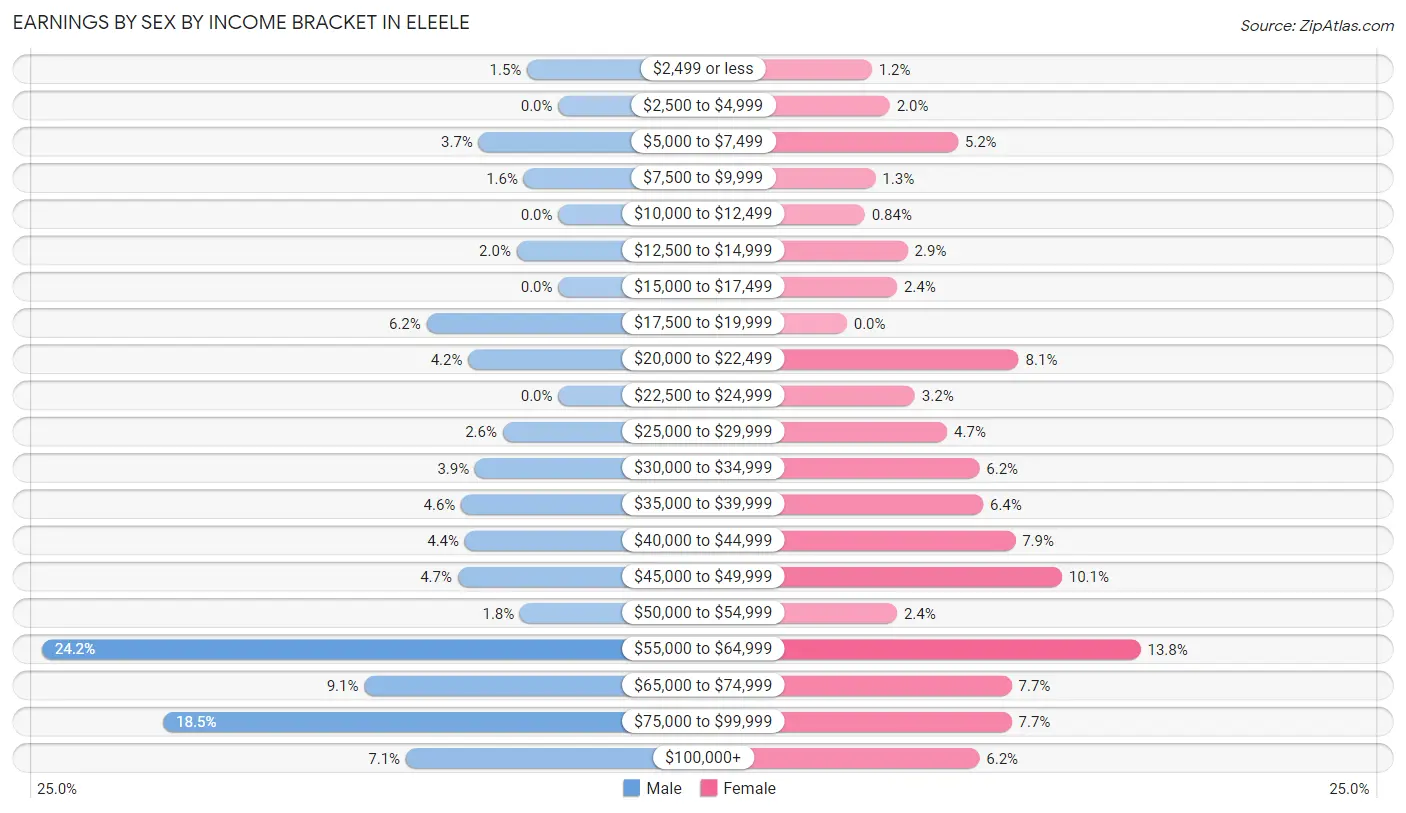
Earnings by Sex by Income Bracket in Eleele
The most common earnings brackets in Eleele are $55,000 to $64,999 for men (149 | 24.2%) and $55,000 to $64,999 for women (82 | 13.8%).
| Income | Male | Female |
| $2,499 or less | 9 (1.5%) | 7 (1.2%) |
| $2,500 to $4,999 | 0 (0.0%) | 12 (2.0%) |
| $5,000 to $7,499 | 23 (3.7%) | 31 (5.2%) |
| $7,500 to $9,999 | 10 (1.6%) | 8 (1.3%) |
| $10,000 to $12,499 | 0 (0.0%) | 5 (0.8%) |
| $12,500 to $14,999 | 12 (1.9%) | 17 (2.9%) |
| $15,000 to $17,499 | 0 (0.0%) | 14 (2.4%) |
| $17,500 to $19,999 | 38 (6.2%) | 0 (0.0%) |
| $20,000 to $22,499 | 26 (4.2%) | 48 (8.1%) |
| $22,500 to $24,999 | 0 (0.0%) | 19 (3.2%) |
| $25,000 to $29,999 | 16 (2.6%) | 28 (4.7%) |
| $30,000 to $34,999 | 24 (3.9%) | 37 (6.2%) |
| $35,000 to $39,999 | 28 (4.5%) | 38 (6.4%) |
| $40,000 to $44,999 | 27 (4.4%) | 47 (7.9%) |
| $45,000 to $49,999 | 29 (4.7%) | 60 (10.1%) |
| $50,000 to $54,999 | 11 (1.8%) | 14 (2.4%) |
| $55,000 to $64,999 | 149 (24.2%) | 82 (13.8%) |
| $65,000 to $74,999 | 56 (9.1%) | 46 (7.7%) |
| $75,000 to $99,999 | 114 (18.5%) | 46 (7.7%) |
| $100,000+ | 44 (7.1%) | 37 (6.2%) |
| Total | 616 (100.0%) | 596 (100.0%) |
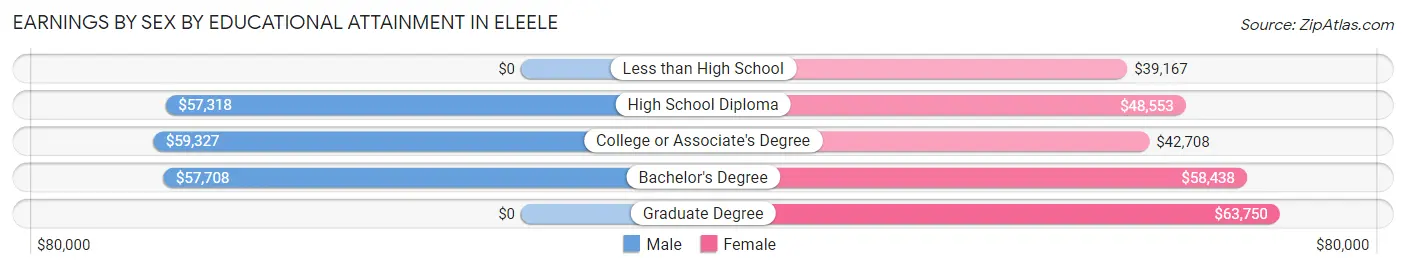
Earnings by Sex by Educational Attainment in Eleele
Average earnings in Eleele are $58,304 for men and $47,045 for women, a difference of 19.3%. Men with an educational attainment of college or associate's degree enjoy the highest average annual earnings of $59,327, while those with high school diploma education earn the least with $57,318. Women with an educational attainment of graduate degree earn the most with the average annual earnings of $63,750, while those with less than high school education have the smallest earnings of $39,167.
| Educational Attainment | Male Income | Female Income |
| Less than High School | - | - |
| High School Diploma | $57,318 | $48,553 |
| College or Associate's Degree | $59,327 | $42,708 |
| Bachelor's Degree | $57,708 | $58,438 |
| Graduate Degree | - | - |
| Total | $58,304 | $47,045 |
Family Income in Eleele
Family Income Brackets in Eleele
According to the Eleele family income data, there are 143 families falling into the $100,000 to $149,999 income range, which is the most common income bracket and makes up 30.5% of all families. Conversely, the $10,000 to $14,999 income bracket is the least frequent group with only 5 families (1.1%) belonging to this category.
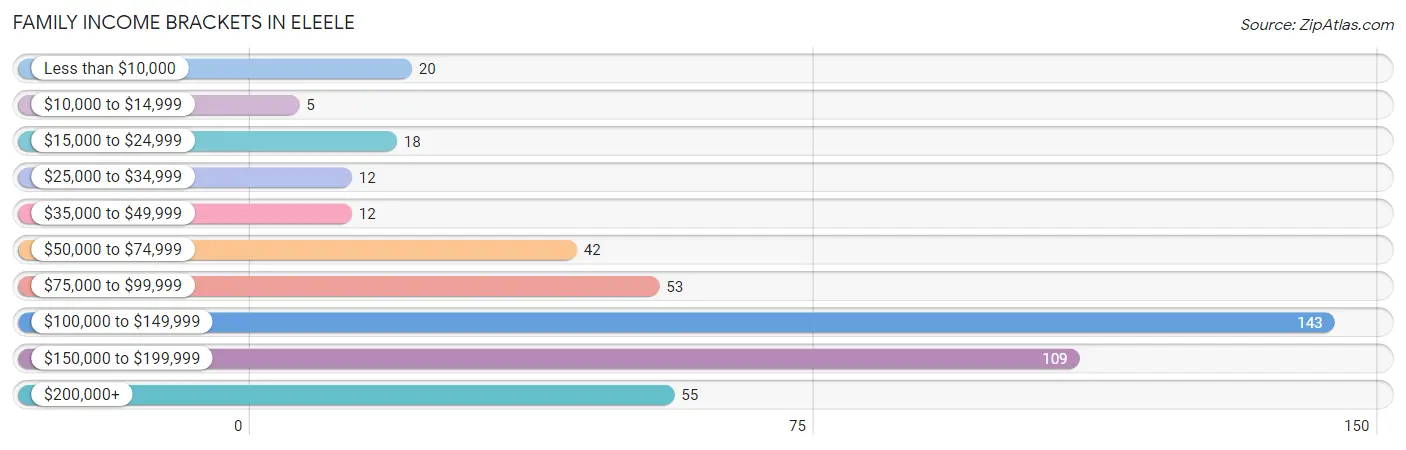
| Income Bracket | # Families | % Families |
| Less than $10,000 | 20 | 4.3% |
| $10,000 to $14,999 | 5 | 1.1% |
| $15,000 to $24,999 | 18 | 3.8% |
| $25,000 to $34,999 | 12 | 2.6% |
| $35,000 to $49,999 | 12 | 2.6% |
| $50,000 to $74,999 | 42 | 9.0% |
| $75,000 to $99,999 | 53 | 11.3% |
| $100,000 to $149,999 | 143 | 30.5% |
| $150,000 to $199,999 | 109 | 23.2% |
| $200,000+ | 55 | 11.7% |
Family Income by Famaliy Size in Eleele
7+ person families (37 | 7.9%) account for the highest median family income in Eleele with $204,844 per family, while 2-person families (183 | 39.0%) have the highest median income of $47,032 per family member.
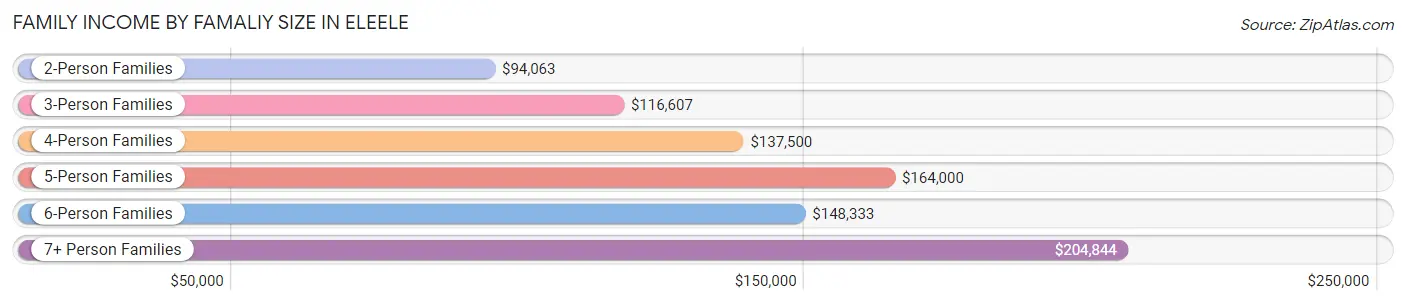
| Income Bracket | # Families | Median Income |
| 2-Person Families | 183 (39.0%) | $94,063 |
| 3-Person Families | 111 (23.7%) | $116,607 |
| 4-Person Families | 90 (19.2%) | $137,500 |
| 5-Person Families | 32 (6.8%) | $164,000 |
| 6-Person Families | 16 (3.4%) | $148,333 |
| 7+ Person Families | 37 (7.9%) | $204,844 |
| Total | 469 (100.0%) | $117,321 |
Family Income by Number of Earners in Eleele
The median family income in Eleele is $117,321, with families comprising 3+ earners (89) having the highest median family income of $182,431, while families with no earners (75) have the lowest median family income of $51,250, accounting for 19.0% and 16.0% of families, respectively.
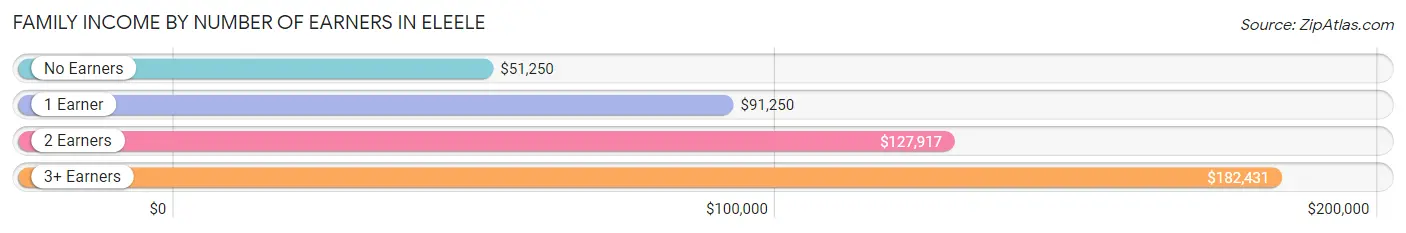
| Number of Earners | # Families | Median Income |
| No Earners | 75 (16.0%) | $51,250 |
| 1 Earner | 98 (20.9%) | $91,250 |
| 2 Earners | 207 (44.1%) | $127,917 |
| 3+ Earners | 89 (19.0%) | $182,431 |
| Total | 469 (100.0%) | $117,321 |
Household Income in Eleele
Household Income Brackets in Eleele
With 176 households falling in the category, the $100,000 to $149,999 income range is the most frequent in Eleele, accounting for 27.5% of all households. In contrast, only 15 households (2.3%) fall into the $10,000 to $14,999 income bracket, making it the least populous group.
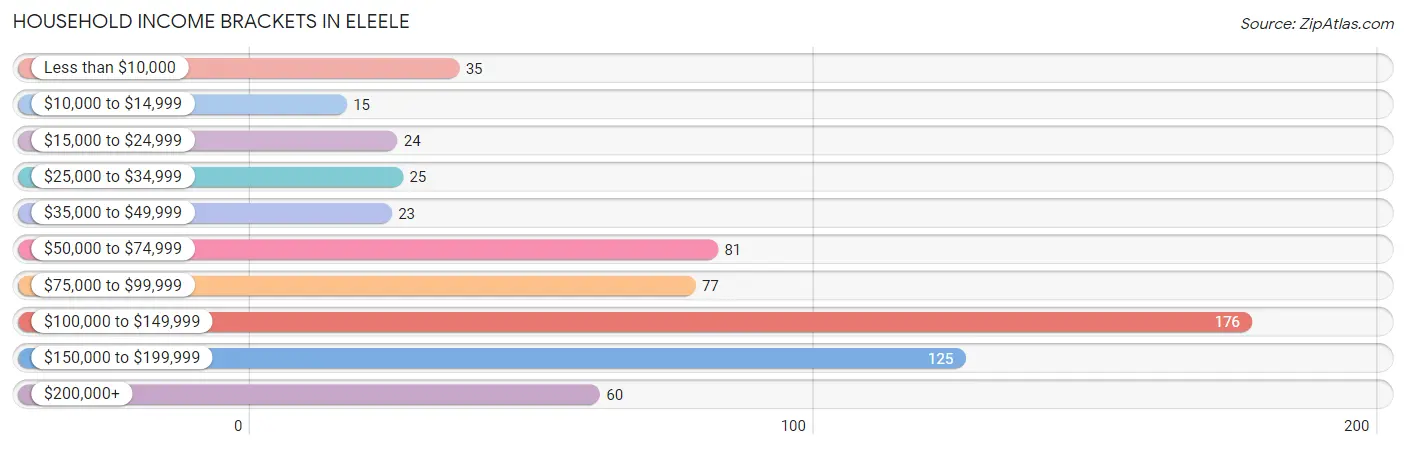
| Income Bracket | # Households | % Households |
| Less than $10,000 | 35 | 5.5% |
| $10,000 to $14,999 | 15 | 2.3% |
| $15,000 to $24,999 | 24 | 3.7% |
| $25,000 to $34,999 | 25 | 3.9% |
| $35,000 to $49,999 | 23 | 3.6% |
| $50,000 to $74,999 | 81 | 12.6% |
| $75,000 to $99,999 | 77 | 12.0% |
| $100,000 to $149,999 | 176 | 27.5% |
| $150,000 to $199,999 | 125 | 19.5% |
| $200,000+ | 60 | 9.4% |
Household Income by Householder Age in Eleele
The median household income in Eleele is $107,734, with the highest median household income of $126,250 found in the 45 to 64 years age bracket for the primary householder. A total of 308 households (48.0%) fall into this category. Meanwhile, the 65+ years age bracket for the primary householder has the lowest median household income of $75,625, with 149 households (23.2%) in this group.
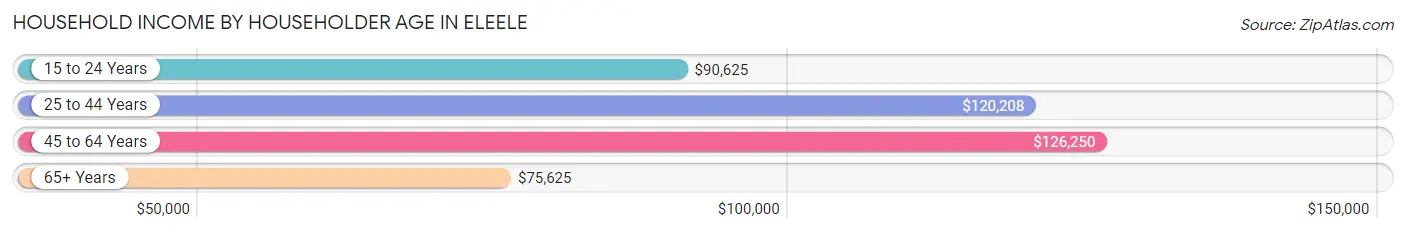
| Income Bracket | # Households | Median Income |
| 15 to 24 Years | 15 (2.3%) | $90,625 |
| 25 to 44 Years | 169 (26.4%) | $120,208 |
| 45 to 64 Years | 308 (48.0%) | $126,250 |
| 65+ Years | 149 (23.2%) | $75,625 |
| Total | 641 (100.0%) | $107,734 |
Poverty in Eleele
Income Below Poverty by Sex and Age in Eleele
With 4.7% poverty level for males and 9.8% for females among the residents of Eleele, 5 year old males and 16 and 17 year old females are the most vulnerable to poverty, with 5 males (29.4%) and 8 females (57.1%) in their respective age groups living below the poverty level.
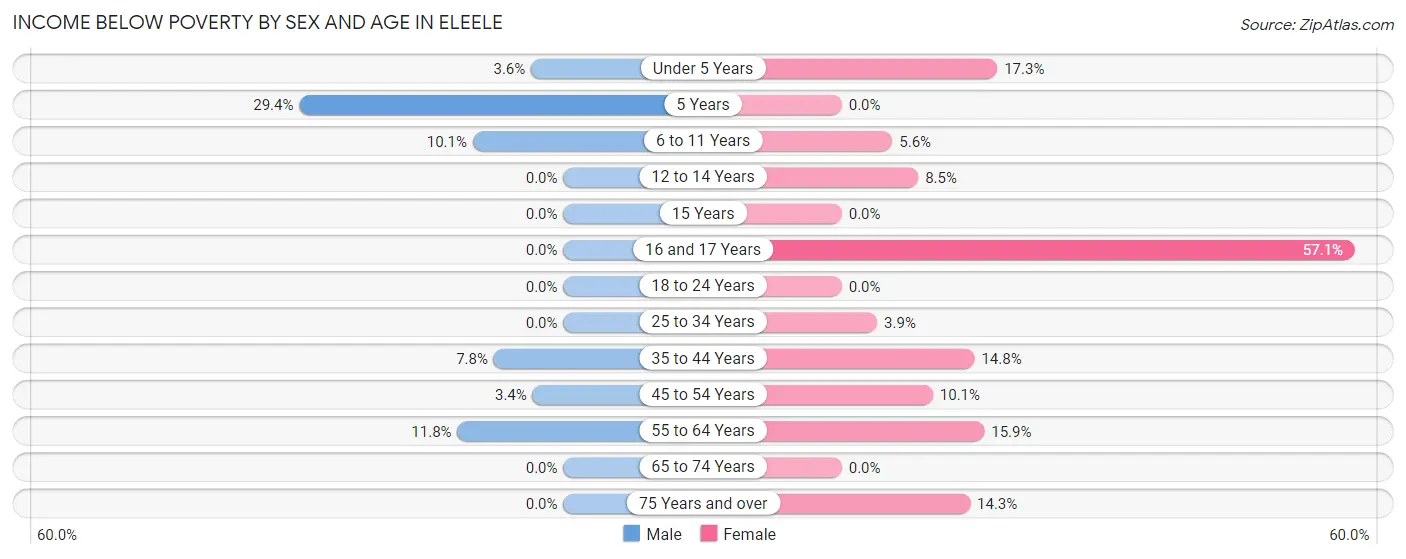
| Age Bracket | Male | Female |
| Under 5 Years | 6 (3.6%) | 9 (17.3%) |
| 5 Years | 5 (29.4%) | 0 (0.0%) |
| 6 to 11 Years | 12 (10.1%) | 4 (5.6%) |
| 12 to 14 Years | 0 (0.0%) | 4 (8.5%) |
| 15 Years | 0 (0.0%) | 0 (0.0%) |
| 16 and 17 Years | 0 (0.0%) | 8 (57.1%) |
| 18 to 24 Years | 0 (0.0%) | 0 (0.0%) |
| 25 to 34 Years | 0 (0.0%) | 5 (3.9%) |
| 35 to 44 Years | 10 (7.7%) | 17 (14.8%) |
| 45 to 54 Years | 4 (3.4%) | 15 (10.1%) |
| 55 to 64 Years | 19 (11.8%) | 33 (15.9%) |
| 65 to 74 Years | 0 (0.0%) | 0 (0.0%) |
| 75 Years and over | 0 (0.0%) | 7 (14.3%) |
| Total | 56 (4.7%) | 102 (9.8%) |
Income Above Poverty by Sex and Age in Eleele
According to the poverty statistics in Eleele, males aged 12 to 14 years and females aged 5 years are the age groups that are most secure financially, with 100.0% of males and 100.0% of females in these age groups living above the poverty line.
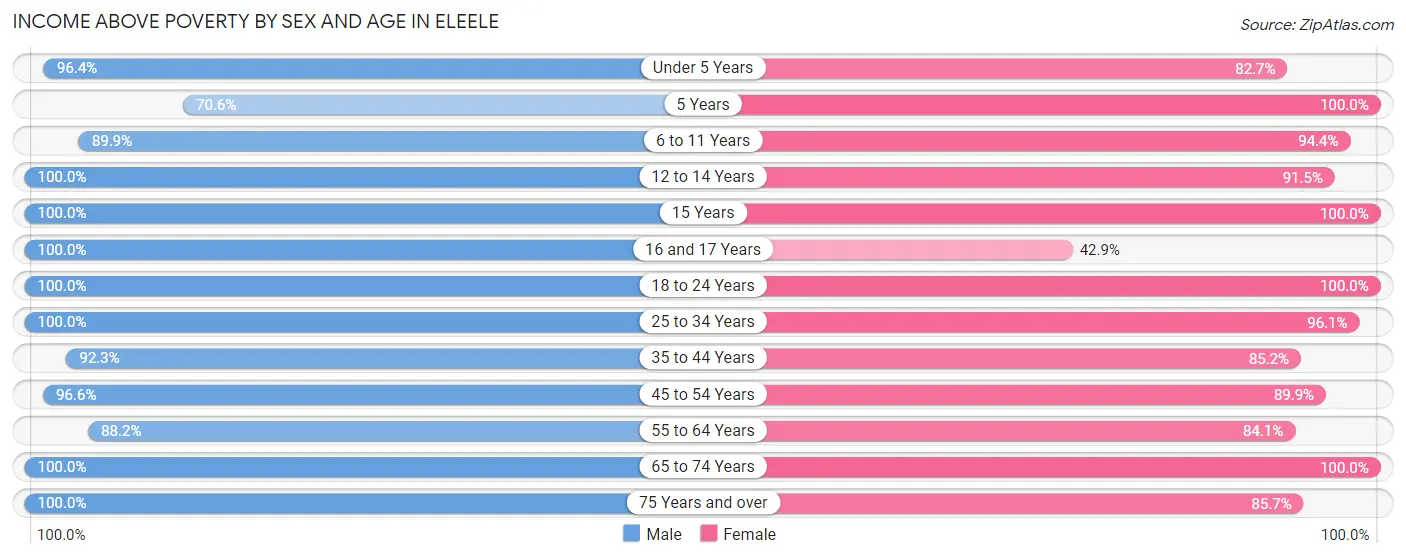
| Age Bracket | Male | Female |
| Under 5 Years | 161 (96.4%) | 43 (82.7%) |
| 5 Years | 12 (70.6%) | 11 (100.0%) |
| 6 to 11 Years | 107 (89.9%) | 67 (94.4%) |
| 12 to 14 Years | 41 (100.0%) | 43 (91.5%) |
| 15 Years | 4 (100.0%) | 16 (100.0%) |
| 16 and 17 Years | 16 (100.0%) | 6 (42.9%) |
| 18 to 24 Years | 120 (100.0%) | 118 (100.0%) |
| 25 to 34 Years | 143 (100.0%) | 122 (96.1%) |
| 35 to 44 Years | 119 (92.2%) | 98 (85.2%) |
| 45 to 54 Years | 113 (96.6%) | 133 (89.9%) |
| 55 to 64 Years | 142 (88.2%) | 175 (84.1%) |
| 65 to 74 Years | 120 (100.0%) | 66 (100.0%) |
| 75 Years and over | 42 (100.0%) | 42 (85.7%) |
| Total | 1,140 (95.3%) | 940 (90.2%) |
Income Below Poverty Among Married-Couple Families in Eleele
The poverty statistics for married-couple families in Eleele show that 4.6% or 18 of the total 393 families live below the poverty line. Families with no children have the highest poverty rate of 7.5%, comprising of 18 families. On the other hand, families with 1 or 2 children have the lowest poverty rate of 0.0%, which includes 0 families.
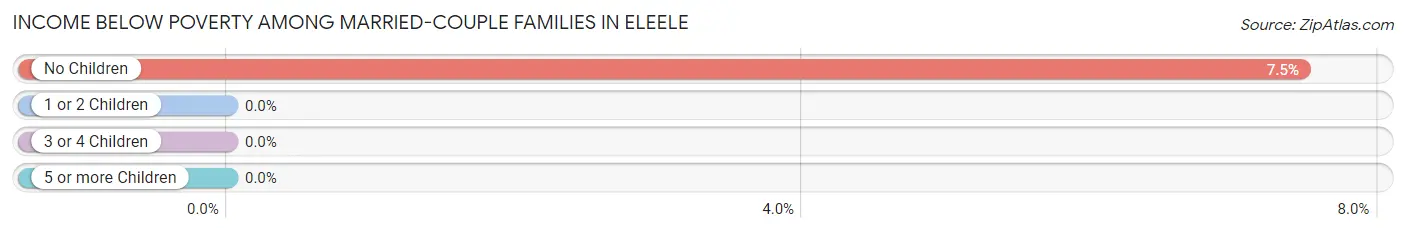
| Children | Above Poverty | Below Poverty |
| No Children | 223 (92.5%) | 18 (7.5%) |
| 1 or 2 Children | 100 (100.0%) | 0 (0.0%) |
| 3 or 4 Children | 38 (100.0%) | 0 (0.0%) |
| 5 or more Children | 14 (100.0%) | 0 (0.0%) |
| Total | 375 (95.4%) | 18 (4.6%) |
Income Below Poverty Among Single-Parent Households in Eleele
According to the poverty data in Eleele, 12.5% or 5 single-father households and 38.9% or 14 single-mother households are living below the poverty line. Among single-father households, those with 3 or 4 children have the highest poverty rate, with 5 households (29.4%) experiencing poverty. Likewise, among single-mother households, those with 1 or 2 children have the highest poverty rate, with 9 households (69.2%) falling below the poverty line.
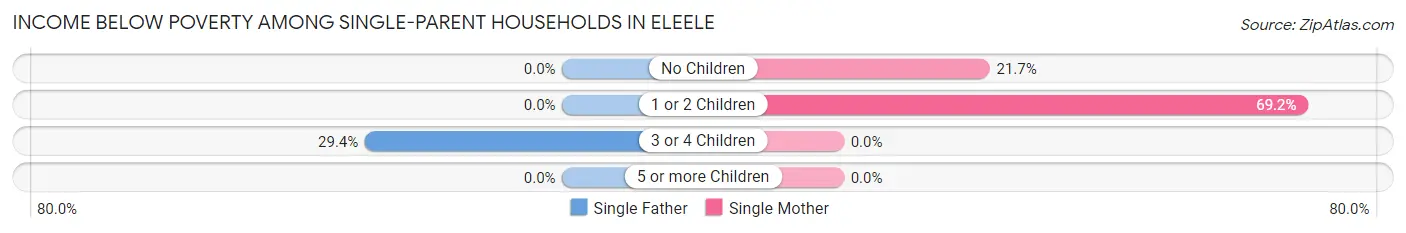
| Children | Single Father | Single Mother |
| No Children | 0 (0.0%) | 5 (21.7%) |
| 1 or 2 Children | 0 (0.0%) | 9 (69.2%) |
| 3 or 4 Children | 5 (29.4%) | 0 (0.0%) |
| 5 or more Children | 0 (0.0%) | 0 (0.0%) |
| Total | 5 (12.5%) | 14 (38.9%) |
Income Below Poverty Among Married-Couple vs Single-Parent Households in Eleele
The poverty data for Eleele shows that 18 of the married-couple family households (4.6%) and 19 of the single-parent households (25.0%) are living below the poverty level. Within the married-couple family households, those with no children have the highest poverty rate, with 18 households (7.5%) falling below the poverty line. Among the single-parent households, those with 1 or 2 children have the highest poverty rate, with 9 household (37.5%) living below poverty.
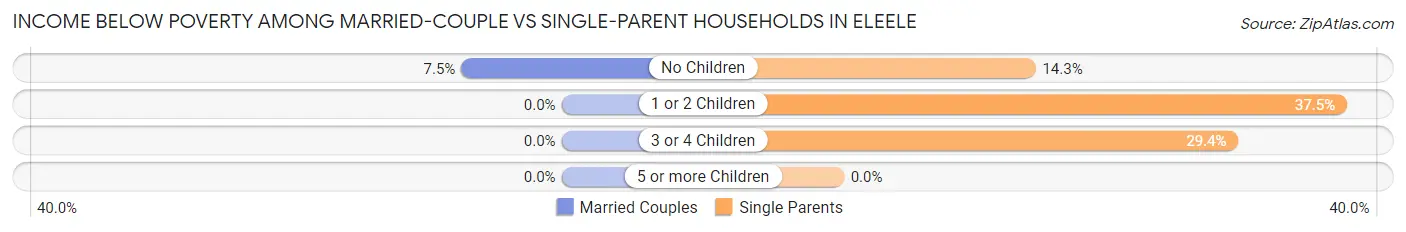
| Children | Married-Couple Families | Single-Parent Households |
| No Children | 18 (7.5%) | 5 (14.3%) |
| 1 or 2 Children | 0 (0.0%) | 9 (37.5%) |
| 3 or 4 Children | 0 (0.0%) | 5 (29.4%) |
| 5 or more Children | 0 (0.0%) | 0 (0.0%) |
| Total | 18 (4.6%) | 19 (25.0%) |
Race in Eleele
The most populous races in Eleele are Asian (1,109 | 49.2%), Two or more Races (681 | 30.2%), and White / Caucasian (288 | 12.8%).
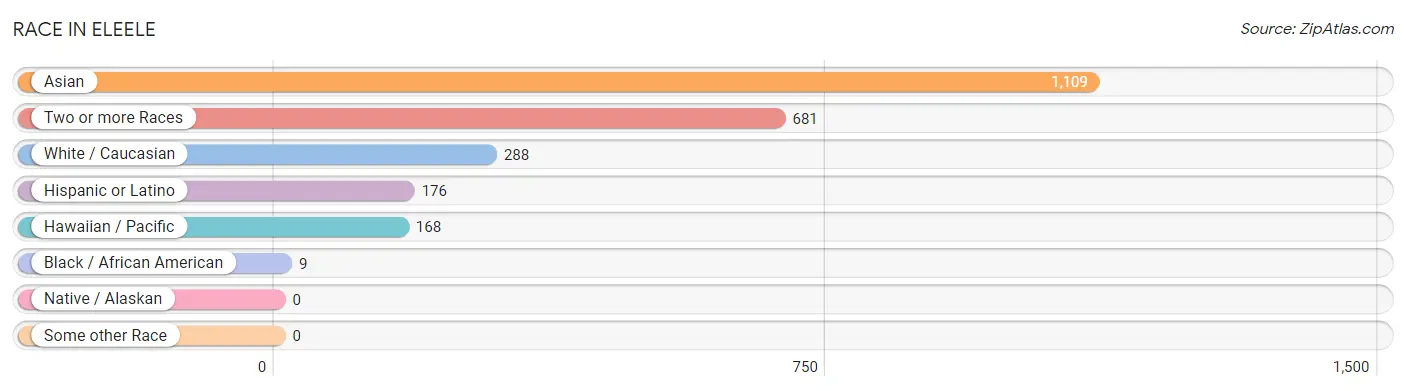
| Race | # Population | % Population |
| Asian | 1,109 | 49.2% |
| Black / African American | 9 | 0.4% |
| Hawaiian / Pacific | 168 | 7.4% |
| Hispanic or Latino | 176 | 7.8% |
| Native / Alaskan | 0 | 0.0% |
| White / Caucasian | 288 | 12.8% |
| Two or more Races | 681 | 30.2% |
| Some other Race | 0 | 0.0% |
| Total | 2,255 | 100.0% |
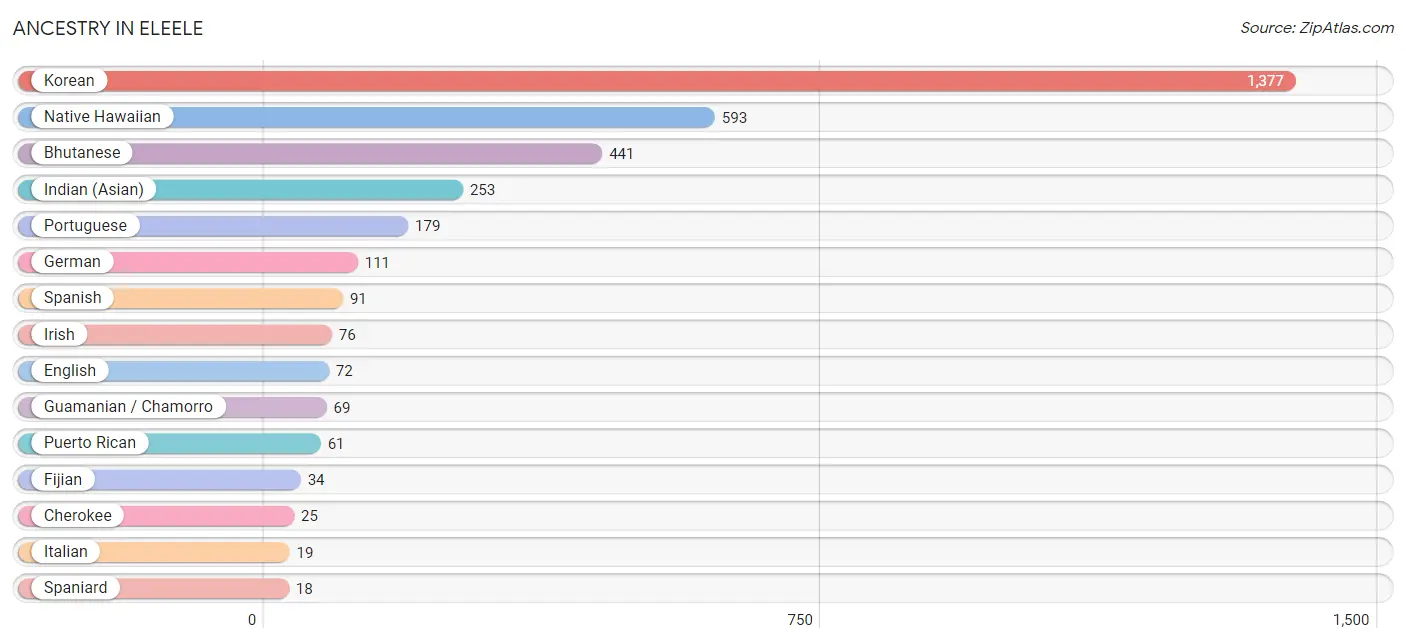
Ancestry in Eleele
The most populous ancestries reported in Eleele are Korean (1,377 | 61.1%), Native Hawaiian (593 | 26.3%), Bhutanese (441 | 19.6%), Indian (Asian) (253 | 11.2%), and Portuguese (179 | 7.9%), together accounting for 126.1% of all Eleele residents.
| Ancestry | # Population | % Population |
| American | 5 | 0.2% |
| Bhutanese | 441 | 19.6% |
| Burmese | 6 | 0.3% |
| Cherokee | 25 | 1.1% |
| English | 72 | 3.2% |
| Fijian | 34 | 1.5% |
| French | 16 | 0.7% |
| German | 111 | 4.9% |
| Greek | 3 | 0.1% |
| Guamanian / Chamorro | 69 | 3.1% |
| Indian (Asian) | 253 | 11.2% |
| Irish | 76 | 3.4% |
| Italian | 19 | 0.8% |
| Korean | 1,377 | 61.1% |
| Mexican | 6 | 0.3% |
| Native Hawaiian | 593 | 26.3% |
| Pakistani | 14 | 0.6% |
| Portuguese | 179 | 7.9% |
| Puerto Rican | 61 | 2.7% |
| Serbian | 11 | 0.5% |
| Spaniard | 18 | 0.8% |
| Spanish | 91 | 4.0% |
| Swiss | 7 | 0.3% |
| Welsh | 5 | 0.2% | View All 24 Rows |
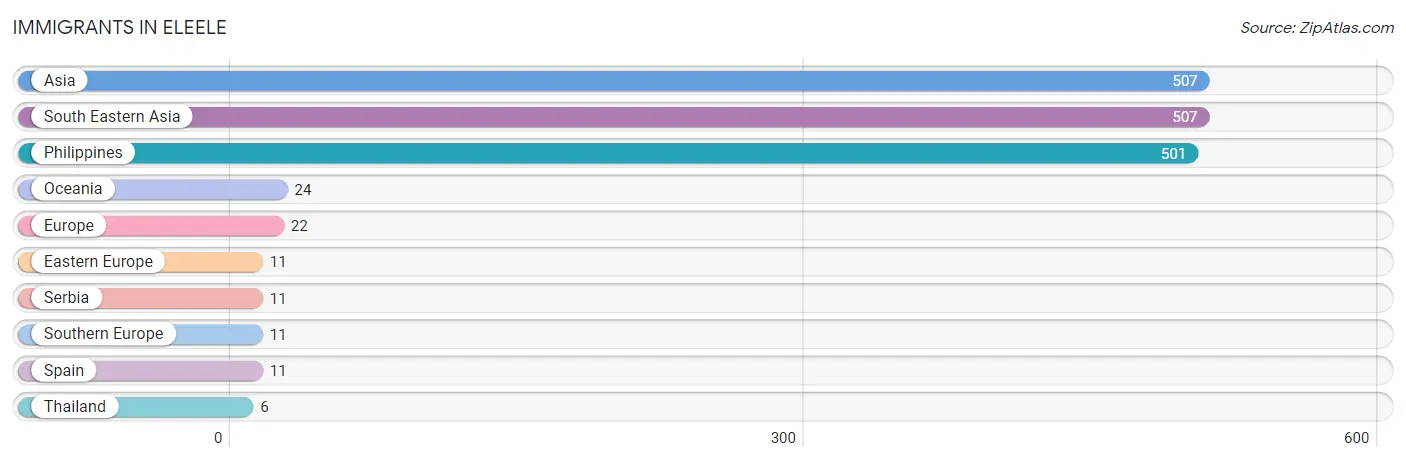
Immigrants in Eleele
The most numerous immigrant groups reported in Eleele came from Asia (507 | 22.5%), South Eastern Asia (507 | 22.5%), Philippines (501 | 22.2%), Oceania (24 | 1.1%), and Europe (22 | 1.0%), together accounting for 69.2% of all Eleele residents.
| Immigration Origin | # Population | % Population |
| Asia | 507 | 22.5% |
| Eastern Europe | 11 | 0.5% |
| Europe | 22 | 1.0% |
| Oceania | 24 | 1.1% |
| Philippines | 501 | 22.2% |
| Serbia | 11 | 0.5% |
| South Eastern Asia | 507 | 22.5% |
| Southern Europe | 11 | 0.5% |
| Spain | 11 | 0.5% |
| Thailand | 6 | 0.3% | View All 10 Rows |
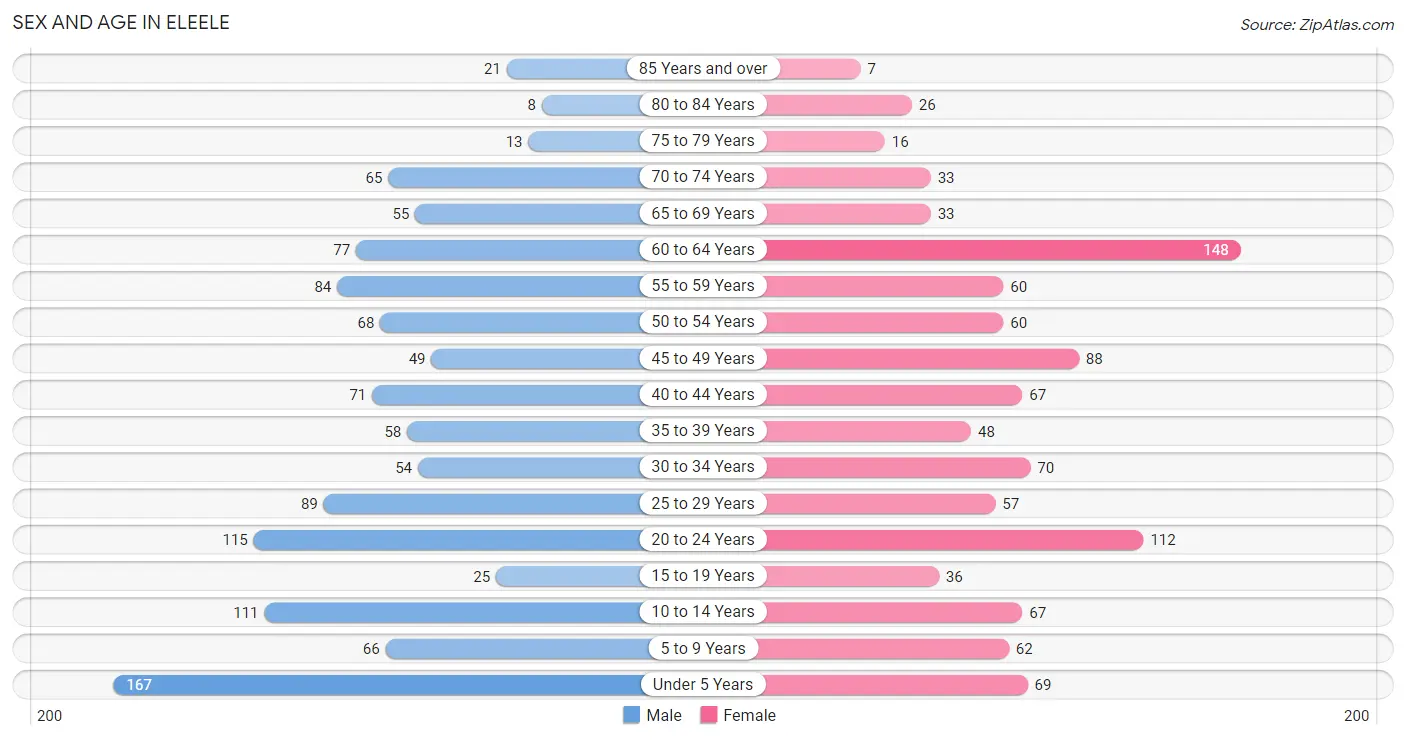
Sex and Age in Eleele
Sex and Age in Eleele
The most populous age groups in Eleele are Under 5 Years (167 | 14.0%) for men and 60 to 64 Years (148 | 14.0%) for women.
| Age Bracket | Male | Female |
| Under 5 Years | 167 (14.0%) | 69 (6.5%) |
| 5 to 9 Years | 66 (5.5%) | 62 (5.9%) |
| 10 to 14 Years | 111 (9.3%) | 67 (6.3%) |
| 15 to 19 Years | 25 (2.1%) | 36 (3.4%) |
| 20 to 24 Years | 115 (9.6%) | 112 (10.6%) |
| 25 to 29 Years | 89 (7.4%) | 57 (5.4%) |
| 30 to 34 Years | 54 (4.5%) | 70 (6.6%) |
| 35 to 39 Years | 58 (4.9%) | 48 (4.5%) |
| 40 to 44 Years | 71 (5.9%) | 67 (6.3%) |
| 45 to 49 Years | 49 (4.1%) | 88 (8.3%) |
| 50 to 54 Years | 68 (5.7%) | 60 (5.7%) |
| 55 to 59 Years | 84 (7.0%) | 60 (5.7%) |
| 60 to 64 Years | 77 (6.4%) | 148 (14.0%) |
| 65 to 69 Years | 55 (4.6%) | 33 (3.1%) |
| 70 to 74 Years | 65 (5.4%) | 33 (3.1%) |
| 75 to 79 Years | 13 (1.1%) | 16 (1.5%) |
| 80 to 84 Years | 8 (0.7%) | 26 (2.5%) |
| 85 Years and over | 21 (1.8%) | 7 (0.7%) |
| Total | 1,196 (100.0%) | 1,059 (100.0%) |
Families and Households in Eleele
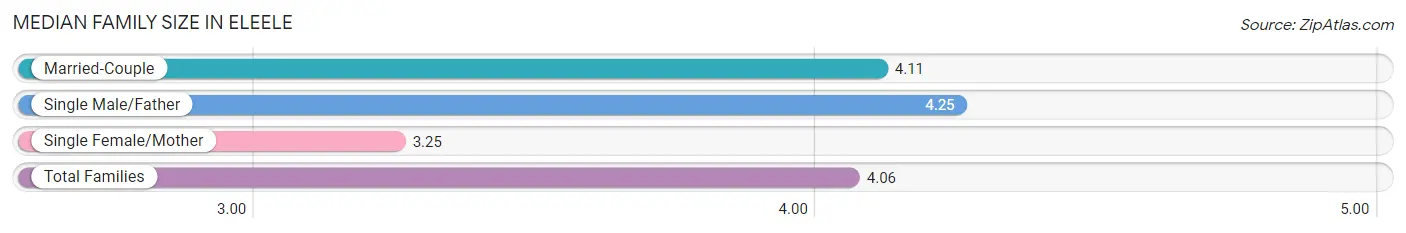
Median Family Size in Eleele
The median family size in Eleele is 4.06 persons per family, with single male/father families (40 | 8.5%) accounting for the largest median family size of 4.25 persons per family. On the other hand, single female/mother families (36 | 7.7%) represent the smallest median family size with 3.25 persons per family.
| Family Type | # Families | Family Size |
| Married-Couple | 393 (83.8%) | 4.11 |
| Single Male/Father | 40 (8.5%) | 4.25 |
| Single Female/Mother | 36 (7.7%) | 3.25 |
| Total Families | 469 (100.0%) | 4.06 |
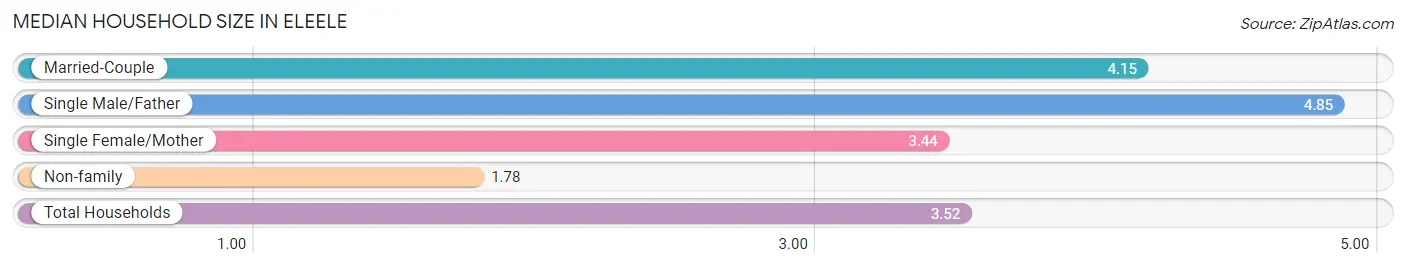
Median Household Size in Eleele
The median household size in Eleele is 3.52 persons per household, with single male/father households (40 | 6.2%) accounting for the largest median household size of 4.85 persons per household. non-family households (172 | 26.8%) represent the smallest median household size with 1.78 persons per household.
| Household Type | # Households | Household Size |
| Married-Couple | 393 (61.3%) | 4.15 |
| Single Male/Father | 40 (6.2%) | 4.85 |
| Single Female/Mother | 36 (5.6%) | 3.44 |
| Non-family | 172 (26.8%) | 1.78 |
| Total Households | 641 (100.0%) | 3.52 |
Household Size by Marriage Status in Eleele
Out of a total of 641 households in Eleele, 469 (73.2%) are family households, while 172 (26.8%) are nonfamily households. The most numerous type of family households are 2-person households, comprising 174, and the most common type of nonfamily households are 1-person households, comprising 89.
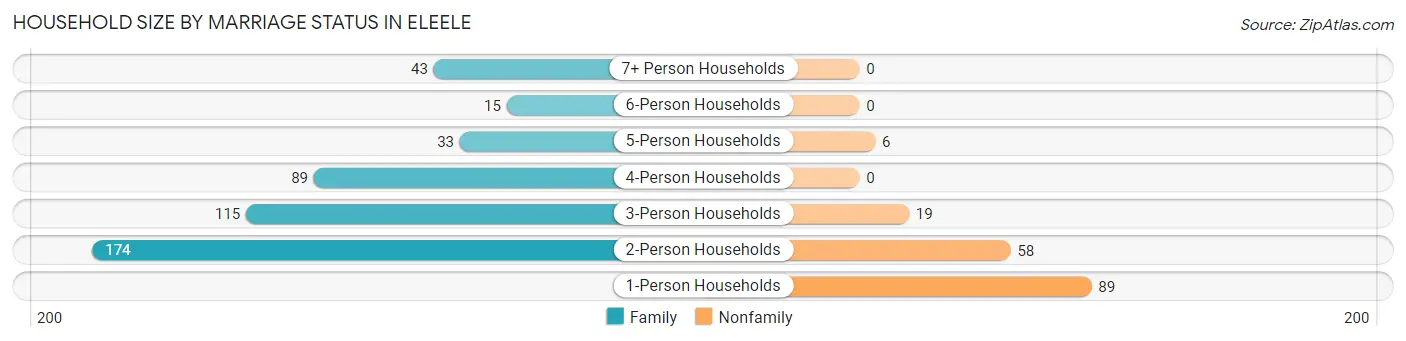
| Household Size | Family Households | Nonfamily Households |
| 1-Person Households | - | 89 (13.9%) |
| 2-Person Households | 174 (27.2%) | 58 (9.0%) |
| 3-Person Households | 115 (17.9%) | 19 (3.0%) |
| 4-Person Households | 89 (13.9%) | 0 (0.0%) |
| 5-Person Households | 33 (5.1%) | 6 (0.9%) |
| 6-Person Households | 15 (2.3%) | 0 (0.0%) |
| 7+ Person Households | 43 (6.7%) | 0 (0.0%) |
| Total | 469 (73.2%) | 172 (26.8%) |
Female Fertility in Eleele
Fertility by Age in Eleele
Average fertility rate in Eleele is 25.0 births per 1,000 women. Women in the age bracket of 20 to 34 years have the highest fertility rate with 50.0 births per 1,000 women. Women in the age bracket of 20 to 34 years acount for 100.0% of all women with births.
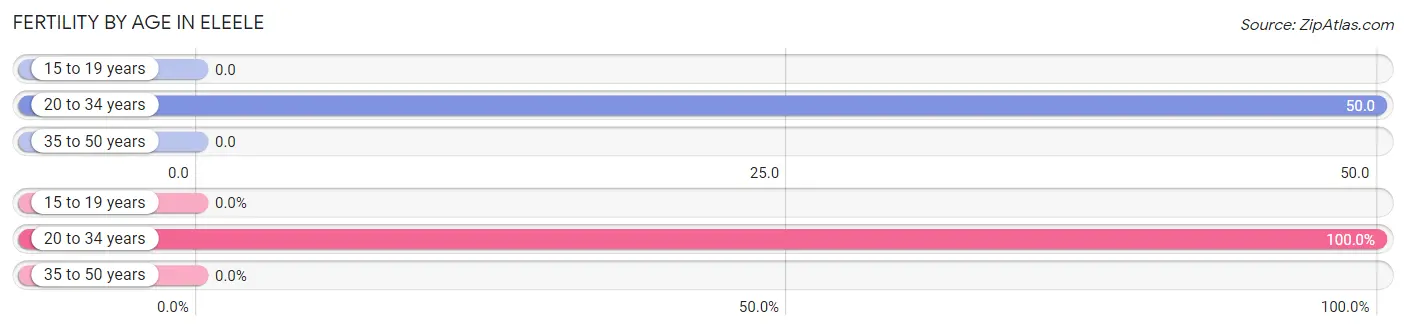
| Age Bracket | Women with Births | Births / 1,000 Women |
| 15 to 19 years | 0 (0.0%) | 0.0 |
| 20 to 34 years | 12 (100.0%) | 50.0 |
| 35 to 50 years | 0 (0.0%) | 0.0 |
| Total | 12 (100.0%) | 25.0 |
Fertility by Age by Marriage Status in Eleele
50.0% of women with births (12) in Eleele are married. The highest percentage of unmarried women with births falls into 20 to 34 years age bracket with 50.0% of them unmarried at the time of birth, while the lowest percentage of unmarried women with births belong to 20 to 34 years age bracket with 50.0% of them unmarried.
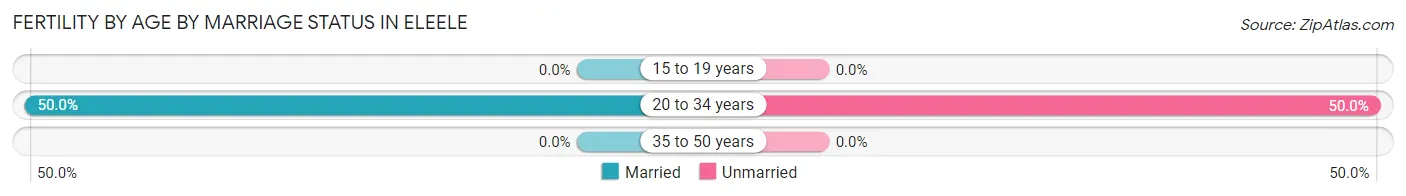
| Age Bracket | Married | Unmarried |
| 15 to 19 years | 0 (0.0%) | 0 (0.0%) |
| 20 to 34 years | 6 (50.0%) | 6 (50.0%) |
| 35 to 50 years | 0 (0.0%) | 0 (0.0%) |
| Total | 6 (50.0%) | 6 (50.0%) |
Fertility by Education in Eleele
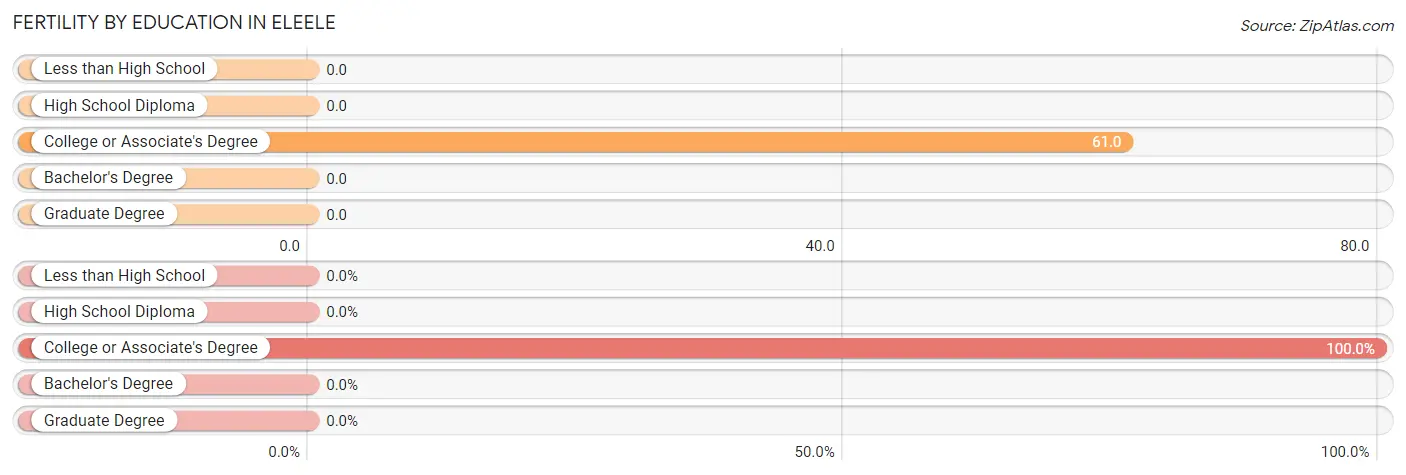
| Educational Attainment | Women with Births | Births / 1,000 Women |
| Less than High School | 0 (0.0%) | 0.0 |
| High School Diploma | 0 (0.0%) | 0.0 |
| College or Associate's Degree | 12 (100.0%) | 61.0 |
| Bachelor's Degree | 0 (0.0%) | 0.0 |
| Graduate Degree | 0 (0.0%) | 0.0 |
| Total | 12 (100.0%) | 25.0 |
Fertility by Education by Marriage Status in Eleele
50.0% of women with births in Eleele are unmarried. Women with the educational attainment of college or associate's degree are most likely to be married with 50.0% of them married at childbirth, while women with the educational attainment of college or associate's degree are least likely to be married with 50.0% of them unmarried at childbirth.
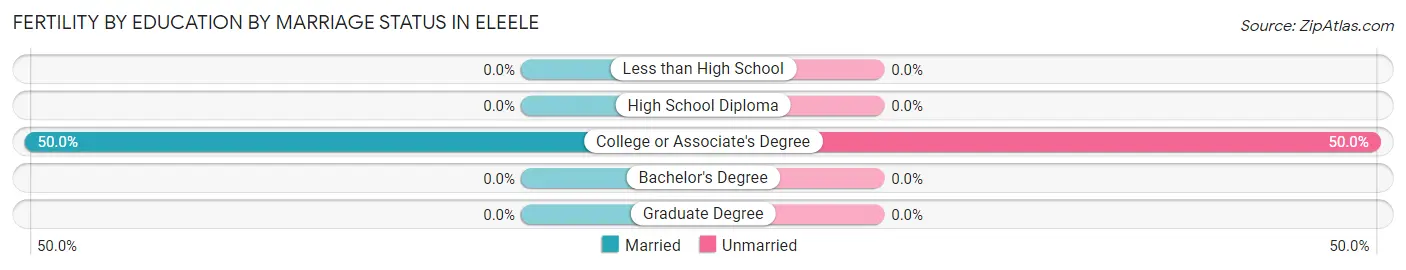
| Educational Attainment | Married | Unmarried |
| Less than High School | 0 (0.0%) | 0 (0.0%) |
| High School Diploma | 0 (0.0%) | 0 (0.0%) |
| College or Associate's Degree | 6 (50.0%) | 6 (50.0%) |
| Bachelor's Degree | 0 (0.0%) | 0 (0.0%) |
| Graduate Degree | 0 (0.0%) | 0 (0.0%) |
| Total | 6 (50.0%) | 6 (50.0%) |
Employment Characteristics in Eleele
Employment by Class of Employer in Eleele
Among the 1,091 employed individuals in Eleele, private company employees (746 | 68.4%), federal government employees (105 | 9.6%), and state government employees (103 | 9.4%) make up the most common classes of employment.
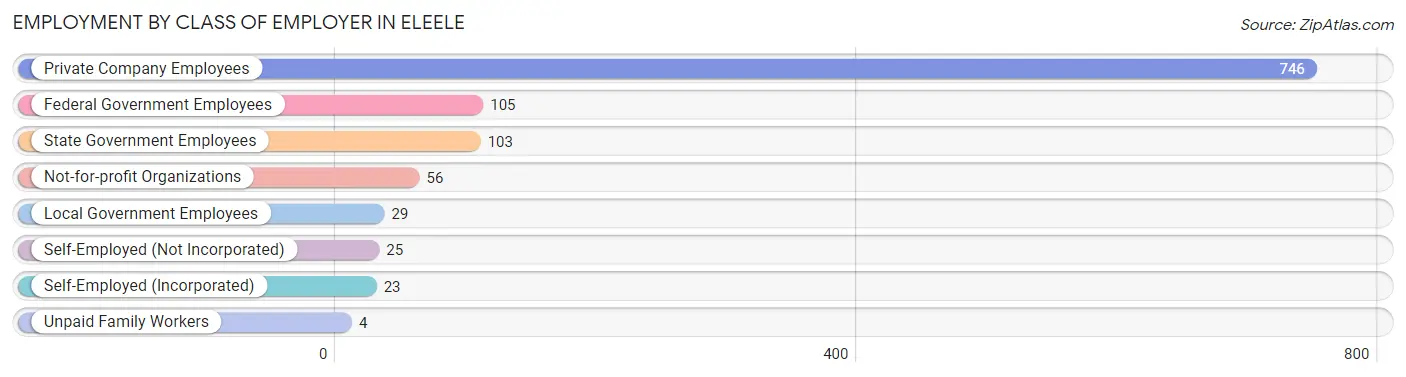
| Employer Class | # Employees | % Employees |
| Private Company Employees | 746 | 68.4% |
| Self-Employed (Incorporated) | 23 | 2.1% |
| Self-Employed (Not Incorporated) | 25 | 2.3% |
| Not-for-profit Organizations | 56 | 5.1% |
| Local Government Employees | 29 | 2.7% |
| State Government Employees | 103 | 9.4% |
| Federal Government Employees | 105 | 9.6% |
| Unpaid Family Workers | 4 | 0.4% |
| Total | 1,091 | 100.0% |
Employment Status by Age in Eleele
According to the labor force statistics for Eleele, out of the total population over 16 years of age (1,693), 70.8% or 1,199 individuals are in the labor force, with 2.0% or 24 of them unemployed. The age group with the highest labor force participation rate is 55 to 59 years, with 94.4% or 136 individuals in the labor force. Within the labor force, the 35 to 44 years age range has the highest percentage of unemployed individuals, with 9.1% or 18 of them being unemployed.
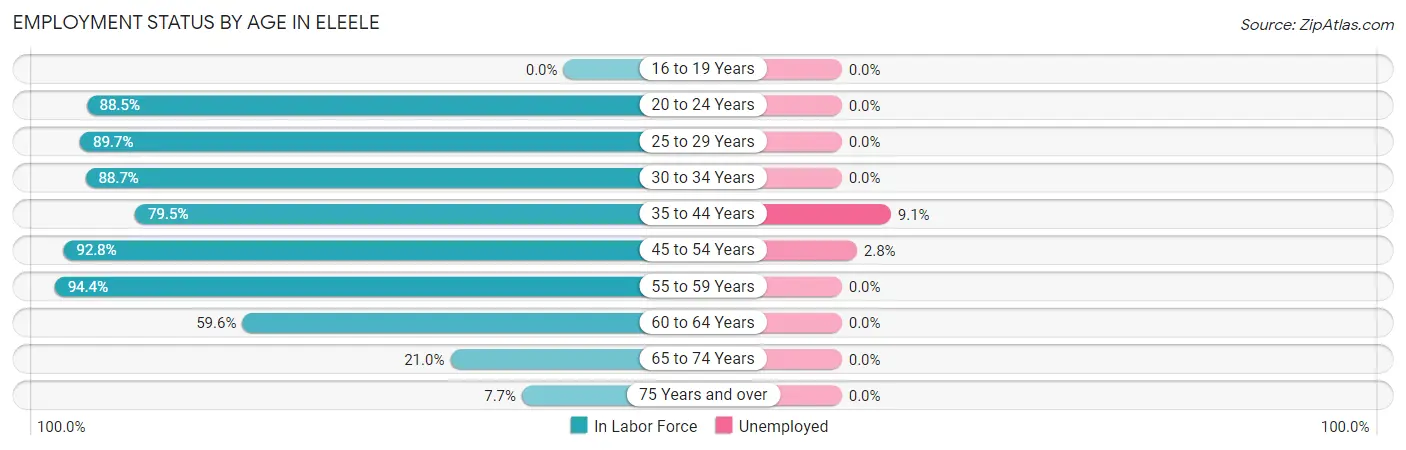
| Age Bracket | In Labor Force | Unemployed |
| 16 to 19 Years | 0 (0.0%) | 0 (0.0%) |
| 20 to 24 Years | 201 (88.5%) | 0 (0.0%) |
| 25 to 29 Years | 131 (89.7%) | 0 (0.0%) |
| 30 to 34 Years | 110 (88.7%) | 0 (0.0%) |
| 35 to 44 Years | 194 (79.5%) | 18 (9.1%) |
| 45 to 54 Years | 246 (92.8%) | 7 (2.8%) |
| 55 to 59 Years | 136 (94.4%) | 0 (0.0%) |
| 60 to 64 Years | 134 (59.6%) | 0 (0.0%) |
| 65 to 74 Years | 39 (21.0%) | 0 (0.0%) |
| 75 Years and over | 7 (7.7%) | 0 (0.0%) |
| Total | 1,199 (70.8%) | 24 (2.0%) |
Employment Status by Educational Attainment in Eleele
According to labor force statistics for Eleele, 82.8% of individuals (951) out of the total population between 25 and 64 years of age (1,148) are in the labor force, with 2.6% or 25 of them being unemployed. The group with the highest labor force participation rate are those with the educational attainment of college / associate degree, with 89.9% or 420 individuals in the labor force. Within the labor force, individuals with college / associate degree education have the highest percentage of unemployment, with 3.4% or 14 of them being unemployed.
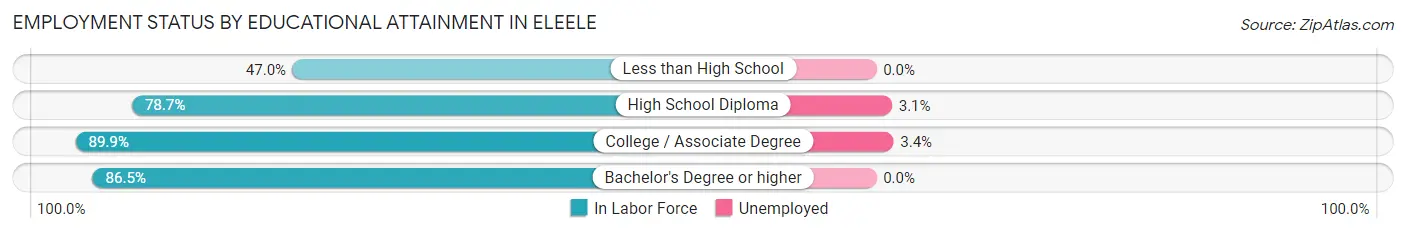
| Educational Attainment | In Labor Force | Unemployed |
| Less than High School | 31 (47.0%) | 0 (0.0%) |
| High School Diploma | 321 (78.7%) | 13 (3.1%) |
| College / Associate Degree | 420 (89.9%) | 16 (3.4%) |
| Bachelor's Degree or higher | 179 (86.5%) | 0 (0.0%) |
| Total | 951 (82.8%) | 30 (2.6%) |
Employment Occupations by Sex in Eleele
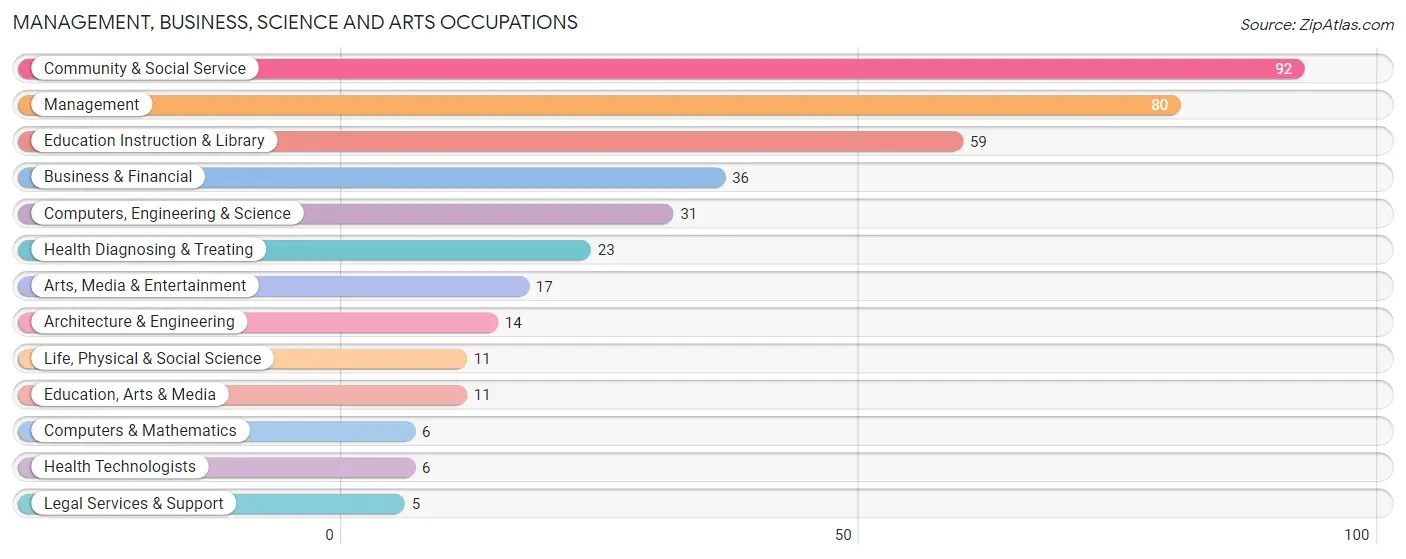
Management, Business, Science and Arts Occupations
The most common Management, Business, Science and Arts occupations in Eleele are Community & Social Service (92 | 7.9%), Management (80 | 6.9%), Education Instruction & Library (59 | 5.1%), Business & Financial (36 | 3.1%), and Computers, Engineering & Science (31 | 2.7%).
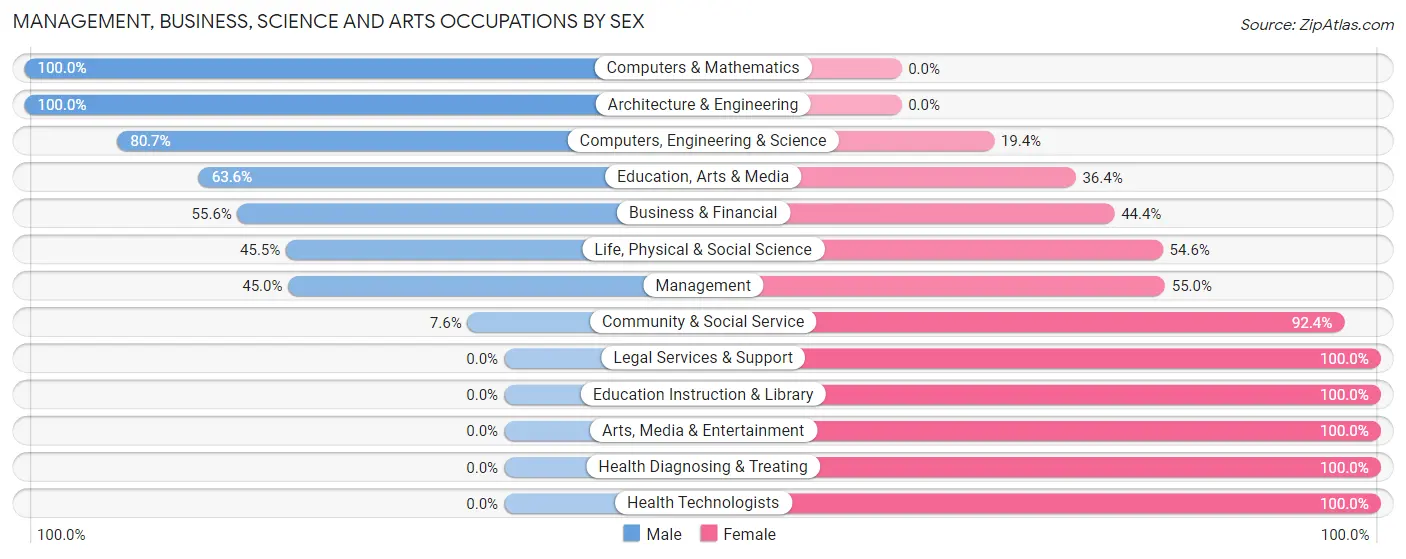
Management, Business, Science and Arts Occupations by Sex
Within the Management, Business, Science and Arts occupations in Eleele, the most male-oriented occupations are Computers & Mathematics (100.0%), Architecture & Engineering (100.0%), and Computers, Engineering & Science (80.6%), while the most female-oriented occupations are Legal Services & Support (100.0%), Education Instruction & Library (100.0%), and Arts, Media & Entertainment (100.0%).
| Occupation | Male | Female |
| Management | 36 (45.0%) | 44 (55.0%) |
| Business & Financial | 20 (55.6%) | 16 (44.4%) |
| Computers, Engineering & Science | 25 (80.6%) | 6 (19.4%) |
| Computers & Mathematics | 6 (100.0%) | 0 (0.0%) |
| Architecture & Engineering | 14 (100.0%) | 0 (0.0%) |
| Life, Physical & Social Science | 5 (45.5%) | 6 (54.5%) |
| Community & Social Service | 7 (7.6%) | 85 (92.4%) |
| Education, Arts & Media | 7 (63.6%) | 4 (36.4%) |
| Legal Services & Support | 0 (0.0%) | 5 (100.0%) |
| Education Instruction & Library | 0 (0.0%) | 59 (100.0%) |
| Arts, Media & Entertainment | 0 (0.0%) | 17 (100.0%) |
| Health Diagnosing & Treating | 0 (0.0%) | 23 (100.0%) |
| Health Technologists | 0 (0.0%) | 6 (100.0%) |
| Total (Category) | 88 (33.6%) | 174 (66.4%) |
| Total (Overall) | 586 (50.5%) | 574 (49.5%) |
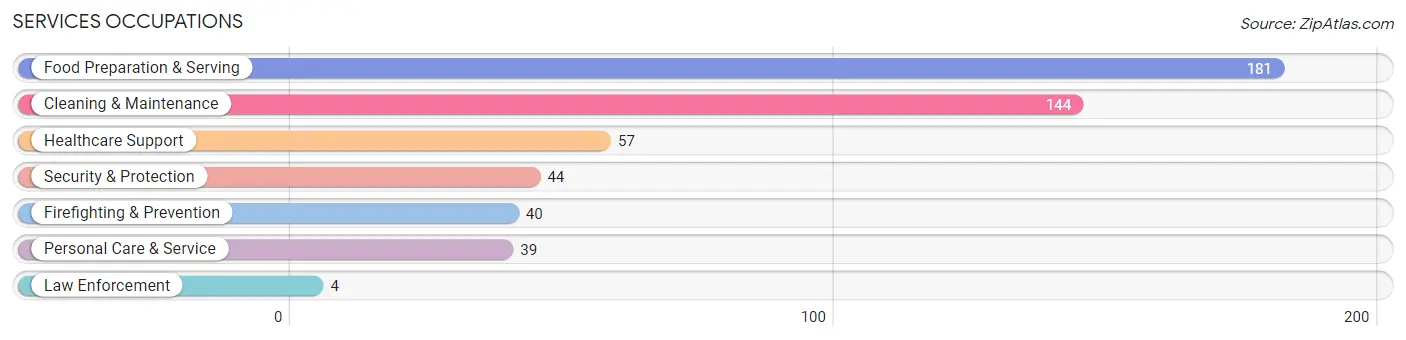
Services Occupations
The most common Services occupations in Eleele are Food Preparation & Serving (181 | 15.6%), Cleaning & Maintenance (144 | 12.4%), Healthcare Support (57 | 4.9%), Security & Protection (44 | 3.8%), and Firefighting & Prevention (40 | 3.5%).
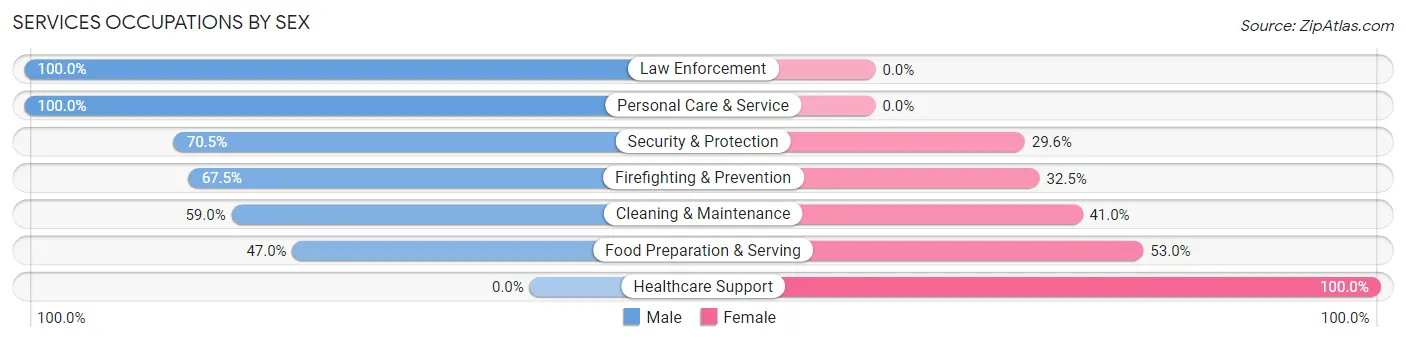
Services Occupations by Sex
Within the Services occupations in Eleele, the most male-oriented occupations are Law Enforcement (100.0%), Personal Care & Service (100.0%), and Security & Protection (70.5%), while the most female-oriented occupations are Healthcare Support (100.0%), Food Preparation & Serving (53.0%), and Cleaning & Maintenance (41.0%).
| Occupation | Male | Female |
| Healthcare Support | 0 (0.0%) | 57 (100.0%) |
| Security & Protection | 31 (70.5%) | 13 (29.5%) |
| Firefighting & Prevention | 27 (67.5%) | 13 (32.5%) |
| Law Enforcement | 4 (100.0%) | 0 (0.0%) |
| Food Preparation & Serving | 85 (47.0%) | 96 (53.0%) |
| Cleaning & Maintenance | 85 (59.0%) | 59 (41.0%) |
| Personal Care & Service | 39 (100.0%) | 0 (0.0%) |
| Total (Category) | 240 (51.6%) | 225 (48.4%) |
| Total (Overall) | 586 (50.5%) | 574 (49.5%) |
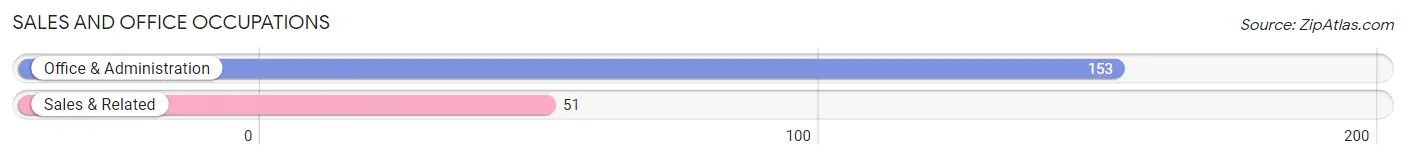
Sales and Office Occupations
The most common Sales and Office occupations in Eleele are Office & Administration (153 | 13.2%), and Sales & Related (51 | 4.4%).
Sales and Office Occupations by Sex
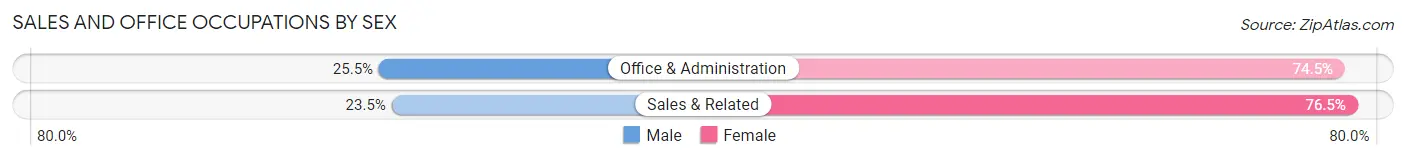
| Occupation | Male | Female |
| Sales & Related | 12 (23.5%) | 39 (76.5%) |
| Office & Administration | 39 (25.5%) | 114 (74.5%) |
| Total (Category) | 51 (25.0%) | 153 (75.0%) |
| Total (Overall) | 586 (50.5%) | 574 (49.5%) |
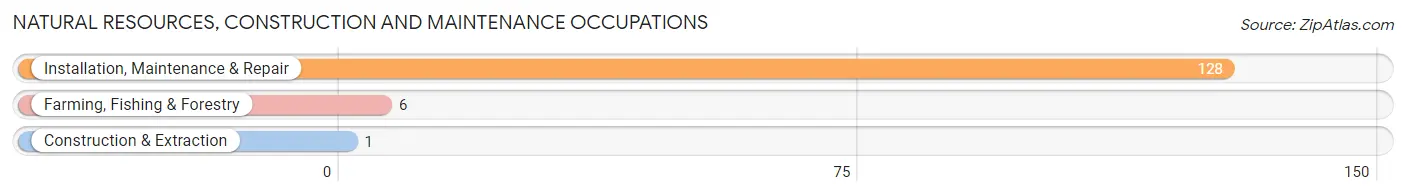
Natural Resources, Construction and Maintenance Occupations
The most common Natural Resources, Construction and Maintenance occupations in Eleele are Installation, Maintenance & Repair (128 | 11.0%), Farming, Fishing & Forestry (6 | 0.5%), and Construction & Extraction (1 | 0.1%).
Natural Resources, Construction and Maintenance Occupations by Sex
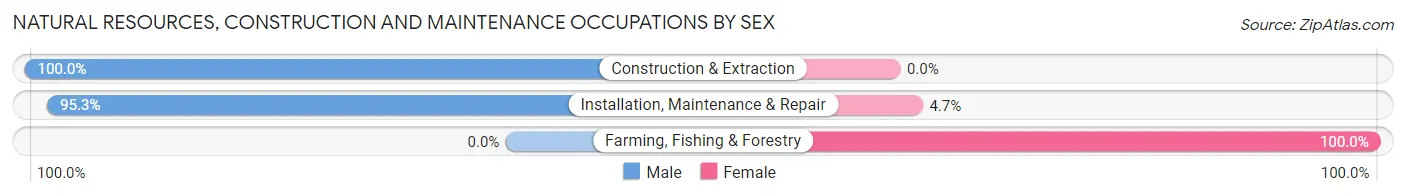
| Occupation | Male | Female |
| Farming, Fishing & Forestry | 0 (0.0%) | 6 (100.0%) |
| Construction & Extraction | 1 (100.0%) | 0 (0.0%) |
| Installation, Maintenance & Repair | 122 (95.3%) | 6 (4.7%) |
| Total (Category) | 123 (91.1%) | 12 (8.9%) |
| Total (Overall) | 586 (50.5%) | 574 (49.5%) |
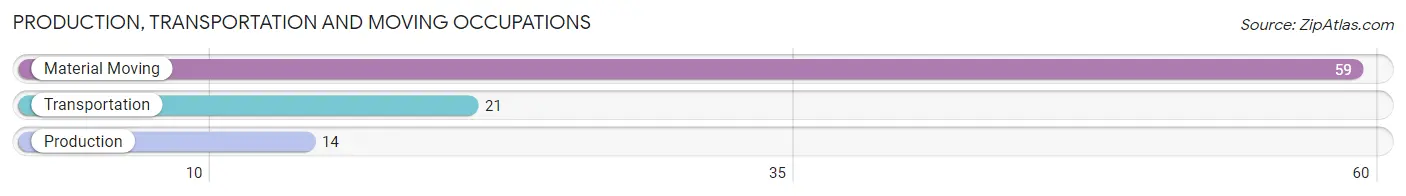
Production, Transportation and Moving Occupations
The most common Production, Transportation and Moving occupations in Eleele are Material Moving (59 | 5.1%), Transportation (21 | 1.8%), and Production (14 | 1.2%).
Production, Transportation and Moving Occupations by Sex
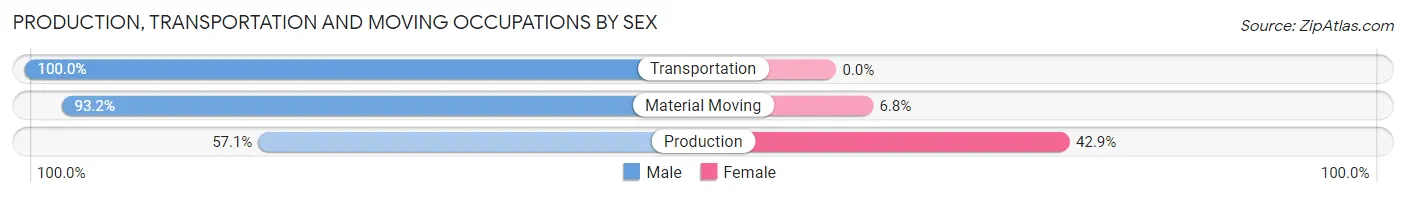
| Occupation | Male | Female |
| Production | 8 (57.1%) | 6 (42.9%) |
| Transportation | 21 (100.0%) | 0 (0.0%) |
| Material Moving | 55 (93.2%) | 4 (6.8%) |
| Total (Category) | 84 (89.4%) | 10 (10.6%) |
| Total (Overall) | 586 (50.5%) | 574 (49.5%) |
Employment Industries by Sex in Eleele
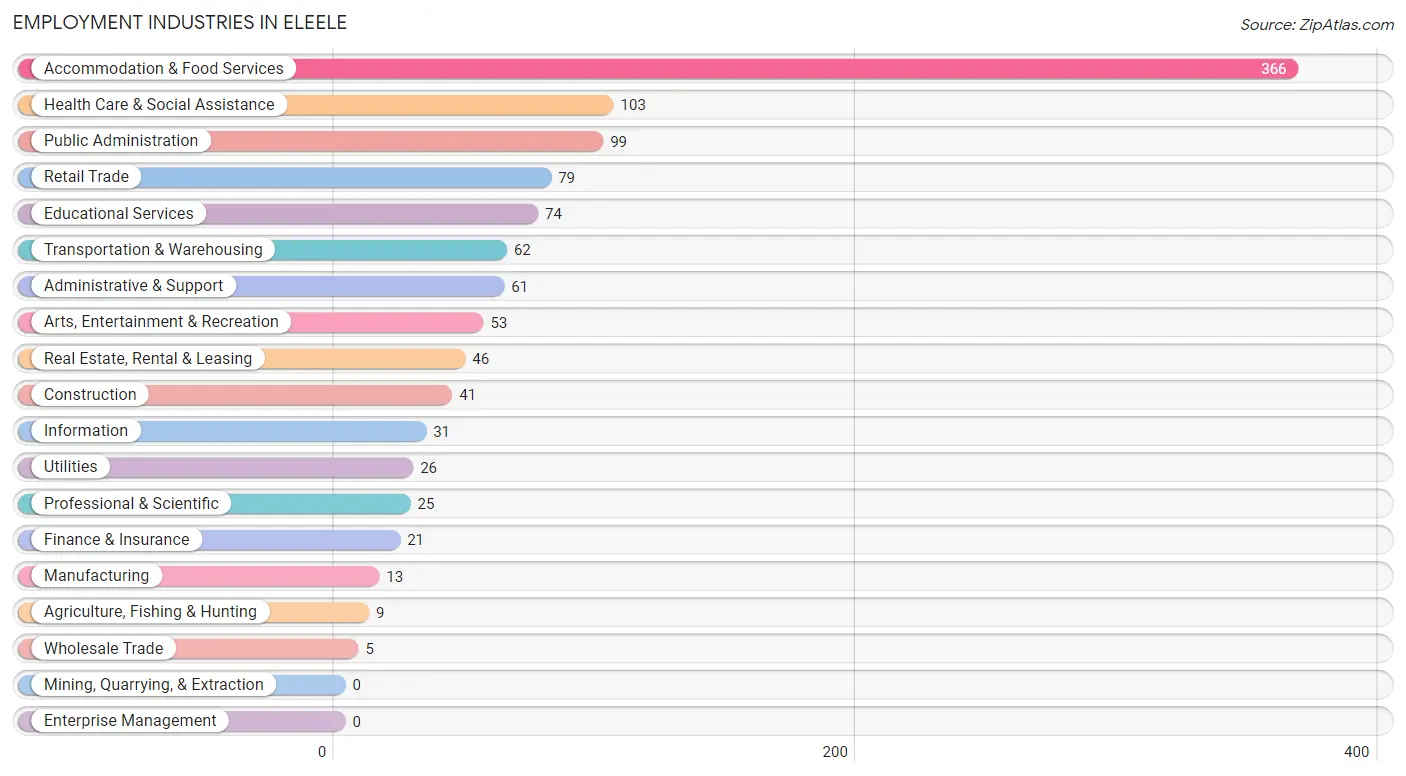
Employment Industries in Eleele
The major employment industries in Eleele include Accommodation & Food Services (366 | 31.6%), Health Care & Social Assistance (103 | 8.9%), Public Administration (99 | 8.5%), Retail Trade (79 | 6.8%), and Educational Services (74 | 6.4%).
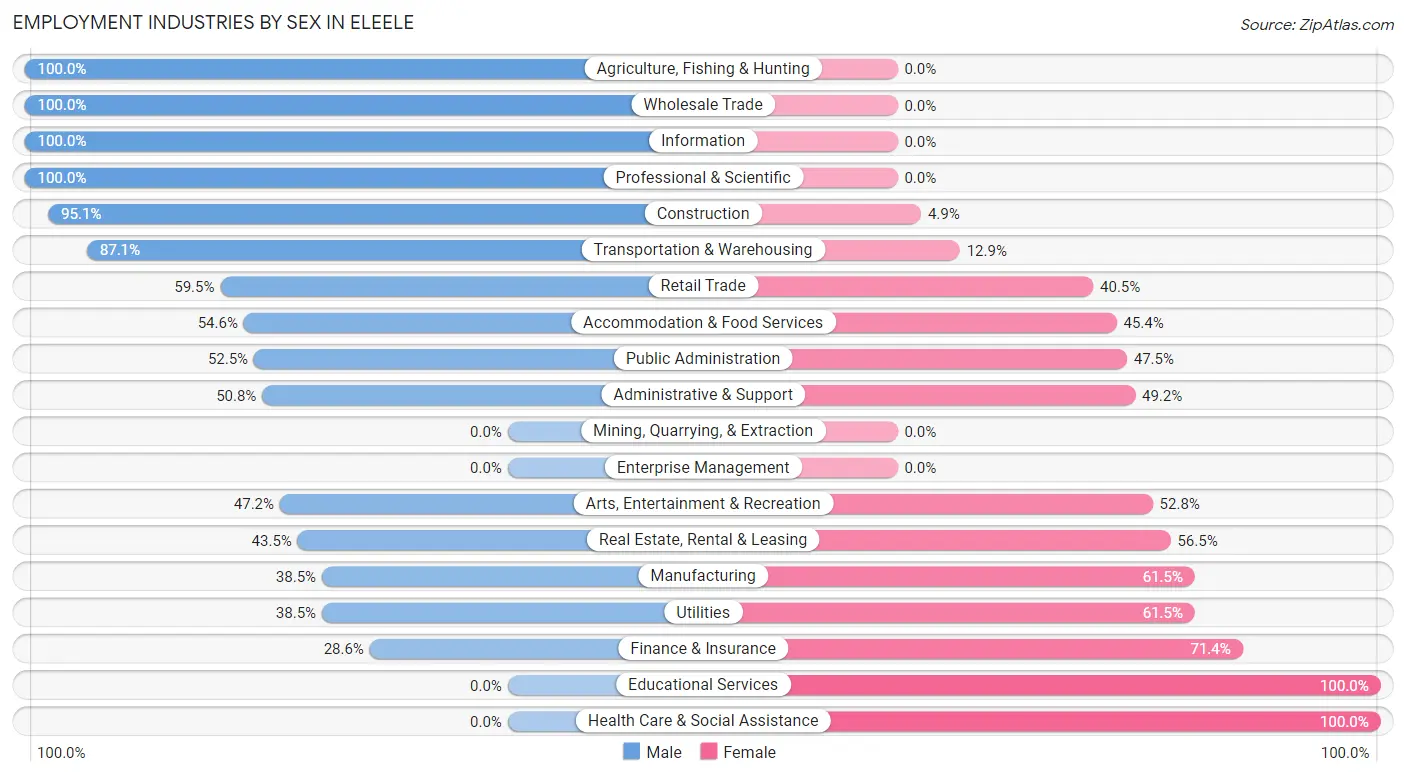
Employment Industries by Sex in Eleele
The Eleele industries that see more men than women are Agriculture, Fishing & Hunting (100.0%), Wholesale Trade (100.0%), and Information (100.0%), whereas the industries that tend to have a higher number of women are Educational Services (100.0%), Health Care & Social Assistance (100.0%), and Finance & Insurance (71.4%).
| Industry | Male | Female |
| Agriculture, Fishing & Hunting | 9 (100.0%) | 0 (0.0%) |
| Mining, Quarrying, & Extraction | 0 (0.0%) | 0 (0.0%) |
| Construction | 39 (95.1%) | 2 (4.9%) |
| Manufacturing | 5 (38.5%) | 8 (61.5%) |
| Wholesale Trade | 5 (100.0%) | 0 (0.0%) |
| Retail Trade | 47 (59.5%) | 32 (40.5%) |
| Transportation & Warehousing | 54 (87.1%) | 8 (12.9%) |
| Utilities | 10 (38.5%) | 16 (61.5%) |
| Information | 31 (100.0%) | 0 (0.0%) |
| Finance & Insurance | 6 (28.6%) | 15 (71.4%) |
| Real Estate, Rental & Leasing | 20 (43.5%) | 26 (56.5%) |
| Professional & Scientific | 25 (100.0%) | 0 (0.0%) |
| Enterprise Management | 0 (0.0%) | 0 (0.0%) |
| Administrative & Support | 31 (50.8%) | 30 (49.2%) |
| Educational Services | 0 (0.0%) | 74 (100.0%) |
| Health Care & Social Assistance | 0 (0.0%) | 103 (100.0%) |
| Arts, Entertainment & Recreation | 25 (47.2%) | 28 (52.8%) |
| Accommodation & Food Services | 200 (54.6%) | 166 (45.4%) |
| Public Administration | 52 (52.5%) | 47 (47.5%) |
| Total | 586 (50.5%) | 574 (49.5%) |
Education in Eleele
School Enrollment in Eleele
The most common levels of schooling among the 530 students in Eleele are middle school (154 | 29.1%), elementary school (110 | 20.7%), and nursery / preschool (93 | 17.5%).
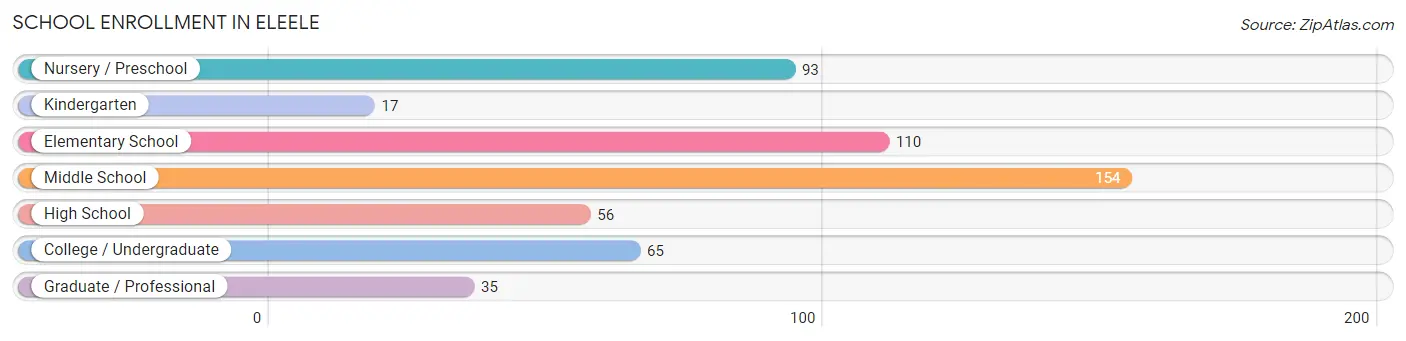
| School Level | # Students | % Students |
| Nursery / Preschool | 93 | 17.5% |
| Kindergarten | 17 | 3.2% |
| Elementary School | 110 | 20.7% |
| Middle School | 154 | 29.1% |
| High School | 56 | 10.6% |
| College / Undergraduate | 65 | 12.3% |
| Graduate / Professional | 35 | 6.6% |
| Total | 530 | 100.0% |
School Enrollment by Age by Funding Source in Eleele
Out of a total of 530 students who are enrolled in schools in Eleele, 139 (26.2%) attend a private institution, while the remaining 391 (73.8%) are enrolled in public schools. The age group of 3 to 4 year olds has the highest likelihood of being enrolled in private schools, with 65 (86.7% in the age bracket) enrolled. Conversely, the age group of 15 to 17 year olds has the lowest likelihood of being enrolled in a private school, with 50 (100.0% in the age bracket) attending a public institution.
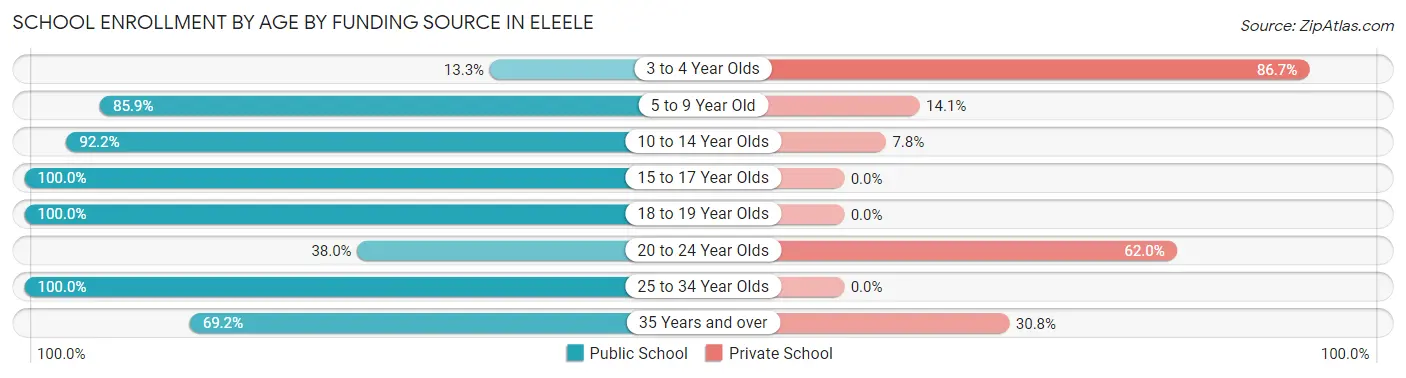
| Age Bracket | Public School | Private School |
| 3 to 4 Year Olds | 10 (13.3%) | 65 (86.7%) |
| 5 to 9 Year Old | 110 (85.9%) | 18 (14.1%) |
| 10 to 14 Year Olds | 154 (92.2%) | 13 (7.8%) |
| 15 to 17 Year Olds | 50 (100.0%) | 0 (0.0%) |
| 18 to 19 Year Olds | 6 (100.0%) | 0 (0.0%) |
| 20 to 24 Year Olds | 19 (38.0%) | 31 (62.0%) |
| 25 to 34 Year Olds | 15 (100.0%) | 0 (0.0%) |
| 35 Years and over | 27 (69.2%) | 12 (30.8%) |
| Total | 391 (73.8%) | 139 (26.2%) |
Educational Attainment by Field of Study in Eleele
Science & technology (61 | 23.4%), education (49 | 18.8%), bio, nature & agricultural (29 | 11.1%), business (28 | 10.7%), and psychology (24 | 9.2%) are the most common fields of study among 261 individuals in Eleele who have obtained a bachelor's degree or higher.
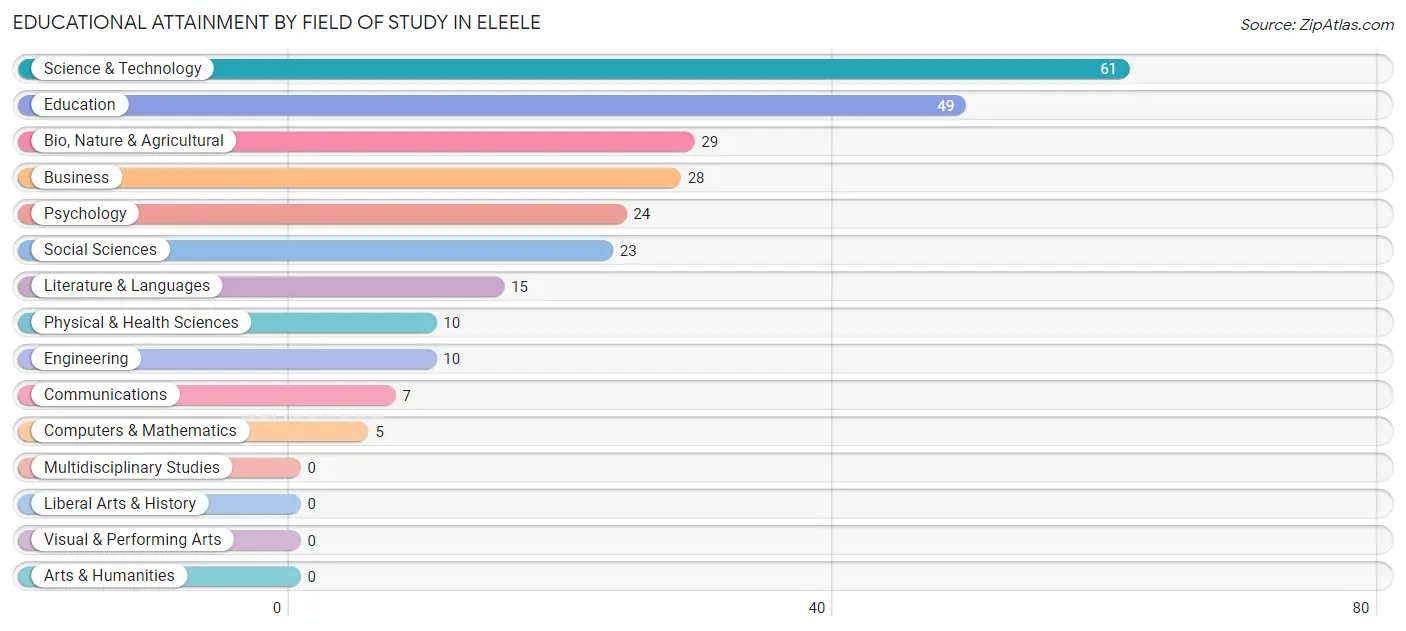
| Field of Study | # Graduates | % Graduates |
| Computers & Mathematics | 5 | 1.9% |
| Bio, Nature & Agricultural | 29 | 11.1% |
| Physical & Health Sciences | 10 | 3.8% |
| Psychology | 24 | 9.2% |
| Social Sciences | 23 | 8.8% |
| Engineering | 10 | 3.8% |
| Multidisciplinary Studies | 0 | 0.0% |
| Science & Technology | 61 | 23.4% |
| Business | 28 | 10.7% |
| Education | 49 | 18.8% |
| Literature & Languages | 15 | 5.8% |
| Liberal Arts & History | 0 | 0.0% |
| Visual & Performing Arts | 0 | 0.0% |
| Communications | 7 | 2.7% |
| Arts & Humanities | 0 | 0.0% |
| Total | 261 | 100.0% |
Transportation & Commute in Eleele
Vehicle Availability by Sex in Eleele
The most prevalent vehicle ownership categories in Eleele are males with 3 vehicles (204, accounting for 34.6%) and females with 3 vehicles (203, making up 40.6%).
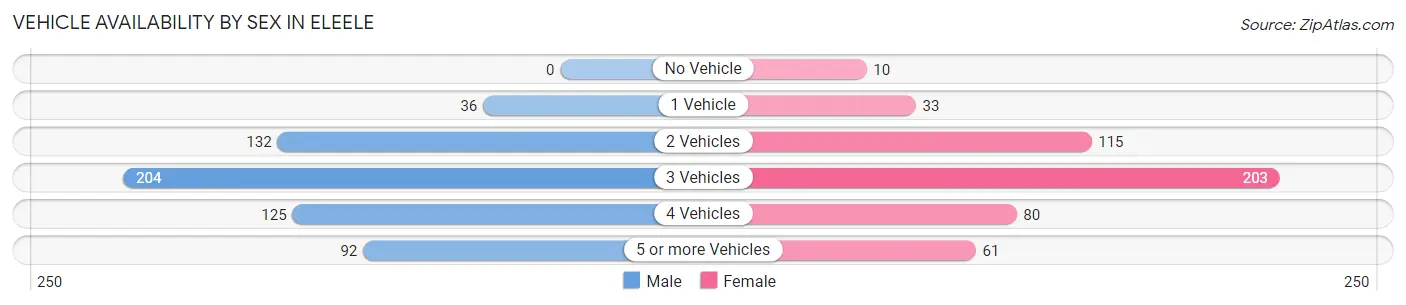
| Vehicles Available | Male | Female |
| No Vehicle | 0 (0.0%) | 10 (2.0%) |
| 1 Vehicle | 36 (6.1%) | 33 (6.6%) |
| 2 Vehicles | 132 (22.4%) | 115 (22.9%) |
| 3 Vehicles | 204 (34.6%) | 203 (40.4%) |
| 4 Vehicles | 125 (21.2%) | 80 (15.9%) |
| 5 or more Vehicles | 92 (15.6%) | 61 (12.1%) |
| Total | 589 (100.0%) | 502 (100.0%) |
Commute Time in Eleele
The most frequently occuring commute durations in Eleele are 30 to 34 minutes (292 commuters, 27.5%), 20 to 24 minutes (193 commuters, 18.2%), and 25 to 29 minutes (129 commuters, 12.1%).
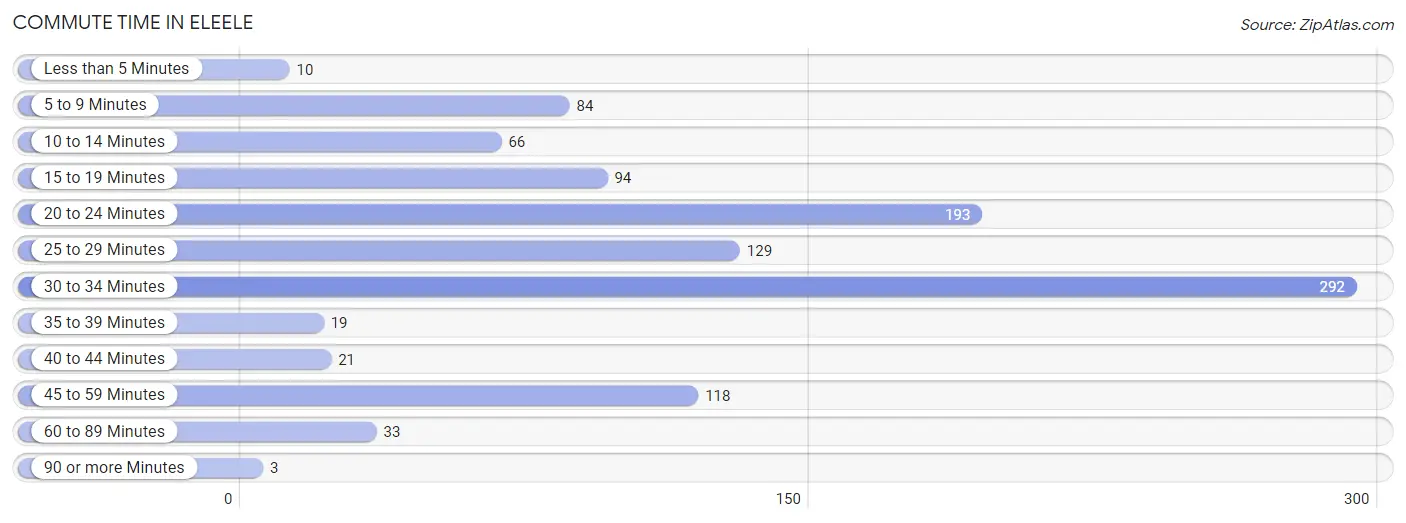
| Commute Time | # Commuters | % Commuters |
| Less than 5 Minutes | 10 | 0.9% |
| 5 to 9 Minutes | 84 | 7.9% |
| 10 to 14 Minutes | 66 | 6.2% |
| 15 to 19 Minutes | 94 | 8.8% |
| 20 to 24 Minutes | 193 | 18.2% |
| 25 to 29 Minutes | 129 | 12.1% |
| 30 to 34 Minutes | 292 | 27.5% |
| 35 to 39 Minutes | 19 | 1.8% |
| 40 to 44 Minutes | 21 | 2.0% |
| 45 to 59 Minutes | 118 | 11.1% |
| 60 to 89 Minutes | 33 | 3.1% |
| 90 or more Minutes | 3 | 0.3% |
Commute Time by Sex in Eleele
The most common commute times in Eleele are 30 to 34 minutes (179 commuters, 31.0%) for males and 30 to 34 minutes (113 commuters, 23.3%) for females.
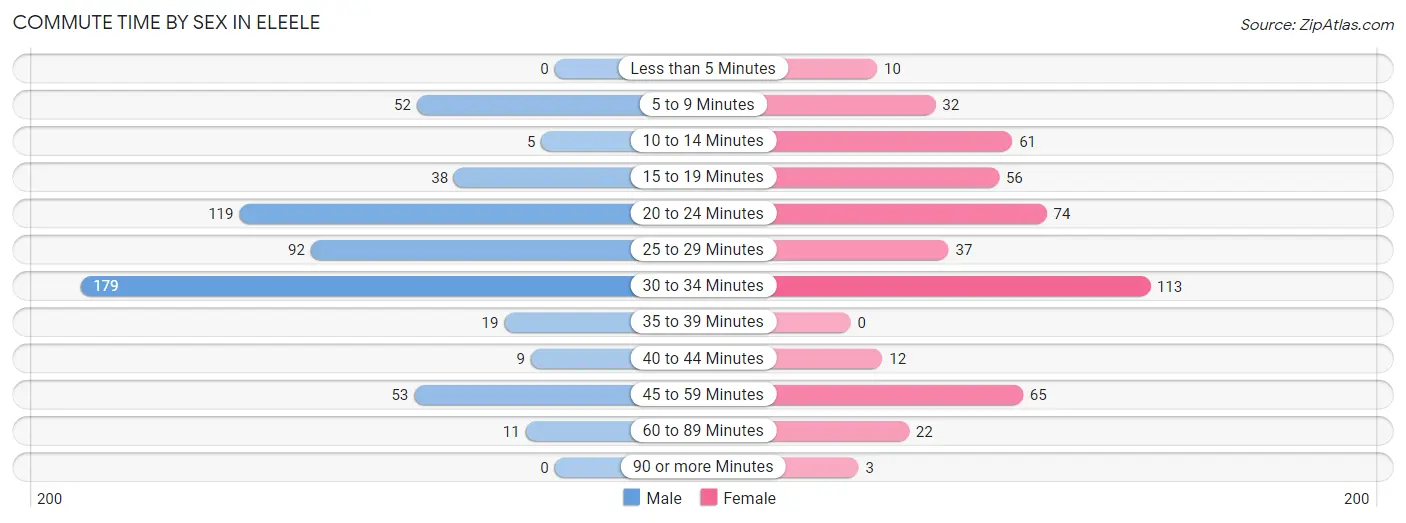
| Commute Time | Male | Female |
| Less than 5 Minutes | 0 (0.0%) | 10 (2.1%) |
| 5 to 9 Minutes | 52 (9.0%) | 32 (6.6%) |
| 10 to 14 Minutes | 5 (0.9%) | 61 (12.6%) |
| 15 to 19 Minutes | 38 (6.6%) | 56 (11.6%) |
| 20 to 24 Minutes | 119 (20.6%) | 74 (15.3%) |
| 25 to 29 Minutes | 92 (15.9%) | 37 (7.6%) |
| 30 to 34 Minutes | 179 (31.0%) | 113 (23.3%) |
| 35 to 39 Minutes | 19 (3.3%) | 0 (0.0%) |
| 40 to 44 Minutes | 9 (1.6%) | 12 (2.5%) |
| 45 to 59 Minutes | 53 (9.2%) | 65 (13.4%) |
| 60 to 89 Minutes | 11 (1.9%) | 22 (4.5%) |
| 90 or more Minutes | 0 (0.0%) | 3 (0.6%) |
Time of Departure to Work by Sex in Eleele
The most frequent times of departure to work in Eleele are 6:30 AM to 6:59 AM (82, 14.2%) for males and 7:00 AM to 7:29 AM (85, 17.5%) for females.
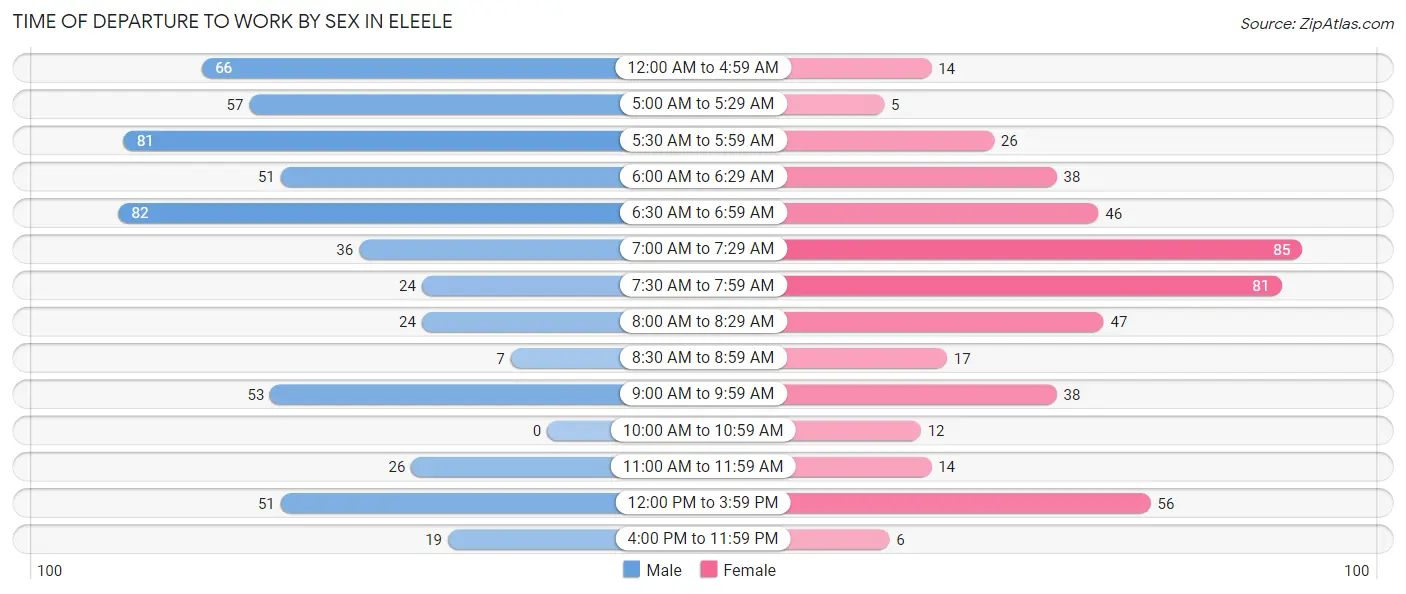
| Time of Departure | Male | Female |
| 12:00 AM to 4:59 AM | 66 (11.4%) | 14 (2.9%) |
| 5:00 AM to 5:29 AM | 57 (9.9%) | 5 (1.0%) |
| 5:30 AM to 5:59 AM | 81 (14.0%) | 26 (5.4%) |
| 6:00 AM to 6:29 AM | 51 (8.8%) | 38 (7.8%) |
| 6:30 AM to 6:59 AM | 82 (14.2%) | 46 (9.5%) |
| 7:00 AM to 7:29 AM | 36 (6.2%) | 85 (17.5%) |
| 7:30 AM to 7:59 AM | 24 (4.2%) | 81 (16.7%) |
| 8:00 AM to 8:29 AM | 24 (4.2%) | 47 (9.7%) |
| 8:30 AM to 8:59 AM | 7 (1.2%) | 17 (3.5%) |
| 9:00 AM to 9:59 AM | 53 (9.2%) | 38 (7.8%) |
| 10:00 AM to 10:59 AM | 0 (0.0%) | 12 (2.5%) |
| 11:00 AM to 11:59 AM | 26 (4.5%) | 14 (2.9%) |
| 12:00 PM to 3:59 PM | 51 (8.8%) | 56 (11.6%) |
| 4:00 PM to 11:59 PM | 19 (3.3%) | 6 (1.2%) |
| Total | 577 (100.0%) | 485 (100.0%) |
Housing Occupancy in Eleele
Occupancy by Ownership in Eleele
Of the total 641 dwellings in Eleele, owner-occupied units account for 425 (66.3%), while renter-occupied units make up 216 (33.7%).
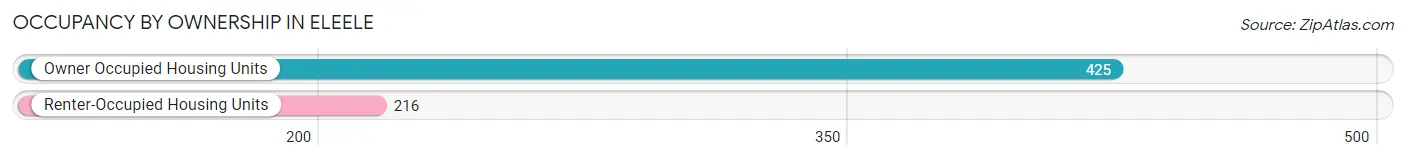
| Occupancy | # Housing Units | % Housing Units |
| Owner Occupied Housing Units | 425 | 66.3% |
| Renter-Occupied Housing Units | 216 | 33.7% |
| Total Occupied Housing Units | 641 | 100.0% |
Occupancy by Household Size in Eleele
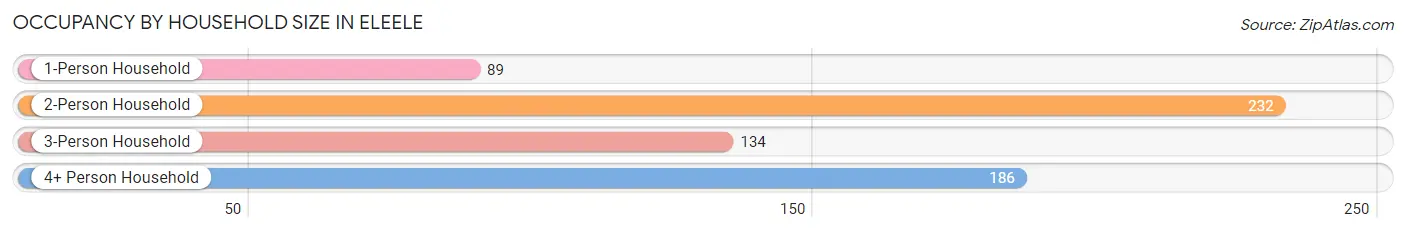
| Household Size | # Housing Units | % Housing Units |
| 1-Person Household | 89 | 13.9% |
| 2-Person Household | 232 | 36.2% |
| 3-Person Household | 134 | 20.9% |
| 4+ Person Household | 186 | 29.0% |
| Total Housing Units | 641 | 100.0% |
Occupancy by Ownership by Household Size in Eleele
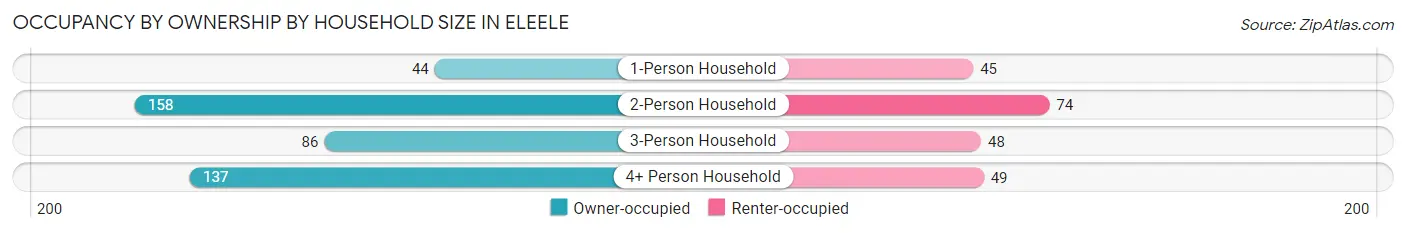
| Household Size | Owner-occupied | Renter-occupied |
| 1-Person Household | 44 (49.4%) | 45 (50.6%) |
| 2-Person Household | 158 (68.1%) | 74 (31.9%) |
| 3-Person Household | 86 (64.2%) | 48 (35.8%) |
| 4+ Person Household | 137 (73.7%) | 49 (26.3%) |
| Total Housing Units | 425 (66.3%) | 216 (33.7%) |
Occupancy by Educational Attainment in Eleele
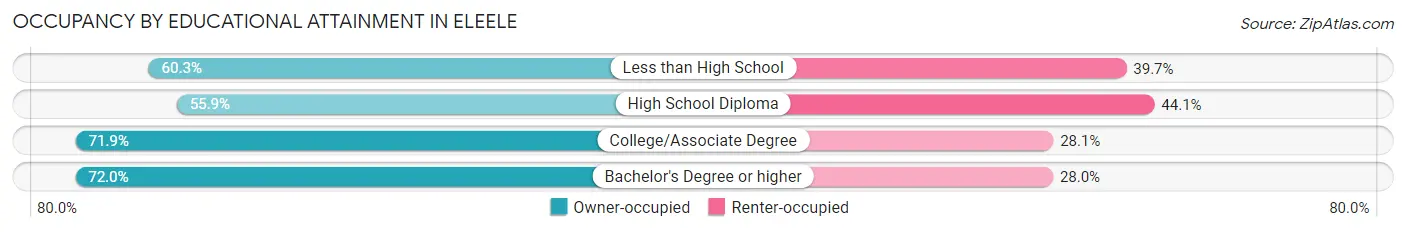
| Household Size | Owner-occupied | Renter-occupied |
| Less than High School | 38 (60.3%) | 25 (39.7%) |
| High School Diploma | 100 (55.9%) | 79 (44.1%) |
| College/Associate Degree | 210 (71.9%) | 82 (28.1%) |
| Bachelor's Degree or higher | 77 (72.0%) | 30 (28.0%) |
Occupancy by Age of Householder in Eleele
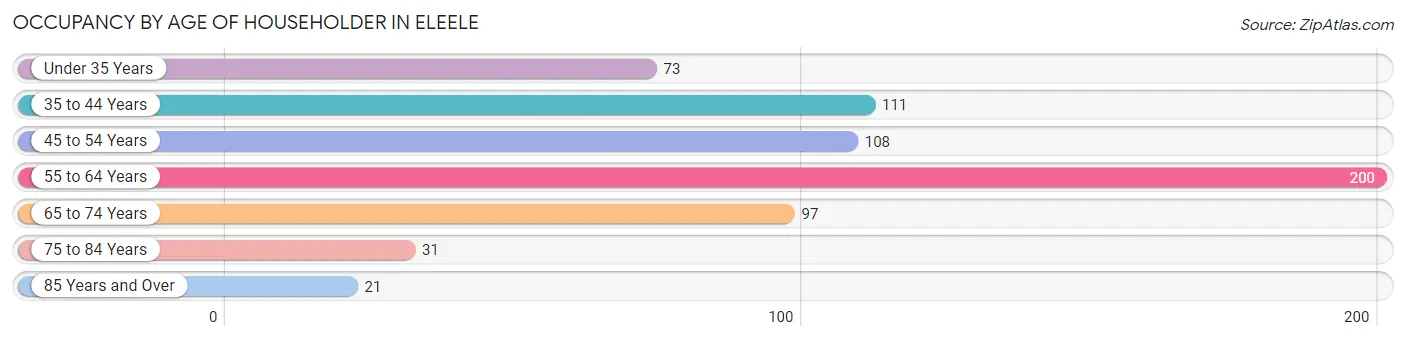
| Age Bracket | # Households | % Households |
| Under 35 Years | 73 | 11.4% |
| 35 to 44 Years | 111 | 17.3% |
| 45 to 54 Years | 108 | 16.9% |
| 55 to 64 Years | 200 | 31.2% |
| 65 to 74 Years | 97 | 15.1% |
| 75 to 84 Years | 31 | 4.8% |
| 85 Years and Over | 21 | 3.3% |
| Total | 641 | 100.0% |
Housing Finances in Eleele
Median Income by Occupancy in Eleele
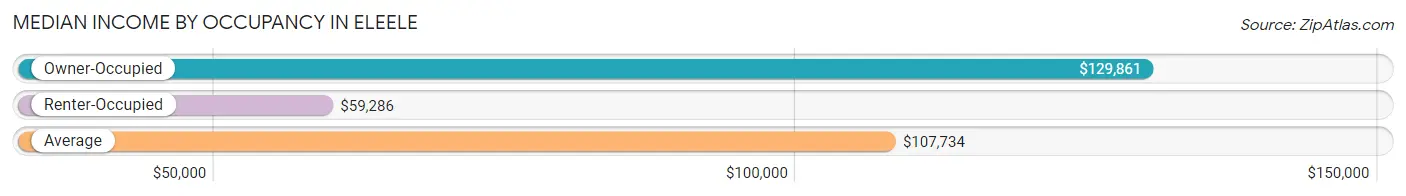
| Occupancy Type | # Households | Median Income |
| Owner-Occupied | 425 (66.3%) | $129,861 |
| Renter-Occupied | 216 (33.7%) | $59,286 |
| Average | 641 (100.0%) | $107,734 |
Occupancy by Householder Income Bracket in Eleele
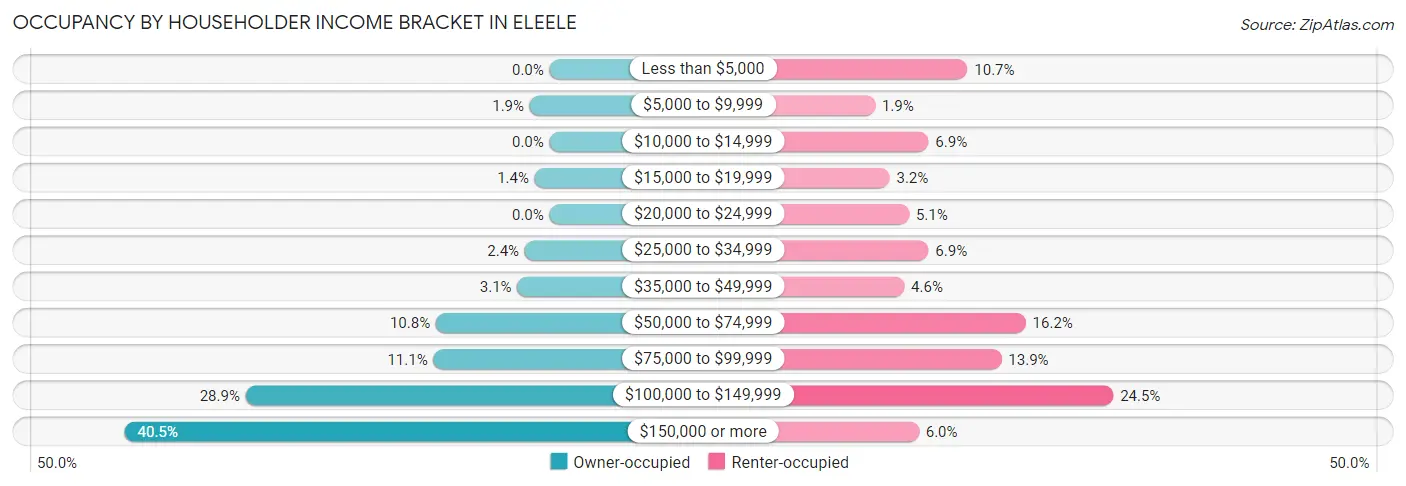
| Income Bracket | Owner-occupied | Renter-occupied |
| Less than $5,000 | 0 (0.0%) | 23 (10.6%) |
| $5,000 to $9,999 | 8 (1.9%) | 4 (1.8%) |
| $10,000 to $14,999 | 0 (0.0%) | 15 (6.9%) |
| $15,000 to $19,999 | 6 (1.4%) | 7 (3.2%) |
| $20,000 to $24,999 | 0 (0.0%) | 11 (5.1%) |
| $25,000 to $34,999 | 10 (2.4%) | 15 (6.9%) |
| $35,000 to $49,999 | 13 (3.1%) | 10 (4.6%) |
| $50,000 to $74,999 | 46 (10.8%) | 35 (16.2%) |
| $75,000 to $99,999 | 47 (11.1%) | 30 (13.9%) |
| $100,000 to $149,999 | 123 (28.9%) | 53 (24.5%) |
| $150,000 or more | 172 (40.5%) | 13 (6.0%) |
| Total | 425 (100.0%) | 216 (100.0%) |
Monthly Housing Cost Tiers in Eleele
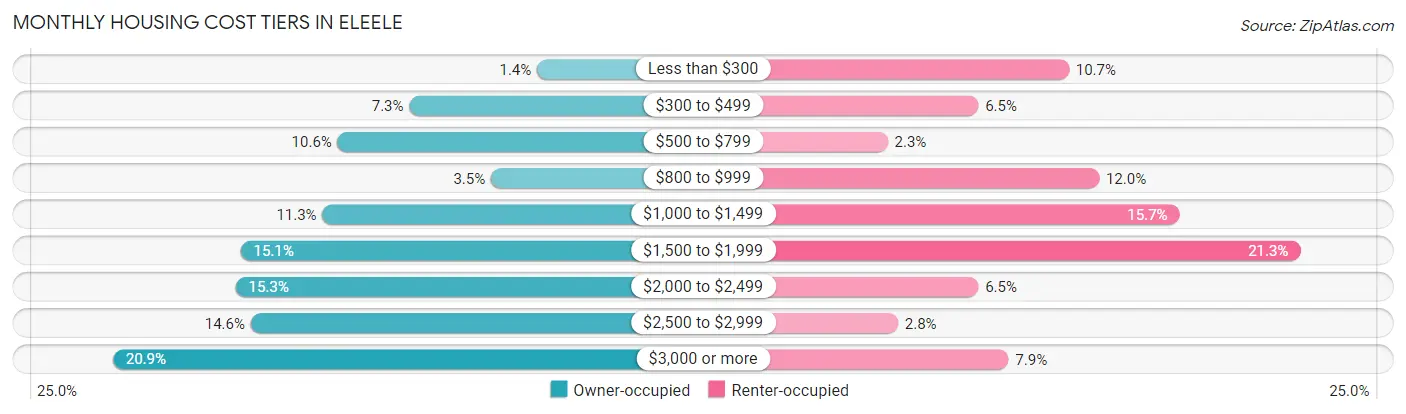
| Monthly Cost | Owner-occupied | Renter-occupied |
| Less than $300 | 6 (1.4%) | 23 (10.6%) |
| $300 to $499 | 31 (7.3%) | 14 (6.5%) |
| $500 to $799 | 45 (10.6%) | 5 (2.3%) |
| $800 to $999 | 15 (3.5%) | 26 (12.0%) |
| $1,000 to $1,499 | 48 (11.3%) | 34 (15.7%) |
| $1,500 to $1,999 | 64 (15.1%) | 46 (21.3%) |
| $2,000 to $2,499 | 65 (15.3%) | 14 (6.5%) |
| $2,500 to $2,999 | 62 (14.6%) | 6 (2.8%) |
| $3,000 or more | 89 (20.9%) | 17 (7.9%) |
| Total | 425 (100.0%) | 216 (100.0%) |
Physical Housing Characteristics in Eleele
Housing Structures in Eleele
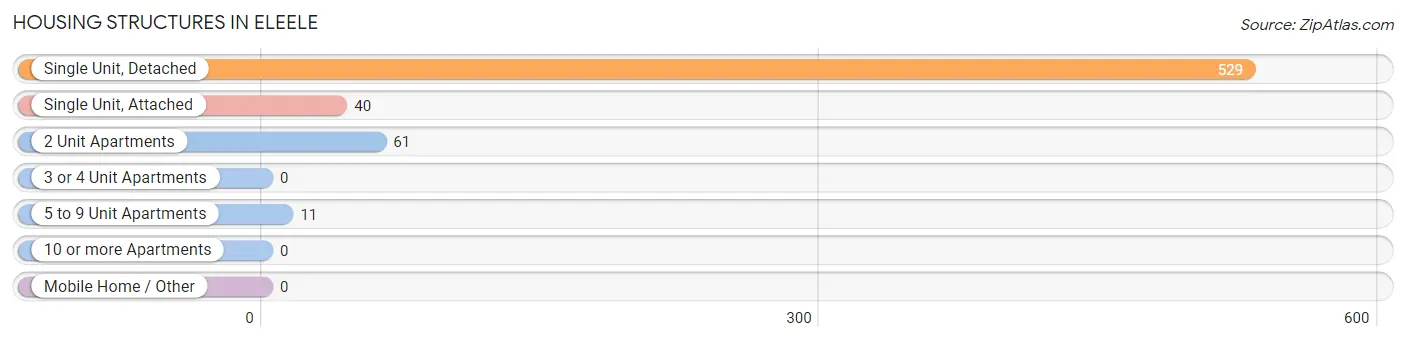
| Structure Type | # Housing Units | % Housing Units |
| Single Unit, Detached | 529 | 82.5% |
| Single Unit, Attached | 40 | 6.2% |
| 2 Unit Apartments | 61 | 9.5% |
| 3 or 4 Unit Apartments | 0 | 0.0% |
| 5 to 9 Unit Apartments | 11 | 1.7% |
| 10 or more Apartments | 0 | 0.0% |
| Mobile Home / Other | 0 | 0.0% |
| Total | 641 | 100.0% |
Housing Structures by Occupancy in Eleele
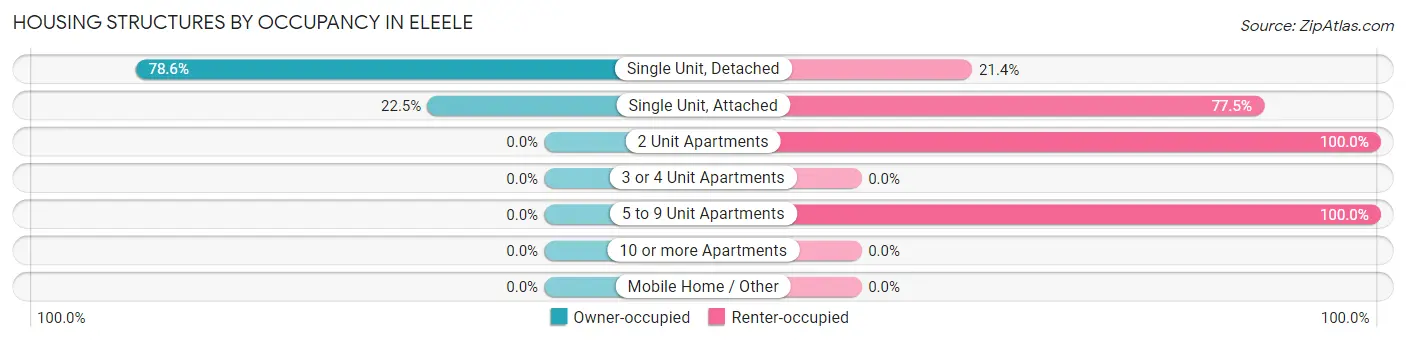
| Structure Type | Owner-occupied | Renter-occupied |
| Single Unit, Detached | 416 (78.6%) | 113 (21.4%) |
| Single Unit, Attached | 9 (22.5%) | 31 (77.5%) |
| 2 Unit Apartments | 0 (0.0%) | 61 (100.0%) |
| 3 or 4 Unit Apartments | 0 (0.0%) | 0 (0.0%) |
| 5 to 9 Unit Apartments | 0 (0.0%) | 11 (100.0%) |
| 10 or more Apartments | 0 (0.0%) | 0 (0.0%) |
| Mobile Home / Other | 0 (0.0%) | 0 (0.0%) |
| Total | 425 (66.3%) | 216 (33.7%) |
Housing Structures by Number of Rooms in Eleele
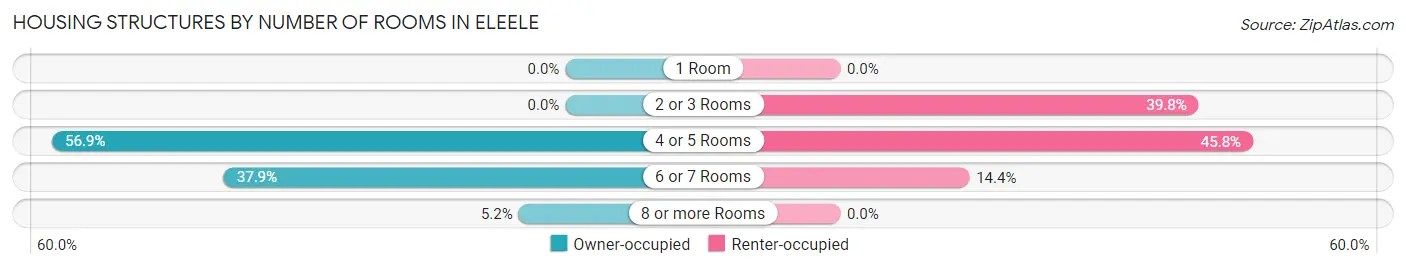
| Number of Rooms | Owner-occupied | Renter-occupied |
| 1 Room | 0 (0.0%) | 0 (0.0%) |
| 2 or 3 Rooms | 0 (0.0%) | 86 (39.8%) |
| 4 or 5 Rooms | 242 (56.9%) | 99 (45.8%) |
| 6 or 7 Rooms | 161 (37.9%) | 31 (14.3%) |
| 8 or more Rooms | 22 (5.2%) | 0 (0.0%) |
| Total | 425 (100.0%) | 216 (100.0%) |
Housing Structure by Heating Type in Eleele
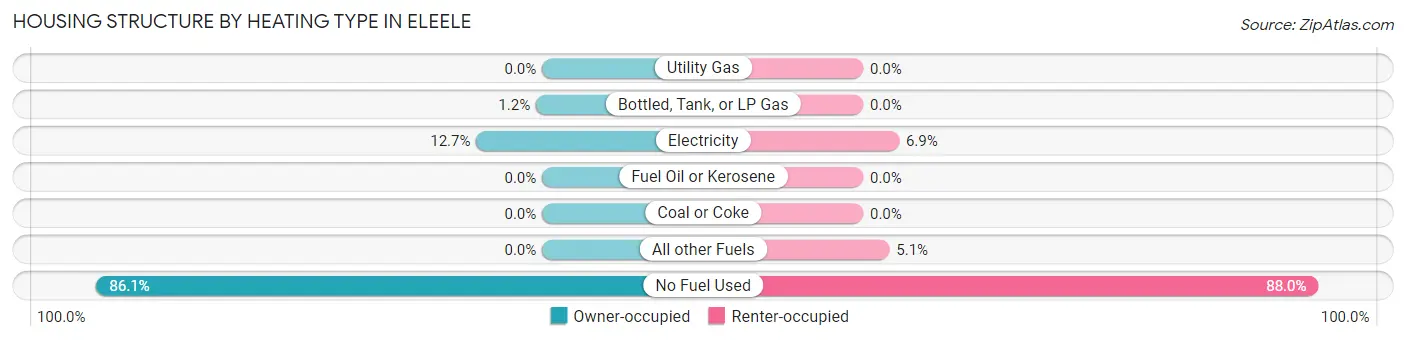
| Heating Type | Owner-occupied | Renter-occupied |
| Utility Gas | 0 (0.0%) | 0 (0.0%) |
| Bottled, Tank, or LP Gas | 5 (1.2%) | 0 (0.0%) |
| Electricity | 54 (12.7%) | 15 (6.9%) |
| Fuel Oil or Kerosene | 0 (0.0%) | 0 (0.0%) |
| Coal or Coke | 0 (0.0%) | 0 (0.0%) |
| All other Fuels | 0 (0.0%) | 11 (5.1%) |
| No Fuel Used | 366 (86.1%) | 190 (88.0%) |
| Total | 425 (100.0%) | 216 (100.0%) |
Household Vehicle Usage in Eleele
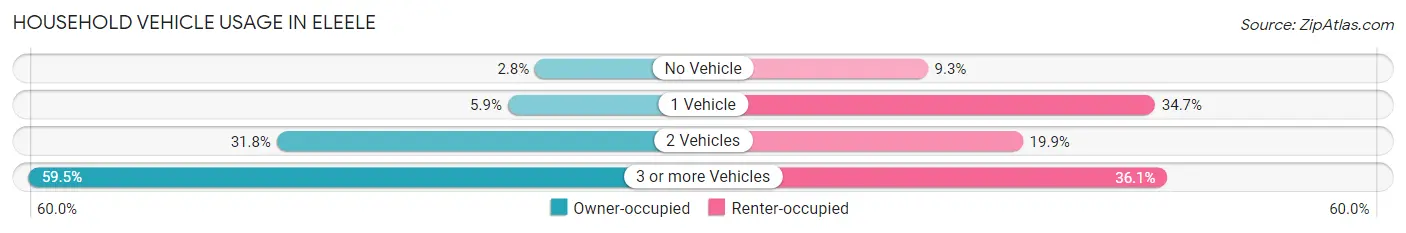
| Vehicles per Household | Owner-occupied | Renter-occupied |
| No Vehicle | 12 (2.8%) | 20 (9.3%) |
| 1 Vehicle | 25 (5.9%) | 75 (34.7%) |
| 2 Vehicles | 135 (31.8%) | 43 (19.9%) |
| 3 or more Vehicles | 253 (59.5%) | 78 (36.1%) |
| Total | 425 (100.0%) | 216 (100.0%) |
Real Estate & Mortgages in Eleele
Real Estate and Mortgage Overview in Eleele
| Characteristic | Without Mortgage | With Mortgage |
| Housing Units | 98 | 327 |
| Median Property Value | $650,000 | $626,200 |
| Median Household Income | $93,750 | $136 |
| Monthly Housing Costs | $555 | $89 |
| Real Estate Taxes | $1,455 | $5 |
Property Value by Mortgage Status in Eleele
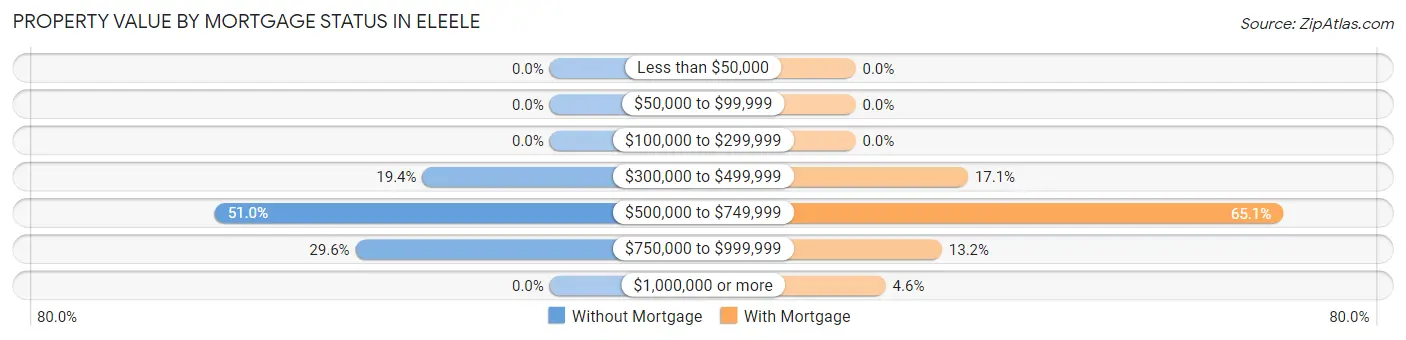
| Property Value | Without Mortgage | With Mortgage |
| Less than $50,000 | 0 (0.0%) | 0 (0.0%) |
| $50,000 to $99,999 | 0 (0.0%) | 0 (0.0%) |
| $100,000 to $299,999 | 0 (0.0%) | 0 (0.0%) |
| $300,000 to $499,999 | 19 (19.4%) | 56 (17.1%) |
| $500,000 to $749,999 | 50 (51.0%) | 213 (65.1%) |
| $750,000 to $999,999 | 29 (29.6%) | 43 (13.2%) |
| $1,000,000 or more | 0 (0.0%) | 15 (4.6%) |
| Total | 98 (100.0%) | 327 (100.0%) |
Household Income by Mortgage Status in Eleele
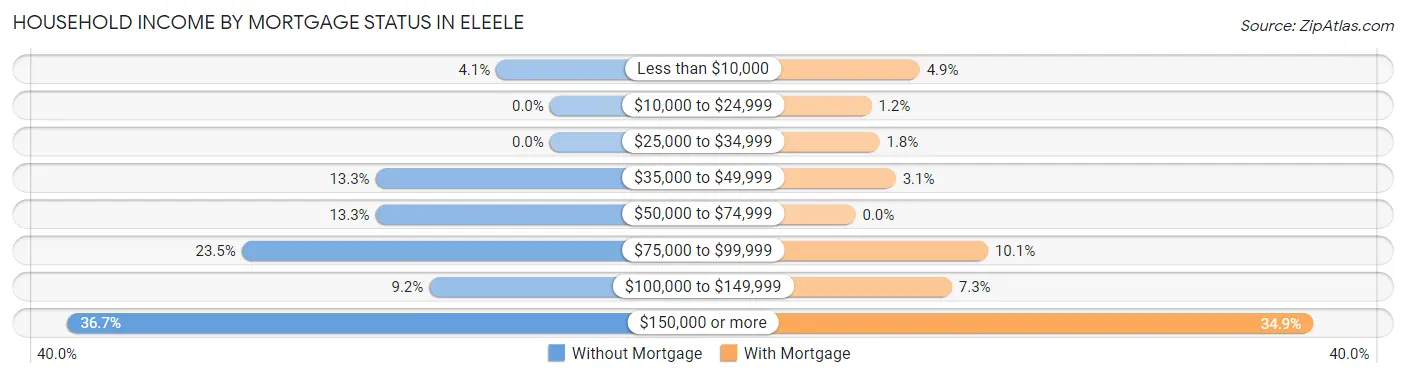
| Household Income | Without Mortgage | With Mortgage |
| Less than $10,000 | 4 (4.1%) | 16 (4.9%) |
| $10,000 to $24,999 | 0 (0.0%) | 4 (1.2%) |
| $25,000 to $34,999 | 0 (0.0%) | 6 (1.8%) |
| $35,000 to $49,999 | 13 (13.3%) | 10 (3.1%) |
| $50,000 to $74,999 | 13 (13.3%) | 0 (0.0%) |
| $75,000 to $99,999 | 23 (23.5%) | 33 (10.1%) |
| $100,000 to $149,999 | 9 (9.2%) | 24 (7.3%) |
| $150,000 or more | 36 (36.7%) | 114 (34.9%) |
| Total | 98 (100.0%) | 327 (100.0%) |
Property Value to Household Income Ratio in Eleele
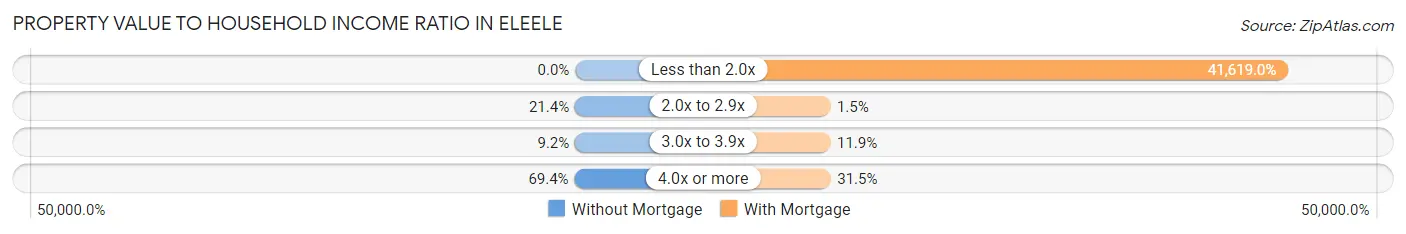
| Value-to-Income Ratio | Without Mortgage | With Mortgage |
| Less than 2.0x | 0 (0.0%) | 136,094 (41,619.0%) |
| 2.0x to 2.9x | 21 (21.4%) | 5 (1.5%) |
| 3.0x to 3.9x | 9 (9.2%) | 39 (11.9%) |
| 4.0x or more | 68 (69.4%) | 103 (31.5%) |
| Total | 98 (100.0%) | 327 (100.0%) |
Real Estate Taxes by Mortgage Status in Eleele
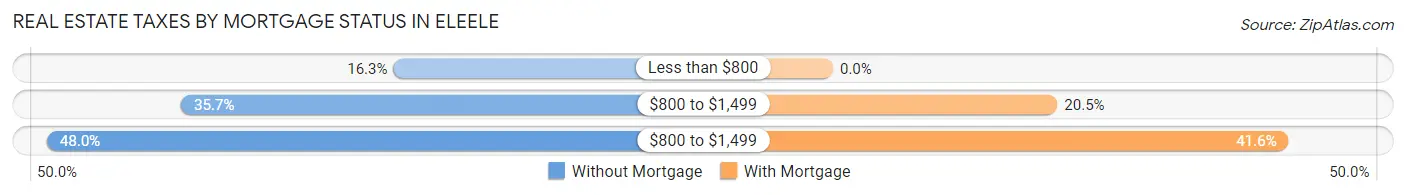
| Property Taxes | Without Mortgage | With Mortgage |
| Less than $800 | 16 (16.3%) | 0 (0.0%) |
| $800 to $1,499 | 35 (35.7%) | 67 (20.5%) |
| $800 to $1,499 | 47 (48.0%) | 136 (41.6%) |
| Total | 98 (100.0%) | 327 (100.0%) |
Health & Disability in Eleele
Health Insurance Coverage by Age in Eleele
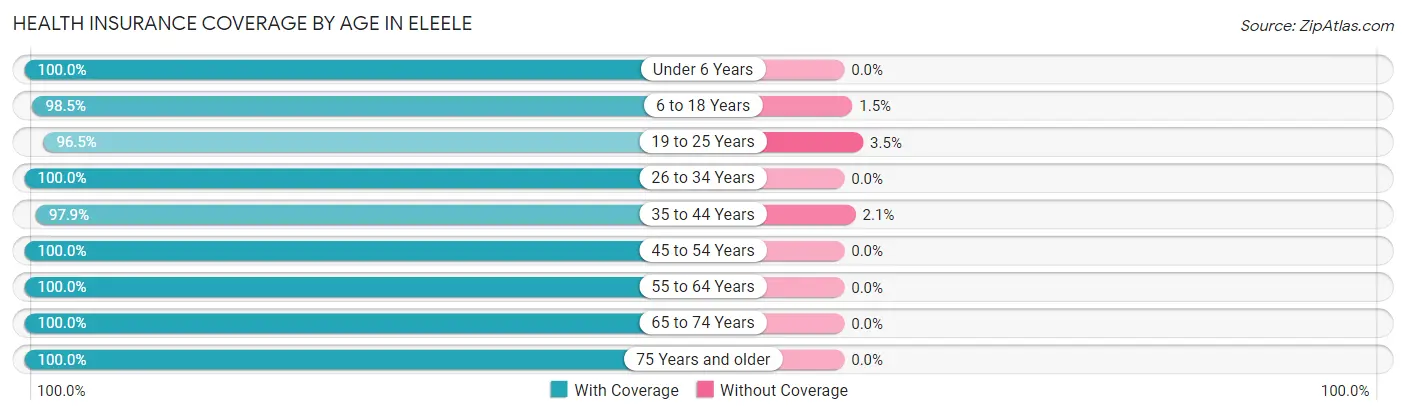
| Age Bracket | With Coverage | Without Coverage |
| Under 6 Years | 264 (100.0%) | 0 (0.0%) |
| 6 to 18 Years | 328 (98.5%) | 5 (1.5%) |
| 19 to 25 Years | 247 (96.5%) | 9 (3.5%) |
| 26 to 34 Years | 240 (100.0%) | 0 (0.0%) |
| 35 to 44 Years | 232 (97.9%) | 5 (2.1%) |
| 45 to 54 Years | 265 (100.0%) | 0 (0.0%) |
| 55 to 64 Years | 369 (100.0%) | 0 (0.0%) |
| 65 to 74 Years | 186 (100.0%) | 0 (0.0%) |
| 75 Years and older | 91 (100.0%) | 0 (0.0%) |
| Total | 2,222 (99.2%) | 19 (0.9%) |
Health Insurance Coverage by Citizenship Status in Eleele
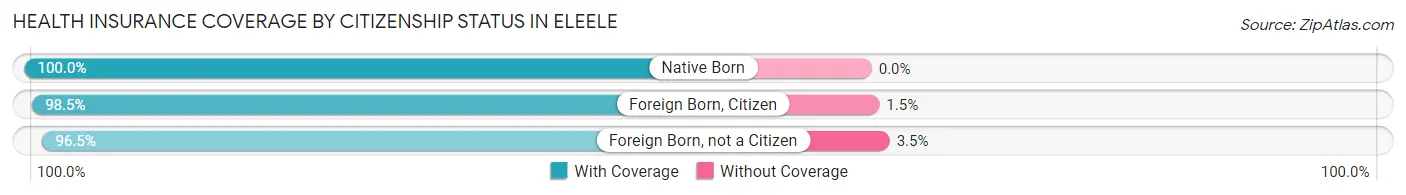
| Citizenship Status | With Coverage | Without Coverage |
| Native Born | 264 (100.0%) | 0 (0.0%) |
| Foreign Born, Citizen | 328 (98.5%) | 5 (1.5%) |
| Foreign Born, not a Citizen | 247 (96.5%) | 9 (3.5%) |
Health Insurance Coverage by Household Income in Eleele
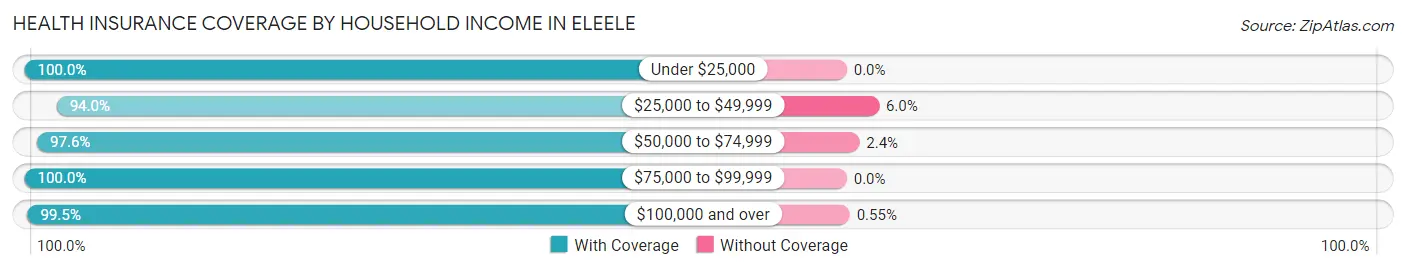
| Household Income | With Coverage | Without Coverage |
| Under $25,000 | 120 (100.0%) | 0 (0.0%) |
| $25,000 to $49,999 | 78 (94.0%) | 5 (6.0%) |
| $50,000 to $74,999 | 207 (97.6%) | 5 (2.4%) |
| $75,000 to $99,999 | 200 (100.0%) | 0 (0.0%) |
| $100,000 and over | 1,617 (99.5%) | 9 (0.5%) |
Public vs Private Health Insurance Coverage by Age in Eleele
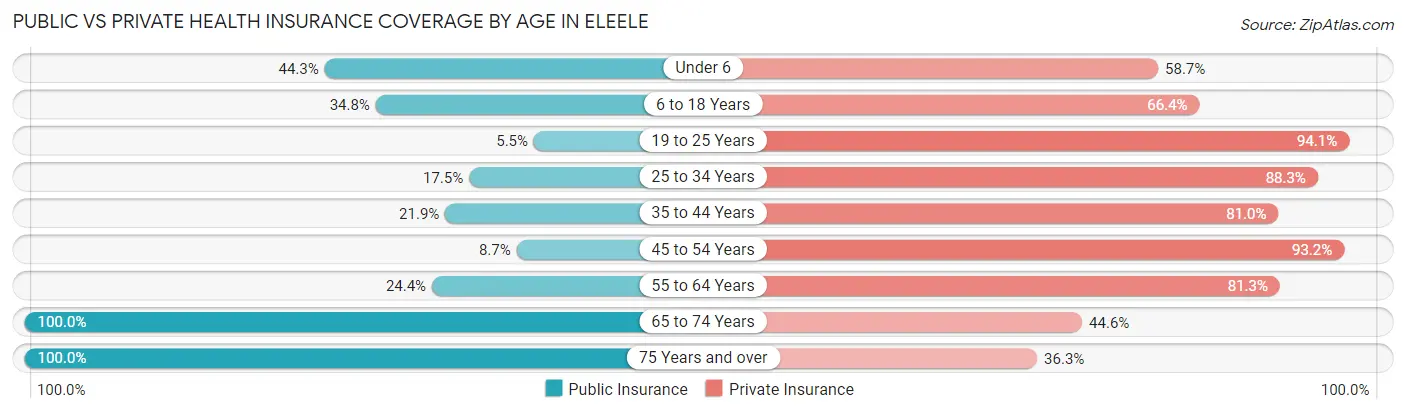
| Age Bracket | Public Insurance | Private Insurance |
| Under 6 | 117 (44.3%) | 155 (58.7%) |
| 6 to 18 Years | 116 (34.8%) | 221 (66.4%) |
| 19 to 25 Years | 14 (5.5%) | 241 (94.1%) |
| 25 to 34 Years | 42 (17.5%) | 212 (88.3%) |
| 35 to 44 Years | 52 (21.9%) | 192 (81.0%) |
| 45 to 54 Years | 23 (8.7%) | 247 (93.2%) |
| 55 to 64 Years | 90 (24.4%) | 300 (81.3%) |
| 65 to 74 Years | 186 (100.0%) | 83 (44.6%) |
| 75 Years and over | 91 (100.0%) | 33 (36.3%) |
| Total | 731 (32.6%) | 1,684 (75.1%) |
Disability Status by Sex by Age in Eleele
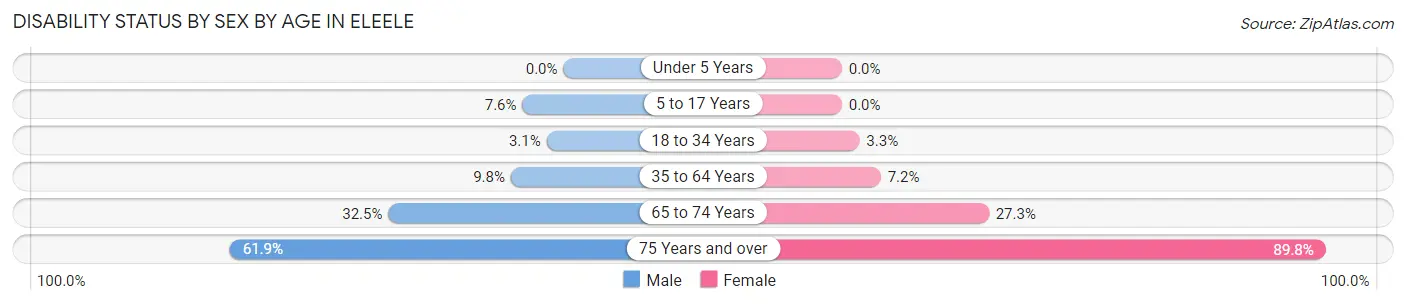
| Age Bracket | Male | Female |
| Under 5 Years | 0 (0.0%) | 0 (0.0%) |
| 5 to 17 Years | 15 (7.6%) | 0 (0.0%) |
| 18 to 34 Years | 8 (3.1%) | 8 (3.3%) |
| 35 to 64 Years | 39 (9.8%) | 34 (7.2%) |
| 65 to 74 Years | 39 (32.5%) | 18 (27.3%) |
| 75 Years and over | 26 (61.9%) | 44 (89.8%) |
Disability Class by Sex by Age in Eleele
Disability Class: Hearing Difficulty
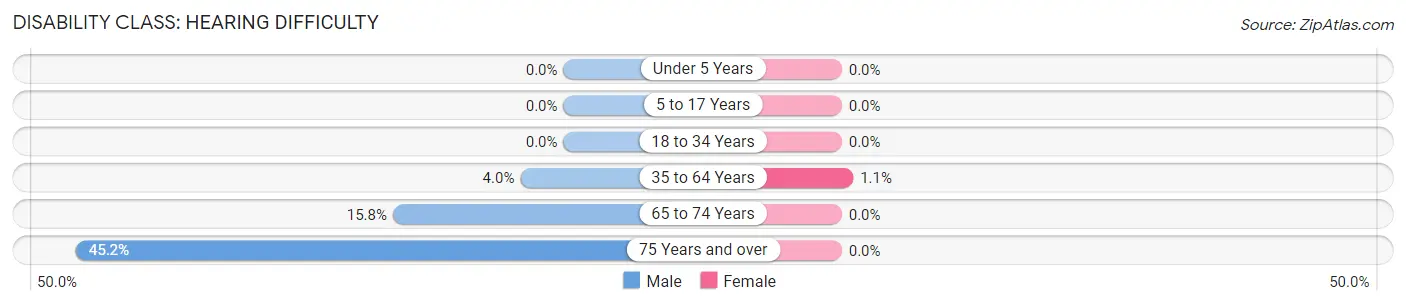
| Age Bracket | Male | Female |
| Under 5 Years | 0 (0.0%) | 0 (0.0%) |
| 5 to 17 Years | 0 (0.0%) | 0 (0.0%) |
| 18 to 34 Years | 0 (0.0%) | 0 (0.0%) |
| 35 to 64 Years | 16 (4.0%) | 5 (1.1%) |
| 65 to 74 Years | 19 (15.8%) | 0 (0.0%) |
| 75 Years and over | 19 (45.2%) | 0 (0.0%) |
Disability Class: Vision Difficulty
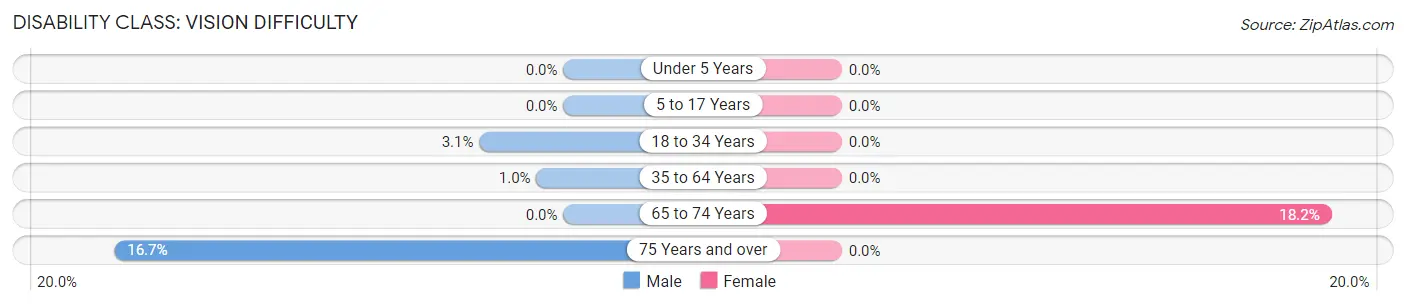
| Age Bracket | Male | Female |
| Under 5 Years | 0 (0.0%) | 0 (0.0%) |
| 5 to 17 Years | 0 (0.0%) | 0 (0.0%) |
| 18 to 34 Years | 8 (3.1%) | 0 (0.0%) |
| 35 to 64 Years | 4 (1.0%) | 0 (0.0%) |
| 65 to 74 Years | 0 (0.0%) | 12 (18.2%) |
| 75 Years and over | 7 (16.7%) | 0 (0.0%) |
Disability Class: Cognitive Difficulty
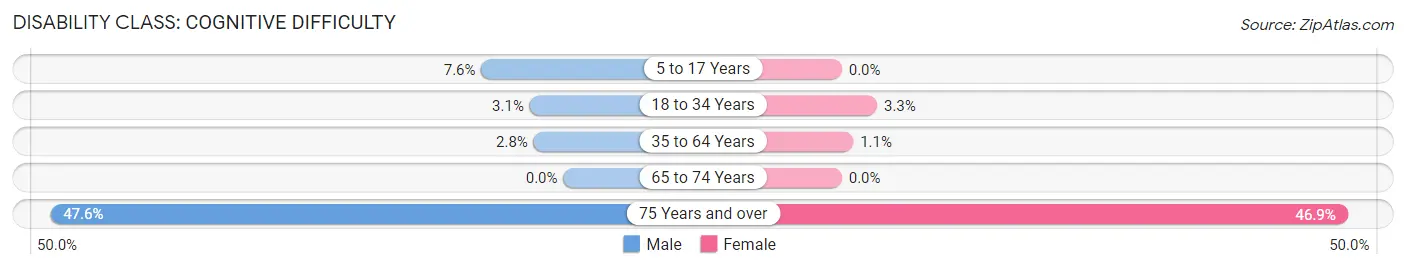
| Age Bracket | Male | Female |
| 5 to 17 Years | 15 (7.6%) | 0 (0.0%) |
| 18 to 34 Years | 8 (3.1%) | 8 (3.3%) |
| 35 to 64 Years | 11 (2.8%) | 5 (1.1%) |
| 65 to 74 Years | 0 (0.0%) | 0 (0.0%) |
| 75 Years and over | 20 (47.6%) | 23 (46.9%) |
Disability Class: Ambulatory Difficulty
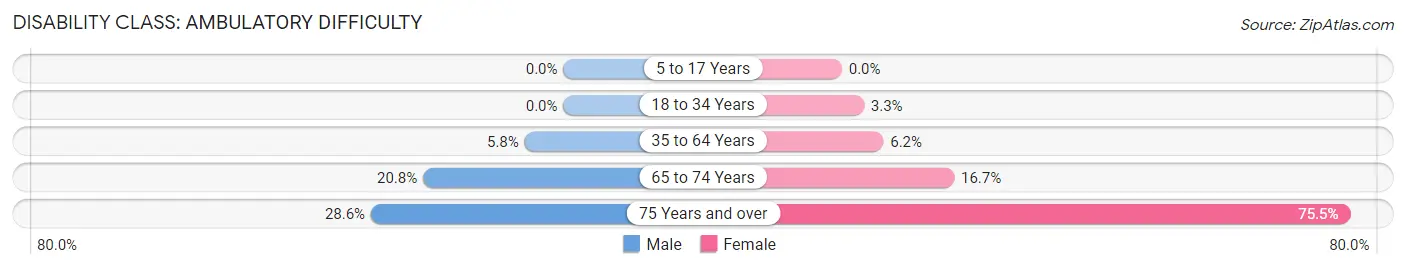
| Age Bracket | Male | Female |
| 5 to 17 Years | 0 (0.0%) | 0 (0.0%) |
| 18 to 34 Years | 0 (0.0%) | 8 (3.3%) |
| 35 to 64 Years | 23 (5.8%) | 29 (6.2%) |
| 65 to 74 Years | 25 (20.8%) | 11 (16.7%) |
| 75 Years and over | 12 (28.6%) | 37 (75.5%) |
Disability Class: Self-Care Difficulty
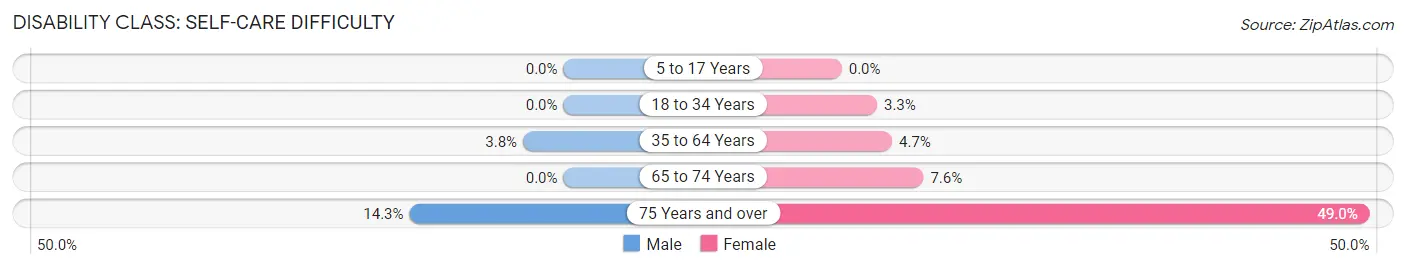
| Age Bracket | Male | Female |
| 5 to 17 Years | 0 (0.0%) | 0 (0.0%) |
| 18 to 34 Years | 0 (0.0%) | 8 (3.3%) |
| 35 to 64 Years | 15 (3.7%) | 22 (4.7%) |
| 65 to 74 Years | 0 (0.0%) | 5 (7.6%) |
| 75 Years and over | 6 (14.3%) | 24 (49.0%) |
Technology Access in Eleele
Computing Device Access in Eleele
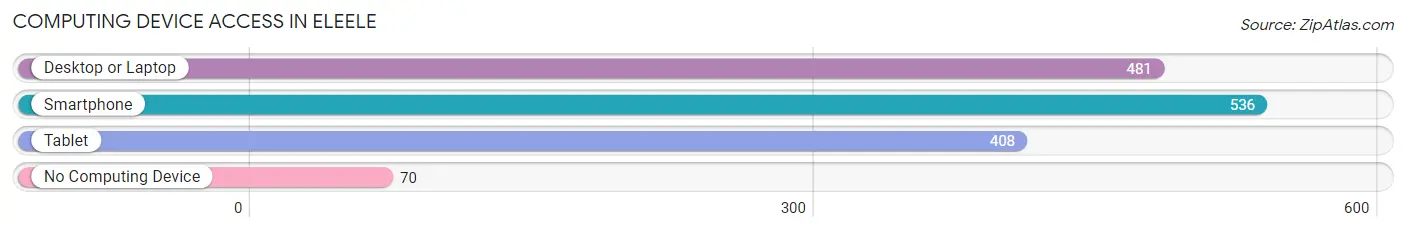
| Device Type | # Households | % Households |
| Desktop or Laptop | 481 | 75.0% |
| Smartphone | 536 | 83.6% |
| Tablet | 408 | 63.6% |
| No Computing Device | 70 | 10.9% |
| Total | 641 | 100.0% |
Internet Access in Eleele
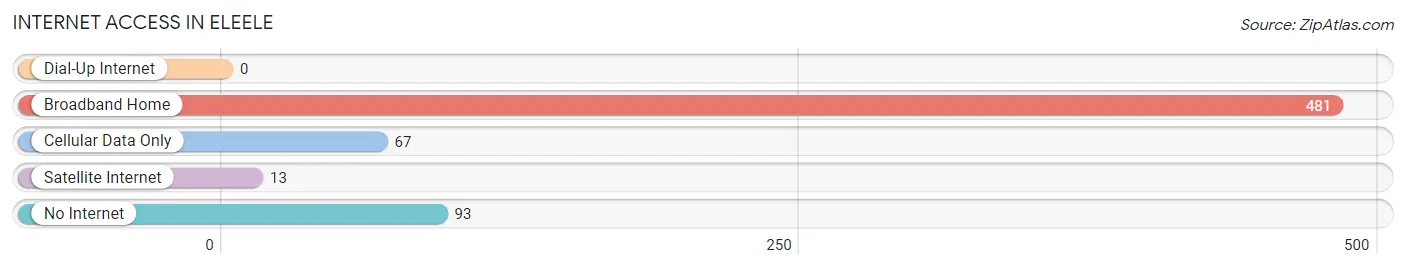
| Internet Type | # Households | % Households |
| Dial-Up Internet | 0 | 0.0% |
| Broadband Home | 481 | 75.0% |
| Cellular Data Only | 67 | 10.4% |
| Satellite Internet | 13 | 2.0% |
| No Internet | 93 | 14.5% |
| Total | 641 | 100.0% |
Eleele Summary
Eleele is a census-designated place (CDP) located in Kauai County, Hawaii, United States. The population was 1,845 at the 2000 census.
Geography
Eleele is located at 21 55 17 North 159 33 17 West 21 921445 159 554720
According to the United States Census Bureau, the CDP has a total area of 1.2 square miles (3.1 km²), all of it land.
History
Eleele was originally a sugar plantation town, established in the late 19th century. The town was named after the Hawaiian word for “black”, in reference to the dark volcanic soil in the area. The plantation was owned by the Eleele Sugar Company, which was founded in 1891. The company was eventually bought out by the Hawaiian Commercial & Sugar Company in the early 20th century.
The town of Eleele was officially incorporated in 1959
Economy
Eleele’s economy is largely based on tourism and agriculture. The town is home to several resorts and hotels, as well as a number of small businesses. Agriculture is also an important part of the local economy, with sugarcane, taro, and other crops being grown in the area.
Demographics
As of the census of 2000, there were 1,845 people, 645 households, and 486 families residing in the CDP. The population density was 1,521.3 people per square mile (586.3/km²). There were 690 housing units at an average density of 571.2 per square mile (220.9/km²). The racial makeup of the CDP was 28.2% White, 0.3% African American, 0.2% Native American, 28.2% Asian, 8.2% Pacific Islander, 0.7% from other races, and 34.2% from two or more races. Hispanic or Latino of any race were 8.2% of the population.
There were 645 households out of which 33.2% had children under the age of 18 living with them, 54.3% were married couples living together, 13.2% had a female householder with no husband present, and 25.3% were non-families. 19.7% of all households were made up of individuals and 6.2% had someone living alone who was 65 years of age or older. The average household size was 2.86 and the average family size was 3.27.
In the CDP the population was spread out with 25.7% under the age of 18, 8.2% from 18 to 24, 28.2% from 25 to 44, 25.7% from 45 to 64, and 12.2% who were 65 years of age or older. The median age was 38 years. For every 100 females there were 97.2 males. For every 100 females age 18 and over, there were 95.2 males.
The median income for a household in the CDP was $45,938, and the median income for a family was $50,000. Males had a median income of $31,250 versus $25,000 for females. The per capita income for the CDP was $19,945. About 8.2% of families and 10.2% of the population were below the poverty line, including 11.2% of those under age 18 and none of those age 65 or over.
Common Questions
What is Per Capita Income in Eleele?
Per Capita income in Eleele is $34,271.
What is the Median Family Income in Eleele?
Median Family Income in Eleele is $117,321.
What is the Median Household income in Eleele?
Median Household Income in Eleele is $107,734.
What is Income or Wage Gap in Eleele?
Income or Wage Gap in Eleele is 23.7%.
Women in Eleele earn 76.3 cents for every dollar earned by a man.
What is Inequality or Gini Index in Eleele?
Inequality or Gini Index in Eleele is 0.35.
What is the Total Population of Eleele?
Total Population of Eleele is 2,255.
What is the Total Male Population of Eleele?
Total Male Population of Eleele is 1,196.
What is the Total Female Population of Eleele?
Total Female Population of Eleele is 1,059.
What is the Ratio of Males per 100 Females in Eleele?
There are 112.94 Males per 100 Females in Eleele.
What is the Ratio of Females per 100 Males in Eleele?
There are 88.55 Females per 100 Males in Eleele.
What is the Median Population Age in Eleele?
Median Population Age in Eleele is 36.5 Years.
What is the Average Family Size in Eleele
Average Family Size in Eleele is 4.1 People.
What is the Average Household Size in Eleele
Average Household Size in Eleele is 3.5 People.
How Large is the Labor Force in Eleele?
There are 1,199 People in the Labor Forcein in Eleele.
What is the Percentage of People in the Labor Force in Eleele?
70.8% of People are in the Labor Force in Eleele.
What is the Unemployment Rate in Eleele?
Unemployment Rate in Eleele is 2.0%.