Ainaloa, HI Map & Demographics
Ainaloa Map
Ainaloa Overview
$22,605
PER CAPITA INCOME
$51,250
AVG FAMILY INCOME
$48,534
AVG HOUSEHOLD INCOME
10.7%
WAGE / INCOME GAP [ % ]
89.3¢/ $1
WAGE / INCOME GAP [ $ ]
0.46
INEQUALITY / GINI INDEX
3,832
TOTAL POPULATION
2,172
MALE POPULATION
1,660
FEMALE POPULATION
130.84
MALES / 100 FEMALES
76.43
FEMALES / 100 MALES
36.0
MEDIAN AGE
3.2
AVG FAMILY SIZE
2.6
AVG HOUSEHOLD SIZE
1,540
LABOR FORCE [ PEOPLE ]
53.0%
PERCENT IN LABOR FORCE
9.7%
UNEMPLOYMENT RATE
Income in Ainaloa
Income Overview in Ainaloa
Per Capita Income in Ainaloa is $22,605, while median incomes of families and households are $51,250 and $48,534 respectively.
| Characteristic | Number | Measure |
| Per Capita Income | 3,832 | $22,605 |
| Median Family Income | 972 | $51,250 |
| Mean Family Income | 972 | $66,234 |
| Median Household Income | 1,472 | $48,534 |
| Mean Household Income | 1,472 | $59,938 |
| Income Deficit | 972 | $0 |
| Wage / Income Gap (%) | 3,832 | 10.67% |
| Wage / Income Gap ($) | 3,832 | 89.33¢ per $1 |
| Gini / Inequality Index | 3,832 | 0.46 |
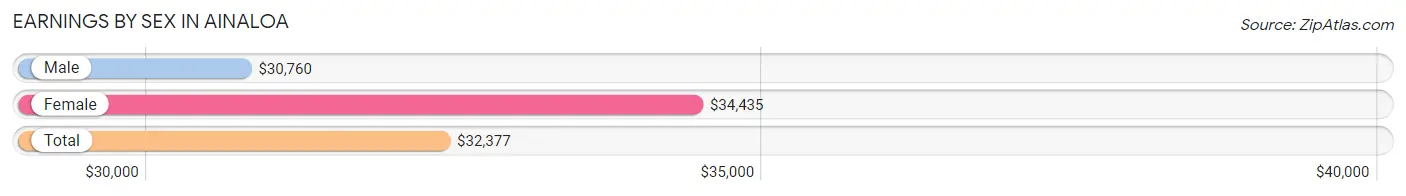
Earnings by Sex in Ainaloa
Average Earnings in Ainaloa are $32,377, $30,760 for men and $34,435 for women, a difference of 10.7%.
| Sex | Number | Average Earnings |
| Male | 857 (56.8%) | $30,760 |
| Female | 651 (43.2%) | $34,435 |
| Total | 1,508 (100.0%) | $32,377 |
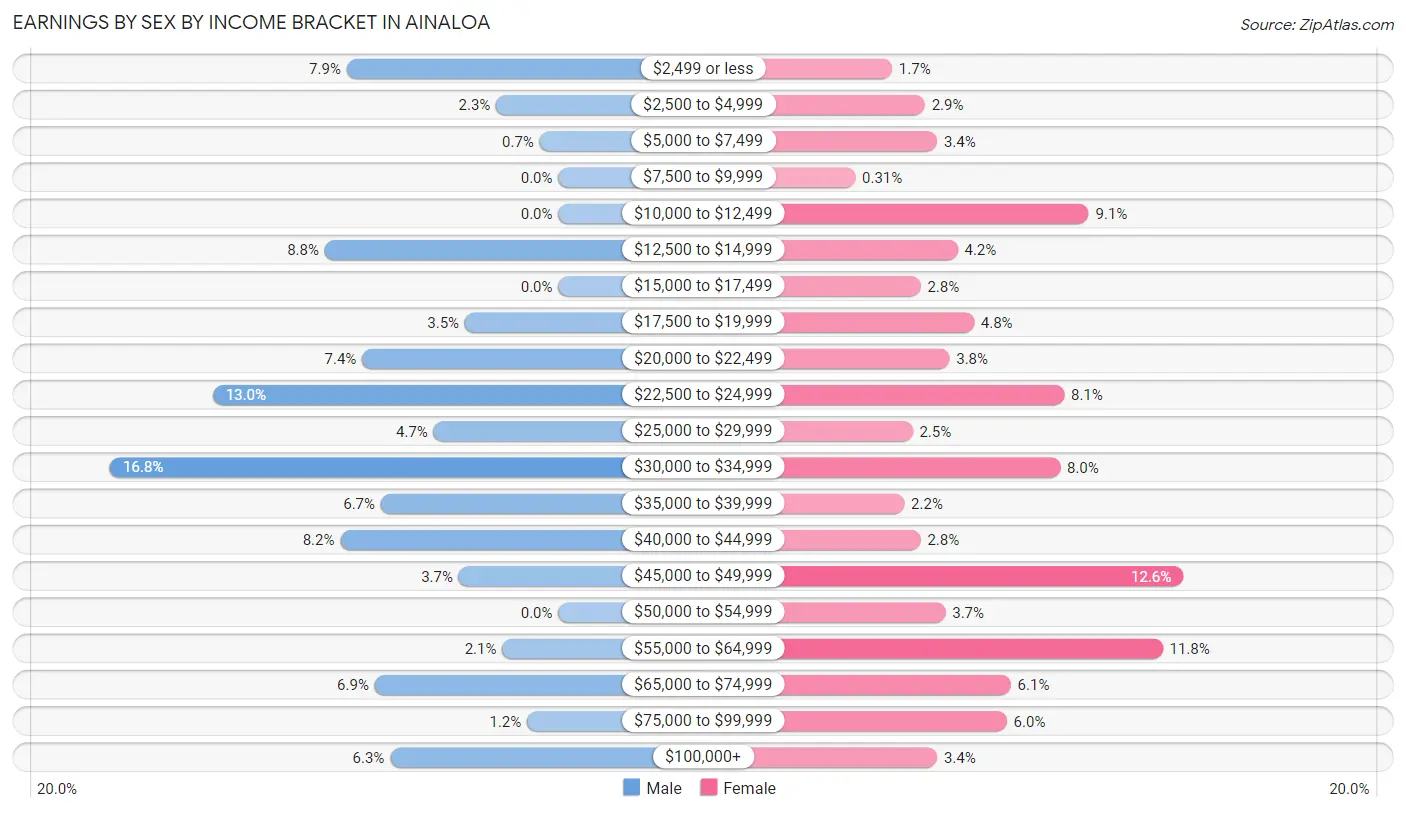
Earnings by Sex by Income Bracket in Ainaloa
The most common earnings brackets in Ainaloa are $30,000 to $34,999 for men (144 | 16.8%) and $45,000 to $49,999 for women (82 | 12.6%).
| Income | Male | Female |
| $2,499 or less | 68 (7.9%) | 11 (1.7%) |
| $2,500 to $4,999 | 20 (2.3%) | 19 (2.9%) |
| $5,000 to $7,499 | 6 (0.7%) | 22 (3.4%) |
| $7,500 to $9,999 | 0 (0.0%) | 2 (0.3%) |
| $10,000 to $12,499 | 0 (0.0%) | 59 (9.1%) |
| $12,500 to $14,999 | 75 (8.7%) | 27 (4.2%) |
| $15,000 to $17,499 | 0 (0.0%) | 18 (2.8%) |
| $17,500 to $19,999 | 30 (3.5%) | 31 (4.8%) |
| $20,000 to $22,499 | 63 (7.3%) | 25 (3.8%) |
| $22,500 to $24,999 | 111 (13.0%) | 53 (8.1%) |
| $25,000 to $29,999 | 40 (4.7%) | 16 (2.5%) |
| $30,000 to $34,999 | 144 (16.8%) | 52 (8.0%) |
| $35,000 to $39,999 | 57 (6.7%) | 14 (2.1%) |
| $40,000 to $44,999 | 70 (8.2%) | 18 (2.8%) |
| $45,000 to $49,999 | 32 (3.7%) | 82 (12.6%) |
| $50,000 to $54,999 | 0 (0.0%) | 24 (3.7%) |
| $55,000 to $64,999 | 18 (2.1%) | 77 (11.8%) |
| $65,000 to $74,999 | 59 (6.9%) | 40 (6.1%) |
| $75,000 to $99,999 | 10 (1.2%) | 39 (6.0%) |
| $100,000+ | 54 (6.3%) | 22 (3.4%) |
| Total | 857 (100.0%) | 651 (100.0%) |
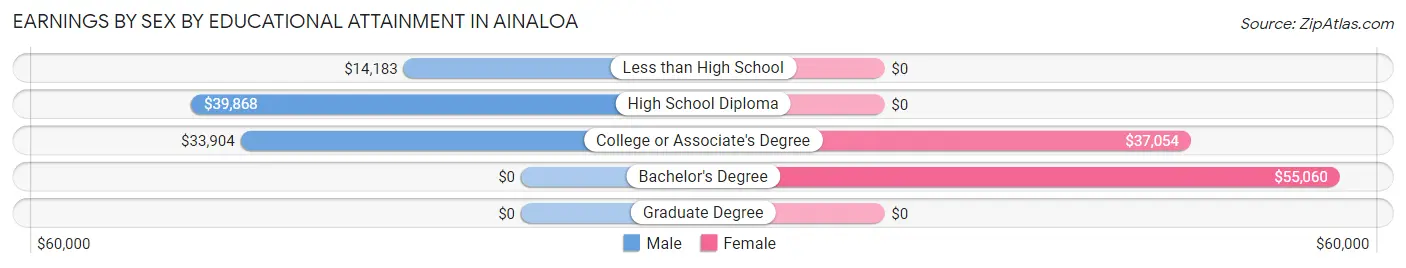
Earnings by Sex by Educational Attainment in Ainaloa
Average earnings in Ainaloa are $34,075 for men and $37,232 for women, a difference of 8.5%. Men with an educational attainment of high school diploma enjoy the highest average annual earnings of $39,868, while those with less than high school education earn the least with $14,183. Women with an educational attainment of bachelor's degree earn the most with the average annual earnings of $55,060, while those with college or associate's degree education have the smallest earnings of $37,054.
| Educational Attainment | Male Income | Female Income |
| Less than High School | $14,183 | $0 |
| High School Diploma | $39,868 | $0 |
| College or Associate's Degree | $33,904 | $37,054 |
| Bachelor's Degree | - | - |
| Graduate Degree | - | - |
| Total | $34,075 | $37,232 |
Family Income in Ainaloa
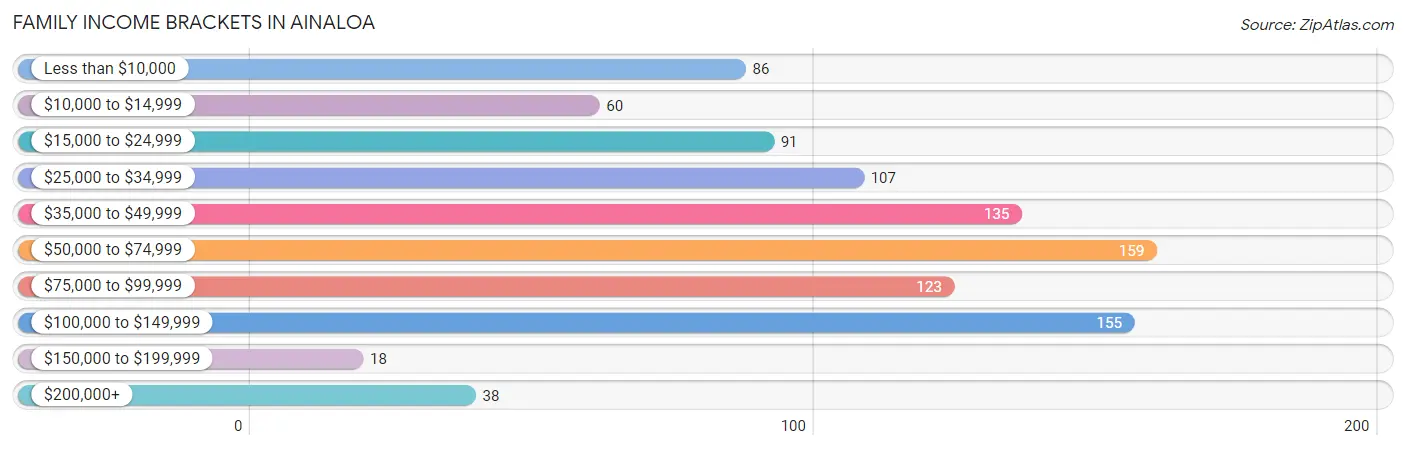
Family Income Brackets in Ainaloa
According to the Ainaloa family income data, there are 159 families falling into the $50,000 to $74,999 income range, which is the most common income bracket and makes up 16.4% of all families. Conversely, the $150,000 to $199,999 income bracket is the least frequent group with only 18 families (1.8%) belonging to this category.
| Income Bracket | # Families | % Families |
| Less than $10,000 | 86 | 8.8% |
| $10,000 to $14,999 | 60 | 6.2% |
| $15,000 to $24,999 | 91 | 9.4% |
| $25,000 to $34,999 | 107 | 11.0% |
| $35,000 to $49,999 | 135 | 13.9% |
| $50,000 to $74,999 | 159 | 16.4% |
| $75,000 to $99,999 | 123 | 12.7% |
| $100,000 to $149,999 | 155 | 15.9% |
| $150,000 to $199,999 | 18 | 1.9% |
| $200,000+ | 38 | 3.9% |
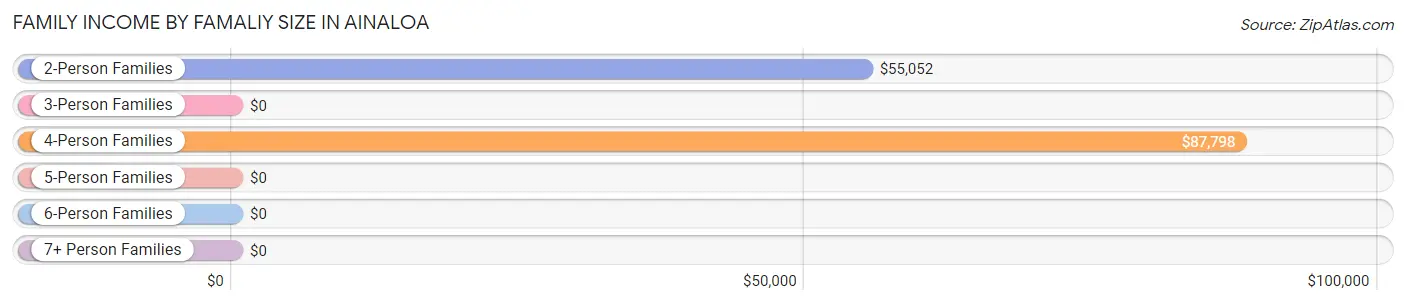
Family Income by Famaliy Size in Ainaloa
4-person families (227 | 23.4%) account for the highest median family income in Ainaloa with $87,798 per family, while 2-person families (385 | 39.6%) have the highest median income of $27,526 per family member.
| Income Bracket | # Families | Median Income |
| 2-Person Families | 385 (39.6%) | $55,052 |
| 3-Person Families | 269 (27.7%) | $0 |
| 4-Person Families | 227 (23.4%) | $87,798 |
| 5-Person Families | 36 (3.7%) | $0 |
| 6-Person Families | 23 (2.4%) | $0 |
| 7+ Person Families | 32 (3.3%) | $0 |
| Total | 972 (100.0%) | $51,250 |
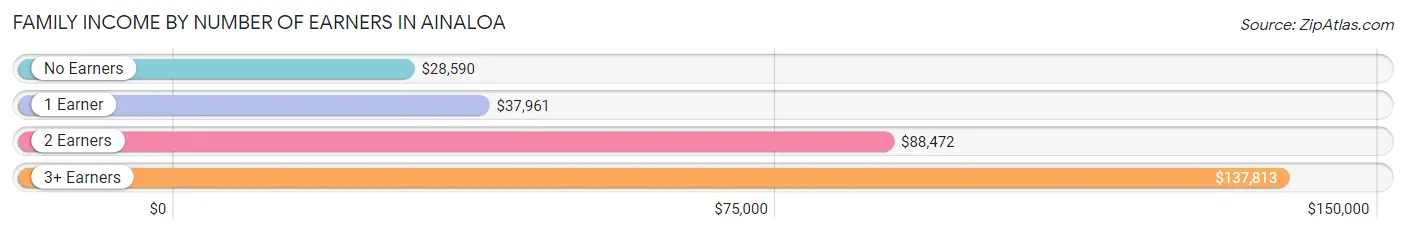
Family Income by Number of Earners in Ainaloa
The median family income in Ainaloa is $51,250, with families comprising 3+ earners (44) having the highest median family income of $137,813, while families with no earners (290) have the lowest median family income of $28,590, accounting for 4.5% and 29.8% of families, respectively.
| Number of Earners | # Families | Median Income |
| No Earners | 290 (29.8%) | $28,590 |
| 1 Earner | 371 (38.2%) | $37,961 |
| 2 Earners | 267 (27.5%) | $88,472 |
| 3+ Earners | 44 (4.5%) | $137,813 |
| Total | 972 (100.0%) | $51,250 |
Household Income in Ainaloa
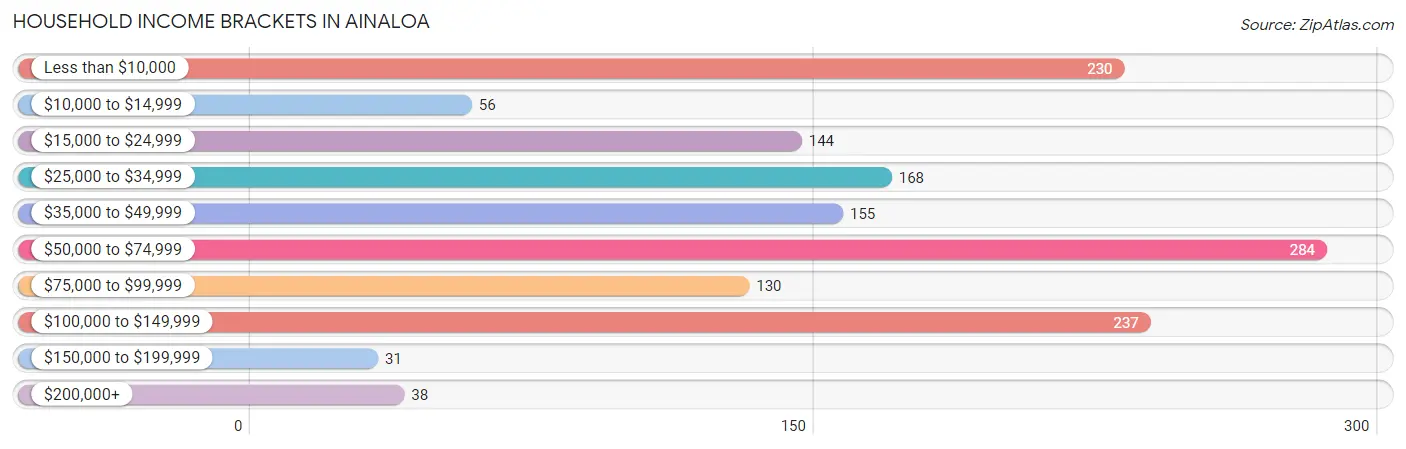
Household Income Brackets in Ainaloa
With 284 households falling in the category, the $50,000 to $74,999 income range is the most frequent in Ainaloa, accounting for 19.3% of all households. In contrast, only 31 households (2.1%) fall into the $150,000 to $199,999 income bracket, making it the least populous group.
| Income Bracket | # Households | % Households |
| Less than $10,000 | 230 | 15.6% |
| $10,000 to $14,999 | 56 | 3.8% |
| $15,000 to $24,999 | 144 | 9.8% |
| $25,000 to $34,999 | 168 | 11.4% |
| $35,000 to $49,999 | 155 | 10.5% |
| $50,000 to $74,999 | 284 | 19.3% |
| $75,000 to $99,999 | 130 | 8.8% |
| $100,000 to $149,999 | 237 | 16.1% |
| $150,000 to $199,999 | 31 | 2.1% |
| $200,000+ | 38 | 2.6% |
Household Income by Householder Age in Ainaloa
The median household income in Ainaloa is $48,534, with the highest median household income of $67,566 found in the 45 to 64 years age bracket for the primary householder. A total of 691 households (46.9%) fall into this category. Meanwhile, the 65+ years age bracket for the primary householder has the lowest median household income of $31,063, with 297 households (20.2%) in this group.
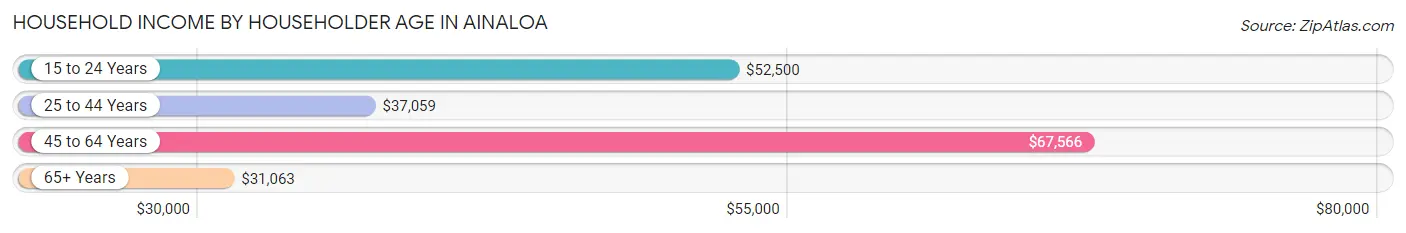
| Income Bracket | # Households | Median Income |
| 15 to 24 Years | 64 (4.3%) | $52,500 |
| 25 to 44 Years | 420 (28.5%) | $37,059 |
| 45 to 64 Years | 691 (46.9%) | $67,566 |
| 65+ Years | 297 (20.2%) | $31,063 |
| Total | 1,472 (100.0%) | $48,534 |
Poverty in Ainaloa
Income Below Poverty by Sex and Age in Ainaloa
With 30.5% poverty level for males and 25.4% for females among the residents of Ainaloa, 15 year old males and 15 year old females are the most vulnerable to poverty, with 7 males (100.0%) and 17 females (100.0%) in their respective age groups living below the poverty level.
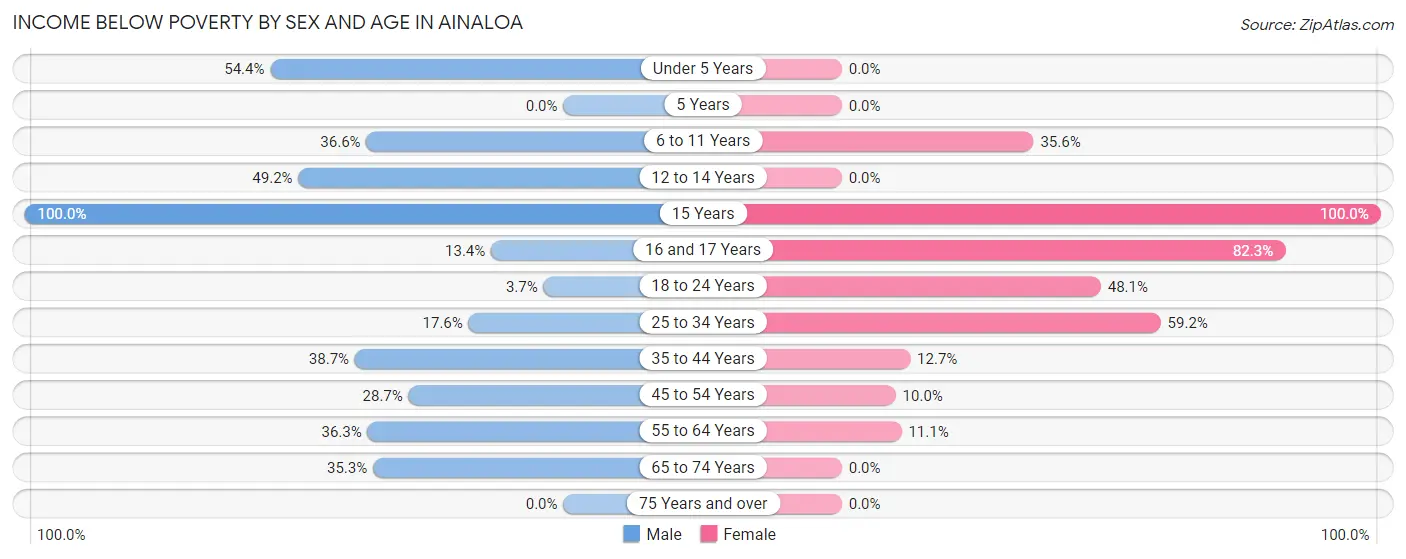
| Age Bracket | Male | Female |
| Under 5 Years | 68 (54.4%) | 0 (0.0%) |
| 5 Years | 0 (0.0%) | 0 (0.0%) |
| 6 to 11 Years | 151 (36.6%) | 37 (35.6%) |
| 12 to 14 Years | 60 (49.2%) | 0 (0.0%) |
| 15 Years | 7 (100.0%) | 17 (100.0%) |
| 16 and 17 Years | 11 (13.4%) | 51 (82.3%) |
| 18 to 24 Years | 10 (3.7%) | 100 (48.1%) |
| 25 to 34 Years | 16 (17.6%) | 132 (59.2%) |
| 35 to 44 Years | 106 (38.7%) | 25 (12.7%) |
| 45 to 54 Years | 27 (28.7%) | 12 (10.0%) |
| 55 to 64 Years | 141 (36.3%) | 47 (11.1%) |
| 65 to 74 Years | 65 (35.3%) | 0 (0.0%) |
| 75 Years and over | 0 (0.0%) | 0 (0.0%) |
| Total | 662 (30.5%) | 421 (25.4%) |
Income Above Poverty by Sex and Age in Ainaloa
According to the poverty statistics in Ainaloa, males aged 5 years and females aged under 5 years are the age groups that are most secure financially, with 100.0% of males and 100.0% of females in these age groups living above the poverty line.
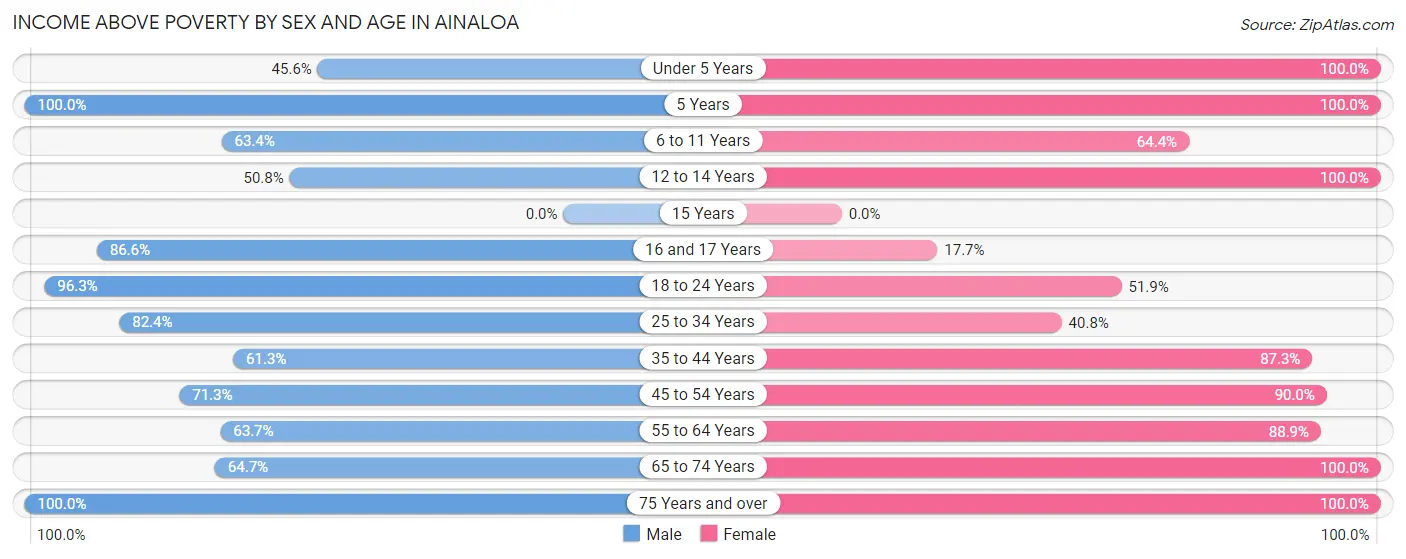
| Age Bracket | Male | Female |
| Under 5 Years | 57 (45.6%) | 76 (100.0%) |
| 5 Years | 6 (100.0%) | 9 (100.0%) |
| 6 to 11 Years | 262 (63.4%) | 67 (64.4%) |
| 12 to 14 Years | 62 (50.8%) | 47 (100.0%) |
| 15 Years | 0 (0.0%) | 0 (0.0%) |
| 16 and 17 Years | 71 (86.6%) | 11 (17.7%) |
| 18 to 24 Years | 262 (96.3%) | 108 (51.9%) |
| 25 to 34 Years | 75 (82.4%) | 91 (40.8%) |
| 35 to 44 Years | 168 (61.3%) | 172 (87.3%) |
| 45 to 54 Years | 67 (71.3%) | 108 (90.0%) |
| 55 to 64 Years | 247 (63.7%) | 377 (88.9%) |
| 65 to 74 Years | 119 (64.7%) | 102 (100.0%) |
| 75 Years and over | 114 (100.0%) | 71 (100.0%) |
| Total | 1,510 (69.5%) | 1,239 (74.6%) |
Income Below Poverty Among Married-Couple Families in Ainaloa
The poverty statistics for married-couple families in Ainaloa show that 2.9% or 13 of the total 453 families live below the poverty line. Families with 1 or 2 children have the highest poverty rate of 6.6%, comprising of 6 families. On the other hand, families with 3 or 4 children have the lowest poverty rate of 0.0%, which includes 0 families.
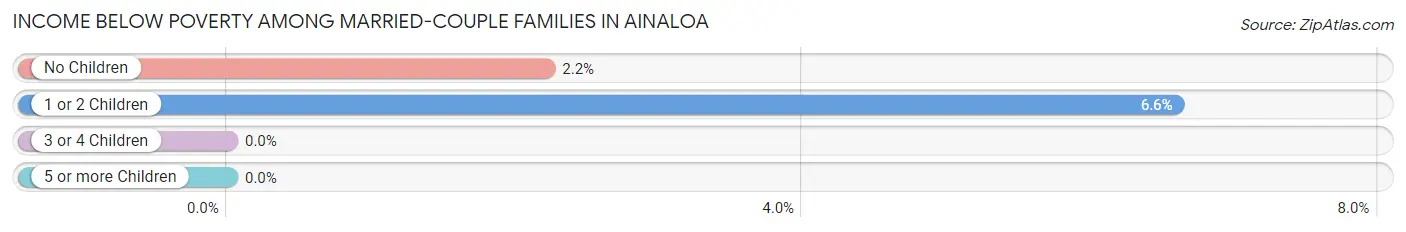
| Children | Above Poverty | Below Poverty |
| No Children | 310 (97.8%) | 7 (2.2%) |
| 1 or 2 Children | 85 (93.4%) | 6 (6.6%) |
| 3 or 4 Children | 45 (100.0%) | 0 (0.0%) |
| 5 or more Children | 0 (0.0%) | 0 (0.0%) |
| Total | 440 (97.1%) | 13 (2.9%) |
Income Below Poverty Among Single-Parent Households in Ainaloa
According to the poverty data in Ainaloa, 42.2% or 86 single-father households and 50.5% or 159 single-mother households are living below the poverty line. Among single-father households, those with 1 or 2 children have the highest poverty rate, with 63 households (57.8%) experiencing poverty. Likewise, among single-mother households, those with 3 or 4 children have the highest poverty rate, with 42 households (61.8%) falling below the poverty line.
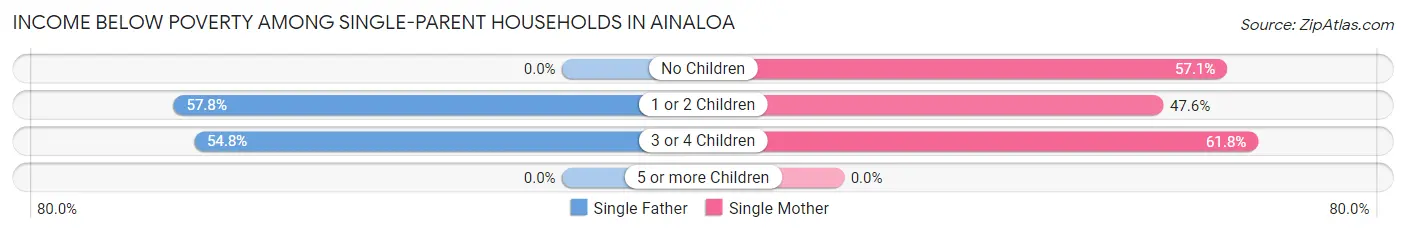
| Children | Single Father | Single Mother |
| No Children | 0 (0.0%) | 28 (57.1%) |
| 1 or 2 Children | 63 (57.8%) | 89 (47.6%) |
| 3 or 4 Children | 23 (54.8%) | 42 (61.8%) |
| 5 or more Children | 0 (0.0%) | 0 (0.0%) |
| Total | 86 (42.2%) | 159 (50.5%) |
Income Below Poverty Among Married-Couple vs Single-Parent Households in Ainaloa
The poverty data for Ainaloa shows that 13 of the married-couple family households (2.9%) and 245 of the single-parent households (47.2%) are living below the poverty level. Within the married-couple family households, those with 1 or 2 children have the highest poverty rate, with 6 households (6.6%) falling below the poverty line. Among the single-parent households, those with 3 or 4 children have the highest poverty rate, with 65 household (59.1%) living below poverty.
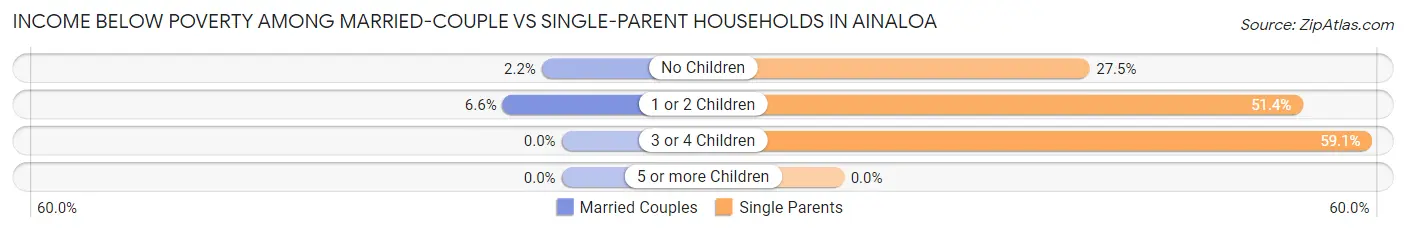
| Children | Married-Couple Families | Single-Parent Households |
| No Children | 7 (2.2%) | 28 (27.5%) |
| 1 or 2 Children | 6 (6.6%) | 152 (51.3%) |
| 3 or 4 Children | 0 (0.0%) | 65 (59.1%) |
| 5 or more Children | 0 (0.0%) | 0 (0.0%) |
| Total | 13 (2.9%) | 245 (47.2%) |
Race in Ainaloa
The most populous races in Ainaloa are Two or more Races (1,691 | 44.1%), Hispanic or Latino (939 | 24.5%), and White / Caucasian (885 | 23.1%).
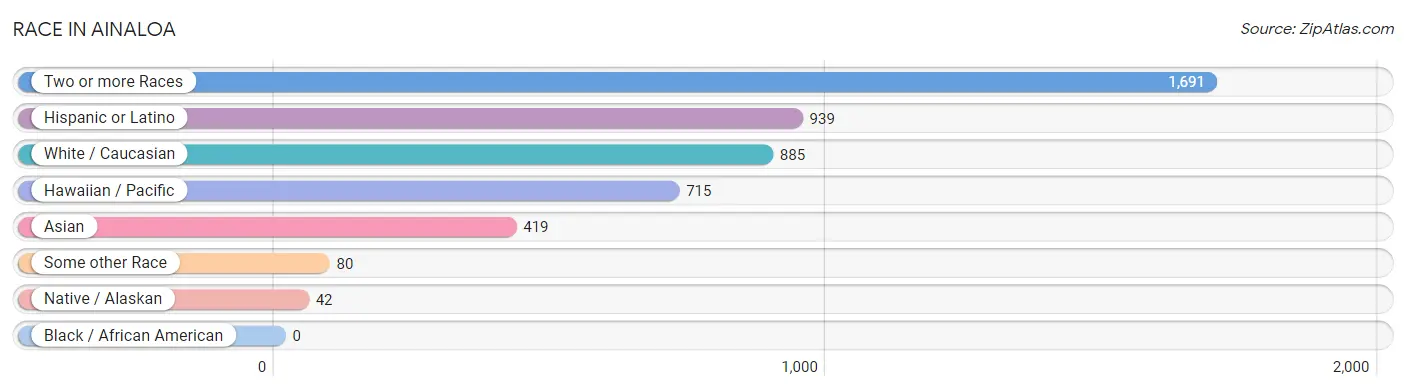
| Race | # Population | % Population |
| Asian | 419 | 10.9% |
| Black / African American | 0 | 0.0% |
| Hawaiian / Pacific | 715 | 18.7% |
| Hispanic or Latino | 939 | 24.5% |
| Native / Alaskan | 42 | 1.1% |
| White / Caucasian | 885 | 23.1% |
| Two or more Races | 1,691 | 44.1% |
| Some other Race | 80 | 2.1% |
| Total | 3,832 | 100.0% |
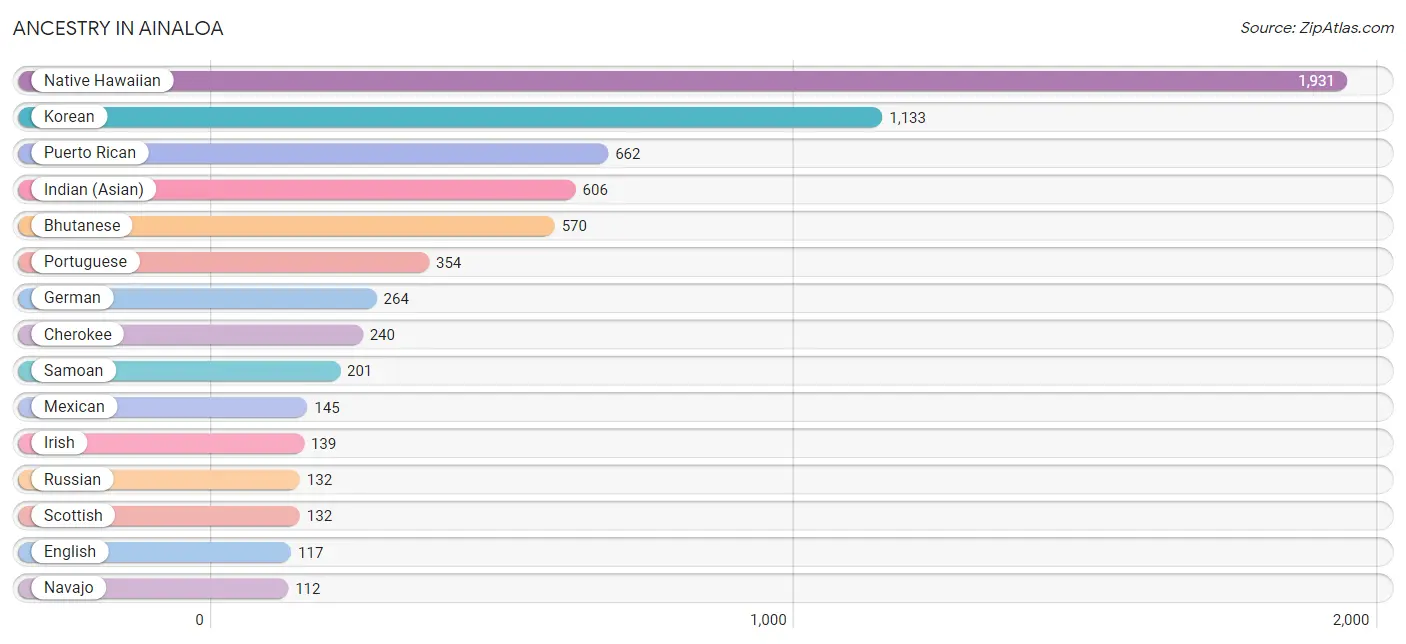
Ancestry in Ainaloa
The most populous ancestries reported in Ainaloa are Native Hawaiian (1,931 | 50.4%), Korean (1,133 | 29.6%), Puerto Rican (662 | 17.3%), Indian (Asian) (606 | 15.8%), and Bhutanese (570 | 14.9%), together accounting for 127.9% of all Ainaloa residents.
| Ancestry | # Population | % Population |
| American | 42 | 1.1% |
| Apache | 83 | 2.2% |
| Bhutanese | 570 | 14.9% |
| British | 6 | 0.2% |
| Burmese | 17 | 0.4% |
| Cherokee | 240 | 6.3% |
| Chinese | 12 | 0.3% |
| Danish | 44 | 1.1% |
| Dutch | 27 | 0.7% |
| English | 117 | 3.0% |
| European | 2 | 0.1% |
| French | 38 | 1.0% |
| French American Indian | 42 | 1.1% |
| French Canadian | 12 | 0.3% |
| German | 264 | 6.9% |
| Icelander | 17 | 0.4% |
| Indian (Asian) | 606 | 15.8% |
| Irish | 139 | 3.6% |
| Iroquois | 40 | 1.0% |
| Italian | 93 | 2.4% |
| Korean | 1,133 | 29.6% |
| Laotian | 23 | 0.6% |
| Lithuanian | 6 | 0.2% |
| Mexican | 145 | 3.8% |
| Native Hawaiian | 1,931 | 50.4% |
| Navajo | 112 | 2.9% |
| Norwegian | 22 | 0.6% |
| Osage | 19 | 0.5% |
| Pakistani | 21 | 0.5% |
| Polish | 23 | 0.6% |
| Portuguese | 354 | 9.2% |
| Puerto Rican | 662 | 17.3% |
| Russian | 132 | 3.4% |
| Samoan | 201 | 5.2% |
| Scotch-Irish | 24 | 0.6% |
| Scottish | 132 | 3.4% |
| Spaniard | 28 | 0.7% |
| Swedish | 45 | 1.2% | View All 38 Rows |
Immigrants in Ainaloa
The most numerous immigrant groups reported in Ainaloa came from Europe (121 | 3.2%), Asia (93 | 2.4%), Philippines (70 | 1.8%), South Eastern Asia (70 | 1.8%), and Germany (62 | 1.6%), together accounting for 10.9% of all Ainaloa residents.
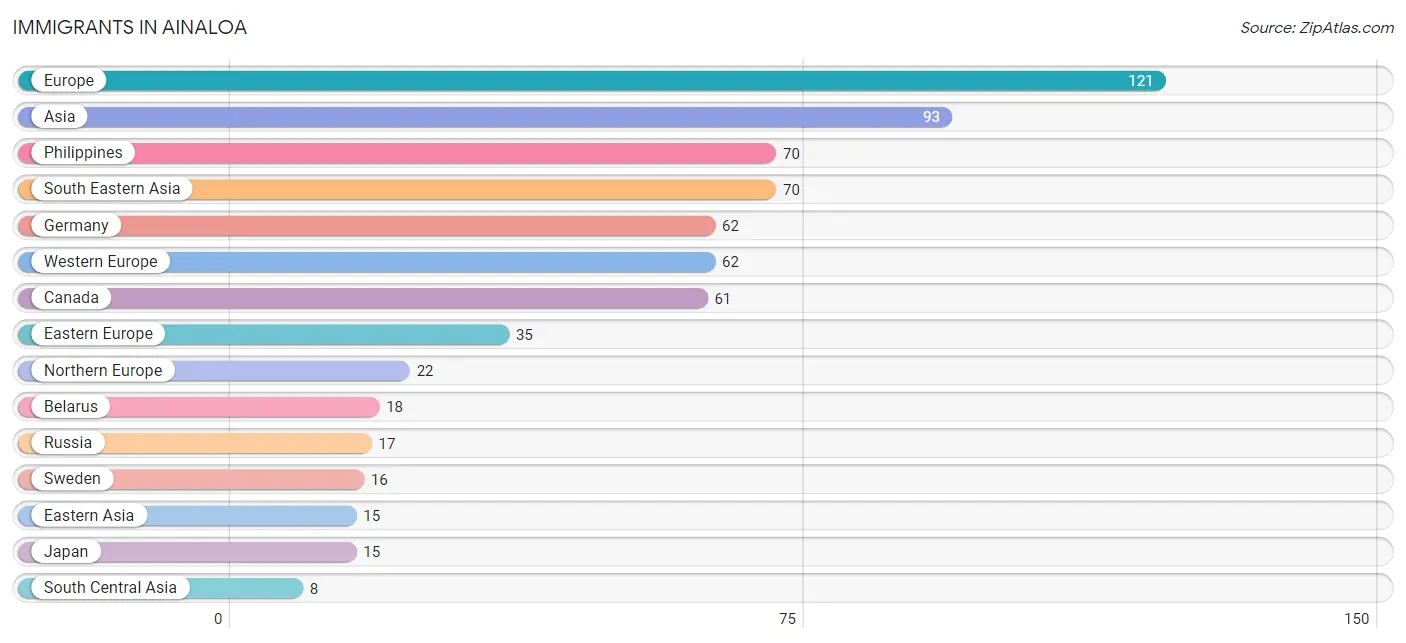
| Immigration Origin | # Population | % Population |
| Asia | 93 | 2.4% |
| Belarus | 18 | 0.5% |
| Canada | 61 | 1.6% |
| Eastern Asia | 15 | 0.4% |
| Eastern Europe | 35 | 0.9% |
| England | 6 | 0.2% |
| Europe | 121 | 3.2% |
| Germany | 62 | 1.6% |
| Japan | 15 | 0.4% |
| Northern Europe | 22 | 0.6% |
| Philippines | 70 | 1.8% |
| Russia | 17 | 0.4% |
| South Central Asia | 8 | 0.2% |
| South Eastern Asia | 70 | 1.8% |
| Sri Lanka | 8 | 0.2% |
| Sweden | 16 | 0.4% |
| Western Europe | 62 | 1.6% | View All 17 Rows |
Sex and Age in Ainaloa
Sex and Age in Ainaloa
The most populous age groups in Ainaloa are 5 to 9 Years (305 | 14.0%) for men and 60 to 64 Years (253 | 15.2%) for women.
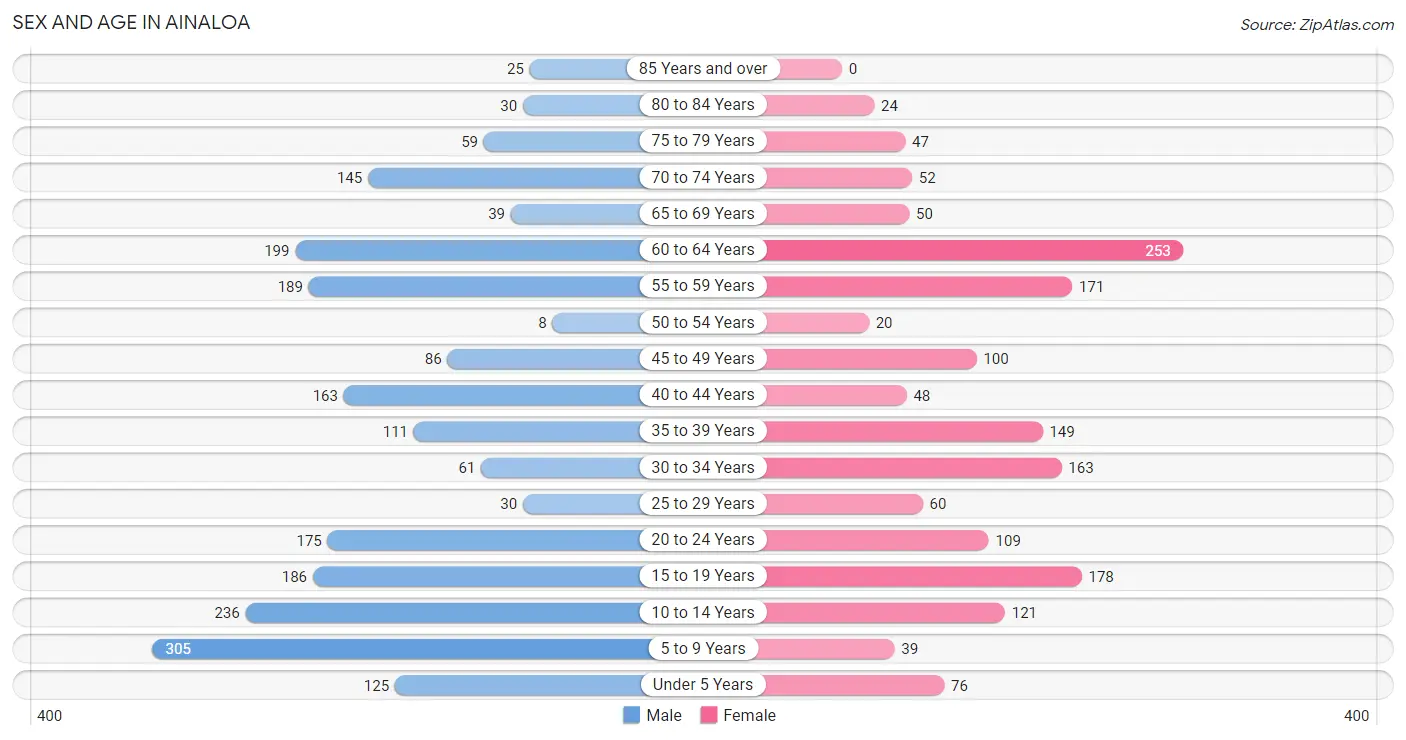
| Age Bracket | Male | Female |
| Under 5 Years | 125 (5.8%) | 76 (4.6%) |
| 5 to 9 Years | 305 (14.0%) | 39 (2.4%) |
| 10 to 14 Years | 236 (10.9%) | 121 (7.3%) |
| 15 to 19 Years | 186 (8.6%) | 178 (10.7%) |
| 20 to 24 Years | 175 (8.1%) | 109 (6.6%) |
| 25 to 29 Years | 30 (1.4%) | 60 (3.6%) |
| 30 to 34 Years | 61 (2.8%) | 163 (9.8%) |
| 35 to 39 Years | 111 (5.1%) | 149 (9.0%) |
| 40 to 44 Years | 163 (7.5%) | 48 (2.9%) |
| 45 to 49 Years | 86 (4.0%) | 100 (6.0%) |
| 50 to 54 Years | 8 (0.4%) | 20 (1.2%) |
| 55 to 59 Years | 189 (8.7%) | 171 (10.3%) |
| 60 to 64 Years | 199 (9.2%) | 253 (15.2%) |
| 65 to 69 Years | 39 (1.8%) | 50 (3.0%) |
| 70 to 74 Years | 145 (6.7%) | 52 (3.1%) |
| 75 to 79 Years | 59 (2.7%) | 47 (2.8%) |
| 80 to 84 Years | 30 (1.4%) | 24 (1.5%) |
| 85 Years and over | 25 (1.1%) | 0 (0.0%) |
| Total | 2,172 (100.0%) | 1,660 (100.0%) |
Families and Households in Ainaloa
Median Family Size in Ainaloa
The median family size in Ainaloa is 3.16 persons per family, with single female/mother families (315 | 32.4%) accounting for the largest median family size of 3.42 persons per family. On the other hand, single male/father families (204 | 21.0%) represent the smallest median family size with 2.75 persons per family.
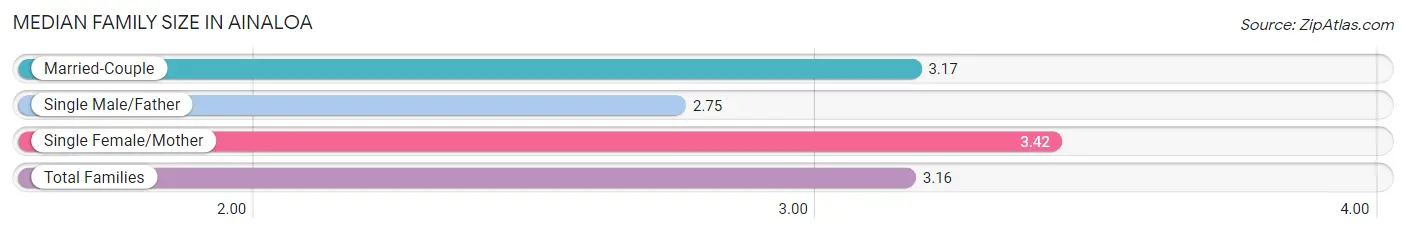
| Family Type | # Families | Family Size |
| Married-Couple | 453 (46.6%) | 3.17 |
| Single Male/Father | 204 (21.0%) | 2.75 |
| Single Female/Mother | 315 (32.4%) | 3.42 |
| Total Families | 972 (100.0%) | 3.16 |
Median Household Size in Ainaloa
The median household size in Ainaloa is 2.60 persons per household, with single female/mother households (315 | 21.4%) accounting for the largest median household size of 3.62 persons per household. non-family households (500 | 34.0%) represent the smallest median household size with 1.22 persons per household.
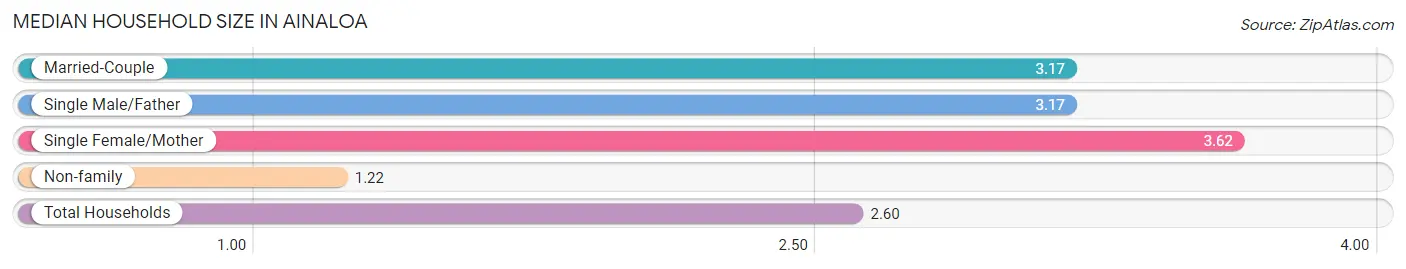
| Household Type | # Households | Household Size |
| Married-Couple | 453 (30.8%) | 3.17 |
| Single Male/Father | 204 (13.9%) | 3.17 |
| Single Female/Mother | 315 (21.4%) | 3.62 |
| Non-family | 500 (34.0%) | 1.22 |
| Total Households | 1,472 (100.0%) | 2.60 |
Household Size by Marriage Status in Ainaloa
Out of a total of 1,472 households in Ainaloa, 972 (66.0%) are family households, while 500 (34.0%) are nonfamily households. The most numerous type of family households are 2-person households, comprising 340, and the most common type of nonfamily households are 1-person households, comprising 396.
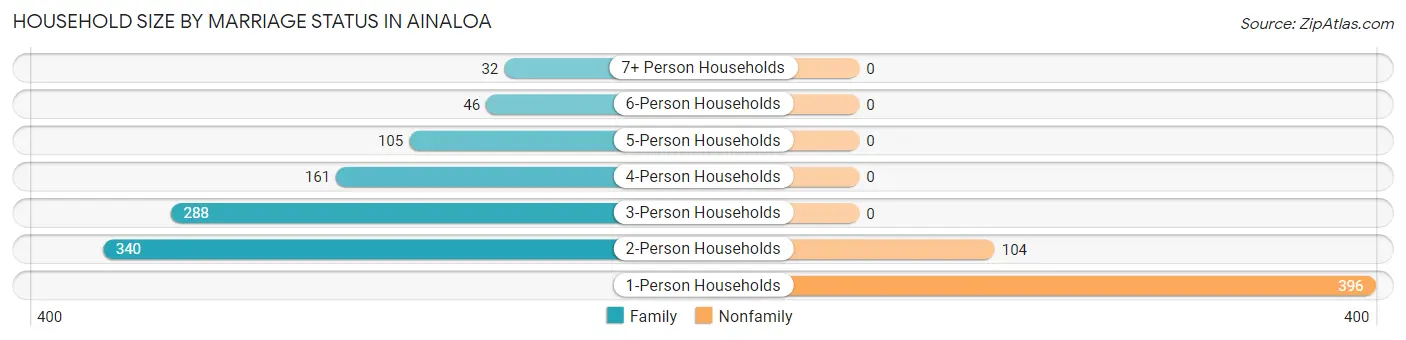
| Household Size | Family Households | Nonfamily Households |
| 1-Person Households | - | 396 (26.9%) |
| 2-Person Households | 340 (23.1%) | 104 (7.1%) |
| 3-Person Households | 288 (19.6%) | 0 (0.0%) |
| 4-Person Households | 161 (10.9%) | 0 (0.0%) |
| 5-Person Households | 105 (7.1%) | 0 (0.0%) |
| 6-Person Households | 46 (3.1%) | 0 (0.0%) |
| 7+ Person Households | 32 (2.2%) | 0 (0.0%) |
| Total | 972 (66.0%) | 500 (34.0%) |
Female Fertility in Ainaloa
Fertility by Age in Ainaloa
Average fertility rate in Ainaloa is 107.0 births per 1,000 women. Women in the age bracket of 20 to 34 years have the highest fertility rate with 178.0 births per 1,000 women. Women in the age bracket of 20 to 34 years acount for 67.8% of all women with births.
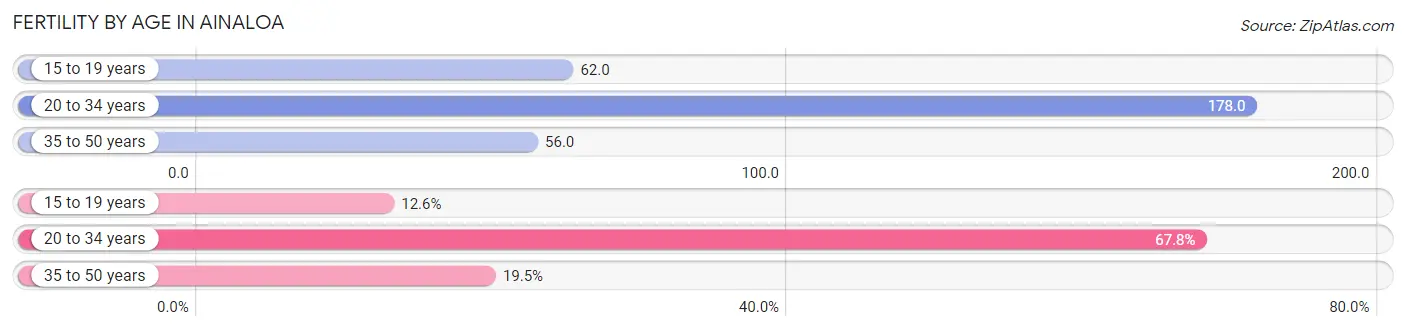
| Age Bracket | Women with Births | Births / 1,000 Women |
| 15 to 19 years | 11 (12.6%) | 62.0 |
| 20 to 34 years | 59 (67.8%) | 178.0 |
| 35 to 50 years | 17 (19.5%) | 56.0 |
| Total | 87 (100.0%) | 107.0 |
Fertility by Age by Marriage Status in Ainaloa
28.7% of women with births (87) in Ainaloa are married. The highest percentage of unmarried women with births falls into 15 to 19 years age bracket with 100.0% of them unmarried at the time of birth, while the lowest percentage of unmarried women with births belong to 35 to 50 years age bracket with 0.0% of them unmarried.
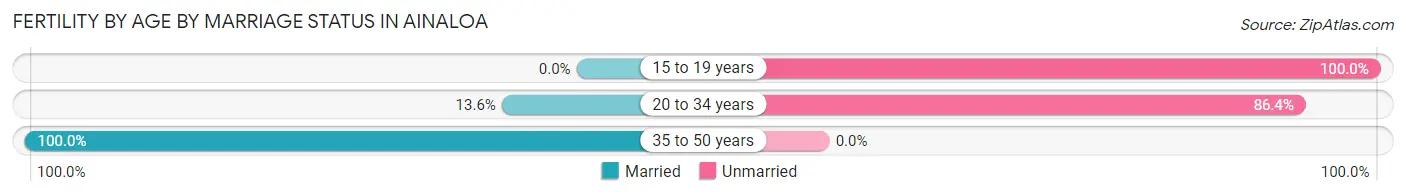
| Age Bracket | Married | Unmarried |
| 15 to 19 years | 0 (0.0%) | 11 (100.0%) |
| 20 to 34 years | 8 (13.6%) | 51 (86.4%) |
| 35 to 50 years | 17 (100.0%) | 0 (0.0%) |
| Total | 25 (28.7%) | 62 (71.3%) |
Fertility by Education in Ainaloa
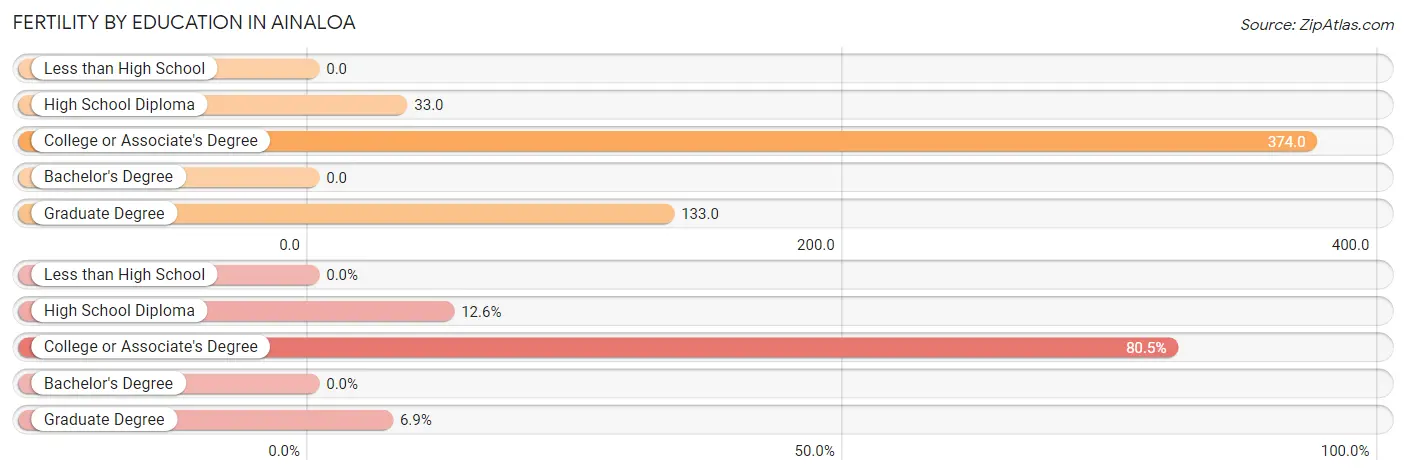
| Educational Attainment | Women with Births | Births / 1,000 Women |
| Less than High School | 0 (0.0%) | 0.0 |
| High School Diploma | 11 (12.6%) | 33.0 |
| College or Associate's Degree | 70 (80.5%) | 374.0 |
| Bachelor's Degree | 0 (0.0%) | 0.0 |
| Graduate Degree | 6 (6.9%) | 133.0 |
| Total | 87 (100.0%) | 107.0 |
Fertility by Education by Marriage Status in Ainaloa
71.3% of women with births in Ainaloa are unmarried. Women with the educational attainment of college or associate's degree are most likely to be married with 35.7% of them married at childbirth, while women with the educational attainment of high school diploma are least likely to be married with 100.0% of them unmarried at childbirth.
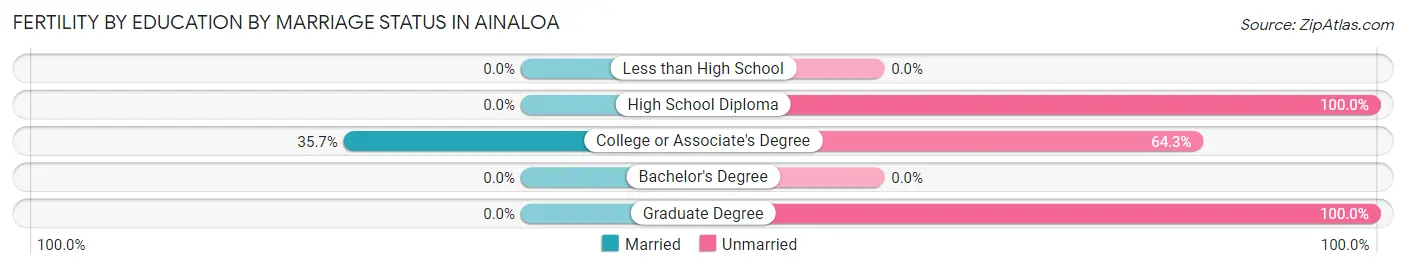
| Educational Attainment | Married | Unmarried |
| Less than High School | 0 (0.0%) | 0 (0.0%) |
| High School Diploma | 0 (0.0%) | 11 (100.0%) |
| College or Associate's Degree | 25 (35.7%) | 45 (64.3%) |
| Bachelor's Degree | 0 (0.0%) | 0 (0.0%) |
| Graduate Degree | 0 (0.0%) | 6 (100.0%) |
| Total | 25 (28.7%) | 62 (71.3%) |
Employment Characteristics in Ainaloa
Employment by Class of Employer in Ainaloa
Among the 1,335 employed individuals in Ainaloa, private company employees (870 | 65.2%), state government employees (150 | 11.2%), and not-for-profit organizations (84 | 6.3%) make up the most common classes of employment.
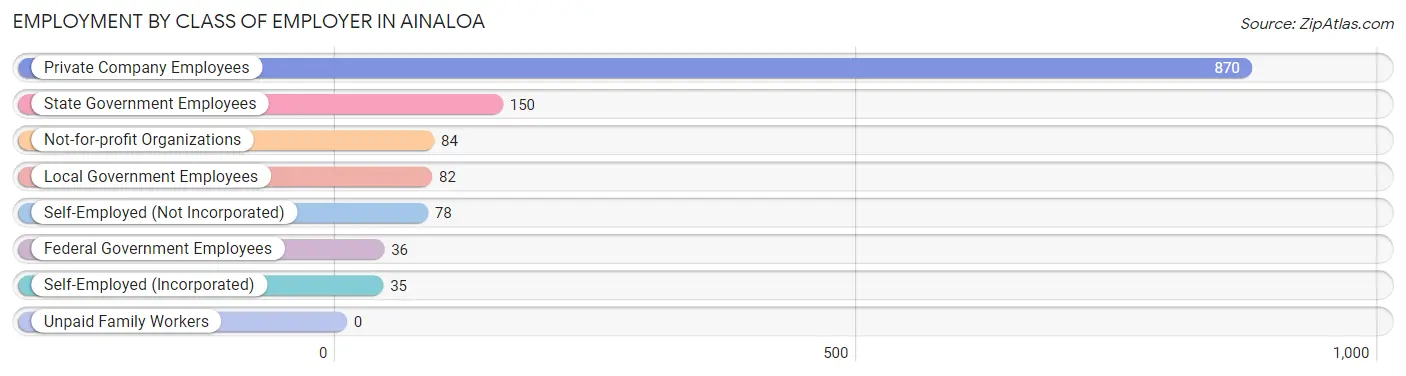
| Employer Class | # Employees | % Employees |
| Private Company Employees | 870 | 65.2% |
| Self-Employed (Incorporated) | 35 | 2.6% |
| Self-Employed (Not Incorporated) | 78 | 5.8% |
| Not-for-profit Organizations | 84 | 6.3% |
| Local Government Employees | 82 | 6.1% |
| State Government Employees | 150 | 11.2% |
| Federal Government Employees | 36 | 2.7% |
| Unpaid Family Workers | 0 | 0.0% |
| Total | 1,335 | 100.0% |
Employment Status by Age in Ainaloa
According to the labor force statistics for Ainaloa, out of the total population over 16 years of age (2,906), 53.0% or 1,540 individuals are in the labor force, with 9.7% or 149 of them unemployed. The age group with the highest labor force participation rate is 25 to 29 years, with 100.0% or 90 individuals in the labor force. Within the labor force, the 65 to 74 years age range has the highest percentage of unemployed individuals, with 71.8% or 28 of them being unemployed.
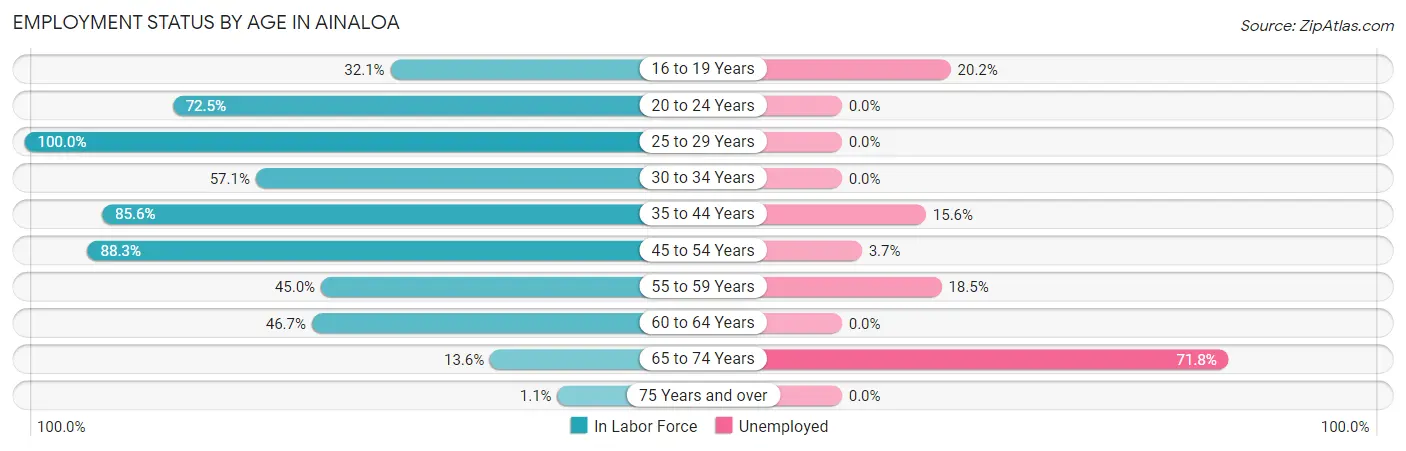
| Age Bracket | In Labor Force | Unemployed |
| 16 to 19 Years | 109 (32.1%) | 22 (20.2%) |
| 20 to 24 Years | 206 (72.5%) | 0 (0.0%) |
| 25 to 29 Years | 90 (100.0%) | 0 (0.0%) |
| 30 to 34 Years | 128 (57.1%) | 0 (0.0%) |
| 35 to 44 Years | 403 (85.6%) | 63 (15.6%) |
| 45 to 54 Years | 189 (88.3%) | 7 (3.7%) |
| 55 to 59 Years | 162 (45.0%) | 30 (18.5%) |
| 60 to 64 Years | 211 (46.7%) | 0 (0.0%) |
| 65 to 74 Years | 39 (13.6%) | 28 (71.8%) |
| 75 Years and over | 2 (1.1%) | 0 (0.0%) |
| Total | 1,540 (53.0%) | 149 (9.7%) |
Employment Status by Educational Attainment in Ainaloa
According to labor force statistics for Ainaloa, 65.3% of individuals (1,183) out of the total population between 25 and 64 years of age (1,811) are in the labor force, with 8.5% or 101 of them being unemployed. The group with the highest labor force participation rate are those with the educational attainment of bachelor's degree or higher, with 100.0% or 191 individuals in the labor force. Within the labor force, individuals with high school diploma education have the highest percentage of unemployment, with 15.0% or 70 of them being unemployed.
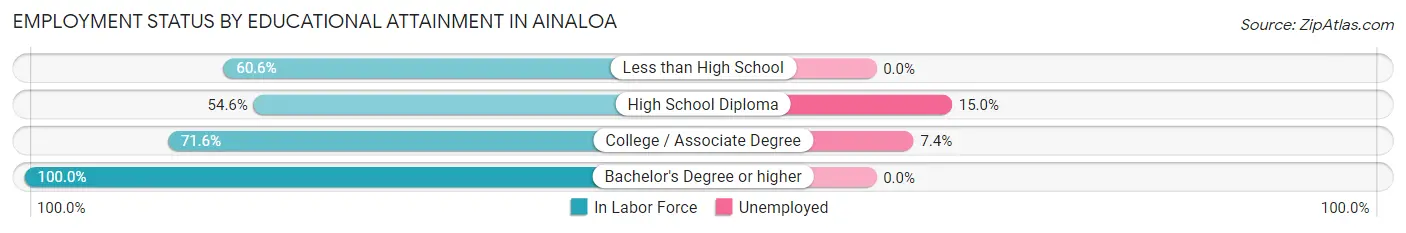
| Educational Attainment | In Labor Force | Unemployed |
| Less than High School | 123 (60.6%) | 0 (0.0%) |
| High School Diploma | 466 (54.6%) | 128 (15.0%) |
| College / Associate Degree | 403 (71.6%) | 42 (7.4%) |
| Bachelor's Degree or higher | 191 (100.0%) | 0 (0.0%) |
| Total | 1,183 (65.3%) | 154 (8.5%) |
Employment Occupations by Sex in Ainaloa
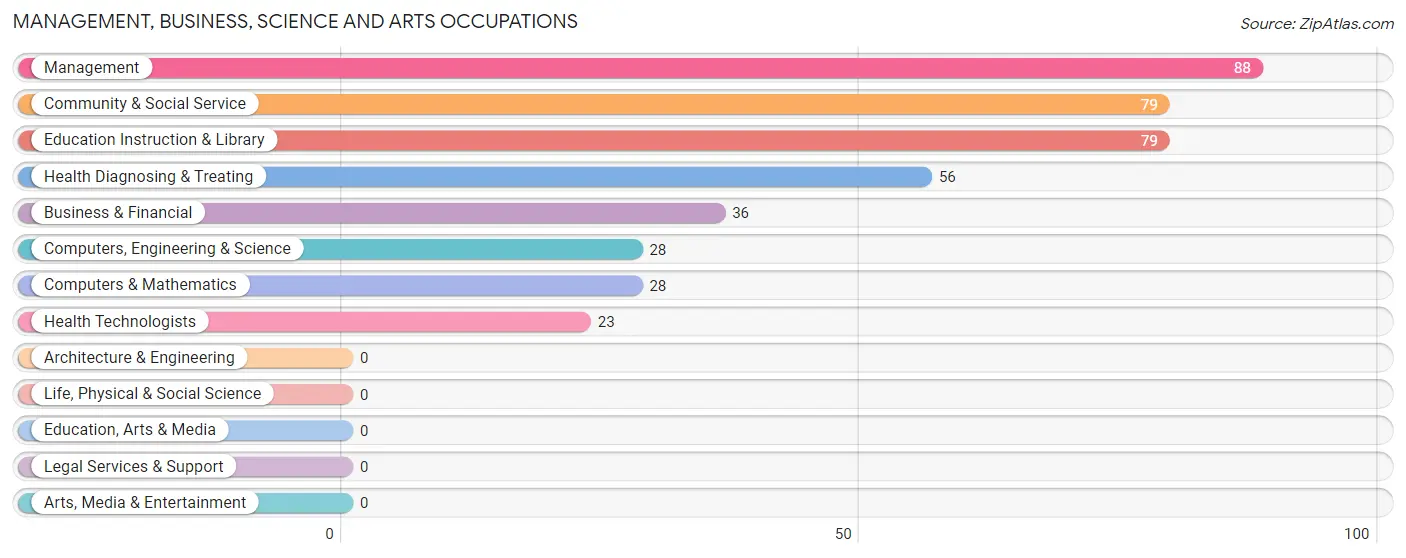
Management, Business, Science and Arts Occupations
The most common Management, Business, Science and Arts occupations in Ainaloa are Management (88 | 6.3%), Community & Social Service (79 | 5.7%), Education Instruction & Library (79 | 5.7%), Health Diagnosing & Treating (56 | 4.0%), and Business & Financial (36 | 2.6%).
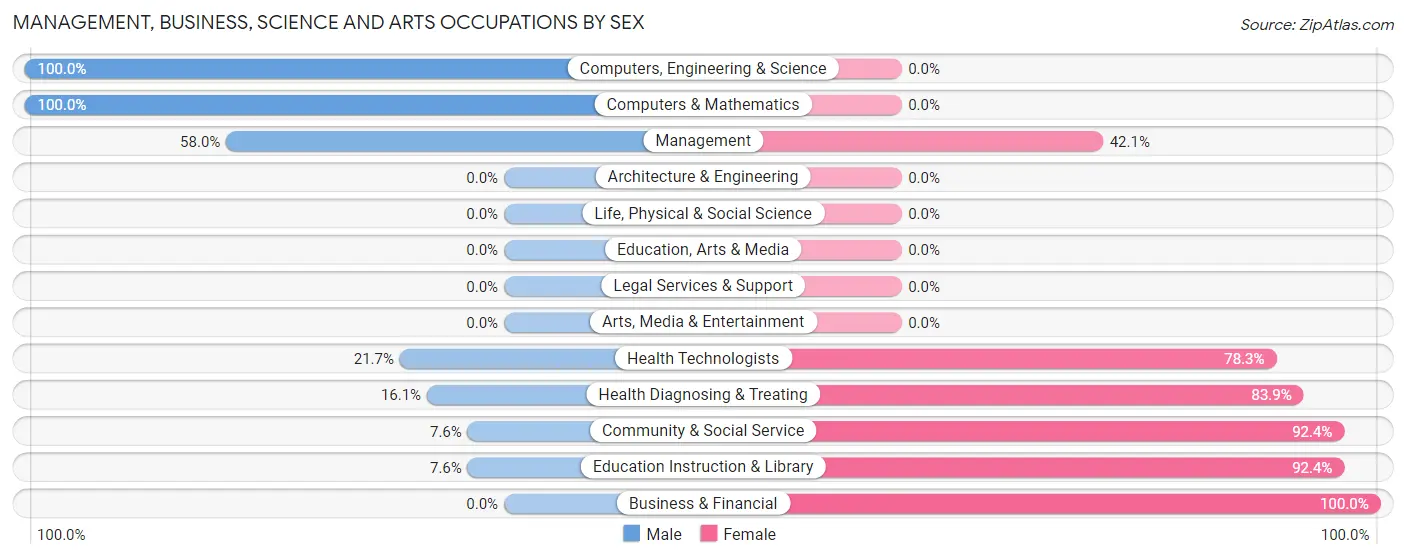
Management, Business, Science and Arts Occupations by Sex
Within the Management, Business, Science and Arts occupations in Ainaloa, the most male-oriented occupations are Computers, Engineering & Science (100.0%), Computers & Mathematics (100.0%), and Management (58.0%), while the most female-oriented occupations are Business & Financial (100.0%), Community & Social Service (92.4%), and Education Instruction & Library (92.4%).
| Occupation | Male | Female |
| Management | 51 (58.0%) | 37 (42.0%) |
| Business & Financial | 0 (0.0%) | 36 (100.0%) |
| Computers, Engineering & Science | 28 (100.0%) | 0 (0.0%) |
| Computers & Mathematics | 28 (100.0%) | 0 (0.0%) |
| Architecture & Engineering | 0 (0.0%) | 0 (0.0%) |
| Life, Physical & Social Science | 0 (0.0%) | 0 (0.0%) |
| Community & Social Service | 6 (7.6%) | 73 (92.4%) |
| Education, Arts & Media | 0 (0.0%) | 0 (0.0%) |
| Legal Services & Support | 0 (0.0%) | 0 (0.0%) |
| Education Instruction & Library | 6 (7.6%) | 73 (92.4%) |
| Arts, Media & Entertainment | 0 (0.0%) | 0 (0.0%) |
| Health Diagnosing & Treating | 9 (16.1%) | 47 (83.9%) |
| Health Technologists | 5 (21.7%) | 18 (78.3%) |
| Total (Category) | 94 (32.8%) | 193 (67.2%) |
| Total (Overall) | 794 (57.2%) | 595 (42.8%) |
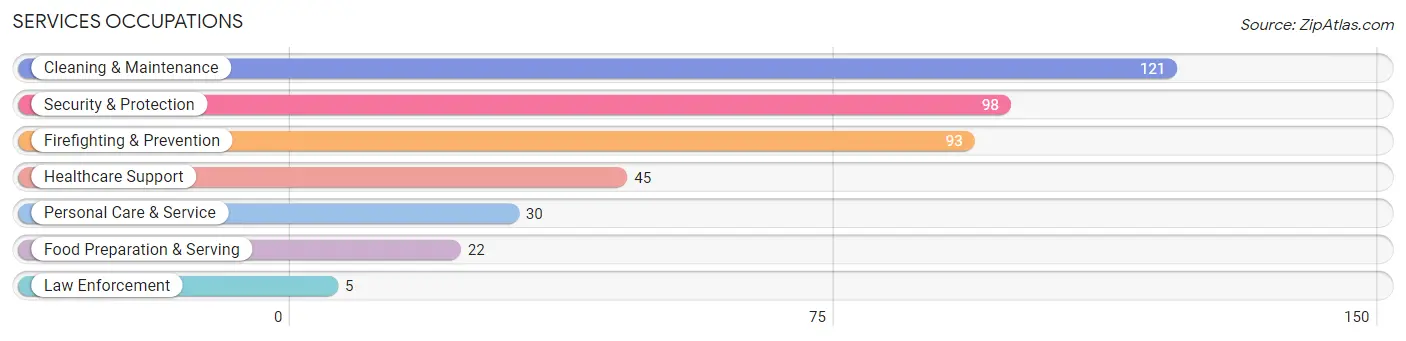
Services Occupations
The most common Services occupations in Ainaloa are Cleaning & Maintenance (121 | 8.7%), Security & Protection (98 | 7.1%), Firefighting & Prevention (93 | 6.7%), Healthcare Support (45 | 3.2%), and Personal Care & Service (30 | 2.2%).
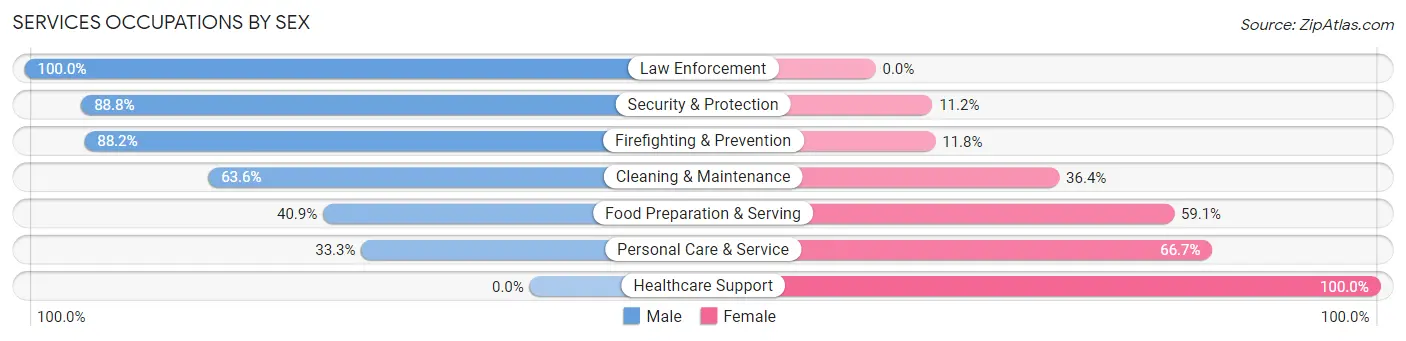
Services Occupations by Sex
Within the Services occupations in Ainaloa, the most male-oriented occupations are Law Enforcement (100.0%), Security & Protection (88.8%), and Firefighting & Prevention (88.2%), while the most female-oriented occupations are Healthcare Support (100.0%), Personal Care & Service (66.7%), and Food Preparation & Serving (59.1%).
| Occupation | Male | Female |
| Healthcare Support | 0 (0.0%) | 45 (100.0%) |
| Security & Protection | 87 (88.8%) | 11 (11.2%) |
| Firefighting & Prevention | 82 (88.2%) | 11 (11.8%) |
| Law Enforcement | 5 (100.0%) | 0 (0.0%) |
| Food Preparation & Serving | 9 (40.9%) | 13 (59.1%) |
| Cleaning & Maintenance | 77 (63.6%) | 44 (36.4%) |
| Personal Care & Service | 10 (33.3%) | 20 (66.7%) |
| Total (Category) | 183 (57.9%) | 133 (42.1%) |
| Total (Overall) | 794 (57.2%) | 595 (42.8%) |
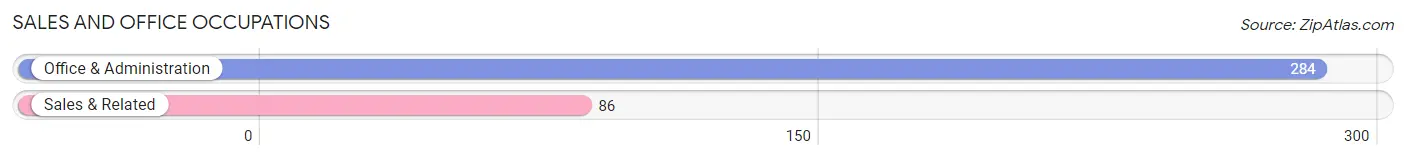
Sales and Office Occupations
The most common Sales and Office occupations in Ainaloa are Office & Administration (284 | 20.4%), and Sales & Related (86 | 6.2%).
Sales and Office Occupations by Sex
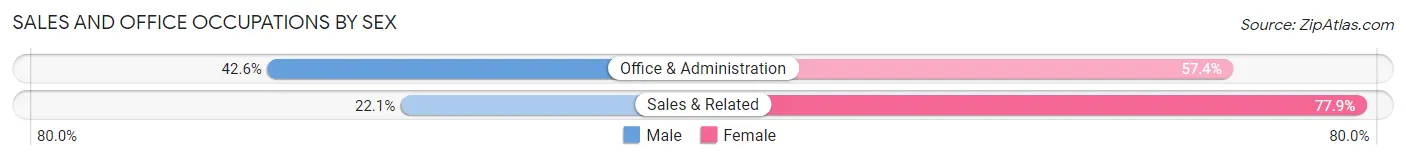
| Occupation | Male | Female |
| Sales & Related | 19 (22.1%) | 67 (77.9%) |
| Office & Administration | 121 (42.6%) | 163 (57.4%) |
| Total (Category) | 140 (37.8%) | 230 (62.2%) |
| Total (Overall) | 794 (57.2%) | 595 (42.8%) |
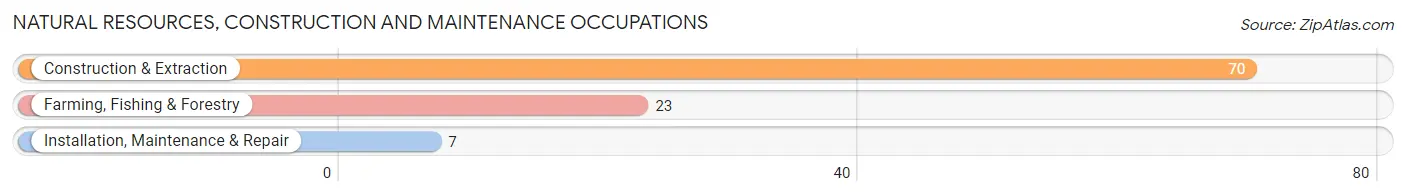
Natural Resources, Construction and Maintenance Occupations
The most common Natural Resources, Construction and Maintenance occupations in Ainaloa are Construction & Extraction (70 | 5.0%), Farming, Fishing & Forestry (23 | 1.7%), and Installation, Maintenance & Repair (7 | 0.5%).
Natural Resources, Construction and Maintenance Occupations by Sex
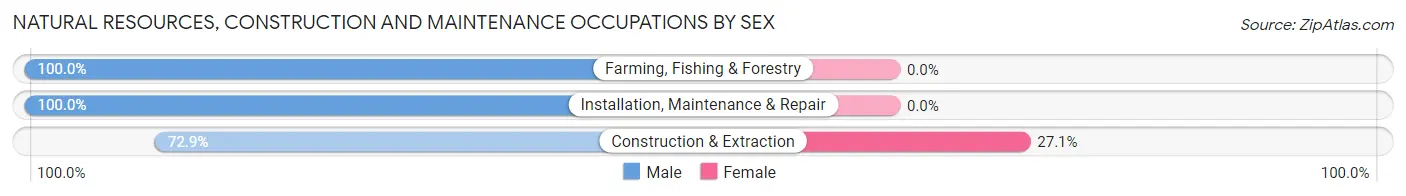
| Occupation | Male | Female |
| Farming, Fishing & Forestry | 23 (100.0%) | 0 (0.0%) |
| Construction & Extraction | 51 (72.9%) | 19 (27.1%) |
| Installation, Maintenance & Repair | 7 (100.0%) | 0 (0.0%) |
| Total (Category) | 81 (81.0%) | 19 (19.0%) |
| Total (Overall) | 794 (57.2%) | 595 (42.8%) |
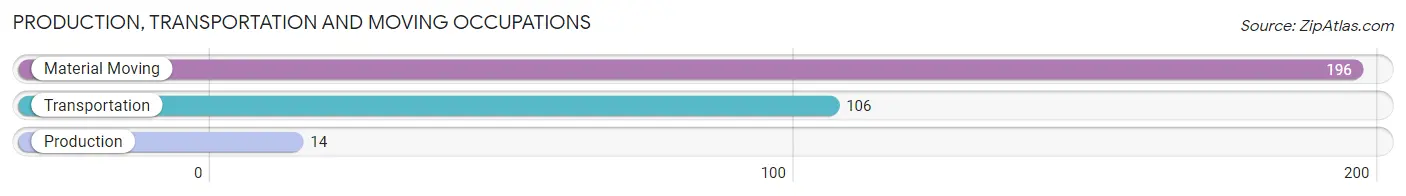
Production, Transportation and Moving Occupations
The most common Production, Transportation and Moving occupations in Ainaloa are Material Moving (196 | 14.1%), Transportation (106 | 7.6%), and Production (14 | 1.0%).
Production, Transportation and Moving Occupations by Sex
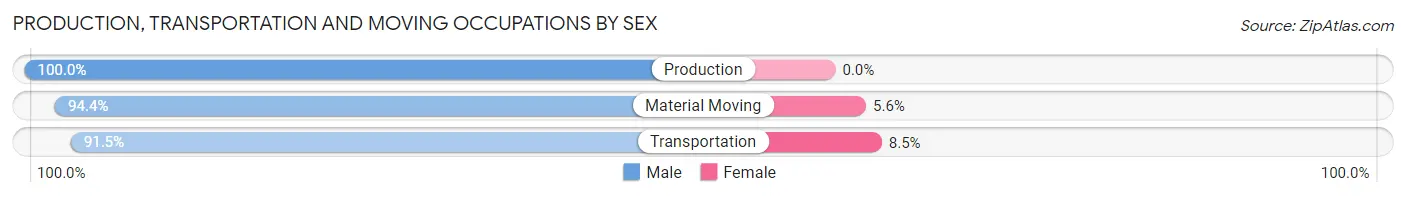
| Occupation | Male | Female |
| Production | 14 (100.0%) | 0 (0.0%) |
| Transportation | 97 (91.5%) | 9 (8.5%) |
| Material Moving | 185 (94.4%) | 11 (5.6%) |
| Total (Category) | 296 (93.7%) | 20 (6.3%) |
| Total (Overall) | 794 (57.2%) | 595 (42.8%) |
Employment Industries by Sex in Ainaloa
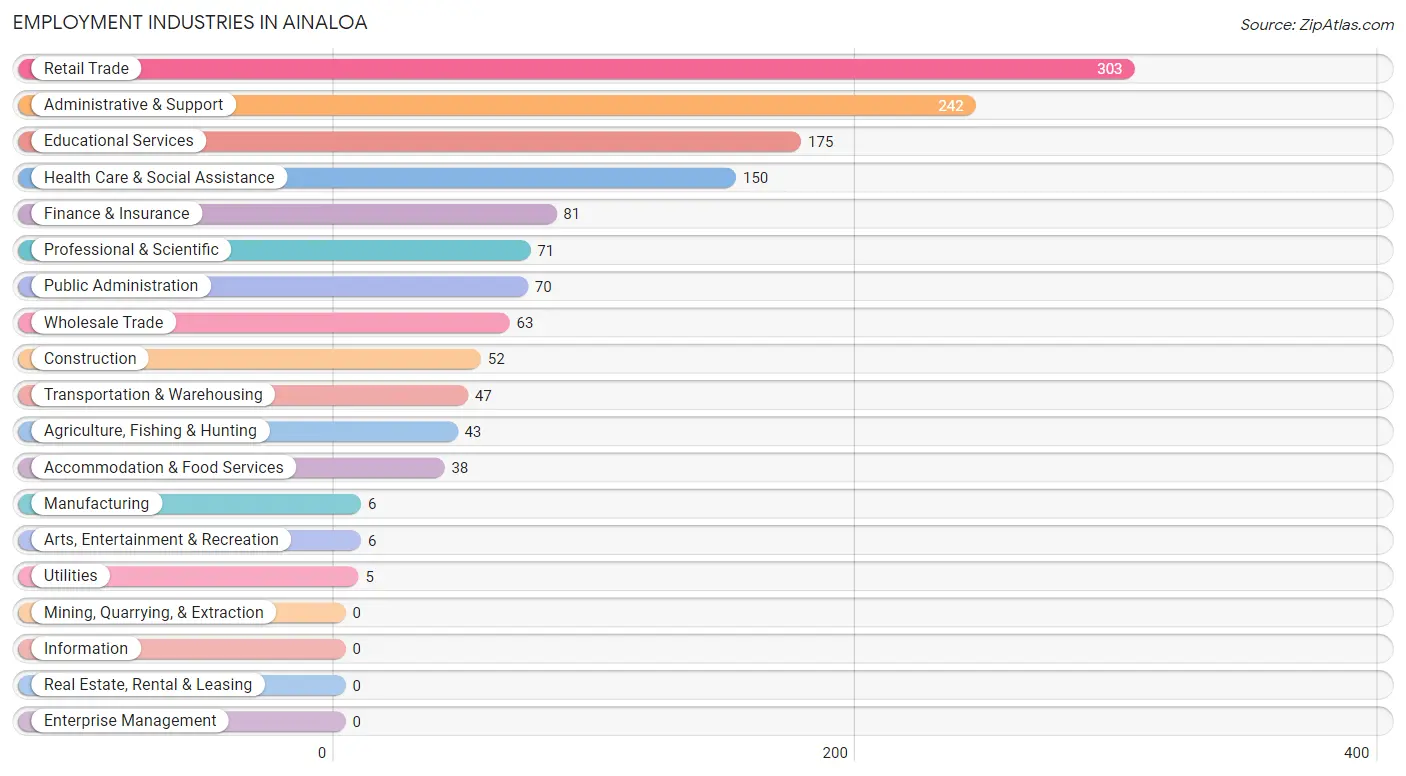
Employment Industries in Ainaloa
The major employment industries in Ainaloa include Retail Trade (303 | 21.8%), Administrative & Support (242 | 17.4%), Educational Services (175 | 12.6%), Health Care & Social Assistance (150 | 10.8%), and Finance & Insurance (81 | 5.8%).
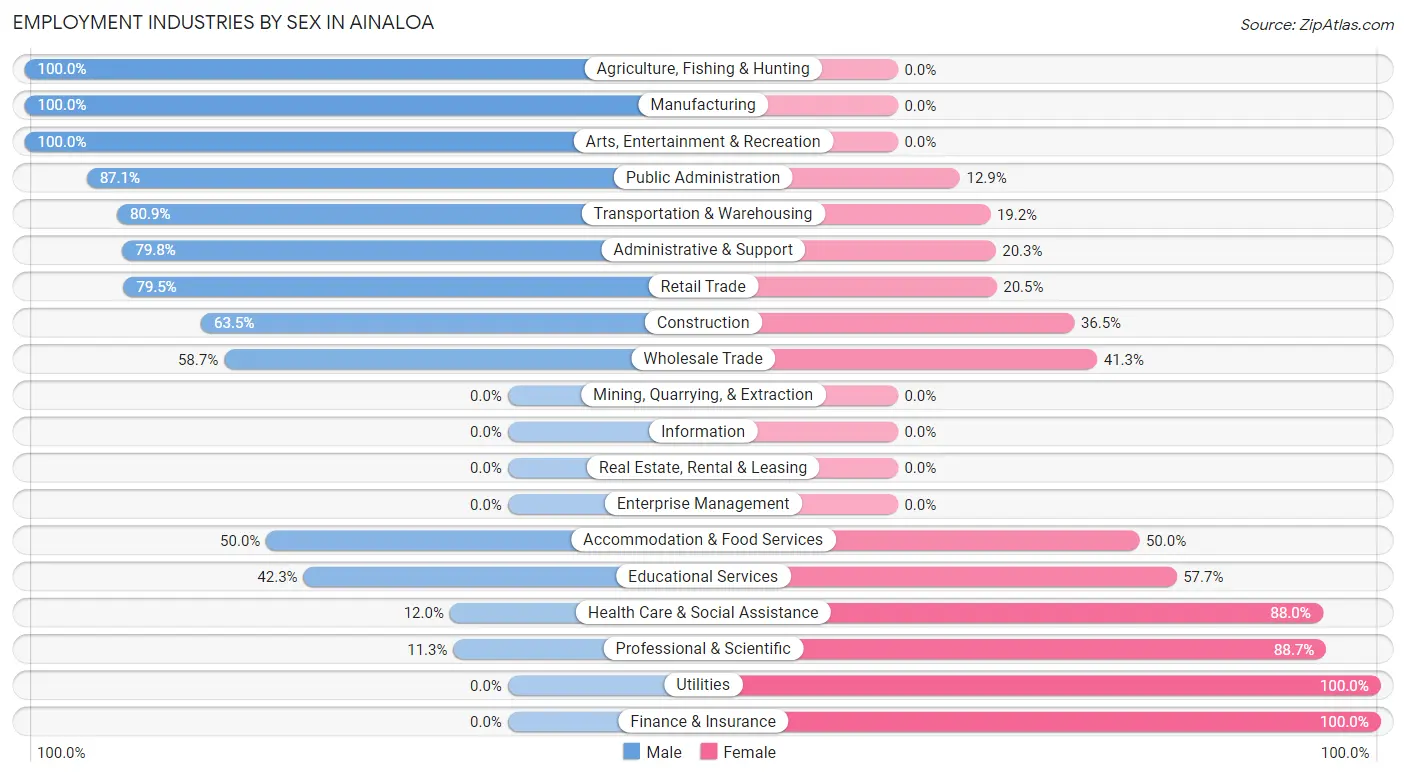
Employment Industries by Sex in Ainaloa
The Ainaloa industries that see more men than women are Agriculture, Fishing & Hunting (100.0%), Manufacturing (100.0%), and Arts, Entertainment & Recreation (100.0%), whereas the industries that tend to have a higher number of women are Utilities (100.0%), Finance & Insurance (100.0%), and Professional & Scientific (88.7%).
| Industry | Male | Female |
| Agriculture, Fishing & Hunting | 43 (100.0%) | 0 (0.0%) |
| Mining, Quarrying, & Extraction | 0 (0.0%) | 0 (0.0%) |
| Construction | 33 (63.5%) | 19 (36.5%) |
| Manufacturing | 6 (100.0%) | 0 (0.0%) |
| Wholesale Trade | 37 (58.7%) | 26 (41.3%) |
| Retail Trade | 241 (79.5%) | 62 (20.5%) |
| Transportation & Warehousing | 38 (80.8%) | 9 (19.2%) |
| Utilities | 0 (0.0%) | 5 (100.0%) |
| Information | 0 (0.0%) | 0 (0.0%) |
| Finance & Insurance | 0 (0.0%) | 81 (100.0%) |
| Real Estate, Rental & Leasing | 0 (0.0%) | 0 (0.0%) |
| Professional & Scientific | 8 (11.3%) | 63 (88.7%) |
| Enterprise Management | 0 (0.0%) | 0 (0.0%) |
| Administrative & Support | 193 (79.7%) | 49 (20.3%) |
| Educational Services | 74 (42.3%) | 101 (57.7%) |
| Health Care & Social Assistance | 18 (12.0%) | 132 (88.0%) |
| Arts, Entertainment & Recreation | 6 (100.0%) | 0 (0.0%) |
| Accommodation & Food Services | 19 (50.0%) | 19 (50.0%) |
| Public Administration | 61 (87.1%) | 9 (12.9%) |
| Total | 794 (57.2%) | 595 (42.8%) |
Education in Ainaloa
School Enrollment in Ainaloa
The most common levels of schooling among the 1,060 students in Ainaloa are elementary school (332 | 31.3%), high school (278 | 26.2%), and middle school (213 | 20.1%).
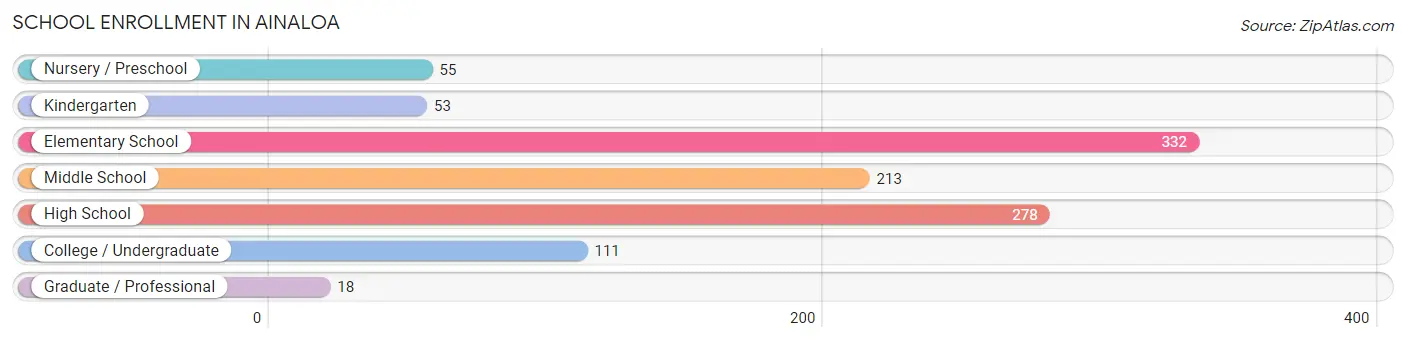
| School Level | # Students | % Students |
| Nursery / Preschool | 55 | 5.2% |
| Kindergarten | 53 | 5.0% |
| Elementary School | 332 | 31.3% |
| Middle School | 213 | 20.1% |
| High School | 278 | 26.2% |
| College / Undergraduate | 111 | 10.5% |
| Graduate / Professional | 18 | 1.7% |
| Total | 1,060 | 100.0% |
School Enrollment by Age by Funding Source in Ainaloa
Out of a total of 1,060 students who are enrolled in schools in Ainaloa, 260 (24.5%) attend a private institution, while the remaining 800 (75.5%) are enrolled in public schools. The age group of 3 to 4 year olds has the highest likelihood of being enrolled in private schools, with 46 (100.0% in the age bracket) enrolled. Conversely, the age group of 20 to 24 year olds has the lowest likelihood of being enrolled in a private school, with 27 (100.0% in the age bracket) attending a public institution.
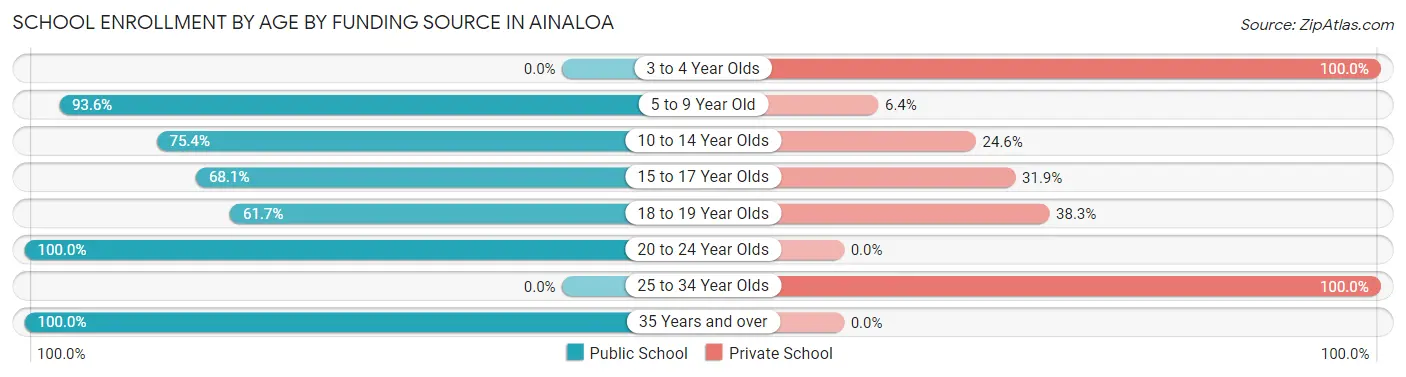
| Age Bracket | Public School | Private School |
| 3 to 4 Year Olds | 0 (0.0%) | 46 (100.0%) |
| 5 to 9 Year Old | 322 (93.6%) | 22 (6.4%) |
| 10 to 14 Year Olds | 224 (75.4%) | 73 (24.6%) |
| 15 to 17 Year Olds | 81 (68.1%) | 38 (31.9%) |
| 18 to 19 Year Olds | 121 (61.7%) | 75 (38.3%) |
| 20 to 24 Year Olds | 27 (100.0%) | 0 (0.0%) |
| 25 to 34 Year Olds | 0 (0.0%) | 6 (100.0%) |
| 35 Years and over | 25 (100.0%) | 0 (0.0%) |
| Total | 800 (75.5%) | 260 (24.5%) |
Educational Attainment by Field of Study in Ainaloa
Education (71 | 21.8%), social sciences (45 | 13.8%), communications (41 | 12.6%), computers & mathematics (39 | 12.0%), and arts & humanities (37 | 11.4%) are the most common fields of study among 326 individuals in Ainaloa who have obtained a bachelor's degree or higher.
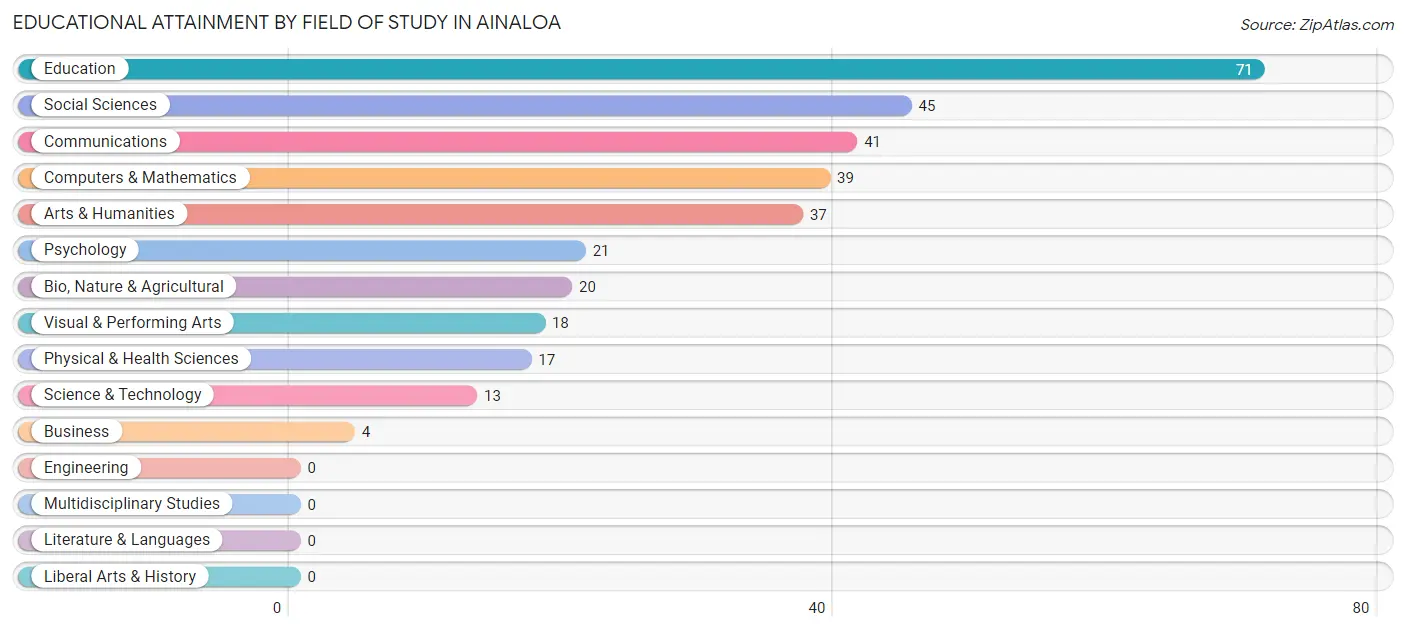
| Field of Study | # Graduates | % Graduates |
| Computers & Mathematics | 39 | 12.0% |
| Bio, Nature & Agricultural | 20 | 6.1% |
| Physical & Health Sciences | 17 | 5.2% |
| Psychology | 21 | 6.4% |
| Social Sciences | 45 | 13.8% |
| Engineering | 0 | 0.0% |
| Multidisciplinary Studies | 0 | 0.0% |
| Science & Technology | 13 | 4.0% |
| Business | 4 | 1.2% |
| Education | 71 | 21.8% |
| Literature & Languages | 0 | 0.0% |
| Liberal Arts & History | 0 | 0.0% |
| Visual & Performing Arts | 18 | 5.5% |
| Communications | 41 | 12.6% |
| Arts & Humanities | 37 | 11.4% |
| Total | 326 | 100.0% |
Transportation & Commute in Ainaloa
Vehicle Availability by Sex in Ainaloa
The most prevalent vehicle ownership categories in Ainaloa are males with 2 vehicles (377, accounting for 49.1%) and females with 2 vehicles (206, making up 66.4%).
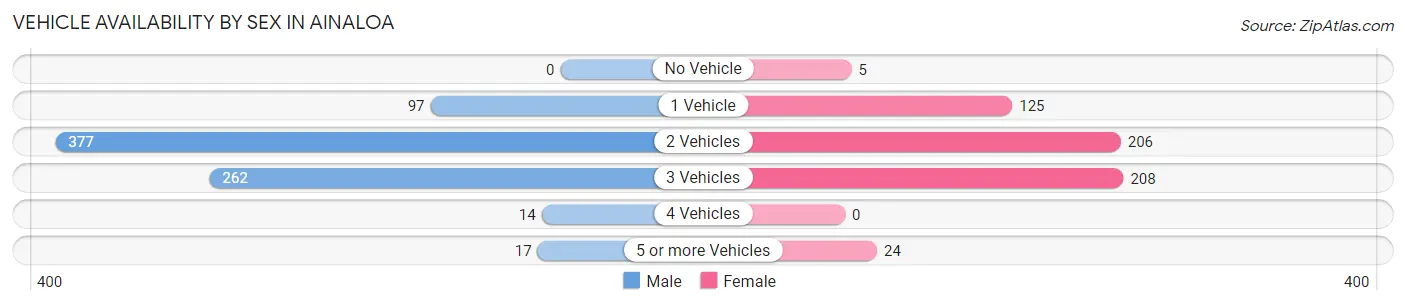
| Vehicles Available | Male | Female |
| No Vehicle | 0 (0.0%) | 5 (0.9%) |
| 1 Vehicle | 97 (12.7%) | 125 (22.0%) |
| 2 Vehicles | 377 (49.1%) | 206 (36.3%) |
| 3 Vehicles | 262 (34.2%) | 208 (36.6%) |
| 4 Vehicles | 14 (1.8%) | 0 (0.0%) |
| 5 or more Vehicles | 17 (2.2%) | 24 (4.2%) |
| Total | 767 (100.0%) | 568 (100.0%) |
Commute Time in Ainaloa
The most frequently occuring commute durations in Ainaloa are 30 to 34 minutes (296 commuters, 23.9%), 20 to 24 minutes (295 commuters, 23.8%), and 25 to 29 minutes (134 commuters, 10.8%).
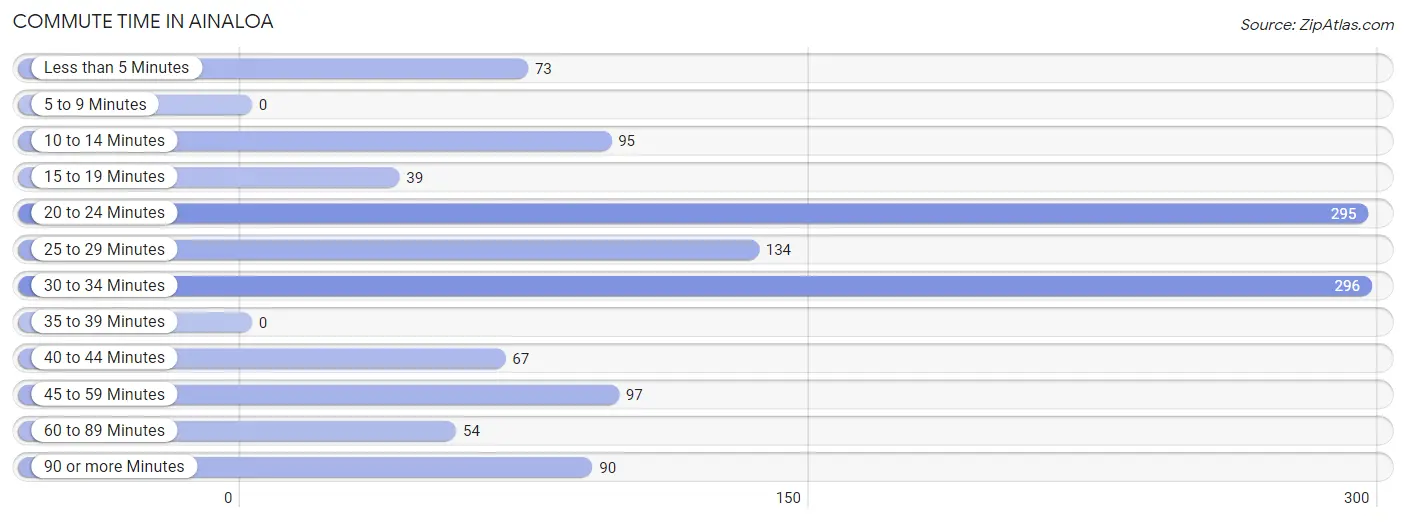
| Commute Time | # Commuters | % Commuters |
| Less than 5 Minutes | 73 | 5.9% |
| 5 to 9 Minutes | 0 | 0.0% |
| 10 to 14 Minutes | 95 | 7.7% |
| 15 to 19 Minutes | 39 | 3.2% |
| 20 to 24 Minutes | 295 | 23.8% |
| 25 to 29 Minutes | 134 | 10.8% |
| 30 to 34 Minutes | 296 | 23.9% |
| 35 to 39 Minutes | 0 | 0.0% |
| 40 to 44 Minutes | 67 | 5.4% |
| 45 to 59 Minutes | 97 | 7.8% |
| 60 to 89 Minutes | 54 | 4.3% |
| 90 or more Minutes | 90 | 7.3% |
Commute Time by Sex in Ainaloa
The most common commute times in Ainaloa are 20 to 24 minutes (209 commuters, 27.5%) for males and 30 to 34 minutes (150 commuters, 31.2%) for females.
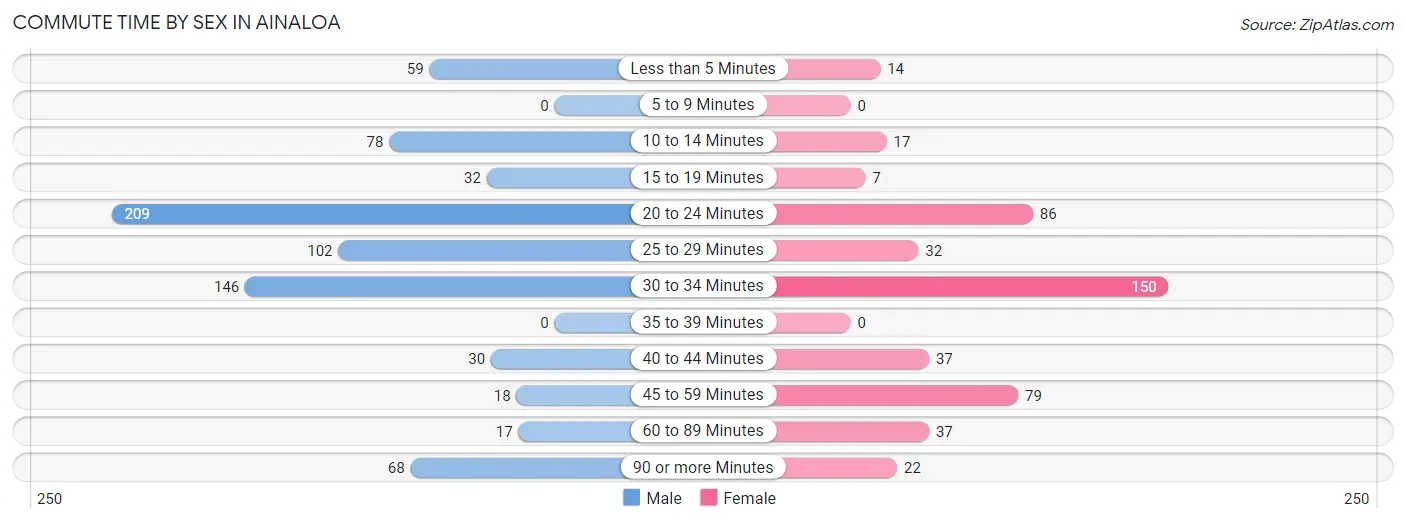
| Commute Time | Male | Female |
| Less than 5 Minutes | 59 (7.8%) | 14 (2.9%) |
| 5 to 9 Minutes | 0 (0.0%) | 0 (0.0%) |
| 10 to 14 Minutes | 78 (10.3%) | 17 (3.5%) |
| 15 to 19 Minutes | 32 (4.2%) | 7 (1.5%) |
| 20 to 24 Minutes | 209 (27.5%) | 86 (17.9%) |
| 25 to 29 Minutes | 102 (13.4%) | 32 (6.7%) |
| 30 to 34 Minutes | 146 (19.2%) | 150 (31.2%) |
| 35 to 39 Minutes | 0 (0.0%) | 0 (0.0%) |
| 40 to 44 Minutes | 30 (4.0%) | 37 (7.7%) |
| 45 to 59 Minutes | 18 (2.4%) | 79 (16.4%) |
| 60 to 89 Minutes | 17 (2.2%) | 37 (7.7%) |
| 90 or more Minutes | 68 (9.0%) | 22 (4.6%) |
Time of Departure to Work by Sex in Ainaloa
The most frequent times of departure to work in Ainaloa are 5:00 AM to 5:29 AM (179, 23.6%) for males and 6:30 AM to 6:59 AM (132, 27.4%) for females.
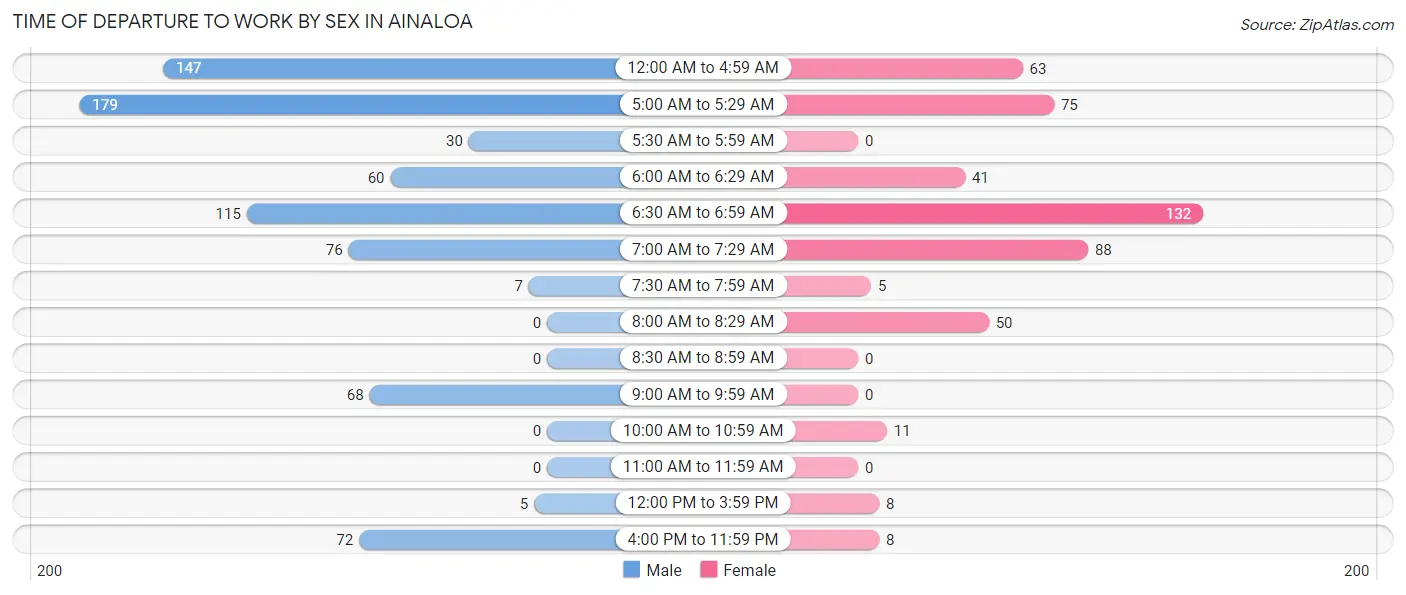
| Time of Departure | Male | Female |
| 12:00 AM to 4:59 AM | 147 (19.4%) | 63 (13.1%) |
| 5:00 AM to 5:29 AM | 179 (23.6%) | 75 (15.6%) |
| 5:30 AM to 5:59 AM | 30 (4.0%) | 0 (0.0%) |
| 6:00 AM to 6:29 AM | 60 (7.9%) | 41 (8.5%) |
| 6:30 AM to 6:59 AM | 115 (15.1%) | 132 (27.4%) |
| 7:00 AM to 7:29 AM | 76 (10.0%) | 88 (18.3%) |
| 7:30 AM to 7:59 AM | 7 (0.9%) | 5 (1.0%) |
| 8:00 AM to 8:29 AM | 0 (0.0%) | 50 (10.4%) |
| 8:30 AM to 8:59 AM | 0 (0.0%) | 0 (0.0%) |
| 9:00 AM to 9:59 AM | 68 (9.0%) | 0 (0.0%) |
| 10:00 AM to 10:59 AM | 0 (0.0%) | 11 (2.3%) |
| 11:00 AM to 11:59 AM | 0 (0.0%) | 0 (0.0%) |
| 12:00 PM to 3:59 PM | 5 (0.7%) | 8 (1.7%) |
| 4:00 PM to 11:59 PM | 72 (9.5%) | 8 (1.7%) |
| Total | 759 (100.0%) | 481 (100.0%) |
Housing Occupancy in Ainaloa
Occupancy by Ownership in Ainaloa
Of the total 1,472 dwellings in Ainaloa, owner-occupied units account for 1,102 (74.9%), while renter-occupied units make up 370 (25.1%).
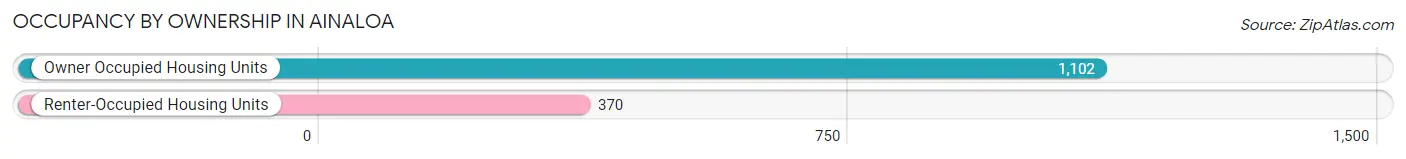
| Occupancy | # Housing Units | % Housing Units |
| Owner Occupied Housing Units | 1,102 | 74.9% |
| Renter-Occupied Housing Units | 370 | 25.1% |
| Total Occupied Housing Units | 1,472 | 100.0% |
Occupancy by Household Size in Ainaloa
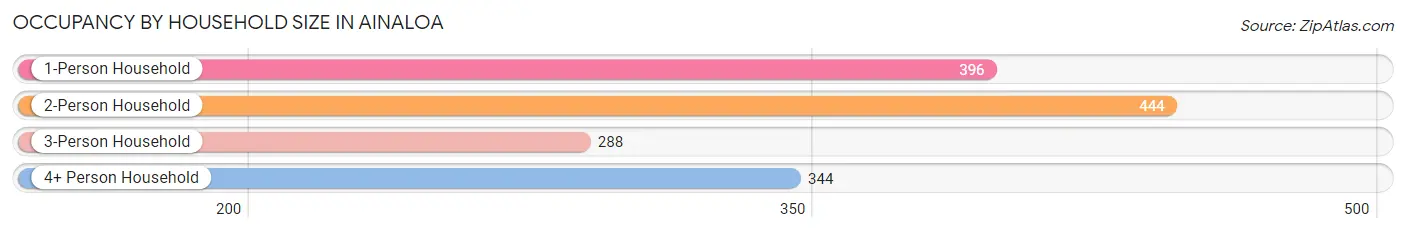
| Household Size | # Housing Units | % Housing Units |
| 1-Person Household | 396 | 26.9% |
| 2-Person Household | 444 | 30.2% |
| 3-Person Household | 288 | 19.6% |
| 4+ Person Household | 344 | 23.4% |
| Total Housing Units | 1,472 | 100.0% |
Occupancy by Ownership by Household Size in Ainaloa
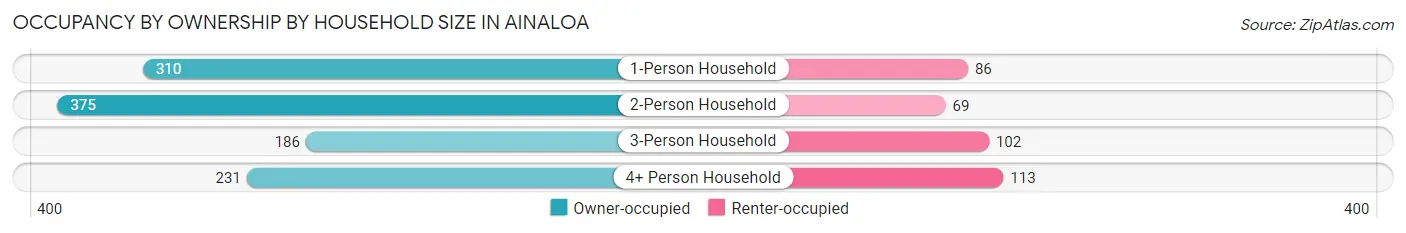
| Household Size | Owner-occupied | Renter-occupied |
| 1-Person Household | 310 (78.3%) | 86 (21.7%) |
| 2-Person Household | 375 (84.5%) | 69 (15.5%) |
| 3-Person Household | 186 (64.6%) | 102 (35.4%) |
| 4+ Person Household | 231 (67.1%) | 113 (32.9%) |
| Total Housing Units | 1,102 (74.9%) | 370 (25.1%) |
Occupancy by Educational Attainment in Ainaloa
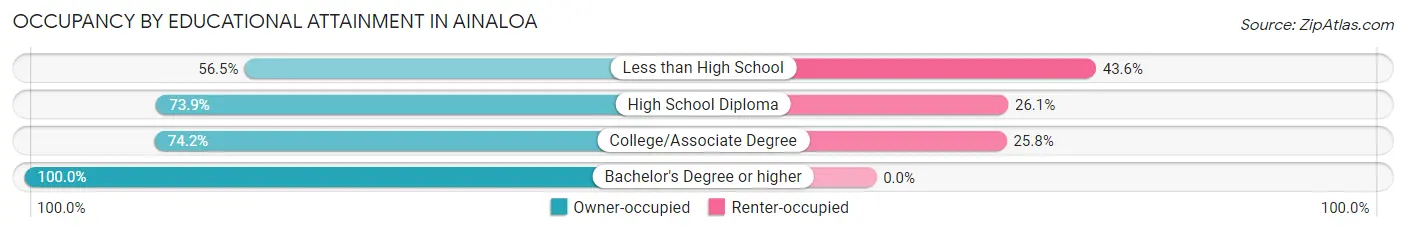
| Household Size | Owner-occupied | Renter-occupied |
| Less than High School | 105 (56.5%) | 81 (43.5%) |
| High School Diploma | 534 (73.9%) | 189 (26.1%) |
| College/Associate Degree | 287 (74.2%) | 100 (25.8%) |
| Bachelor's Degree or higher | 176 (100.0%) | 0 (0.0%) |
Occupancy by Age of Householder in Ainaloa
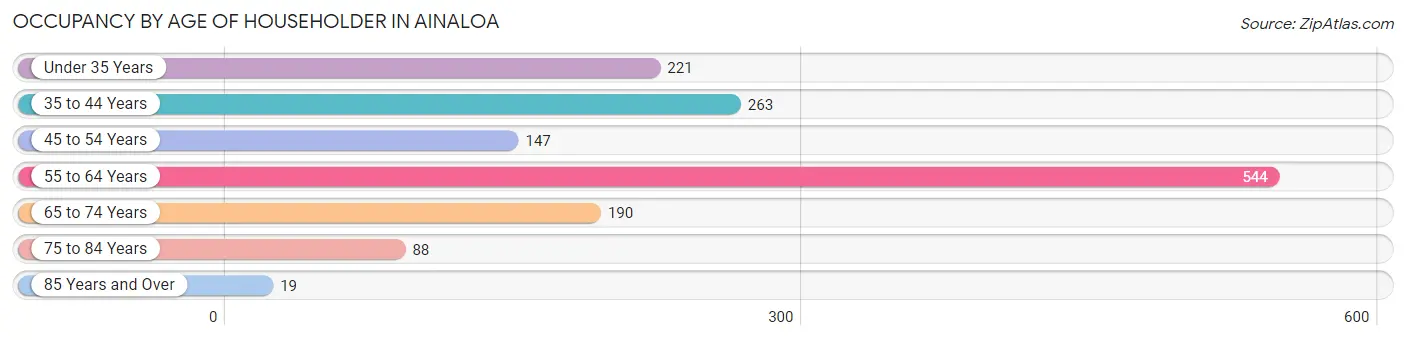
| Age Bracket | # Households | % Households |
| Under 35 Years | 221 | 15.0% |
| 35 to 44 Years | 263 | 17.9% |
| 45 to 54 Years | 147 | 10.0% |
| 55 to 64 Years | 544 | 37.0% |
| 65 to 74 Years | 190 | 12.9% |
| 75 to 84 Years | 88 | 6.0% |
| 85 Years and Over | 19 | 1.3% |
| Total | 1,472 | 100.0% |
Housing Finances in Ainaloa
Median Income by Occupancy in Ainaloa
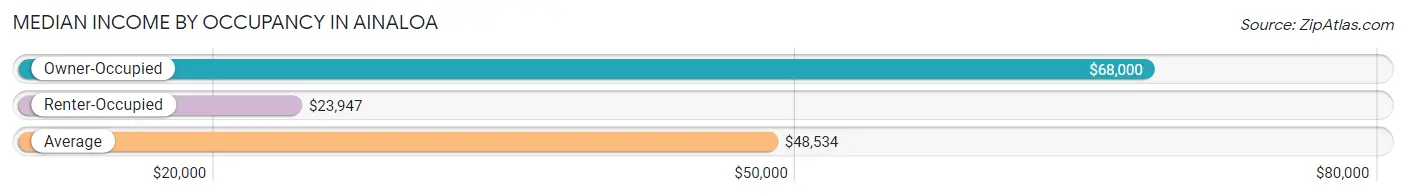
| Occupancy Type | # Households | Median Income |
| Owner-Occupied | 1,102 (74.9%) | $68,000 |
| Renter-Occupied | 370 (25.1%) | $23,947 |
| Average | 1,472 (100.0%) | $48,534 |
Occupancy by Householder Income Bracket in Ainaloa
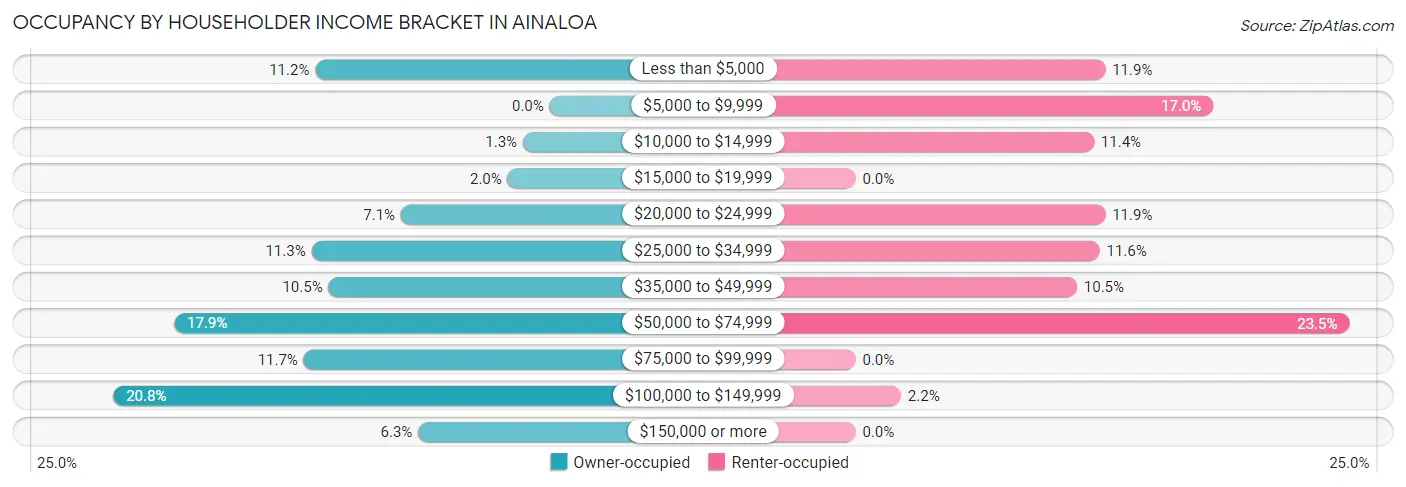
| Income Bracket | Owner-occupied | Renter-occupied |
| Less than $5,000 | 123 (11.2%) | 44 (11.9%) |
| $5,000 to $9,999 | 0 (0.0%) | 63 (17.0%) |
| $10,000 to $14,999 | 14 (1.3%) | 42 (11.4%) |
| $15,000 to $19,999 | 22 (2.0%) | 0 (0.0%) |
| $20,000 to $24,999 | 78 (7.1%) | 44 (11.9%) |
| $25,000 to $34,999 | 125 (11.3%) | 43 (11.6%) |
| $35,000 to $49,999 | 116 (10.5%) | 39 (10.5%) |
| $50,000 to $74,999 | 197 (17.9%) | 87 (23.5%) |
| $75,000 to $99,999 | 129 (11.7%) | 0 (0.0%) |
| $100,000 to $149,999 | 229 (20.8%) | 8 (2.2%) |
| $150,000 or more | 69 (6.3%) | 0 (0.0%) |
| Total | 1,102 (100.0%) | 370 (100.0%) |
Monthly Housing Cost Tiers in Ainaloa
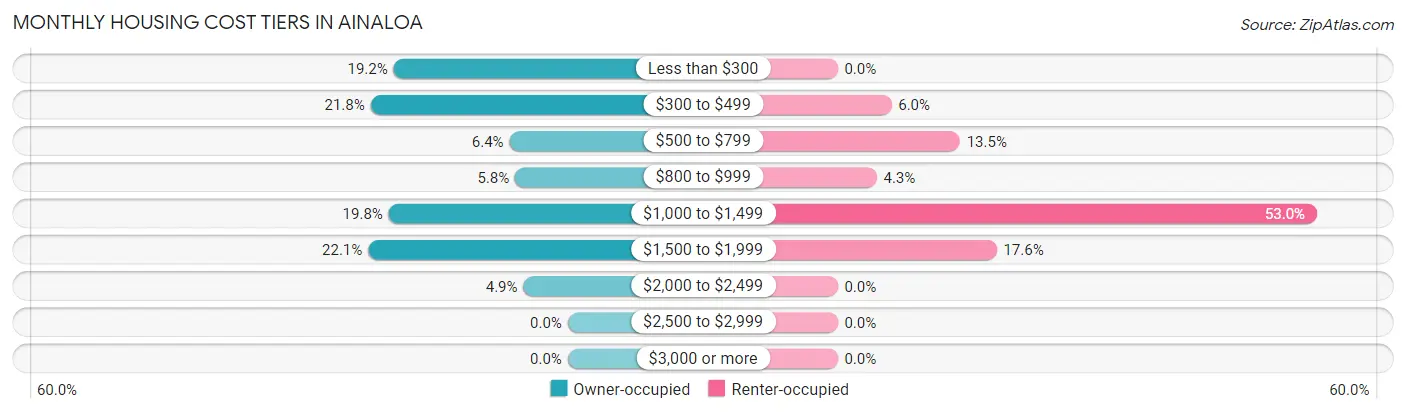
| Monthly Cost | Owner-occupied | Renter-occupied |
| Less than $300 | 212 (19.2%) | 0 (0.0%) |
| $300 to $499 | 240 (21.8%) | 22 (5.9%) |
| $500 to $799 | 71 (6.4%) | 50 (13.5%) |
| $800 to $999 | 64 (5.8%) | 16 (4.3%) |
| $1,000 to $1,499 | 218 (19.8%) | 196 (53.0%) |
| $1,500 to $1,999 | 243 (22.1%) | 65 (17.6%) |
| $2,000 to $2,499 | 54 (4.9%) | 0 (0.0%) |
| $2,500 to $2,999 | 0 (0.0%) | 0 (0.0%) |
| $3,000 or more | 0 (0.0%) | 0 (0.0%) |
| Total | 1,102 (100.0%) | 370 (100.0%) |
Physical Housing Characteristics in Ainaloa
Housing Structures in Ainaloa
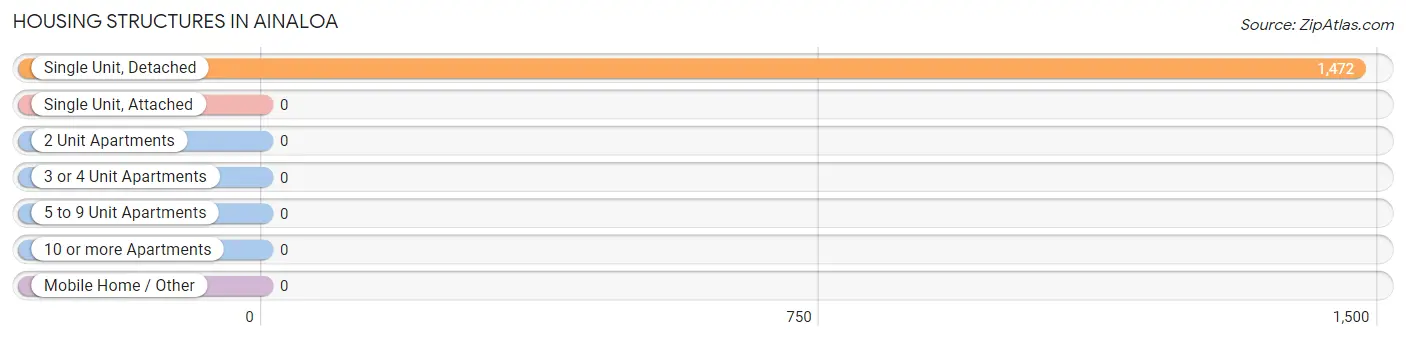
| Structure Type | # Housing Units | % Housing Units |
| Single Unit, Detached | 1,472 | 100.0% |
| Single Unit, Attached | 0 | 0.0% |
| 2 Unit Apartments | 0 | 0.0% |
| 3 or 4 Unit Apartments | 0 | 0.0% |
| 5 to 9 Unit Apartments | 0 | 0.0% |
| 10 or more Apartments | 0 | 0.0% |
| Mobile Home / Other | 0 | 0.0% |
| Total | 1,472 | 100.0% |
Housing Structures by Occupancy in Ainaloa
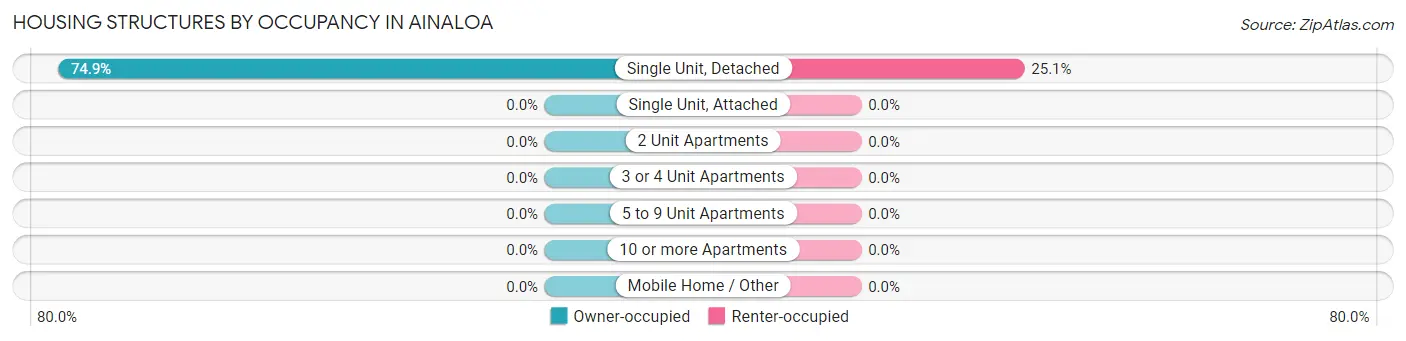
| Structure Type | Owner-occupied | Renter-occupied |
| Single Unit, Detached | 1,102 (74.9%) | 370 (25.1%) |
| Single Unit, Attached | 0 (0.0%) | 0 (0.0%) |
| 2 Unit Apartments | 0 (0.0%) | 0 (0.0%) |
| 3 or 4 Unit Apartments | 0 (0.0%) | 0 (0.0%) |
| 5 to 9 Unit Apartments | 0 (0.0%) | 0 (0.0%) |
| 10 or more Apartments | 0 (0.0%) | 0 (0.0%) |
| Mobile Home / Other | 0 (0.0%) | 0 (0.0%) |
| Total | 1,102 (74.9%) | 370 (25.1%) |
Housing Structures by Number of Rooms in Ainaloa
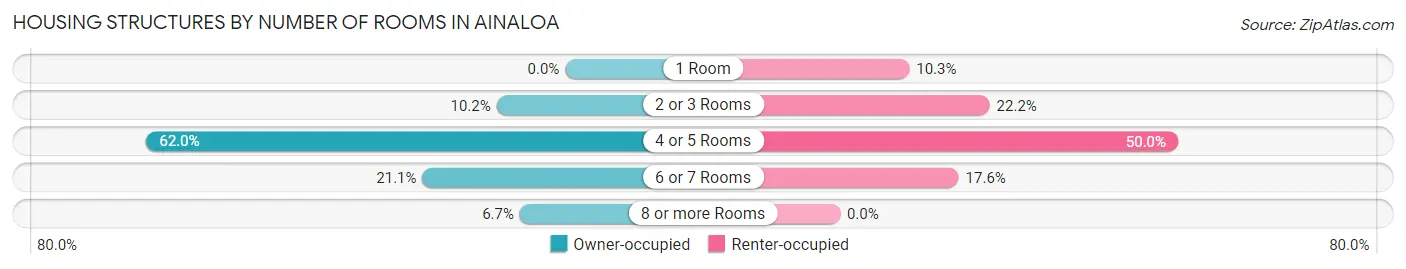
| Number of Rooms | Owner-occupied | Renter-occupied |
| 1 Room | 0 (0.0%) | 38 (10.3%) |
| 2 or 3 Rooms | 112 (10.2%) | 82 (22.2%) |
| 4 or 5 Rooms | 683 (62.0%) | 185 (50.0%) |
| 6 or 7 Rooms | 233 (21.1%) | 65 (17.6%) |
| 8 or more Rooms | 74 (6.7%) | 0 (0.0%) |
| Total | 1,102 (100.0%) | 370 (100.0%) |
Housing Structure by Heating Type in Ainaloa
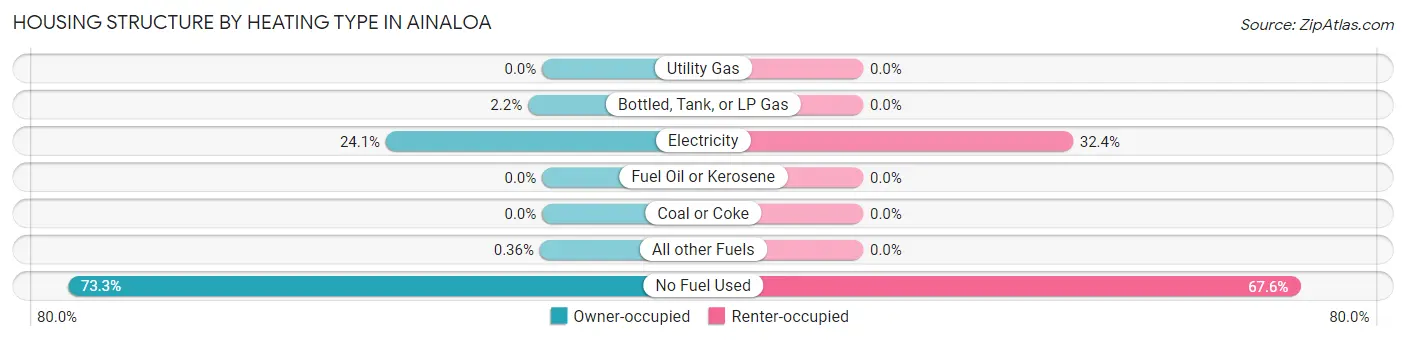
| Heating Type | Owner-occupied | Renter-occupied |
| Utility Gas | 0 (0.0%) | 0 (0.0%) |
| Bottled, Tank, or LP Gas | 24 (2.2%) | 0 (0.0%) |
| Electricity | 266 (24.1%) | 120 (32.4%) |
| Fuel Oil or Kerosene | 0 (0.0%) | 0 (0.0%) |
| Coal or Coke | 0 (0.0%) | 0 (0.0%) |
| All other Fuels | 4 (0.4%) | 0 (0.0%) |
| No Fuel Used | 808 (73.3%) | 250 (67.6%) |
| Total | 1,102 (100.0%) | 370 (100.0%) |
Household Vehicle Usage in Ainaloa
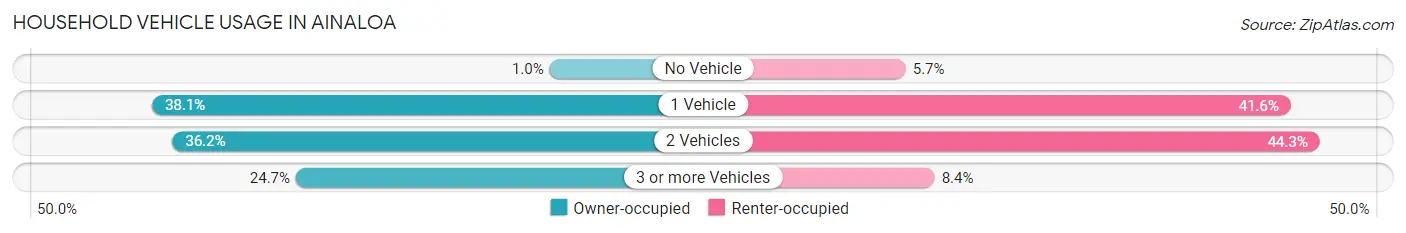
| Vehicles per Household | Owner-occupied | Renter-occupied |
| No Vehicle | 11 (1.0%) | 21 (5.7%) |
| 1 Vehicle | 420 (38.1%) | 154 (41.6%) |
| 2 Vehicles | 399 (36.2%) | 164 (44.3%) |
| 3 or more Vehicles | 272 (24.7%) | 31 (8.4%) |
| Total | 1,102 (100.0%) | 370 (100.0%) |
Real Estate & Mortgages in Ainaloa
Real Estate and Mortgage Overview in Ainaloa
| Characteristic | Without Mortgage | With Mortgage |
| Housing Units | 455 | 647 |
| Median Property Value | $151,100 | $242,000 |
| Median Household Income | - | - |
| Monthly Housing Costs | $306 | $0 |
| Real Estate Taxes | - | - |
Property Value by Mortgage Status in Ainaloa
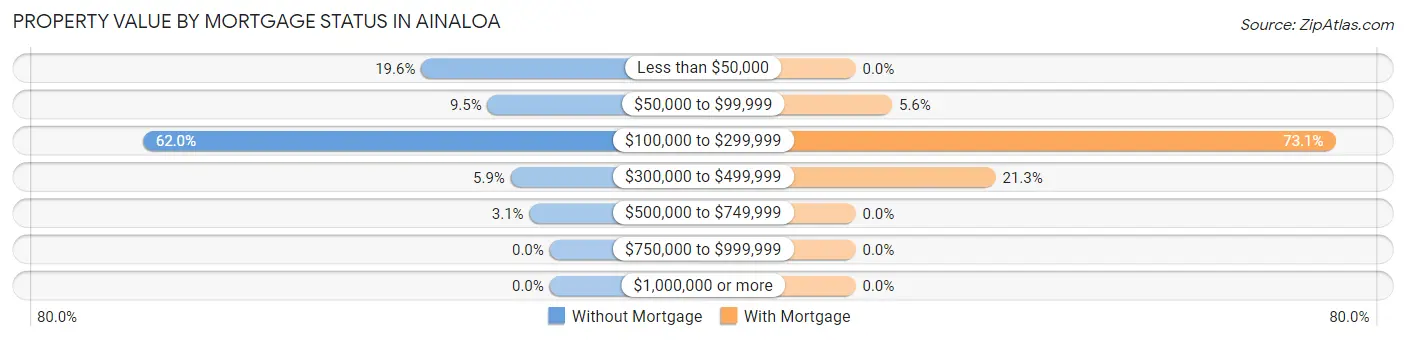
| Property Value | Without Mortgage | With Mortgage |
| Less than $50,000 | 89 (19.6%) | 0 (0.0%) |
| $50,000 to $99,999 | 43 (9.5%) | 36 (5.6%) |
| $100,000 to $299,999 | 282 (62.0%) | 473 (73.1%) |
| $300,000 to $499,999 | 27 (5.9%) | 138 (21.3%) |
| $500,000 to $749,999 | 14 (3.1%) | 0 (0.0%) |
| $750,000 to $999,999 | 0 (0.0%) | 0 (0.0%) |
| $1,000,000 or more | 0 (0.0%) | 0 (0.0%) |
| Total | 455 (100.0%) | 647 (100.0%) |
Household Income by Mortgage Status in Ainaloa
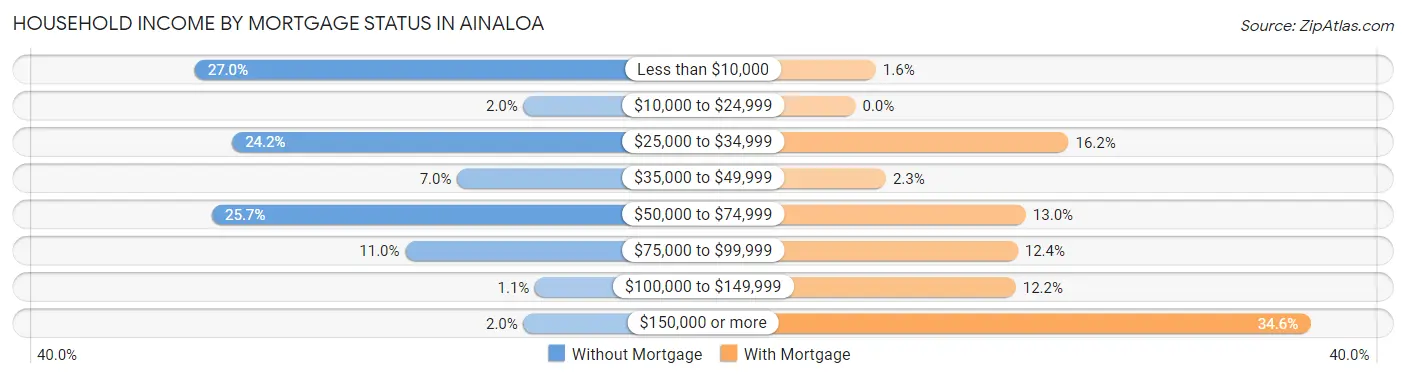
| Household Income | Without Mortgage | With Mortgage |
| Less than $10,000 | 123 (27.0%) | 10 (1.5%) |
| $10,000 to $24,999 | 9 (2.0%) | 0 (0.0%) |
| $25,000 to $34,999 | 110 (24.2%) | 105 (16.2%) |
| $35,000 to $49,999 | 32 (7.0%) | 15 (2.3%) |
| $50,000 to $74,999 | 117 (25.7%) | 84 (13.0%) |
| $75,000 to $99,999 | 50 (11.0%) | 80 (12.4%) |
| $100,000 to $149,999 | 5 (1.1%) | 79 (12.2%) |
| $150,000 or more | 9 (2.0%) | 224 (34.6%) |
| Total | 455 (100.0%) | 647 (100.0%) |
Property Value to Household Income Ratio in Ainaloa
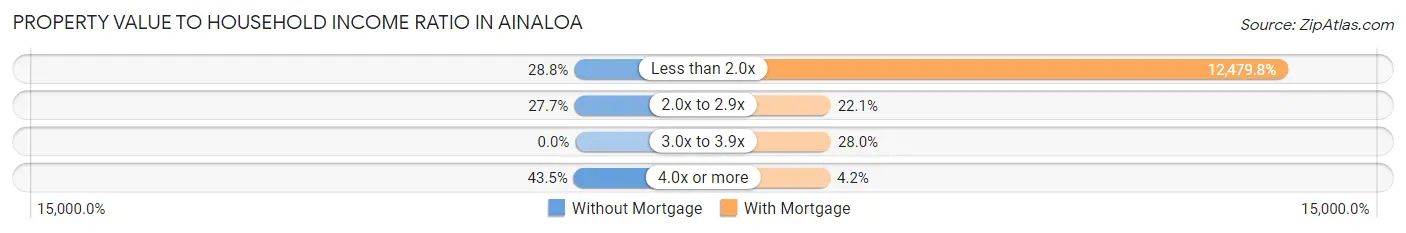
| Value-to-Income Ratio | Without Mortgage | With Mortgage |
| Less than 2.0x | 131 (28.8%) | 80,744 (12,479.7%) |
| 2.0x to 2.9x | 126 (27.7%) | 143 (22.1%) |
| 3.0x to 3.9x | 0 (0.0%) | 181 (28.0%) |
| 4.0x or more | 198 (43.5%) | 27 (4.2%) |
| Total | 455 (100.0%) | 647 (100.0%) |
Real Estate Taxes by Mortgage Status in Ainaloa
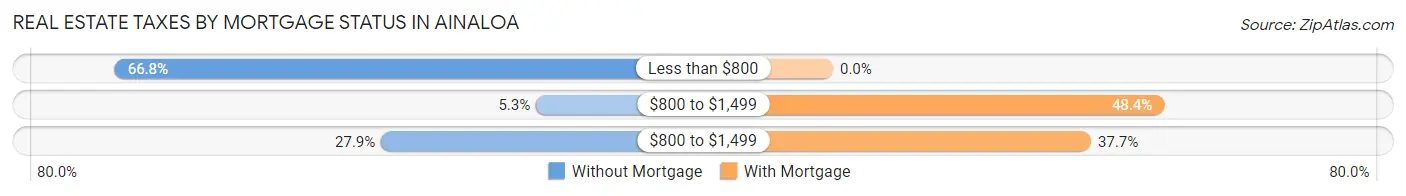
| Property Taxes | Without Mortgage | With Mortgage |
| Less than $800 | 304 (66.8%) | 0 (0.0%) |
| $800 to $1,499 | 24 (5.3%) | 313 (48.4%) |
| $800 to $1,499 | 127 (27.9%) | 244 (37.7%) |
| Total | 455 (100.0%) | 647 (100.0%) |
Health & Disability in Ainaloa
Health Insurance Coverage by Age in Ainaloa
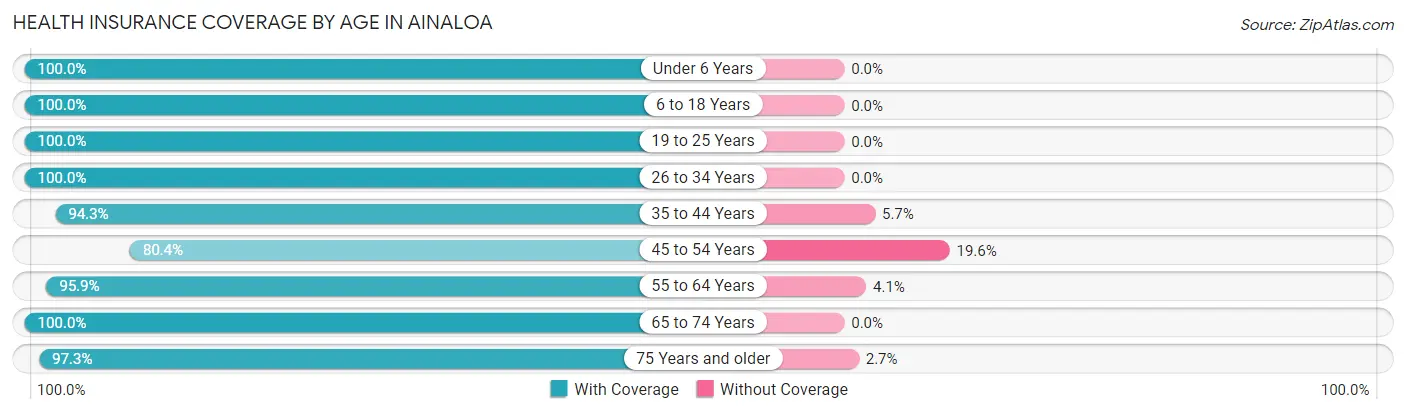
| Age Bracket | With Coverage | Without Coverage |
| Under 6 Years | 216 (100.0%) | 0 (0.0%) |
| 6 to 18 Years | 982 (100.0%) | 0 (0.0%) |
| 19 to 25 Years | 362 (100.0%) | 0 (0.0%) |
| 26 to 34 Years | 304 (100.0%) | 0 (0.0%) |
| 35 to 44 Years | 444 (94.3%) | 27 (5.7%) |
| 45 to 54 Years | 172 (80.4%) | 42 (19.6%) |
| 55 to 64 Years | 779 (95.9%) | 33 (4.1%) |
| 65 to 74 Years | 286 (100.0%) | 0 (0.0%) |
| 75 Years and older | 180 (97.3%) | 5 (2.7%) |
| Total | 3,725 (97.2%) | 107 (2.8%) |
Health Insurance Coverage by Citizenship Status in Ainaloa
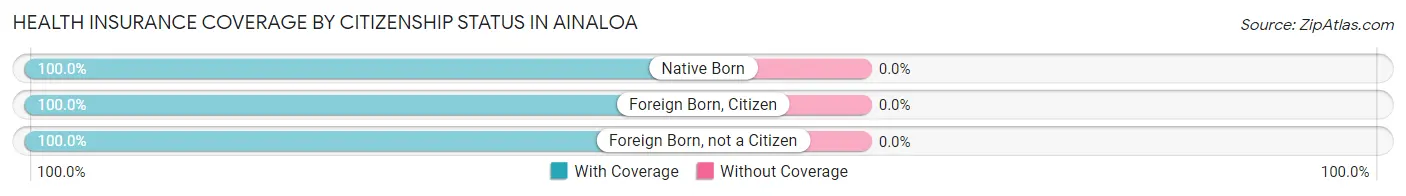
| Citizenship Status | With Coverage | Without Coverage |
| Native Born | 216 (100.0%) | 0 (0.0%) |
| Foreign Born, Citizen | 982 (100.0%) | 0 (0.0%) |
| Foreign Born, not a Citizen | 362 (100.0%) | 0 (0.0%) |
Health Insurance Coverage by Household Income in Ainaloa
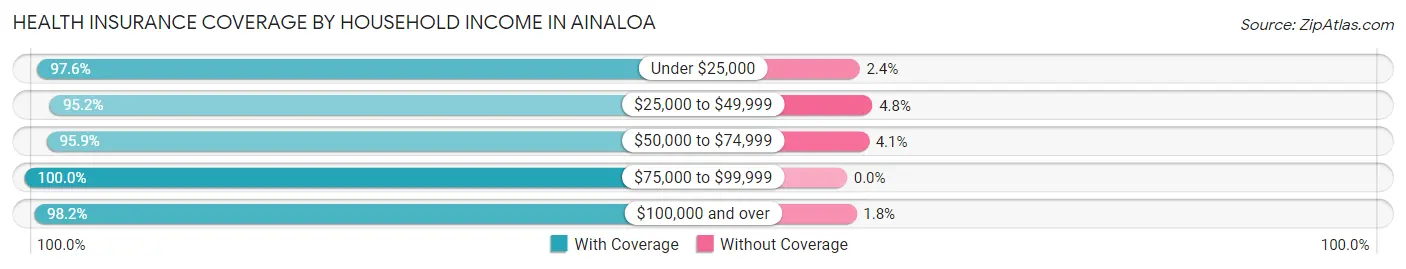
| Household Income | With Coverage | Without Coverage |
| Under $25,000 | 861 (97.6%) | 21 (2.4%) |
| $25,000 to $49,999 | 701 (95.2%) | 35 (4.8%) |
| $50,000 to $74,999 | 701 (95.9%) | 30 (4.1%) |
| $75,000 to $99,999 | 312 (100.0%) | 0 (0.0%) |
| $100,000 and over | 1,150 (98.2%) | 21 (1.8%) |
Public vs Private Health Insurance Coverage by Age in Ainaloa
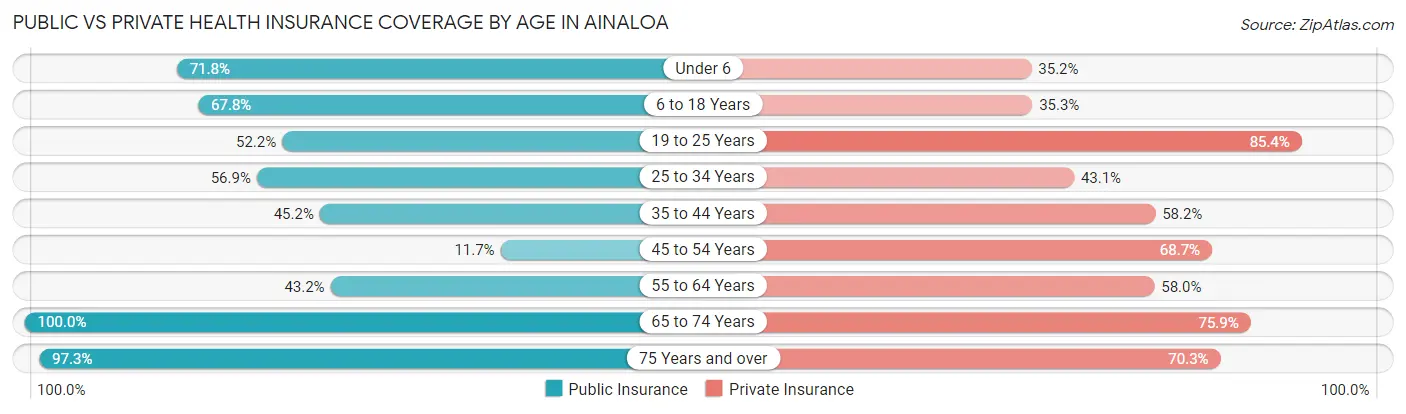
| Age Bracket | Public Insurance | Private Insurance |
| Under 6 | 155 (71.8%) | 76 (35.2%) |
| 6 to 18 Years | 666 (67.8%) | 347 (35.3%) |
| 19 to 25 Years | 189 (52.2%) | 309 (85.4%) |
| 25 to 34 Years | 173 (56.9%) | 131 (43.1%) |
| 35 to 44 Years | 213 (45.2%) | 274 (58.2%) |
| 45 to 54 Years | 25 (11.7%) | 147 (68.7%) |
| 55 to 64 Years | 351 (43.2%) | 471 (58.0%) |
| 65 to 74 Years | 286 (100.0%) | 217 (75.9%) |
| 75 Years and over | 180 (97.3%) | 130 (70.3%) |
| Total | 2,238 (58.4%) | 2,102 (54.8%) |
Disability Status by Sex by Age in Ainaloa
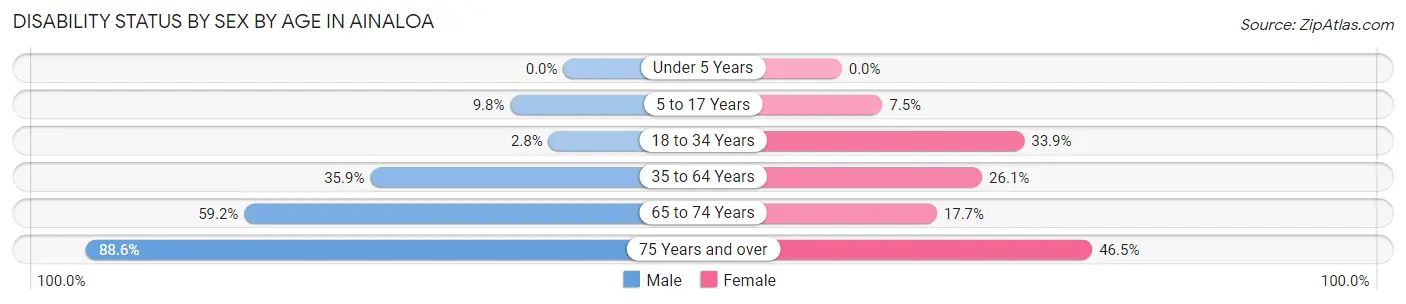
| Age Bracket | Male | Female |
| Under 5 Years | 0 (0.0%) | 0 (0.0%) |
| 5 to 17 Years | 62 (9.8%) | 18 (7.5%) |
| 18 to 34 Years | 10 (2.8%) | 146 (33.9%) |
| 35 to 64 Years | 271 (35.8%) | 193 (26.1%) |
| 65 to 74 Years | 109 (59.2%) | 18 (17.6%) |
| 75 Years and over | 101 (88.6%) | 33 (46.5%) |
Disability Class by Sex by Age in Ainaloa
Disability Class: Hearing Difficulty
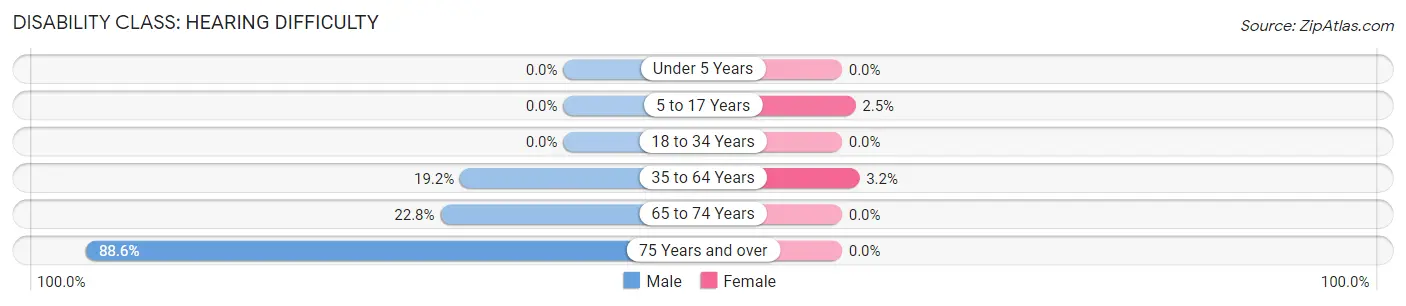
| Age Bracket | Male | Female |
| Under 5 Years | 0 (0.0%) | 0 (0.0%) |
| 5 to 17 Years | 0 (0.0%) | 6 (2.5%) |
| 18 to 34 Years | 0 (0.0%) | 0 (0.0%) |
| 35 to 64 Years | 145 (19.2%) | 24 (3.2%) |
| 65 to 74 Years | 42 (22.8%) | 0 (0.0%) |
| 75 Years and over | 101 (88.6%) | 0 (0.0%) |
Disability Class: Vision Difficulty
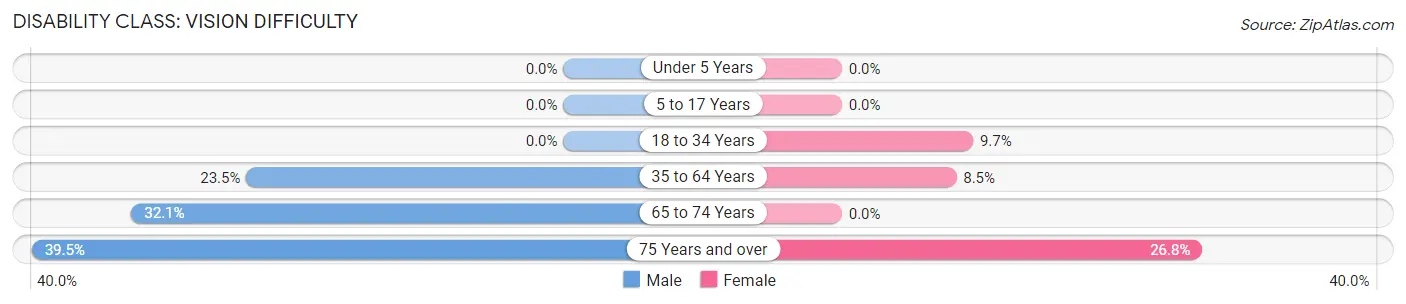
| Age Bracket | Male | Female |
| Under 5 Years | 0 (0.0%) | 0 (0.0%) |
| 5 to 17 Years | 0 (0.0%) | 0 (0.0%) |
| 18 to 34 Years | 0 (0.0%) | 42 (9.7%) |
| 35 to 64 Years | 178 (23.5%) | 63 (8.5%) |
| 65 to 74 Years | 59 (32.1%) | 0 (0.0%) |
| 75 Years and over | 45 (39.5%) | 19 (26.8%) |
Disability Class: Cognitive Difficulty
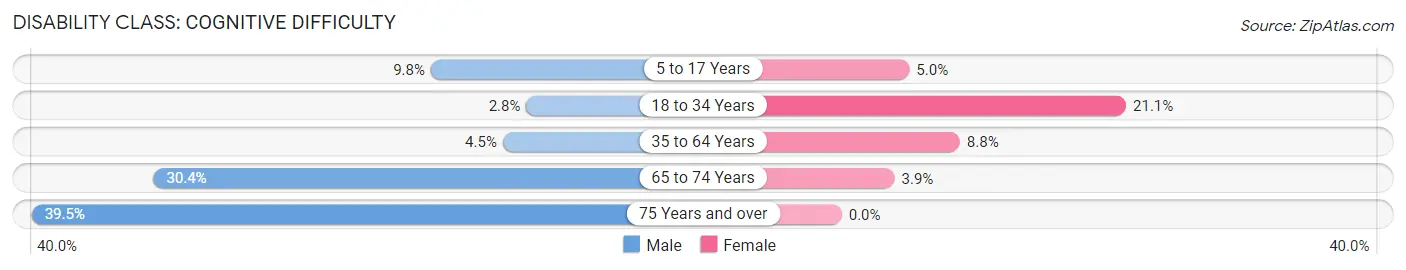
| Age Bracket | Male | Female |
| 5 to 17 Years | 62 (9.8%) | 12 (5.0%) |
| 18 to 34 Years | 10 (2.8%) | 91 (21.1%) |
| 35 to 64 Years | 34 (4.5%) | 65 (8.8%) |
| 65 to 74 Years | 56 (30.4%) | 4 (3.9%) |
| 75 Years and over | 45 (39.5%) | 0 (0.0%) |
Disability Class: Ambulatory Difficulty
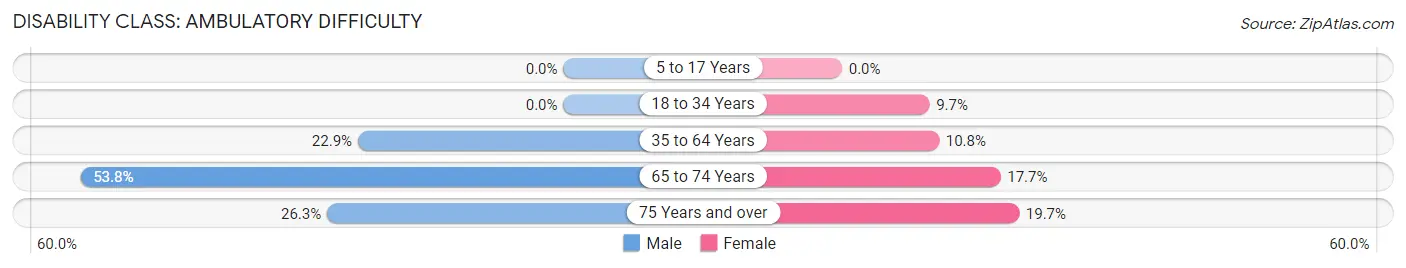
| Age Bracket | Male | Female |
| 5 to 17 Years | 0 (0.0%) | 0 (0.0%) |
| 18 to 34 Years | 0 (0.0%) | 42 (9.7%) |
| 35 to 64 Years | 173 (22.9%) | 80 (10.8%) |
| 65 to 74 Years | 99 (53.8%) | 18 (17.6%) |
| 75 Years and over | 30 (26.3%) | 14 (19.7%) |
Disability Class: Self-Care Difficulty
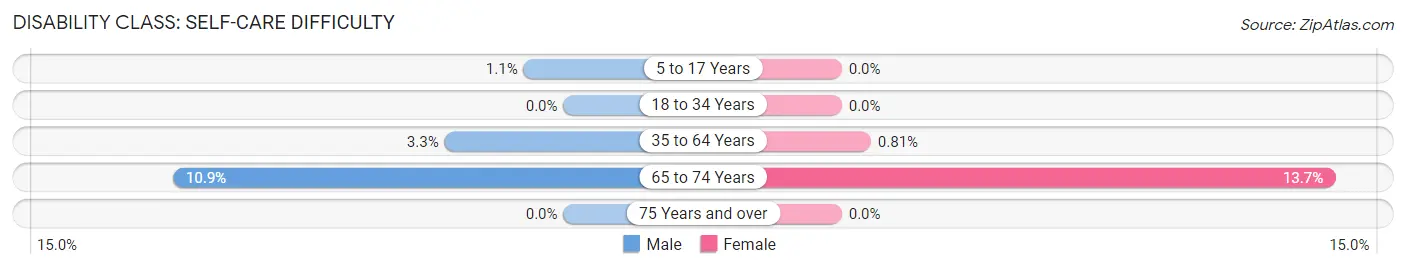
| Age Bracket | Male | Female |
| 5 to 17 Years | 7 (1.1%) | 0 (0.0%) |
| 18 to 34 Years | 0 (0.0%) | 0 (0.0%) |
| 35 to 64 Years | 25 (3.3%) | 6 (0.8%) |
| 65 to 74 Years | 20 (10.9%) | 14 (13.7%) |
| 75 Years and over | 0 (0.0%) | 0 (0.0%) |
Technology Access in Ainaloa
Computing Device Access in Ainaloa
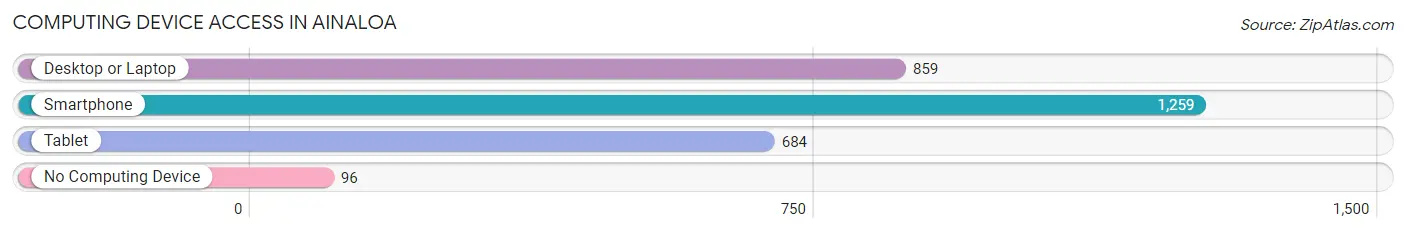
| Device Type | # Households | % Households |
| Desktop or Laptop | 859 | 58.4% |
| Smartphone | 1,259 | 85.5% |
| Tablet | 684 | 46.5% |
| No Computing Device | 96 | 6.5% |
| Total | 1,472 | 100.0% |
Internet Access in Ainaloa
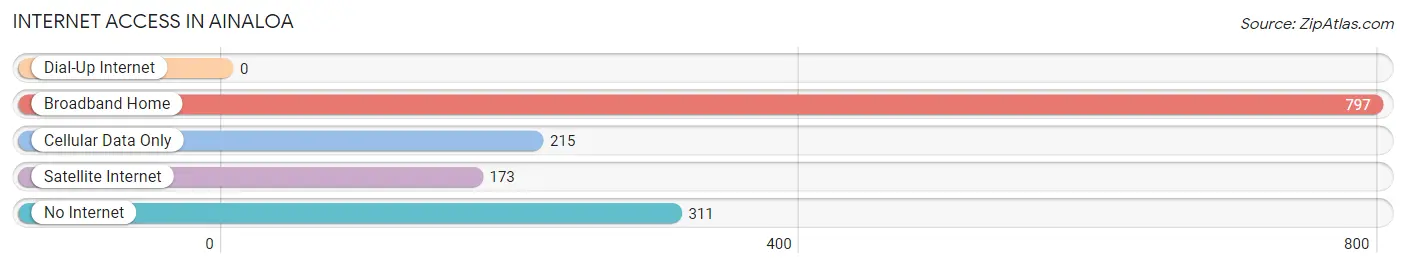
| Internet Type | # Households | % Households |
| Dial-Up Internet | 0 | 0.0% |
| Broadband Home | 797 | 54.1% |
| Cellular Data Only | 215 | 14.6% |
| Satellite Internet | 173 | 11.7% |
| No Internet | 311 | 21.1% |
| Total | 1,472 | 100.0% |
Ainaloa Summary
Ainaloa is a census-designated place (CDP) located in the Puna District of the Big Island of Hawaii. It is located on the eastern side of the island, about 10 miles south of Hilo. The population of Ainaloa was 1,845 at the 2010 census.
Geography
Ainaloa is located at 19°30'17" North, 155°2'17" West (19.504722, -155.038333). It is situated at an elevation of about 1,000 feet above sea level. The area is mostly rural, with a few small residential areas. The terrain is mostly flat, with some rolling hills. The climate is tropical, with temperatures ranging from the mid-70s to the mid-80s.
History
Ainaloa was first settled by Native Hawaiians in the late 1700s. The area was used for farming and ranching, and the population grew steadily over the years. In the early 1900s, the area was developed for sugar cane production. The sugar cane industry was the main source of income for the area until the late 1970s, when the industry began to decline.
In the late 1980s, the area began to experience a population boom as people moved to the area from other parts of the island. This population growth has continued, and Ainaloa is now home to a diverse population of Native Hawaiians, Asian Americans, and other ethnicities.
Economy
The economy of Ainaloa is largely based on agriculture and tourism. The area is home to several farms, which produce a variety of fruits and vegetables. The area is also home to several small businesses, including restaurants, shops, and services.
Tourism is an important part of the economy of Ainaloa. The area is home to several popular attractions, including the Hawaii Volcanoes National Park, the Akaka Falls State Park, and the Rainbow Falls State Park. The area is also home to several beaches, including the popular Punalu'u Beach.
Demographics
As of the 2010 census, the population of Ainaloa was 1,845. The racial makeup of the area was 57.2% Native Hawaiian, 22.2% Asian, 11.2% White, 5.2% Two or More Races, and 4.2% Other. The median household income was $45,938, and the median age was 38.
Conclusion
Ainaloa is a small, rural community located on the eastern side of the Big Island of Hawaii. The area is home to a diverse population, and the economy is largely based on agriculture and tourism. The area is home to several popular attractions, and the population has grown steadily over the years.
Common Questions
What is Per Capita Income in Ainaloa?
Per Capita income in Ainaloa is $22,605.
What is the Median Family Income in Ainaloa?
Median Family Income in Ainaloa is $51,250.
What is the Median Household income in Ainaloa?
Median Household Income in Ainaloa is $48,534.
What is Income or Wage Gap in Ainaloa?
Income or Wage Gap in Ainaloa is 10.7%.
Women in Ainaloa earn 89.3 cents for every dollar earned by a man.
What is Inequality or Gini Index in Ainaloa?
Inequality or Gini Index in Ainaloa is 0.46.
What is the Total Population of Ainaloa?
Total Population of Ainaloa is 3,832.
What is the Total Male Population of Ainaloa?
Total Male Population of Ainaloa is 2,172.
What is the Total Female Population of Ainaloa?
Total Female Population of Ainaloa is 1,660.
What is the Ratio of Males per 100 Females in Ainaloa?
There are 130.84 Males per 100 Females in Ainaloa.
What is the Ratio of Females per 100 Males in Ainaloa?
There are 76.43 Females per 100 Males in Ainaloa.
What is the Median Population Age in Ainaloa?
Median Population Age in Ainaloa is 36.0 Years.
What is the Average Family Size in Ainaloa
Average Family Size in Ainaloa is 3.2 People.
What is the Average Household Size in Ainaloa
Average Household Size in Ainaloa is 2.6 People.
How Large is the Labor Force in Ainaloa?
There are 1,540 People in the Labor Forcein in Ainaloa.
What is the Percentage of People in the Labor Force in Ainaloa?
53.0% of People are in the Labor Force in Ainaloa.
What is the Unemployment Rate in Ainaloa?
Unemployment Rate in Ainaloa is 9.7%.