Koloa, HI Map & Demographics
Koloa Map
Koloa Overview
$33,917
PER CAPITA INCOME
$87,000
AVG FAMILY INCOME
$72,143
AVG HOUSEHOLD INCOME
22.0%
WAGE / INCOME GAP [ % ]
78.0¢/ $1
WAGE / INCOME GAP [ $ ]
0.44
INEQUALITY / GINI INDEX
2,281
TOTAL POPULATION
1,091
MALE POPULATION
1,190
FEMALE POPULATION
91.68
MALES / 100 FEMALES
109.07
FEMALES / 100 MALES
38.2
MEDIAN AGE
4.0
AVG FAMILY SIZE
3.2
AVG HOUSEHOLD SIZE
1,183
LABOR FORCE [ PEOPLE ]
68.4%
PERCENT IN LABOR FORCE
9.5%
UNEMPLOYMENT RATE
Koloa Zip Codes
Koloa Area Codes
Income in Koloa
Income Overview in Koloa
Per Capita Income in Koloa is $33,917, while median incomes of families and households are $87,000 and $72,143 respectively.
| Characteristic | Number | Measure |
| Per Capita Income | 2,281 | $33,917 |
| Median Family Income | 462 | $87,000 |
| Mean Family Income | 462 | $105,082 |
| Median Household Income | 700 | $72,143 |
| Mean Household Income | 700 | $92,739 |
| Income Deficit | 462 | $0 |
| Wage / Income Gap (%) | 2,281 | 22.03% |
| Wage / Income Gap ($) | 2,281 | 77.97¢ per $1 |
| Gini / Inequality Index | 2,281 | 0.44 |
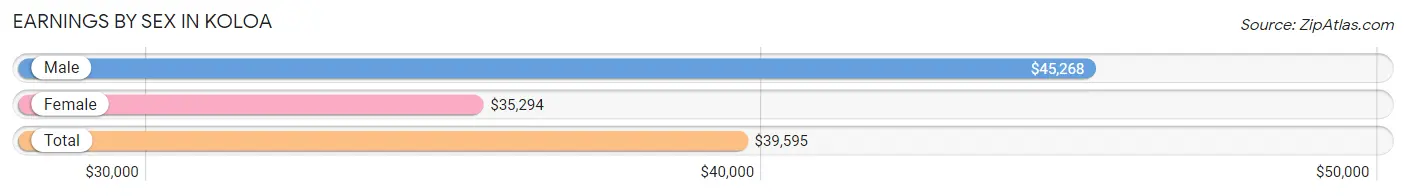
Earnings by Sex in Koloa
Average Earnings in Koloa are $39,595, $45,268 for men and $35,294 for women, a difference of 22.0%.
| Sex | Number | Average Earnings |
| Male | 650 (52.0%) | $45,268 |
| Female | 600 (48.0%) | $35,294 |
| Total | 1,250 (100.0%) | $39,595 |
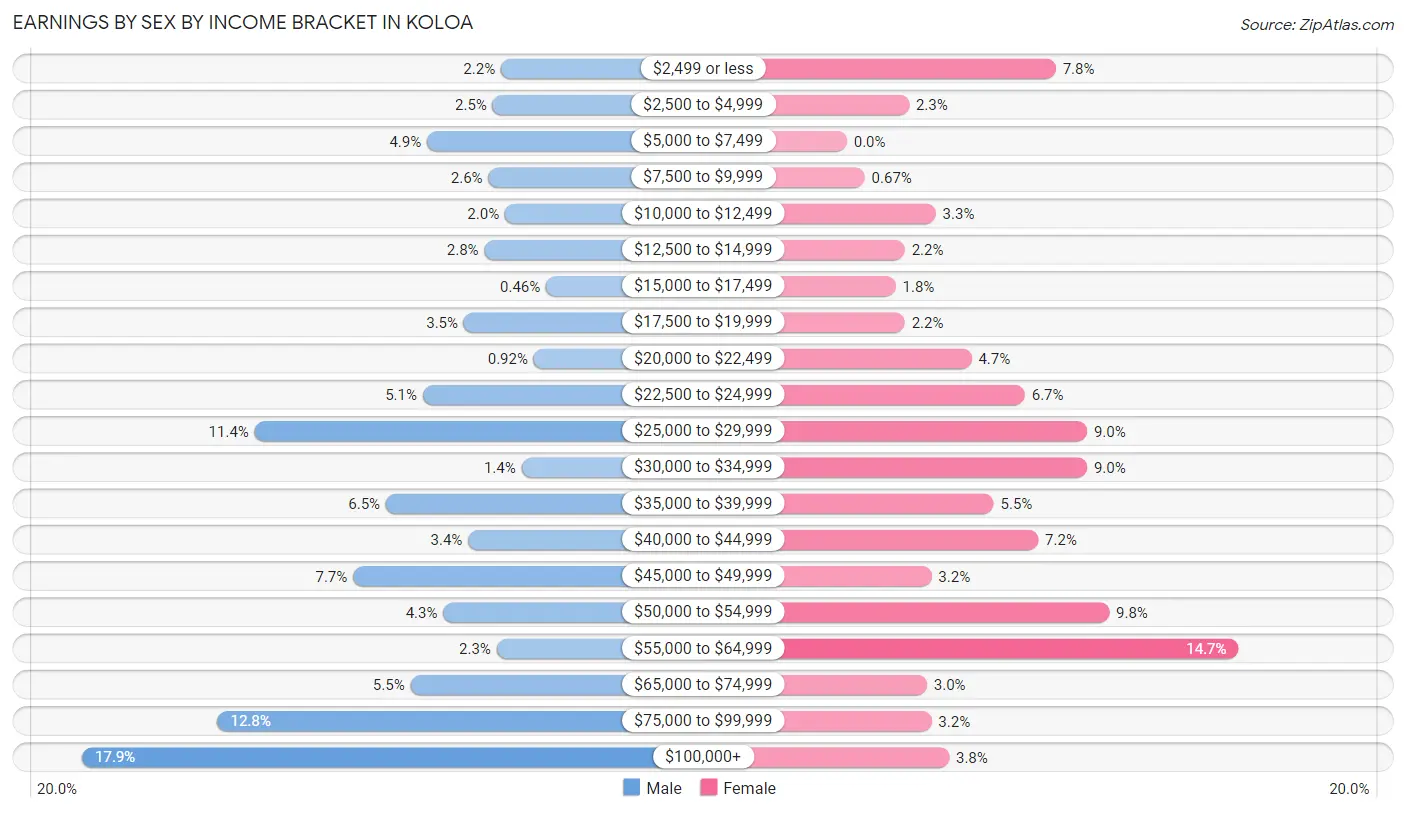
Earnings by Sex by Income Bracket in Koloa
The most common earnings brackets in Koloa are $100,000+ for men (116 | 17.8%) and $55,000 to $64,999 for women (88 | 14.7%).
| Income | Male | Female |
| $2,499 or less | 14 (2.1%) | 47 (7.8%) |
| $2,500 to $4,999 | 16 (2.5%) | 14 (2.3%) |
| $5,000 to $7,499 | 32 (4.9%) | 0 (0.0%) |
| $7,500 to $9,999 | 17 (2.6%) | 4 (0.7%) |
| $10,000 to $12,499 | 13 (2.0%) | 20 (3.3%) |
| $12,500 to $14,999 | 18 (2.8%) | 13 (2.2%) |
| $15,000 to $17,499 | 3 (0.5%) | 11 (1.8%) |
| $17,500 to $19,999 | 23 (3.5%) | 13 (2.2%) |
| $20,000 to $22,499 | 6 (0.9%) | 28 (4.7%) |
| $22,500 to $24,999 | 33 (5.1%) | 40 (6.7%) |
| $25,000 to $29,999 | 74 (11.4%) | 54 (9.0%) |
| $30,000 to $34,999 | 9 (1.4%) | 54 (9.0%) |
| $35,000 to $39,999 | 42 (6.5%) | 33 (5.5%) |
| $40,000 to $44,999 | 22 (3.4%) | 43 (7.2%) |
| $45,000 to $49,999 | 50 (7.7%) | 19 (3.2%) |
| $50,000 to $54,999 | 28 (4.3%) | 59 (9.8%) |
| $55,000 to $64,999 | 15 (2.3%) | 88 (14.7%) |
| $65,000 to $74,999 | 36 (5.5%) | 18 (3.0%) |
| $75,000 to $99,999 | 83 (12.8%) | 19 (3.2%) |
| $100,000+ | 116 (17.8%) | 23 (3.8%) |
| Total | 650 (100.0%) | 600 (100.0%) |
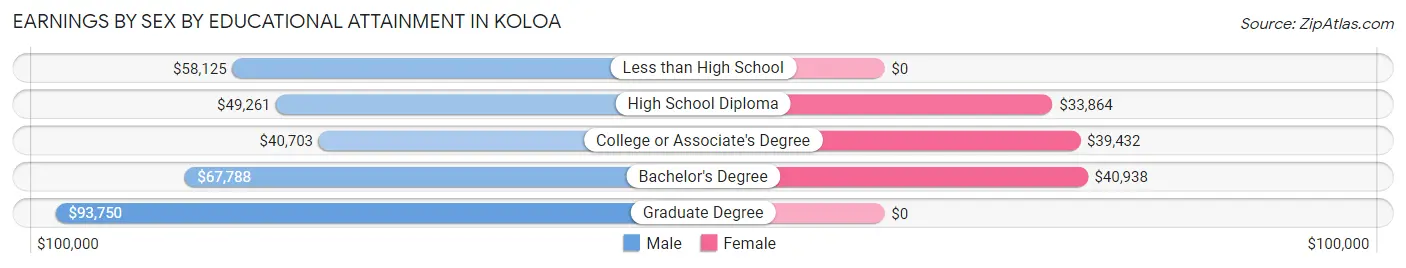
Earnings by Sex by Educational Attainment in Koloa
Average earnings in Koloa are $47,455 for men and $37,353 for women, a difference of 21.3%. Men with an educational attainment of graduate degree enjoy the highest average annual earnings of $93,750, while those with college or associate's degree education earn the least with $40,703. Women with an educational attainment of bachelor's degree earn the most with the average annual earnings of $40,938, while those with high school diploma education have the smallest earnings of $33,864.
| Educational Attainment | Male Income | Female Income |
| Less than High School | $58,125 | $0 |
| High School Diploma | $49,261 | $33,864 |
| College or Associate's Degree | $40,703 | $39,432 |
| Bachelor's Degree | $67,788 | $40,938 |
| Graduate Degree | $93,750 | $0 |
| Total | $47,455 | $37,353 |
Family Income in Koloa
Family Income Brackets in Koloa
According to the Koloa family income data, there are 113 families falling into the $50,000 to $74,999 income range, which is the most common income bracket and makes up 24.5% of all families. Conversely, the $10,000 to $14,999 income bracket is the least frequent group with only 4 families (0.9%) belonging to this category.
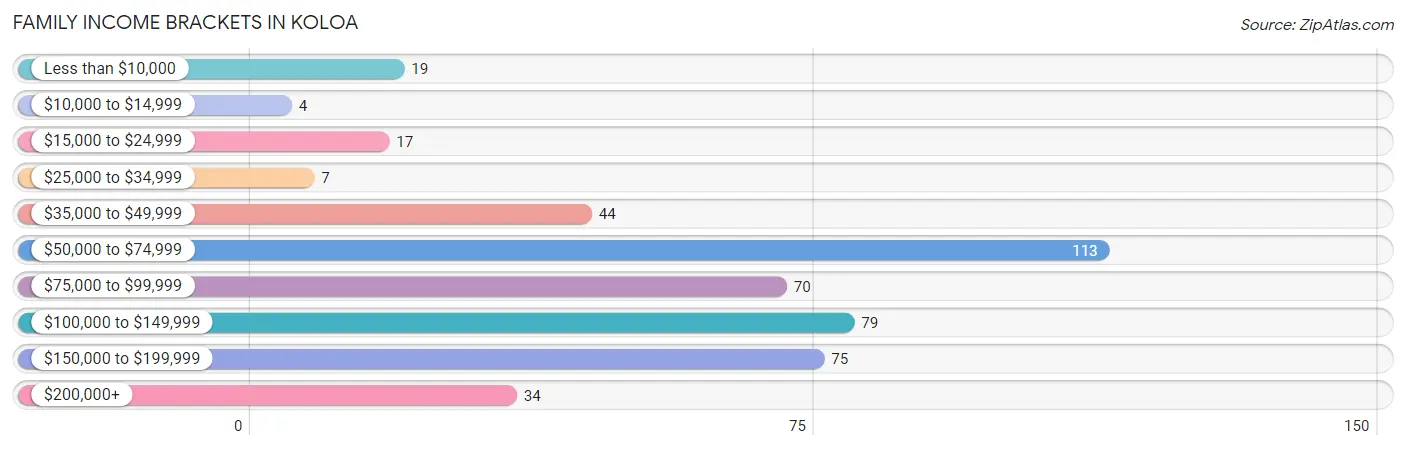
| Income Bracket | # Families | % Families |
| Less than $10,000 | 19 | 4.1% |
| $10,000 to $14,999 | 4 | 0.9% |
| $15,000 to $24,999 | 17 | 3.7% |
| $25,000 to $34,999 | 7 | 1.5% |
| $35,000 to $49,999 | 44 | 9.5% |
| $50,000 to $74,999 | 113 | 24.5% |
| $75,000 to $99,999 | 70 | 15.2% |
| $100,000 to $149,999 | 79 | 17.1% |
| $150,000 to $199,999 | 75 | 16.2% |
| $200,000+ | 34 | 7.4% |
Family Income by Famaliy Size in Koloa
7+ person families (21 | 4.5%) account for the highest median family income in Koloa with $198,594 per family, while 4-person families (48 | 10.4%) have the highest median income of $38,750 per family member.
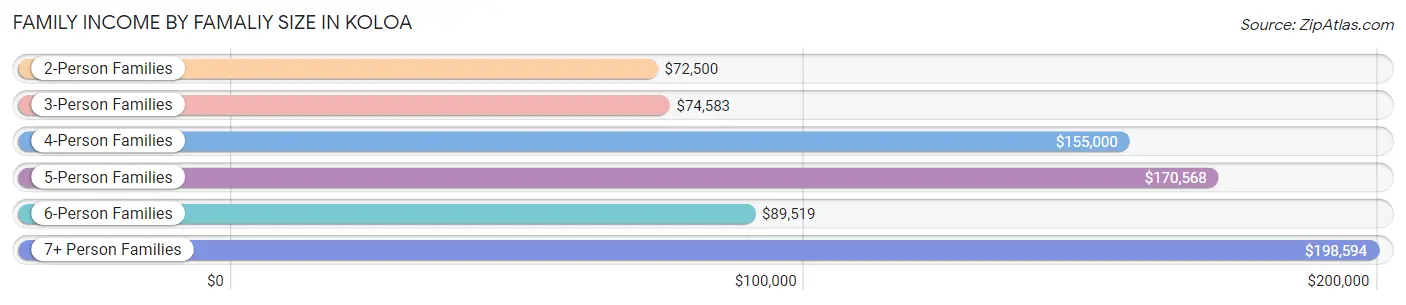
| Income Bracket | # Families | Median Income |
| 2-Person Families | 232 (50.2%) | $72,500 |
| 3-Person Families | 99 (21.4%) | $74,583 |
| 4-Person Families | 48 (10.4%) | $155,000 |
| 5-Person Families | 37 (8.0%) | $170,568 |
| 6-Person Families | 25 (5.4%) | $89,519 |
| 7+ Person Families | 21 (4.5%) | $198,594 |
| Total | 462 (100.0%) | $87,000 |
Family Income by Number of Earners in Koloa
The median family income in Koloa is $87,000, with families comprising 3+ earners (85) having the highest median family income of $162,917, while families with no earners (69) have the lowest median family income of $40,583, accounting for 18.4% and 14.9% of families, respectively.
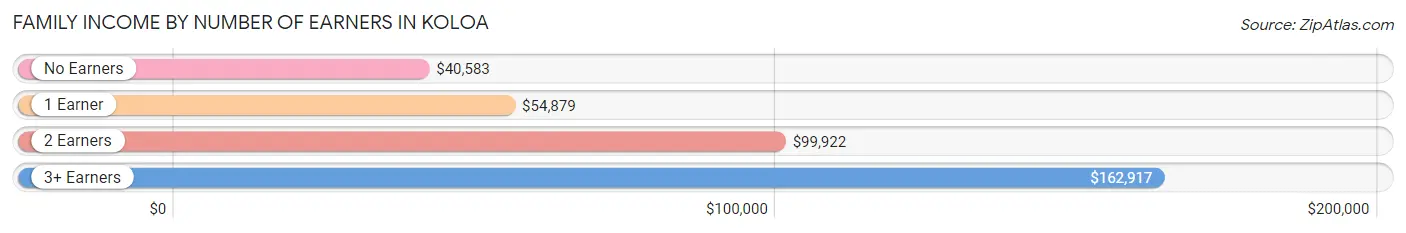
| Number of Earners | # Families | Median Income |
| No Earners | 69 (14.9%) | $40,583 |
| 1 Earner | 147 (31.8%) | $54,879 |
| 2 Earners | 161 (34.8%) | $99,922 |
| 3+ Earners | 85 (18.4%) | $162,917 |
| Total | 462 (100.0%) | $87,000 |
Household Income in Koloa
Household Income Brackets in Koloa
With 154 households falling in the category, the $50,000 to $74,999 income range is the most frequent in Koloa, accounting for 22.0% of all households. In contrast, only 11 households (1.6%) fall into the $25,000 to $34,999 income bracket, making it the least populous group.
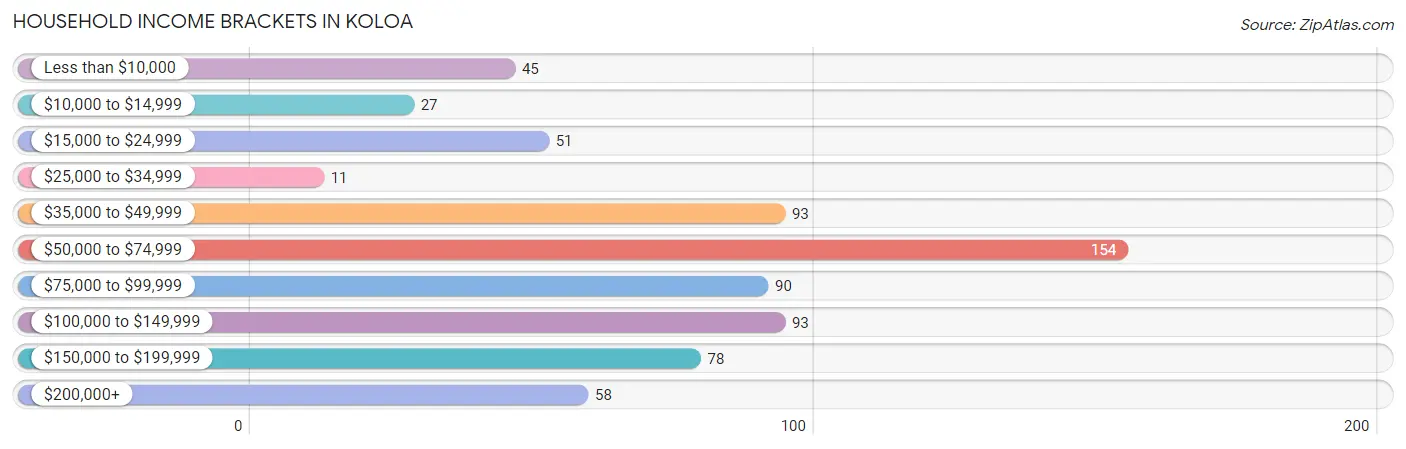
| Income Bracket | # Households | % Households |
| Less than $10,000 | 45 | 6.4% |
| $10,000 to $14,999 | 27 | 3.9% |
| $15,000 to $24,999 | 51 | 7.3% |
| $25,000 to $34,999 | 11 | 1.6% |
| $35,000 to $49,999 | 93 | 13.3% |
| $50,000 to $74,999 | 154 | 22.0% |
| $75,000 to $99,999 | 90 | 12.9% |
| $100,000 to $149,999 | 93 | 13.3% |
| $150,000 to $199,999 | 78 | 11.1% |
| $200,000+ | 58 | 8.3% |
Household Income by Householder Age in Koloa
The median household income in Koloa is $72,143, with the highest median household income of $85,000 found in the 25 to 44 years age bracket for the primary householder. A total of 184 households (26.3%) fall into this category. Meanwhile, the 15 to 24 years age bracket for the primary householder has the lowest median household income of $0, with 10 households (1.4%) in this group.
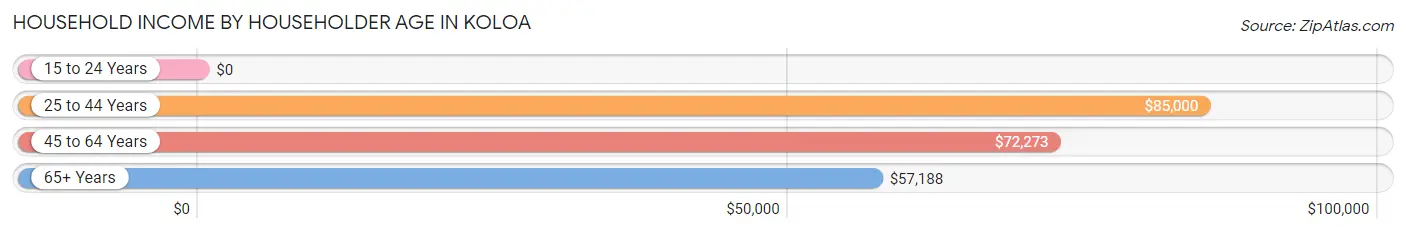
| Income Bracket | # Households | Median Income |
| 15 to 24 Years | 10 (1.4%) | $0 |
| 25 to 44 Years | 184 (26.3%) | $85,000 |
| 45 to 64 Years | 244 (34.9%) | $72,273 |
| 65+ Years | 262 (37.4%) | $57,188 |
| Total | 700 (100.0%) | $72,143 |
Poverty in Koloa
Income Below Poverty by Sex and Age in Koloa
With 5.5% poverty level for males and 11.8% for females among the residents of Koloa, under 5 year old males and 16 and 17 year old females are the most vulnerable to poverty, with 18 males (43.9%) and 13 females (100.0%) in their respective age groups living below the poverty level.
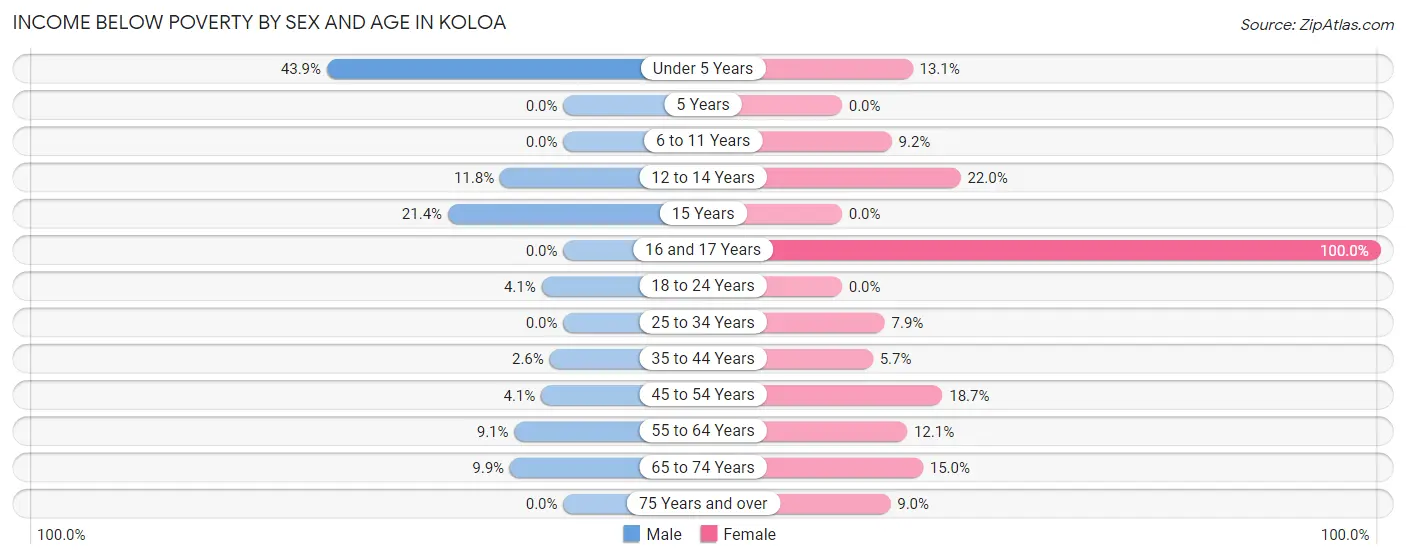
| Age Bracket | Male | Female |
| Under 5 Years | 18 (43.9%) | 13 (13.1%) |
| 5 Years | 0 (0.0%) | 0 (0.0%) |
| 6 to 11 Years | 0 (0.0%) | 11 (9.2%) |
| 12 to 14 Years | 6 (11.8%) | 13 (22.0%) |
| 15 Years | 3 (21.4%) | 0 (0.0%) |
| 16 and 17 Years | 0 (0.0%) | 13 (100.0%) |
| 18 to 24 Years | 3 (4.1%) | 0 (0.0%) |
| 25 to 34 Years | 0 (0.0%) | 10 (7.9%) |
| 35 to 44 Years | 5 (2.5%) | 7 (5.7%) |
| 45 to 54 Years | 5 (4.1%) | 25 (18.7%) |
| 55 to 64 Years | 9 (9.1%) | 19 (12.1%) |
| 65 to 74 Years | 11 (9.9%) | 20 (15.0%) |
| 75 Years and over | 0 (0.0%) | 9 (9.0%) |
| Total | 60 (5.5%) | 140 (11.8%) |
Income Above Poverty by Sex and Age in Koloa
According to the poverty statistics in Koloa, males aged 5 years and females aged 5 years are the age groups that are most secure financially, with 100.0% of males and 100.0% of females in these age groups living above the poverty line.
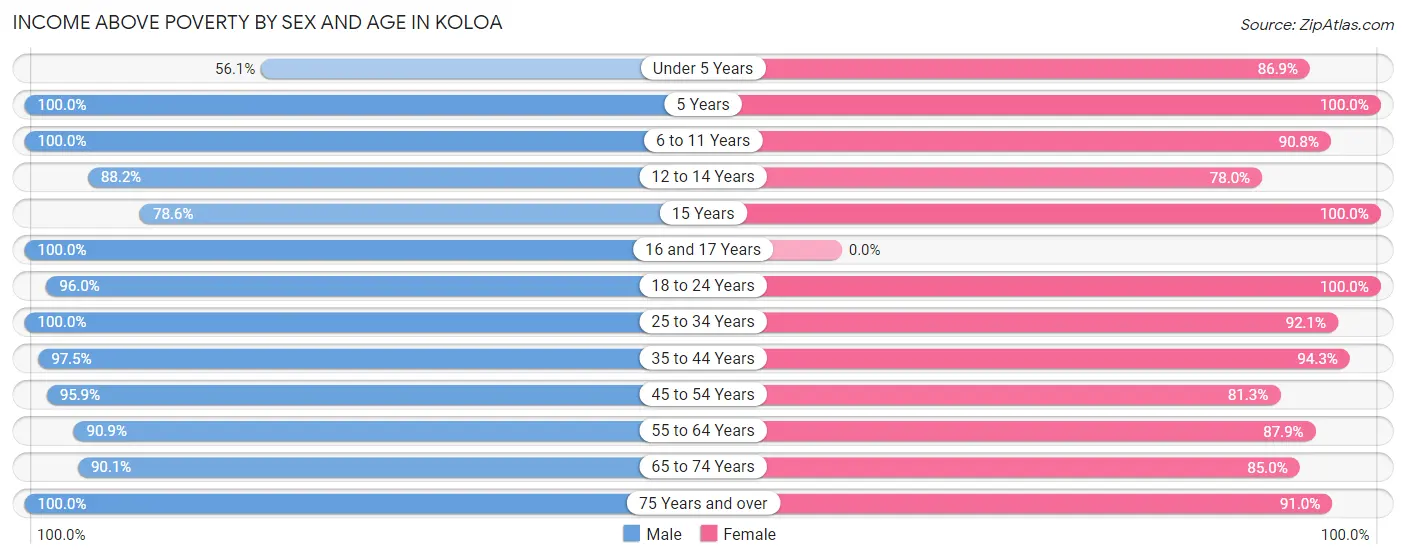
| Age Bracket | Male | Female |
| Under 5 Years | 23 (56.1%) | 86 (86.9%) |
| 5 Years | 12 (100.0%) | 29 (100.0%) |
| 6 to 11 Years | 93 (100.0%) | 108 (90.8%) |
| 12 to 14 Years | 45 (88.2%) | 46 (78.0%) |
| 15 Years | 11 (78.6%) | 35 (100.0%) |
| 16 and 17 Years | 42 (100.0%) | 0 (0.0%) |
| 18 to 24 Years | 71 (96.0%) | 60 (100.0%) |
| 25 to 34 Years | 148 (100.0%) | 116 (92.1%) |
| 35 to 44 Years | 191 (97.5%) | 115 (94.3%) |
| 45 to 54 Years | 116 (95.9%) | 109 (81.3%) |
| 55 to 64 Years | 90 (90.9%) | 138 (87.9%) |
| 65 to 74 Years | 100 (90.1%) | 113 (85.0%) |
| 75 Years and over | 89 (100.0%) | 91 (91.0%) |
| Total | 1,031 (94.5%) | 1,046 (88.2%) |
Income Below Poverty Among Married-Couple Families in Koloa
The poverty statistics for married-couple families in Koloa show that 1.5% or 4 of the total 274 families live below the poverty line. Families with 3 or 4 children have the highest poverty rate of 17.4%, comprising of 4 families. On the other hand, families with no children have the lowest poverty rate of 0.0%, which includes 0 families.
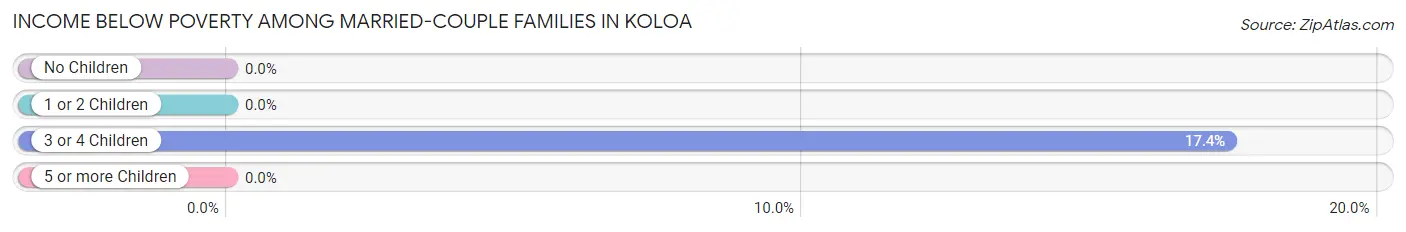
| Children | Above Poverty | Below Poverty |
| No Children | 137 (100.0%) | 0 (0.0%) |
| 1 or 2 Children | 114 (100.0%) | 0 (0.0%) |
| 3 or 4 Children | 19 (82.6%) | 4 (17.4%) |
| 5 or more Children | 0 (0.0%) | 0 (0.0%) |
| Total | 270 (98.5%) | 4 (1.5%) |
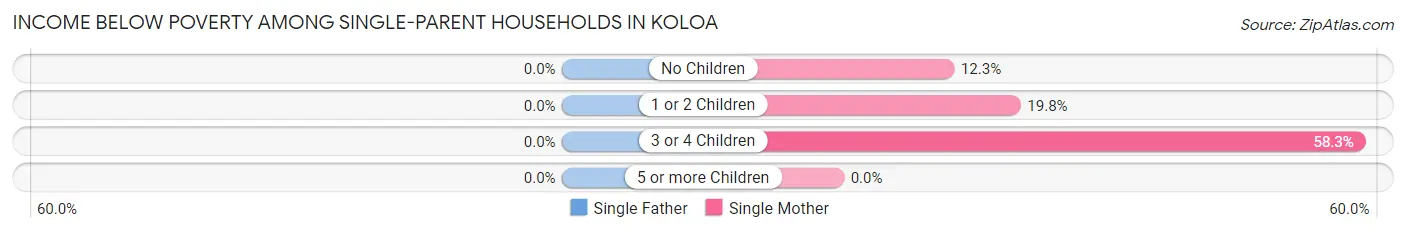
Income Below Poverty Among Single-Parent Households in Koloa
| Children | Single Father | Single Mother |
| No Children | 0 (0.0%) | 9 (12.3%) |
| 1 or 2 Children | 0 (0.0%) | 16 (19.8%) |
| 3 or 4 Children | 0 (0.0%) | 7 (58.3%) |
| 5 or more Children | 0 (0.0%) | 0 (0.0%) |
| Total | 0 (0.0%) | 32 (19.3%) |
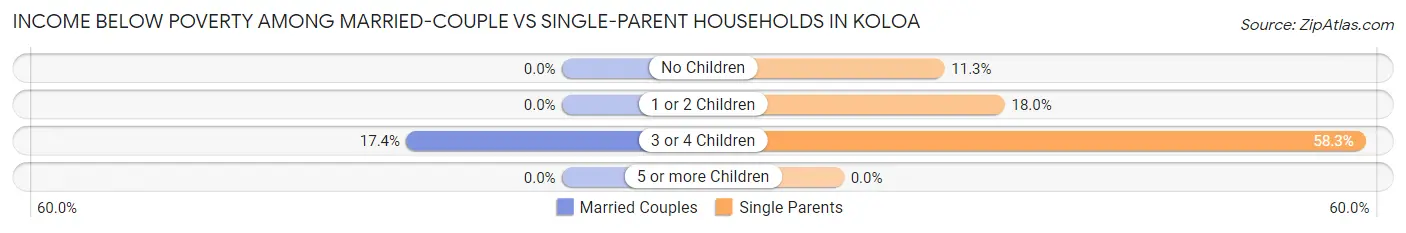
Income Below Poverty Among Married-Couple vs Single-Parent Households in Koloa
The poverty data for Koloa shows that 4 of the married-couple family households (1.5%) and 32 of the single-parent households (17.0%) are living below the poverty level. Within the married-couple family households, those with 3 or 4 children have the highest poverty rate, with 4 households (17.4%) falling below the poverty line. Among the single-parent households, those with 3 or 4 children have the highest poverty rate, with 7 household (58.3%) living below poverty.
| Children | Married-Couple Families | Single-Parent Households |
| No Children | 0 (0.0%) | 9 (11.3%) |
| 1 or 2 Children | 0 (0.0%) | 16 (18.0%) |
| 3 or 4 Children | 4 (17.4%) | 7 (58.3%) |
| 5 or more Children | 0 (0.0%) | 0 (0.0%) |
| Total | 4 (1.5%) | 32 (17.0%) |
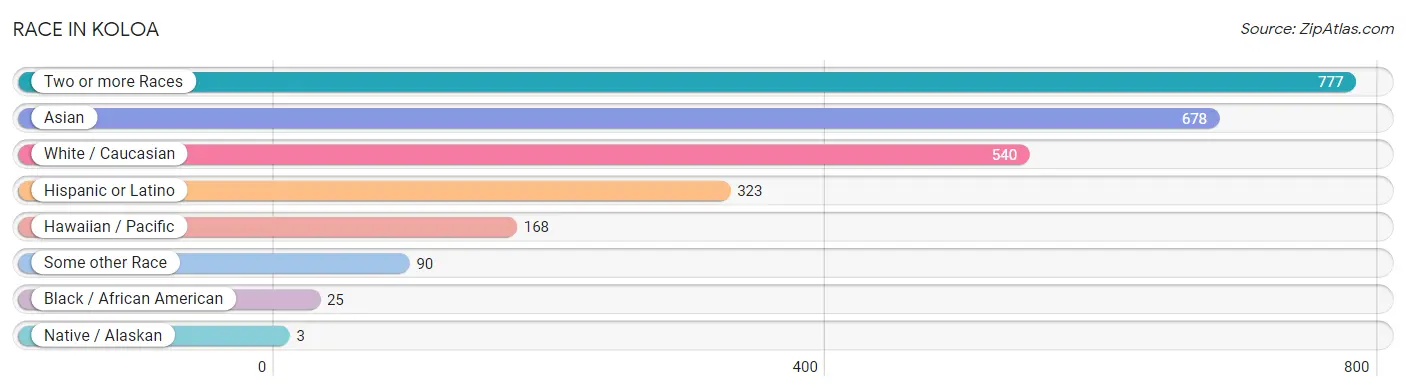
Race in Koloa
The most populous races in Koloa are Two or more Races (777 | 34.1%), Asian (678 | 29.7%), and White / Caucasian (540 | 23.7%).
| Race | # Population | % Population |
| Asian | 678 | 29.7% |
| Black / African American | 25 | 1.1% |
| Hawaiian / Pacific | 168 | 7.4% |
| Hispanic or Latino | 323 | 14.2% |
| Native / Alaskan | 3 | 0.1% |
| White / Caucasian | 540 | 23.7% |
| Two or more Races | 777 | 34.1% |
| Some other Race | 90 | 4.0% |
| Total | 2,281 | 100.0% |
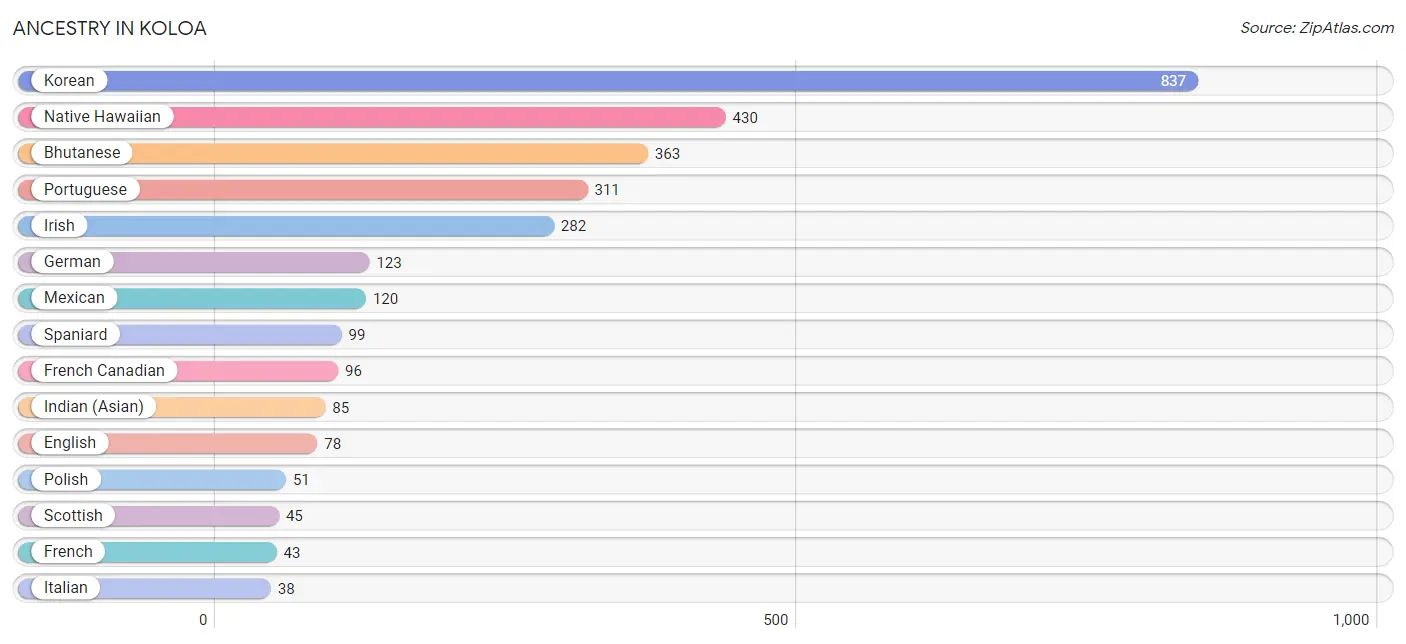
Ancestry in Koloa
The most populous ancestries reported in Koloa are Korean (837 | 36.7%), Native Hawaiian (430 | 18.9%), Bhutanese (363 | 15.9%), Portuguese (311 | 13.6%), and Irish (282 | 12.4%), together accounting for 97.4% of all Koloa residents.
| Ancestry | # Population | % Population |
| American | 17 | 0.7% |
| Apache | 17 | 0.7% |
| Arab | 4 | 0.2% |
| Australian | 3 | 0.1% |
| Basque | 12 | 0.5% |
| Bhutanese | 363 | 15.9% |
| Burmese | 3 | 0.1% |
| Canadian | 5 | 0.2% |
| Central American | 15 | 0.7% |
| Chilean | 12 | 0.5% |
| Choctaw | 17 | 0.7% |
| Colombian | 22 | 1.0% |
| Costa Rican | 15 | 0.7% |
| Czech | 9 | 0.4% |
| Danish | 2 | 0.1% |
| Dutch | 20 | 0.9% |
| English | 78 | 3.4% |
| Ethiopian | 33 | 1.5% |
| European | 25 | 1.1% |
| Fijian | 28 | 1.2% |
| Finnish | 4 | 0.2% |
| French | 43 | 1.9% |
| French Canadian | 96 | 4.2% |
| German | 123 | 5.4% |
| Hungarian | 4 | 0.2% |
| Indian (Asian) | 85 | 3.7% |
| Irish | 282 | 12.4% |
| Italian | 38 | 1.7% |
| Korean | 837 | 36.7% |
| Mexican | 120 | 5.3% |
| Native Hawaiian | 430 | 18.9% |
| Navajo | 3 | 0.1% |
| Norwegian | 14 | 0.6% |
| Pakistani | 10 | 0.4% |
| Polish | 51 | 2.2% |
| Portuguese | 311 | 13.6% |
| Samoan | 13 | 0.6% |
| Scotch-Irish | 16 | 0.7% |
| Scottish | 45 | 2.0% |
| South American | 34 | 1.5% |
| South American Indian | 34 | 1.5% |
| Spaniard | 99 | 4.3% |
| Spanish | 25 | 1.1% |
| Spanish American | 30 | 1.3% |
| Sri Lankan | 4 | 0.2% |
| Subsaharan African | 33 | 1.5% |
| Swedish | 14 | 0.6% |
| Thai | 2 | 0.1% |
| Trinidadian and Tobagonian | 6 | 0.3% |
| Ukrainian | 7 | 0.3% |
| West Indian | 6 | 0.3% | View All 51 Rows |
Immigrants in Koloa
The most numerous immigrant groups reported in Koloa came from Asia (232 | 10.2%), South Eastern Asia (226 | 9.9%), Philippines (221 | 9.7%), Oceania (31 | 1.4%), and Canada (16 | 0.7%), together accounting for 31.8% of all Koloa residents.
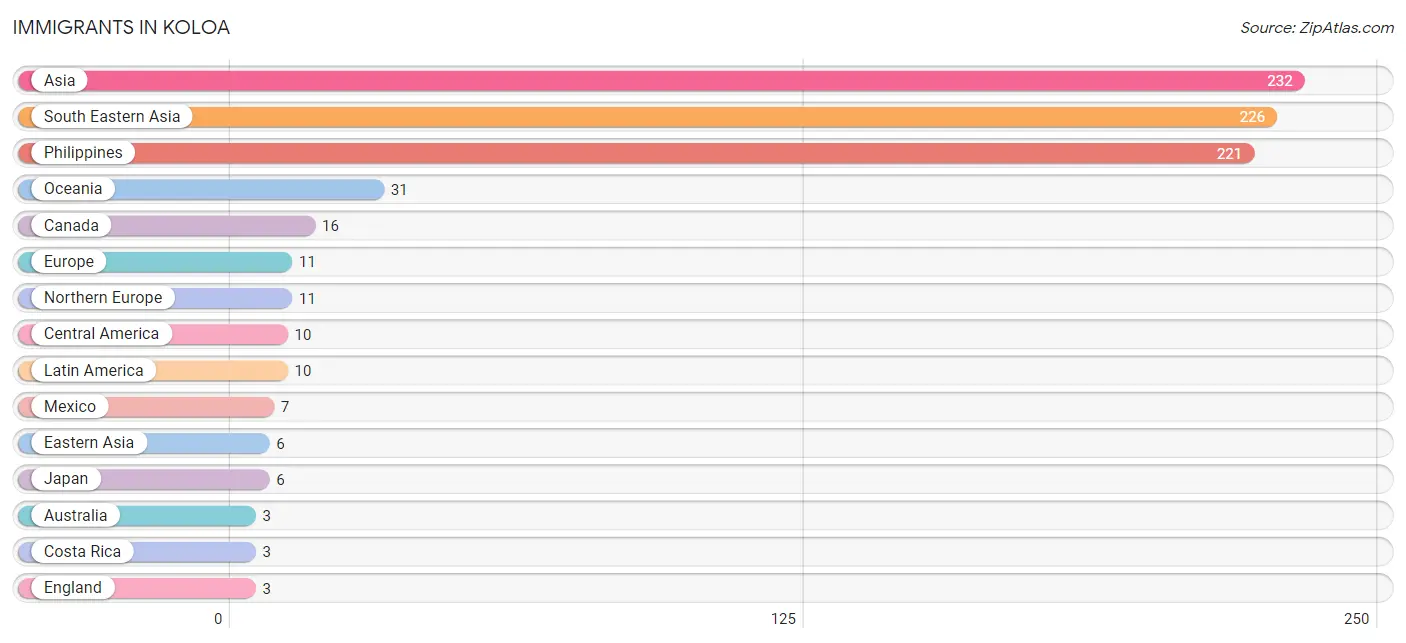
| Immigration Origin | # Population | % Population |
| Asia | 232 | 10.2% |
| Australia | 3 | 0.1% |
| Canada | 16 | 0.7% |
| Central America | 10 | 0.4% |
| Costa Rica | 3 | 0.1% |
| Eastern Asia | 6 | 0.3% |
| England | 3 | 0.1% |
| Europe | 11 | 0.5% |
| Ireland | 3 | 0.1% |
| Japan | 6 | 0.3% |
| Latin America | 10 | 0.4% |
| Mexico | 7 | 0.3% |
| Northern Europe | 11 | 0.5% |
| Oceania | 31 | 1.4% |
| Philippines | 221 | 9.7% |
| South Eastern Asia | 226 | 9.9% | View All 16 Rows |
Sex and Age in Koloa
Sex and Age in Koloa
The most populous age groups in Koloa are 10 to 14 Years (122 | 11.2%) for men and 10 to 14 Years (114 | 9.6%) for women.
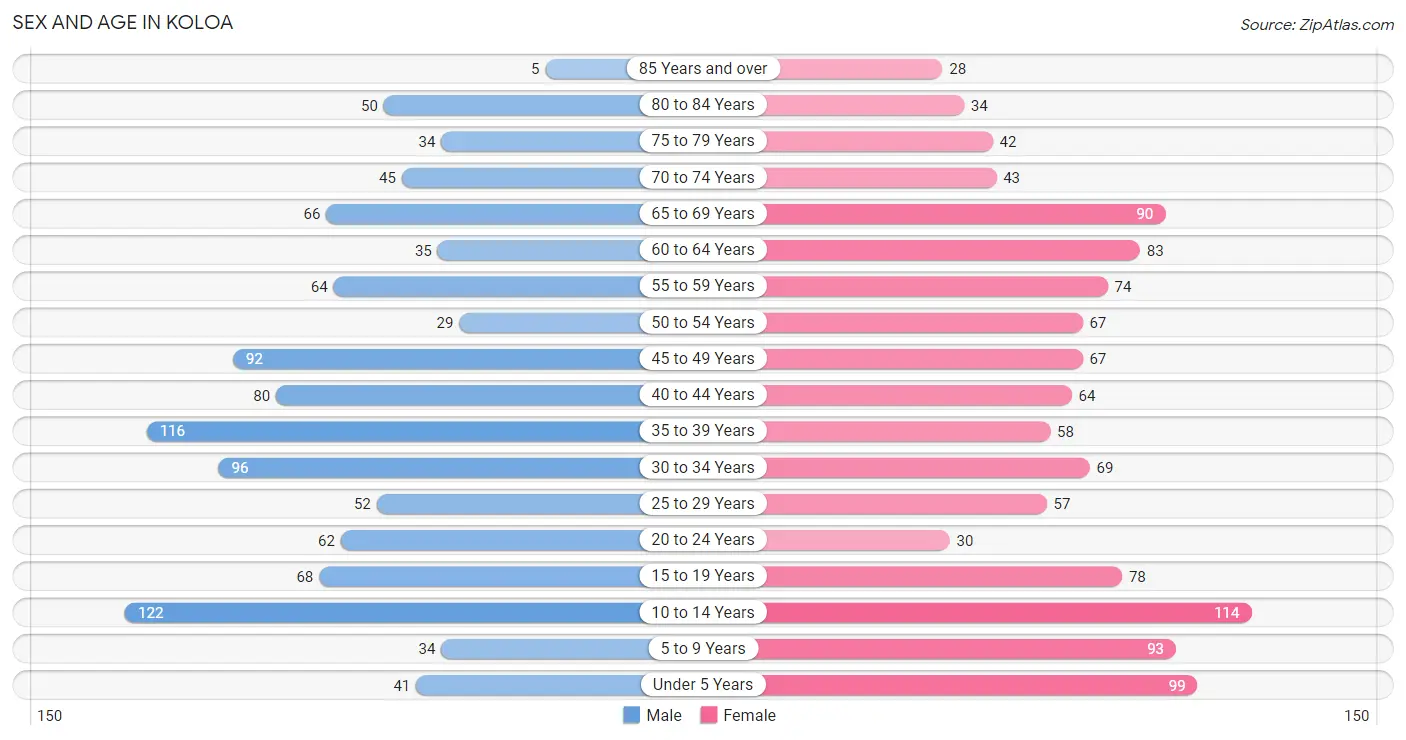
| Age Bracket | Male | Female |
| Under 5 Years | 41 (3.8%) | 99 (8.3%) |
| 5 to 9 Years | 34 (3.1%) | 93 (7.8%) |
| 10 to 14 Years | 122 (11.2%) | 114 (9.6%) |
| 15 to 19 Years | 68 (6.2%) | 78 (6.6%) |
| 20 to 24 Years | 62 (5.7%) | 30 (2.5%) |
| 25 to 29 Years | 52 (4.8%) | 57 (4.8%) |
| 30 to 34 Years | 96 (8.8%) | 69 (5.8%) |
| 35 to 39 Years | 116 (10.6%) | 58 (4.9%) |
| 40 to 44 Years | 80 (7.3%) | 64 (5.4%) |
| 45 to 49 Years | 92 (8.4%) | 67 (5.6%) |
| 50 to 54 Years | 29 (2.7%) | 67 (5.6%) |
| 55 to 59 Years | 64 (5.9%) | 74 (6.2%) |
| 60 to 64 Years | 35 (3.2%) | 83 (7.0%) |
| 65 to 69 Years | 66 (6.0%) | 90 (7.6%) |
| 70 to 74 Years | 45 (4.1%) | 43 (3.6%) |
| 75 to 79 Years | 34 (3.1%) | 42 (3.5%) |
| 80 to 84 Years | 50 (4.6%) | 34 (2.9%) |
| 85 Years and over | 5 (0.5%) | 28 (2.4%) |
| Total | 1,091 (100.0%) | 1,190 (100.0%) |
Families and Households in Koloa
Median Family Size in Koloa
The median family size in Koloa is 4.05 persons per family, with single male/father families (22 | 4.8%) accounting for the largest median family size of 8.5 persons per family. On the other hand, single female/mother families (166 | 35.9%) represent the smallest median family size with 3.07 persons per family.
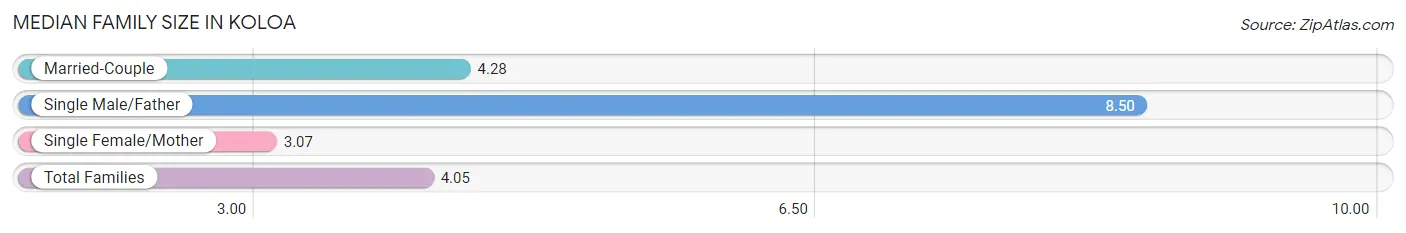
| Family Type | # Families | Family Size |
| Married-Couple | 274 (59.3%) | 4.28 |
| Single Male/Father | 22 (4.8%) | 8.50 |
| Single Female/Mother | 166 (35.9%) | 3.07 |
| Total Families | 462 (100.0%) | 4.05 |
Median Household Size in Koloa
The median household size in Koloa is 3.24 persons per household, with single male/father households (22 | 3.1%) accounting for the largest median household size of 9.73 persons per household. non-family households (238 | 34.0%) represent the smallest median household size with 1.12 persons per household.
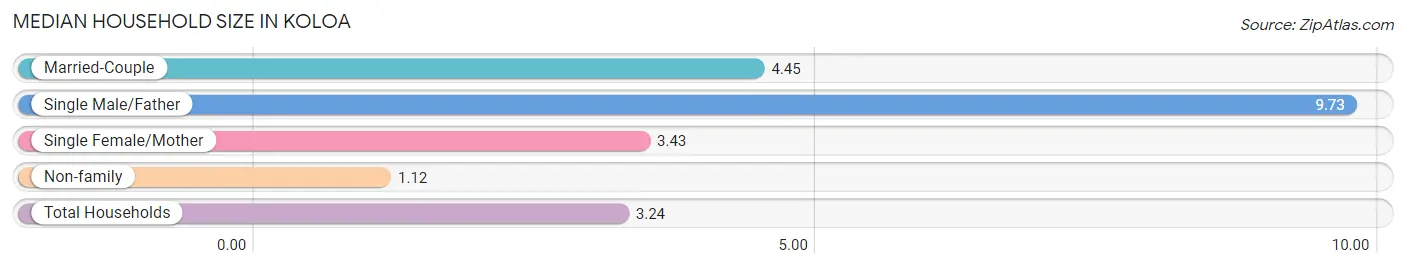
| Household Type | # Households | Household Size |
| Married-Couple | 274 (39.1%) | 4.45 |
| Single Male/Father | 22 (3.1%) | 9.73 |
| Single Female/Mother | 166 (23.7%) | 3.43 |
| Non-family | 238 (34.0%) | 1.12 |
| Total Households | 700 (100.0%) | 3.24 |
Household Size by Marriage Status in Koloa
Out of a total of 700 households in Koloa, 462 (66.0%) are family households, while 238 (34.0%) are nonfamily households. The most numerous type of family households are 2-person households, comprising 214, and the most common type of nonfamily households are 1-person households, comprising 209.
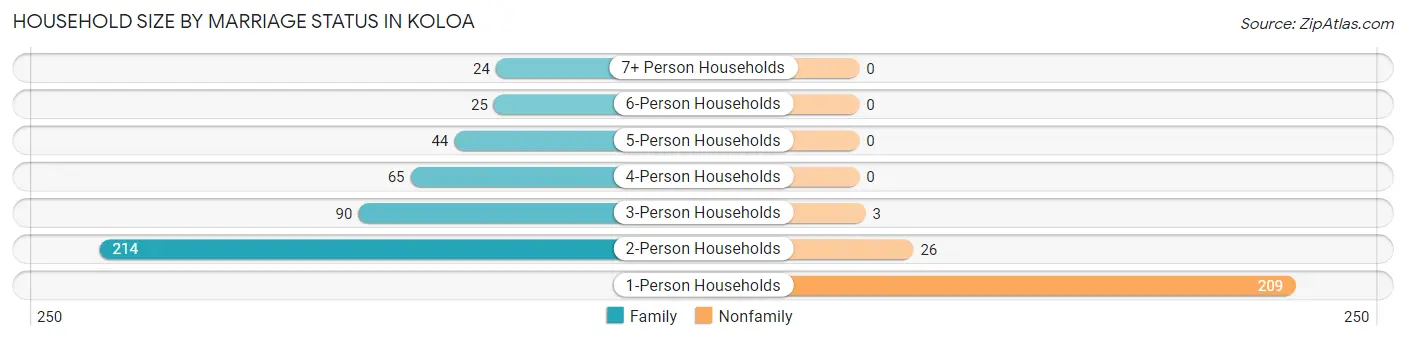
| Household Size | Family Households | Nonfamily Households |
| 1-Person Households | - | 209 (29.9%) |
| 2-Person Households | 214 (30.6%) | 26 (3.7%) |
| 3-Person Households | 90 (12.9%) | 3 (0.4%) |
| 4-Person Households | 65 (9.3%) | 0 (0.0%) |
| 5-Person Households | 44 (6.3%) | 0 (0.0%) |
| 6-Person Households | 25 (3.6%) | 0 (0.0%) |
| 7+ Person Households | 24 (3.4%) | 0 (0.0%) |
| Total | 462 (66.0%) | 238 (34.0%) |
Female Fertility in Koloa
Fertility by Age in Koloa
Average fertility rate in Koloa is 89.0 births per 1,000 women. Women in the age bracket of 20 to 34 years have the highest fertility rate with 128.0 births per 1,000 women. Women in the age bracket of 20 to 34 years acount for 52.6% of all women with births.
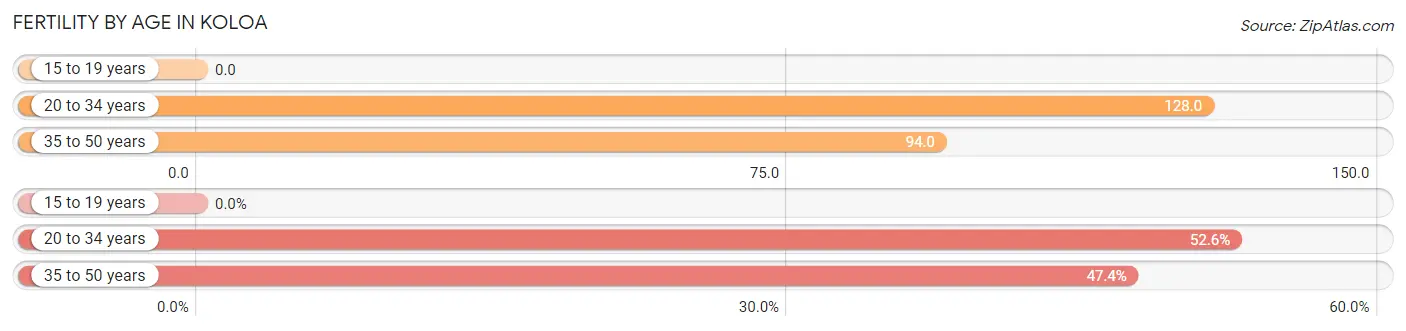
| Age Bracket | Women with Births | Births / 1,000 Women |
| 15 to 19 years | 0 (0.0%) | 0.0 |
| 20 to 34 years | 20 (52.6%) | 128.0 |
| 35 to 50 years | 18 (47.4%) | 94.0 |
| Total | 38 (100.0%) | 89.0 |
Fertility by Age by Marriage Status in Koloa
60.5% of women with births (38) in Koloa are married. The highest percentage of unmarried women with births falls into 35 to 50 years age bracket with 44.4% of them unmarried at the time of birth, while the lowest percentage of unmarried women with births belong to 20 to 34 years age bracket with 35.0% of them unmarried.
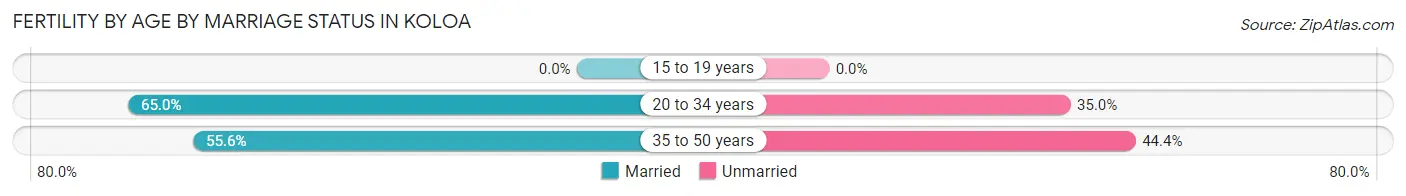
| Age Bracket | Married | Unmarried |
| 15 to 19 years | 0 (0.0%) | 0 (0.0%) |
| 20 to 34 years | 13 (65.0%) | 7 (35.0%) |
| 35 to 50 years | 10 (55.6%) | 8 (44.4%) |
| Total | 23 (60.5%) | 15 (39.5%) |
Fertility by Education in Koloa
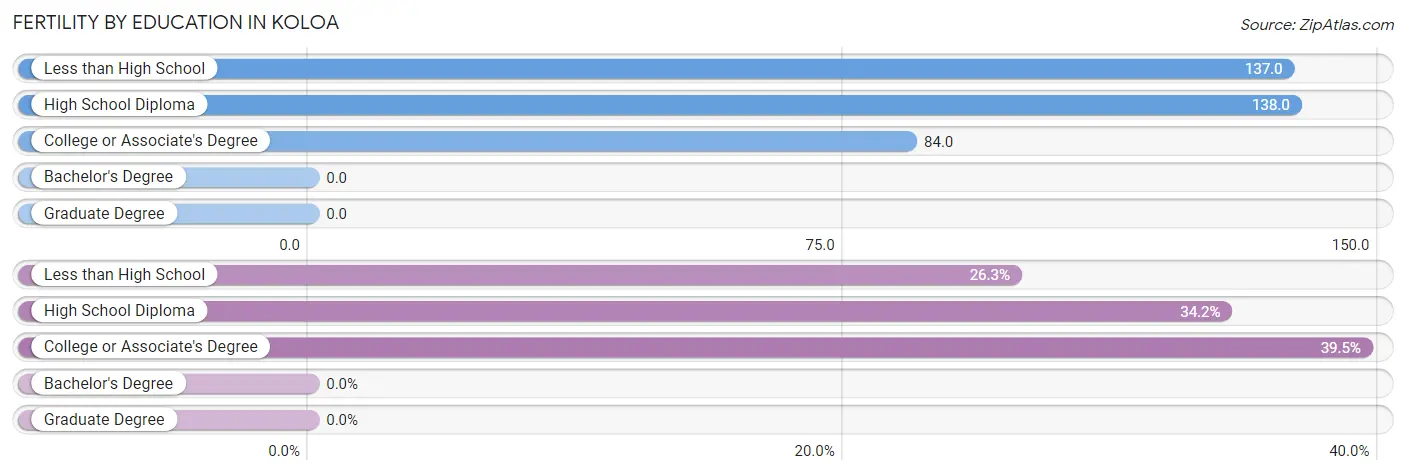
| Educational Attainment | Women with Births | Births / 1,000 Women |
| Less than High School | 10 (26.3%) | 137.0 |
| High School Diploma | 13 (34.2%) | 138.0 |
| College or Associate's Degree | 15 (39.5%) | 84.0 |
| Bachelor's Degree | 0 (0.0%) | 0.0 |
| Graduate Degree | 0 (0.0%) | 0.0 |
| Total | 38 (100.0%) | 89.0 |
Fertility by Education by Marriage Status in Koloa
39.5% of women with births in Koloa are unmarried. Women with the educational attainment of less than high school are most likely to be married with 100.0% of them married at childbirth, while women with the educational attainment of college or associate's degree are least likely to be married with 100.0% of them unmarried at childbirth.
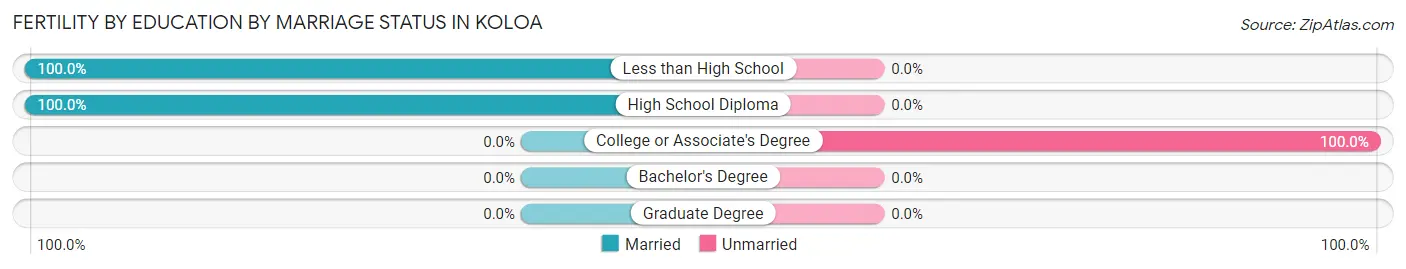
| Educational Attainment | Married | Unmarried |
| Less than High School | 10 (100.0%) | 0 (0.0%) |
| High School Diploma | 13 (100.0%) | 0 (0.0%) |
| College or Associate's Degree | 0 (0.0%) | 15 (100.0%) |
| Bachelor's Degree | 0 (0.0%) | 0 (0.0%) |
| Graduate Degree | 0 (0.0%) | 0 (0.0%) |
| Total | 23 (60.5%) | 15 (39.5%) |
Employment Characteristics in Koloa
Employment by Class of Employer in Koloa
Among the 1,033 employed individuals in Koloa, private company employees (693 | 67.1%), state government employees (81 | 7.8%), and federal government employees (74 | 7.2%) make up the most common classes of employment.
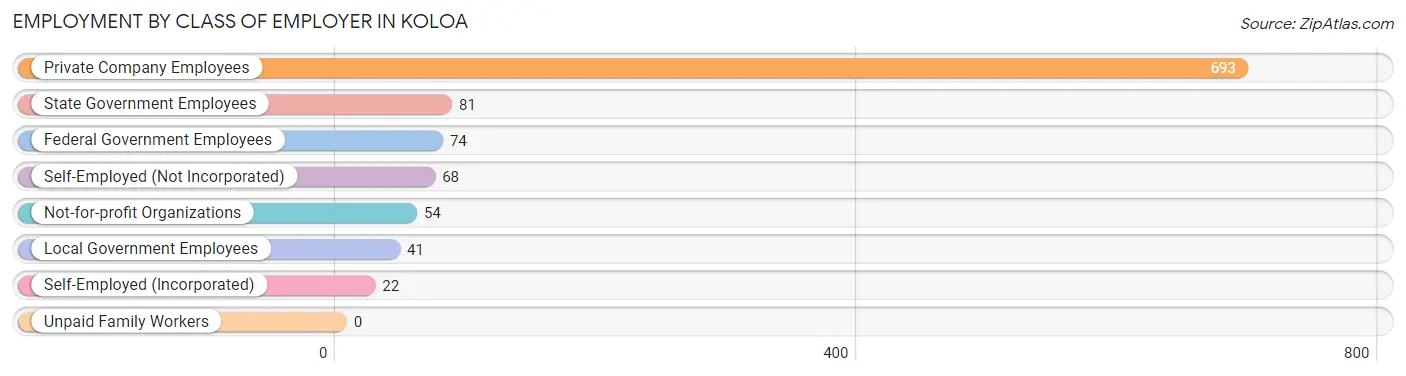
| Employer Class | # Employees | % Employees |
| Private Company Employees | 693 | 67.1% |
| Self-Employed (Incorporated) | 22 | 2.1% |
| Self-Employed (Not Incorporated) | 68 | 6.6% |
| Not-for-profit Organizations | 54 | 5.2% |
| Local Government Employees | 41 | 4.0% |
| State Government Employees | 81 | 7.8% |
| Federal Government Employees | 74 | 7.2% |
| Unpaid Family Workers | 0 | 0.0% |
| Total | 1,033 | 100.0% |
Employment Status by Age in Koloa
According to the labor force statistics for Koloa, out of the total population over 16 years of age (1,729), 68.4% or 1,183 individuals are in the labor force, with 9.5% or 112 of them unemployed. The age group with the highest labor force participation rate is 30 to 34 years, with 100.0% or 165 individuals in the labor force. Within the labor force, the 25 to 29 years age range has the highest percentage of unemployed individuals, with 33.7% or 31 of them being unemployed.
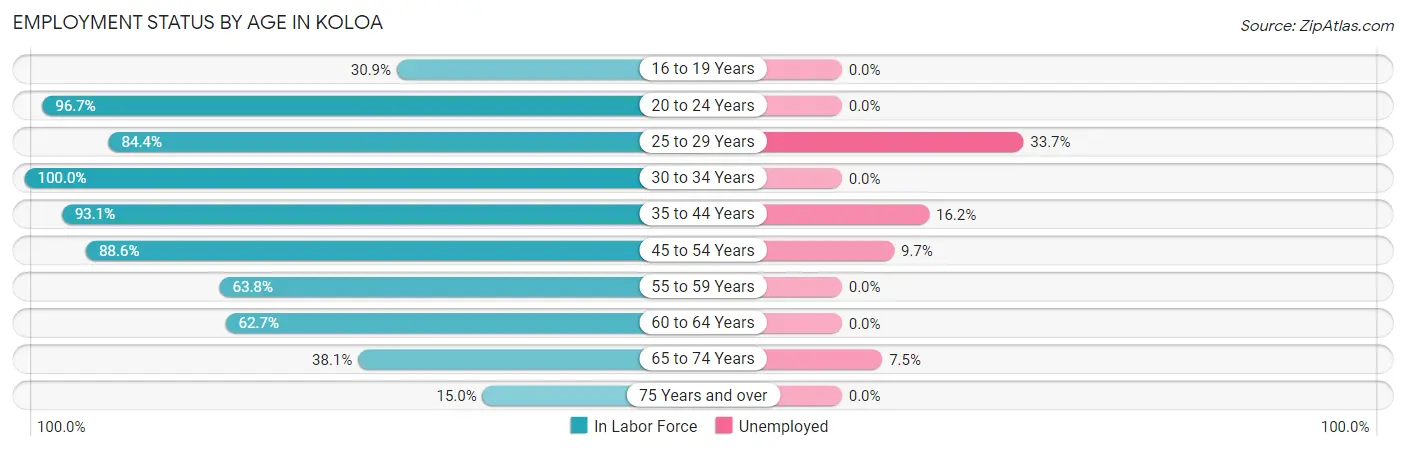
| Age Bracket | In Labor Force | Unemployed |
| 16 to 19 Years | 30 (30.9%) | 0 (0.0%) |
| 20 to 24 Years | 89 (96.7%) | 0 (0.0%) |
| 25 to 29 Years | 92 (84.4%) | 31 (33.7%) |
| 30 to 34 Years | 165 (100.0%) | 0 (0.0%) |
| 35 to 44 Years | 296 (93.1%) | 48 (16.2%) |
| 45 to 54 Years | 226 (88.6%) | 22 (9.7%) |
| 55 to 59 Years | 88 (63.8%) | 0 (0.0%) |
| 60 to 64 Years | 74 (62.7%) | 0 (0.0%) |
| 65 to 74 Years | 93 (38.1%) | 7 (7.5%) |
| 75 Years and over | 29 (15.0%) | 0 (0.0%) |
| Total | 1,183 (68.4%) | 112 (9.5%) |
Employment Status by Educational Attainment in Koloa
According to labor force statistics for Koloa, 85.3% of individuals (941) out of the total population between 25 and 64 years of age (1,103) are in the labor force, with 11.3% or 106 of them being unemployed. The group with the highest labor force participation rate are those with the educational attainment of college / associate degree, with 88.5% or 339 individuals in the labor force. Within the labor force, individuals with high school diploma education have the highest percentage of unemployment, with 17.5% or 53 of them being unemployed.
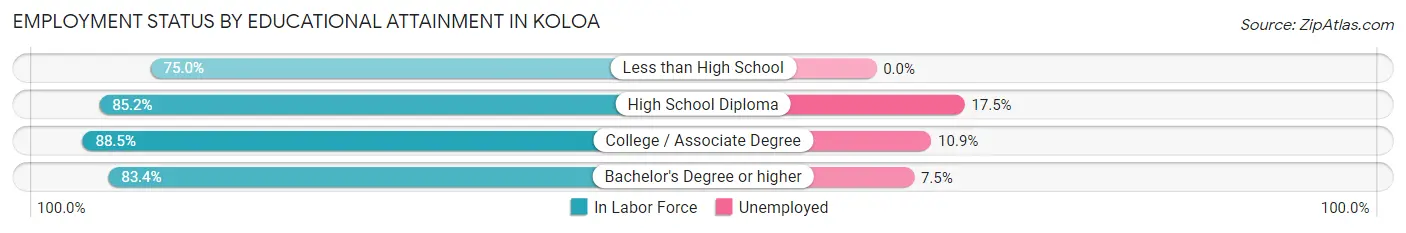
| Educational Attainment | In Labor Force | Unemployed |
| Less than High School | 45 (75.0%) | 0 (0.0%) |
| High School Diploma | 305 (85.2%) | 63 (17.5%) |
| College / Associate Degree | 339 (88.5%) | 42 (10.9%) |
| Bachelor's Degree or higher | 252 (83.4%) | 23 (7.5%) |
| Total | 941 (85.3%) | 125 (11.3%) |
Employment Occupations by Sex in Koloa
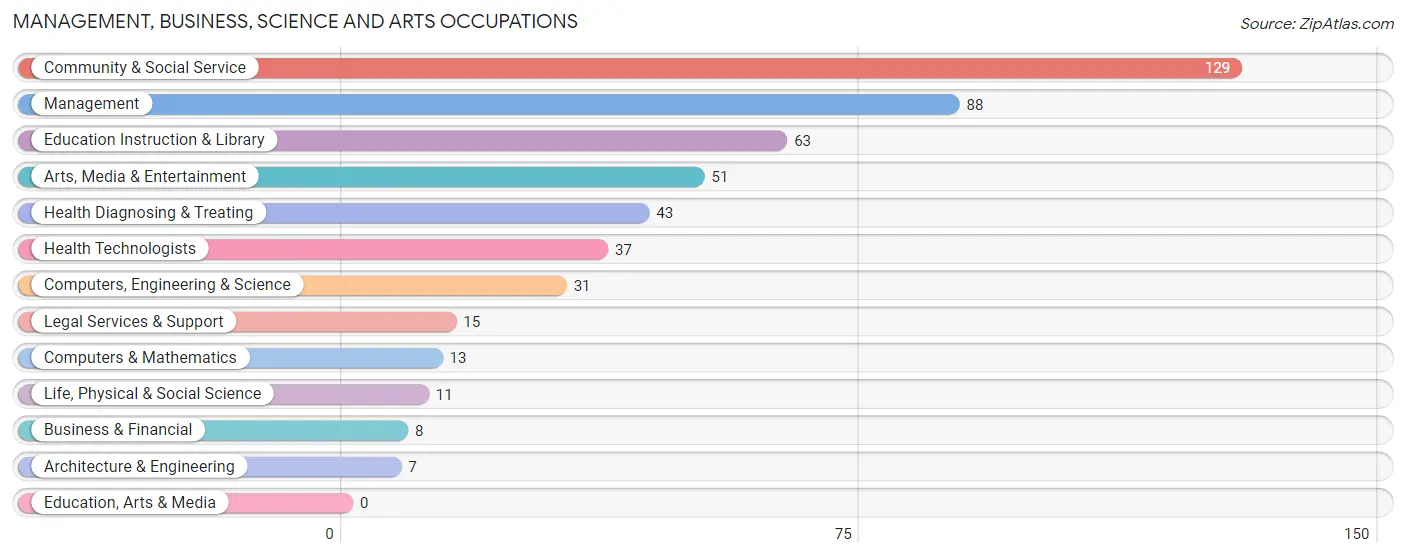
Management, Business, Science and Arts Occupations
The most common Management, Business, Science and Arts occupations in Koloa are Community & Social Service (129 | 12.6%), Management (88 | 8.6%), Education Instruction & Library (63 | 6.1%), Arts, Media & Entertainment (51 | 5.0%), and Health Diagnosing & Treating (43 | 4.2%).
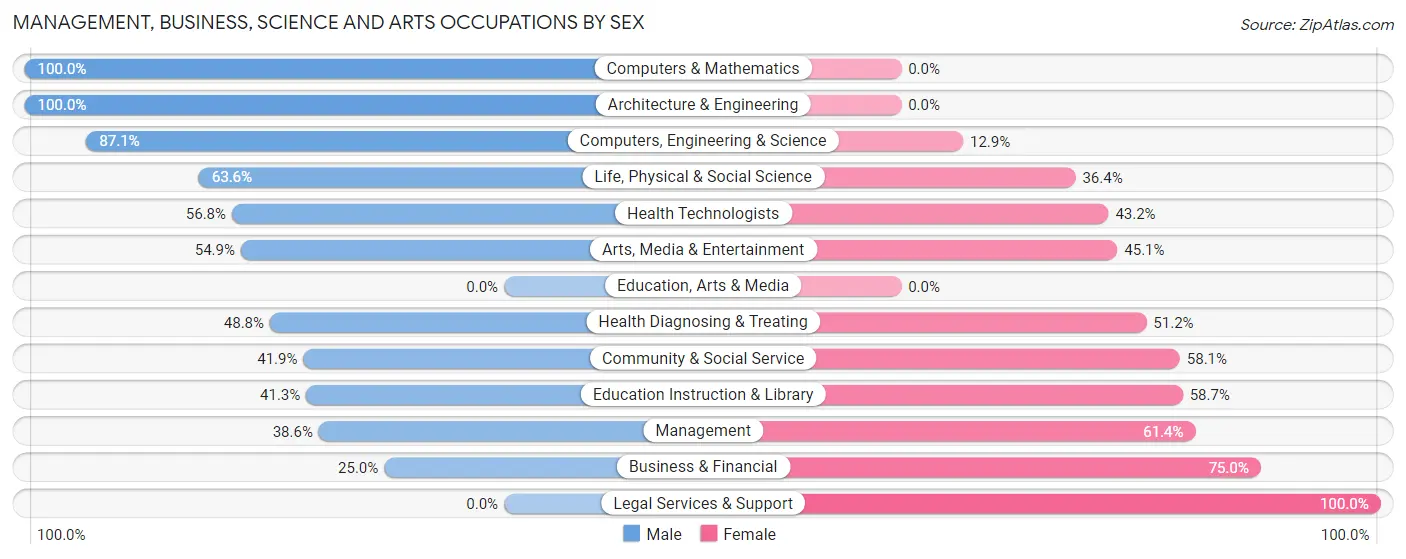
Management, Business, Science and Arts Occupations by Sex
Within the Management, Business, Science and Arts occupations in Koloa, the most male-oriented occupations are Computers & Mathematics (100.0%), Architecture & Engineering (100.0%), and Computers, Engineering & Science (87.1%), while the most female-oriented occupations are Legal Services & Support (100.0%), Business & Financial (75.0%), and Management (61.4%).
| Occupation | Male | Female |
| Management | 34 (38.6%) | 54 (61.4%) |
| Business & Financial | 2 (25.0%) | 6 (75.0%) |
| Computers, Engineering & Science | 27 (87.1%) | 4 (12.9%) |
| Computers & Mathematics | 13 (100.0%) | 0 (0.0%) |
| Architecture & Engineering | 7 (100.0%) | 0 (0.0%) |
| Life, Physical & Social Science | 7 (63.6%) | 4 (36.4%) |
| Community & Social Service | 54 (41.9%) | 75 (58.1%) |
| Education, Arts & Media | 0 (0.0%) | 0 (0.0%) |
| Legal Services & Support | 0 (0.0%) | 15 (100.0%) |
| Education Instruction & Library | 26 (41.3%) | 37 (58.7%) |
| Arts, Media & Entertainment | 28 (54.9%) | 23 (45.1%) |
| Health Diagnosing & Treating | 21 (48.8%) | 22 (51.2%) |
| Health Technologists | 21 (56.8%) | 16 (43.2%) |
| Total (Category) | 138 (46.2%) | 161 (53.8%) |
| Total (Overall) | 503 (49.0%) | 523 (51.0%) |
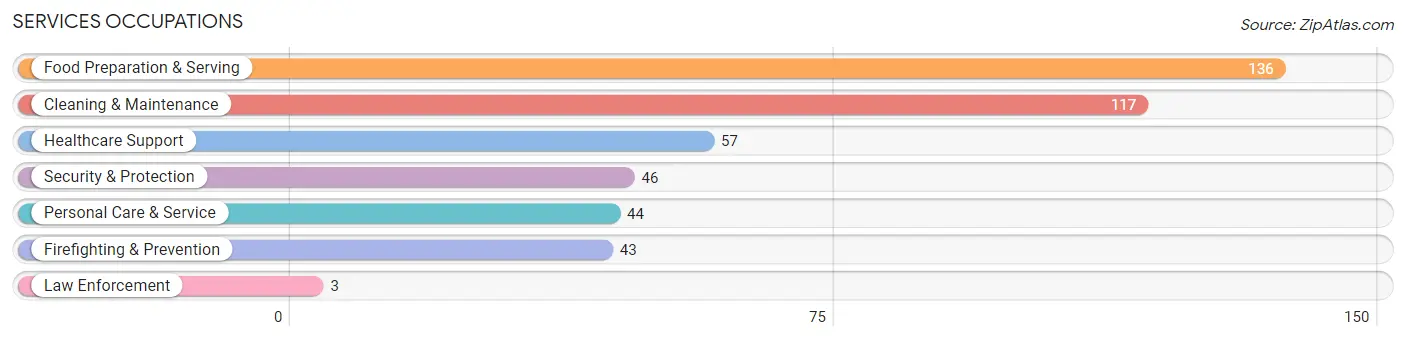
Services Occupations
The most common Services occupations in Koloa are Food Preparation & Serving (136 | 13.3%), Cleaning & Maintenance (117 | 11.4%), Healthcare Support (57 | 5.6%), Security & Protection (46 | 4.5%), and Personal Care & Service (44 | 4.3%).
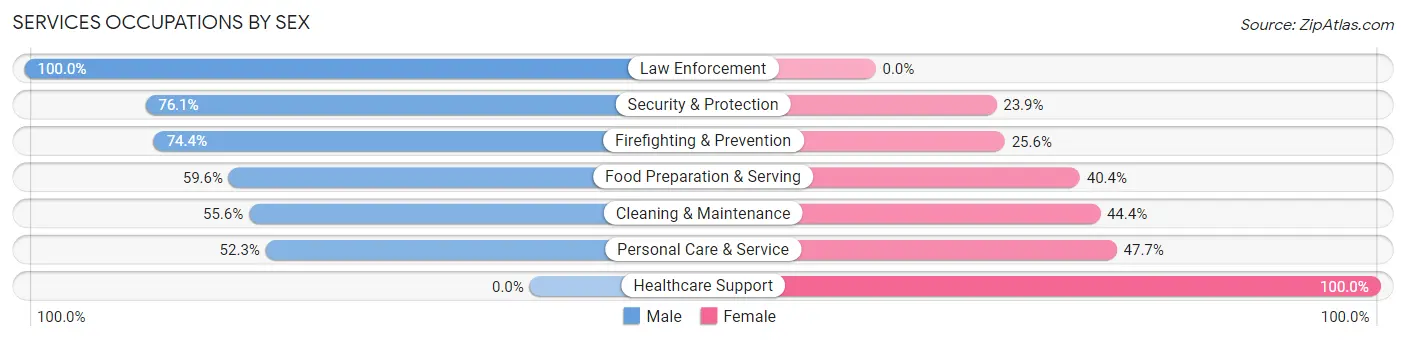
Services Occupations by Sex
Within the Services occupations in Koloa, the most male-oriented occupations are Law Enforcement (100.0%), Security & Protection (76.1%), and Firefighting & Prevention (74.4%), while the most female-oriented occupations are Healthcare Support (100.0%), Personal Care & Service (47.7%), and Cleaning & Maintenance (44.4%).
| Occupation | Male | Female |
| Healthcare Support | 0 (0.0%) | 57 (100.0%) |
| Security & Protection | 35 (76.1%) | 11 (23.9%) |
| Firefighting & Prevention | 32 (74.4%) | 11 (25.6%) |
| Law Enforcement | 3 (100.0%) | 0 (0.0%) |
| Food Preparation & Serving | 81 (59.6%) | 55 (40.4%) |
| Cleaning & Maintenance | 65 (55.6%) | 52 (44.4%) |
| Personal Care & Service | 23 (52.3%) | 21 (47.7%) |
| Total (Category) | 204 (51.0%) | 196 (49.0%) |
| Total (Overall) | 503 (49.0%) | 523 (51.0%) |
Sales and Office Occupations
The most common Sales and Office occupations in Koloa are Office & Administration (113 | 11.0%), and Sales & Related (68 | 6.6%).
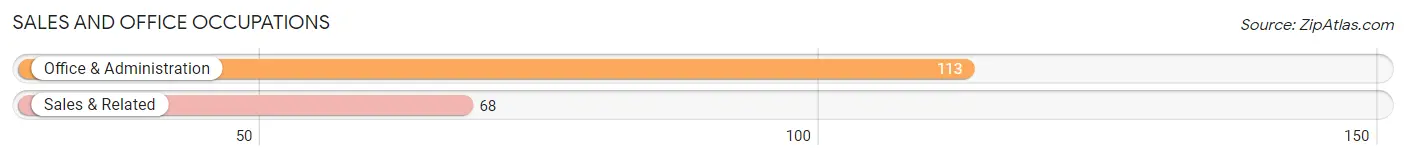
Sales and Office Occupations by Sex
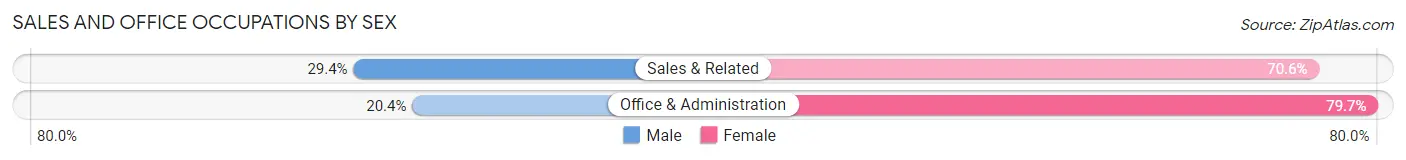
| Occupation | Male | Female |
| Sales & Related | 20 (29.4%) | 48 (70.6%) |
| Office & Administration | 23 (20.3%) | 90 (79.6%) |
| Total (Category) | 43 (23.8%) | 138 (76.2%) |
| Total (Overall) | 503 (49.0%) | 523 (51.0%) |
Natural Resources, Construction and Maintenance Occupations
The most common Natural Resources, Construction and Maintenance occupations in Koloa are Construction & Extraction (55 | 5.4%), and Installation, Maintenance & Repair (13 | 1.3%).
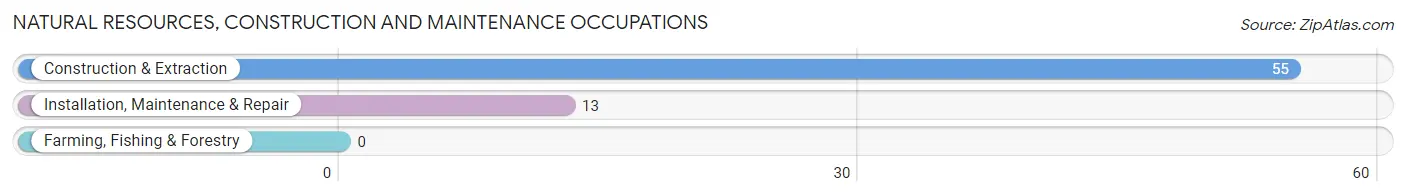
Natural Resources, Construction and Maintenance Occupations by Sex
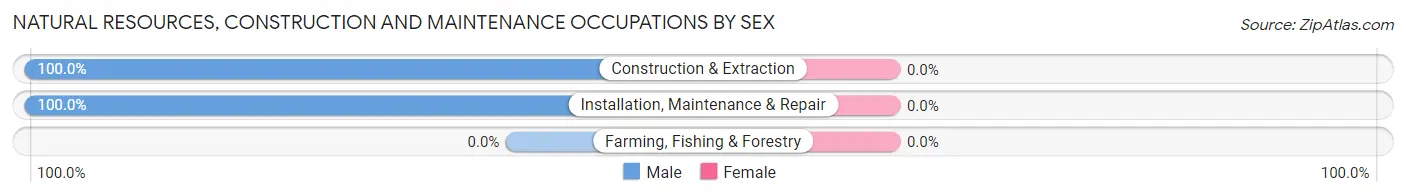
| Occupation | Male | Female |
| Farming, Fishing & Forestry | 0 (0.0%) | 0 (0.0%) |
| Construction & Extraction | 55 (100.0%) | 0 (0.0%) |
| Installation, Maintenance & Repair | 13 (100.0%) | 0 (0.0%) |
| Total (Category) | 68 (100.0%) | 0 (0.0%) |
| Total (Overall) | 503 (49.0%) | 523 (51.0%) |
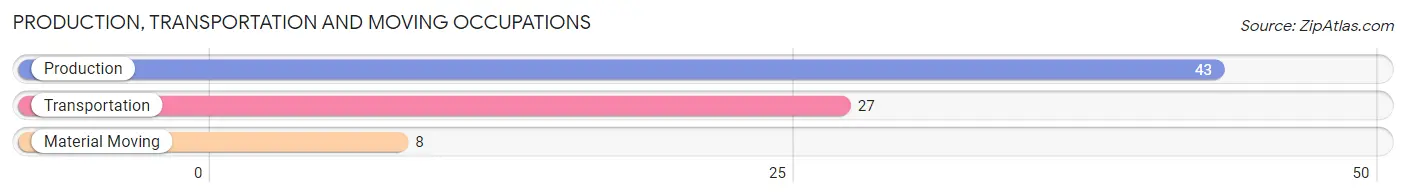
Production, Transportation and Moving Occupations
The most common Production, Transportation and Moving occupations in Koloa are Production (43 | 4.2%), Transportation (27 | 2.6%), and Material Moving (8 | 0.8%).
Production, Transportation and Moving Occupations by Sex
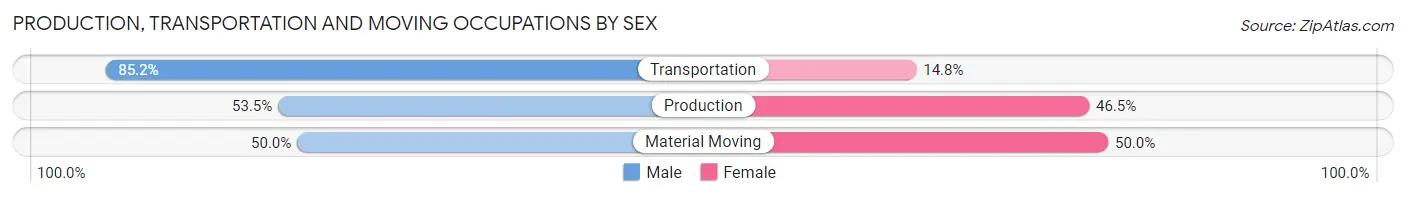
| Occupation | Male | Female |
| Production | 23 (53.5%) | 20 (46.5%) |
| Transportation | 23 (85.2%) | 4 (14.8%) |
| Material Moving | 4 (50.0%) | 4 (50.0%) |
| Total (Category) | 50 (64.1%) | 28 (35.9%) |
| Total (Overall) | 503 (49.0%) | 523 (51.0%) |
Employment Industries by Sex in Koloa
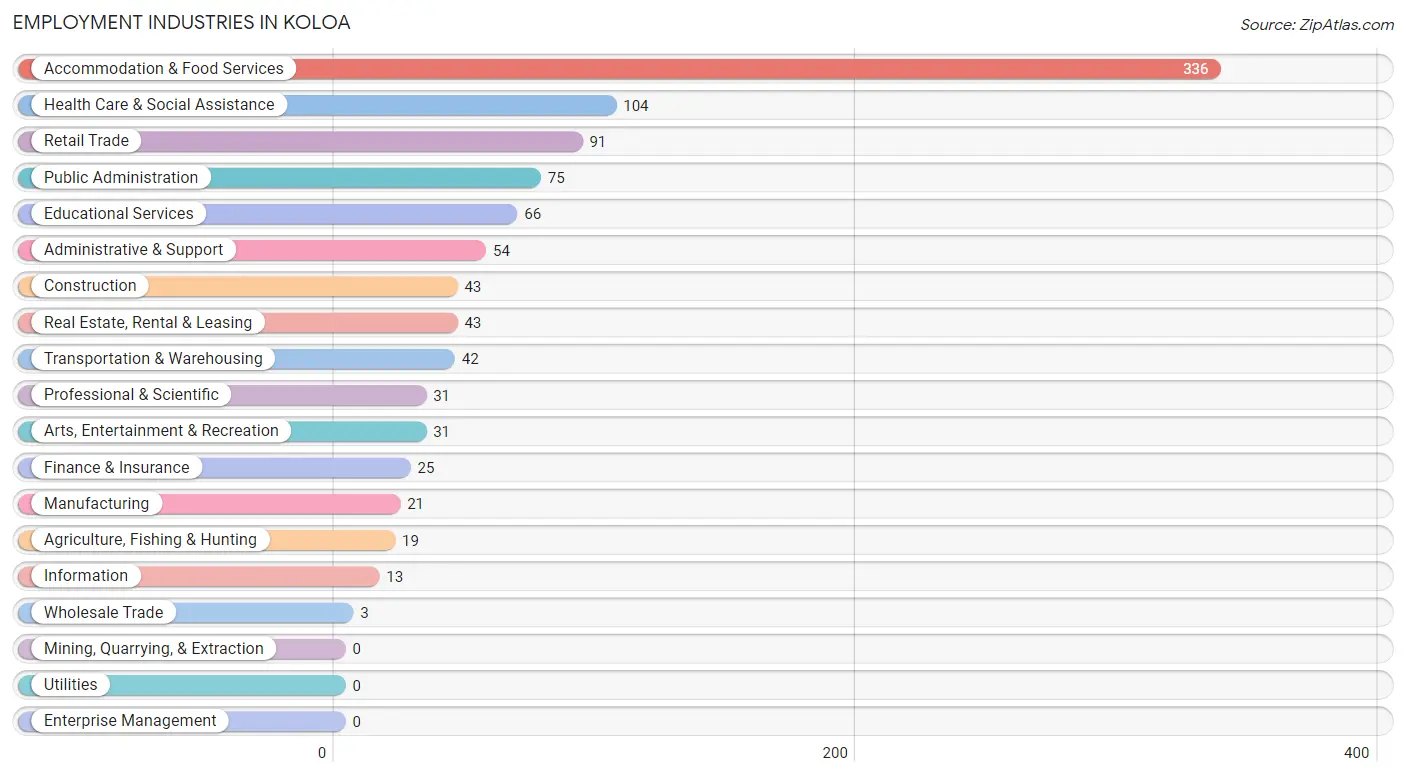
Employment Industries in Koloa
The major employment industries in Koloa include Accommodation & Food Services (336 | 32.8%), Health Care & Social Assistance (104 | 10.1%), Retail Trade (91 | 8.9%), Public Administration (75 | 7.3%), and Educational Services (66 | 6.4%).
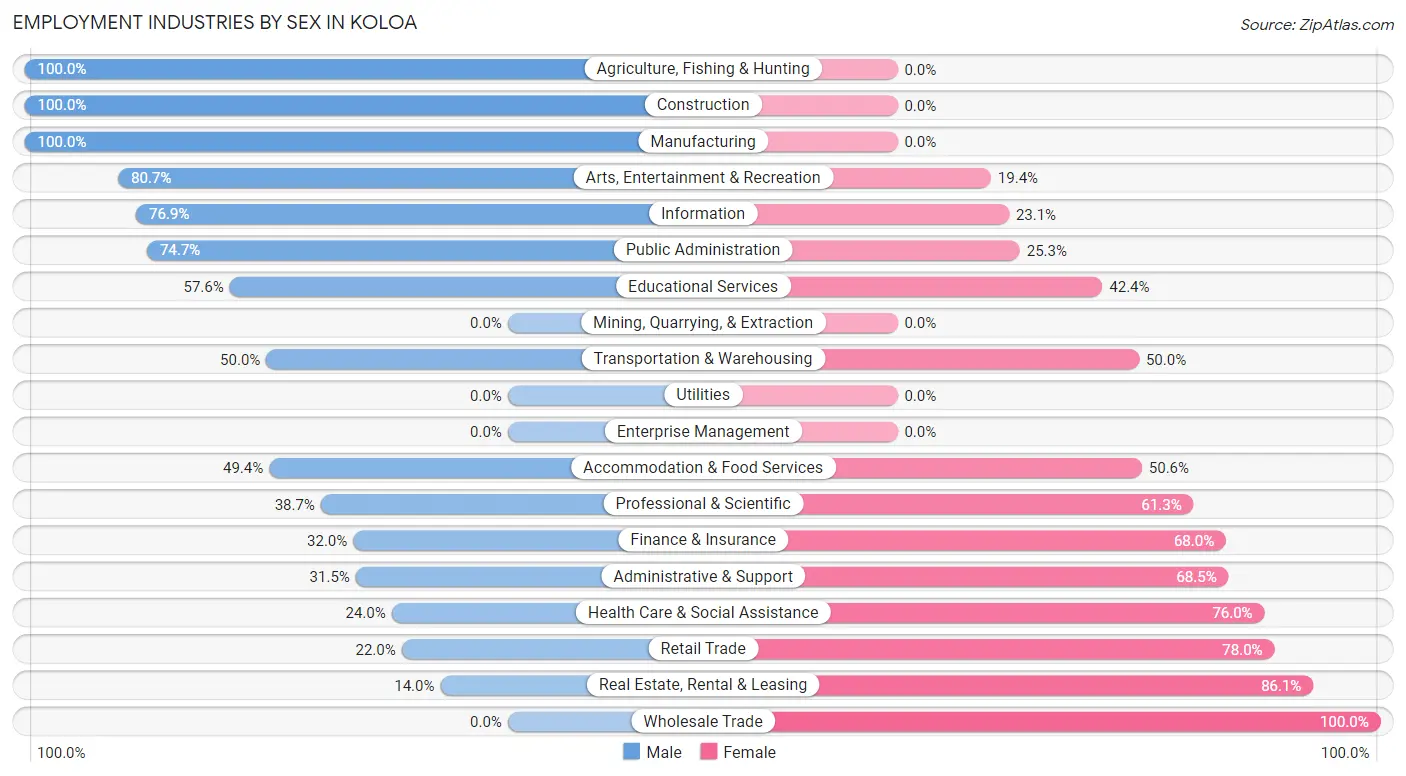
Employment Industries by Sex in Koloa
The Koloa industries that see more men than women are Agriculture, Fishing & Hunting (100.0%), Construction (100.0%), and Manufacturing (100.0%), whereas the industries that tend to have a higher number of women are Wholesale Trade (100.0%), Real Estate, Rental & Leasing (86.1%), and Retail Trade (78.0%).
| Industry | Male | Female |
| Agriculture, Fishing & Hunting | 19 (100.0%) | 0 (0.0%) |
| Mining, Quarrying, & Extraction | 0 (0.0%) | 0 (0.0%) |
| Construction | 43 (100.0%) | 0 (0.0%) |
| Manufacturing | 21 (100.0%) | 0 (0.0%) |
| Wholesale Trade | 0 (0.0%) | 3 (100.0%) |
| Retail Trade | 20 (22.0%) | 71 (78.0%) |
| Transportation & Warehousing | 21 (50.0%) | 21 (50.0%) |
| Utilities | 0 (0.0%) | 0 (0.0%) |
| Information | 10 (76.9%) | 3 (23.1%) |
| Finance & Insurance | 8 (32.0%) | 17 (68.0%) |
| Real Estate, Rental & Leasing | 6 (14.0%) | 37 (86.1%) |
| Professional & Scientific | 12 (38.7%) | 19 (61.3%) |
| Enterprise Management | 0 (0.0%) | 0 (0.0%) |
| Administrative & Support | 17 (31.5%) | 37 (68.5%) |
| Educational Services | 38 (57.6%) | 28 (42.4%) |
| Health Care & Social Assistance | 25 (24.0%) | 79 (76.0%) |
| Arts, Entertainment & Recreation | 25 (80.6%) | 6 (19.4%) |
| Accommodation & Food Services | 166 (49.4%) | 170 (50.6%) |
| Public Administration | 56 (74.7%) | 19 (25.3%) |
| Total | 503 (49.0%) | 523 (51.0%) |
Education in Koloa
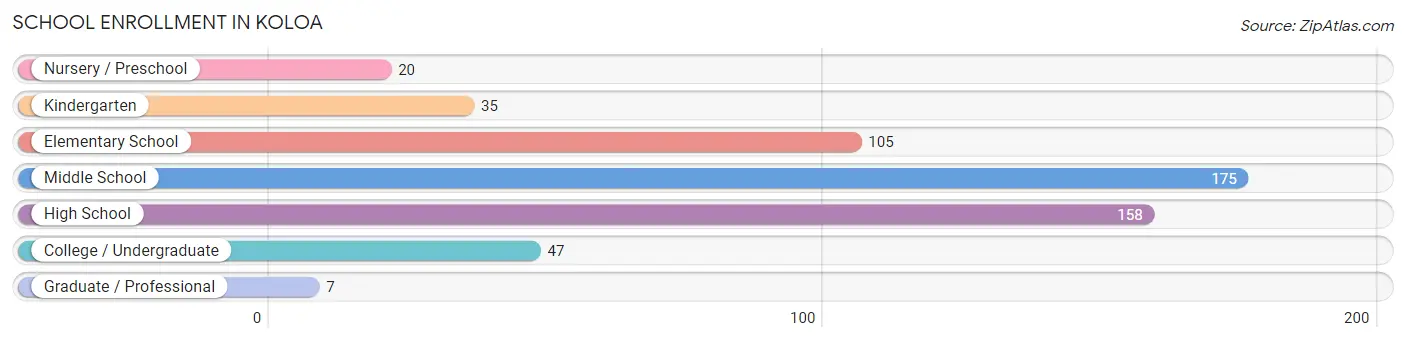
School Enrollment in Koloa
The most common levels of schooling among the 547 students in Koloa are middle school (175 | 32.0%), high school (158 | 28.9%), and elementary school (105 | 19.2%).
| School Level | # Students | % Students |
| Nursery / Preschool | 20 | 3.7% |
| Kindergarten | 35 | 6.4% |
| Elementary School | 105 | 19.2% |
| Middle School | 175 | 32.0% |
| High School | 158 | 28.9% |
| College / Undergraduate | 47 | 8.6% |
| Graduate / Professional | 7 | 1.3% |
| Total | 547 | 100.0% |
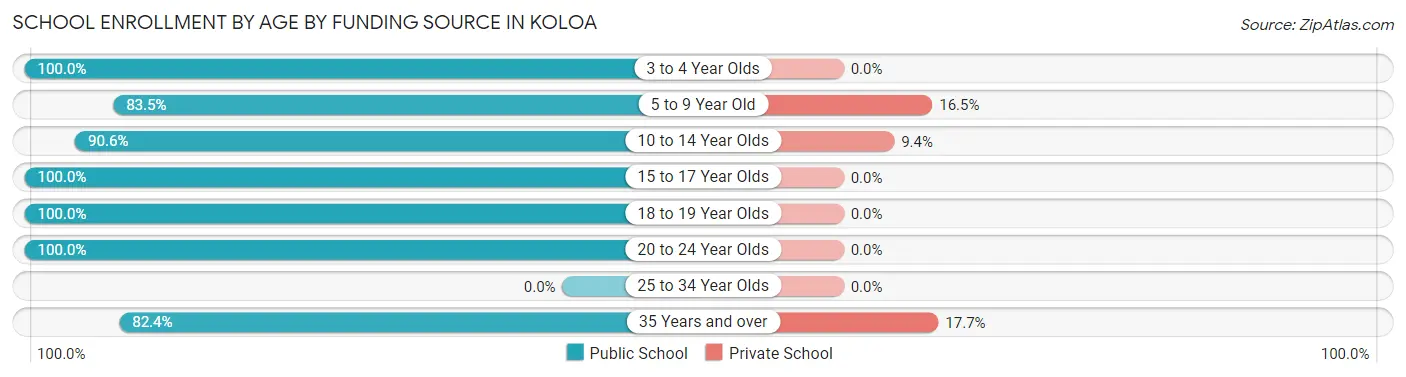
School Enrollment by Age by Funding Source in Koloa
Out of a total of 547 students who are enrolled in schools in Koloa, 48 (8.8%) attend a private institution, while the remaining 499 (91.2%) are enrolled in public schools. The age group of 35 years and over has the highest likelihood of being enrolled in private schools, with 9 (17.6% in the age bracket) enrolled. Conversely, the age group of 3 to 4 year olds has the lowest likelihood of being enrolled in a private school, with 20 (100.0% in the age bracket) attending a public institution.
| Age Bracket | Public School | Private School |
| 3 to 4 Year Olds | 20 (100.0%) | 0 (0.0%) |
| 5 to 9 Year Old | 91 (83.5%) | 18 (16.5%) |
| 10 to 14 Year Olds | 202 (90.6%) | 21 (9.4%) |
| 15 to 17 Year Olds | 104 (100.0%) | 0 (0.0%) |
| 18 to 19 Year Olds | 21 (100.0%) | 0 (0.0%) |
| 20 to 24 Year Olds | 19 (100.0%) | 0 (0.0%) |
| 25 to 34 Year Olds | 0 (0.0%) | 0 (0.0%) |
| 35 Years and over | 42 (82.4%) | 9 (17.6%) |
| Total | 499 (91.2%) | 48 (8.8%) |
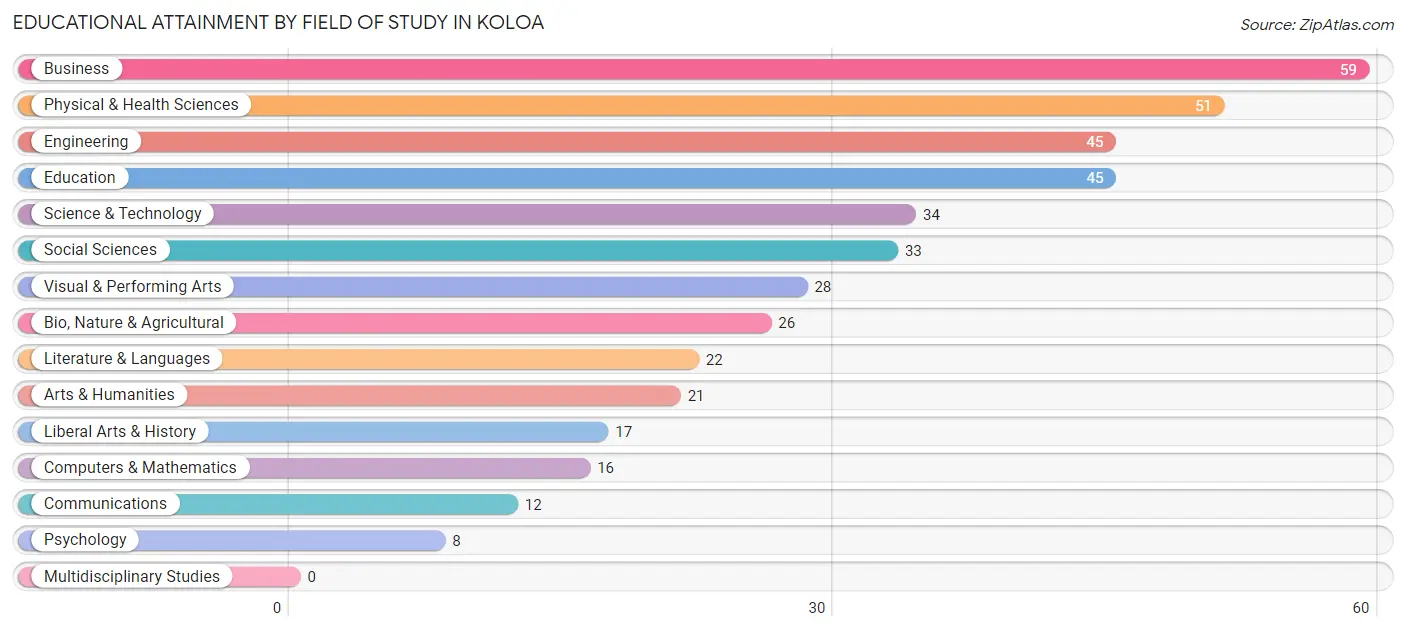
Educational Attainment by Field of Study in Koloa
Business (59 | 14.1%), physical & health sciences (51 | 12.2%), engineering (45 | 10.8%), education (45 | 10.8%), and science & technology (34 | 8.2%) are the most common fields of study among 417 individuals in Koloa who have obtained a bachelor's degree or higher.
| Field of Study | # Graduates | % Graduates |
| Computers & Mathematics | 16 | 3.8% |
| Bio, Nature & Agricultural | 26 | 6.2% |
| Physical & Health Sciences | 51 | 12.2% |
| Psychology | 8 | 1.9% |
| Social Sciences | 33 | 7.9% |
| Engineering | 45 | 10.8% |
| Multidisciplinary Studies | 0 | 0.0% |
| Science & Technology | 34 | 8.2% |
| Business | 59 | 14.1% |
| Education | 45 | 10.8% |
| Literature & Languages | 22 | 5.3% |
| Liberal Arts & History | 17 | 4.1% |
| Visual & Performing Arts | 28 | 6.7% |
| Communications | 12 | 2.9% |
| Arts & Humanities | 21 | 5.0% |
| Total | 417 | 100.0% |
Transportation & Commute in Koloa
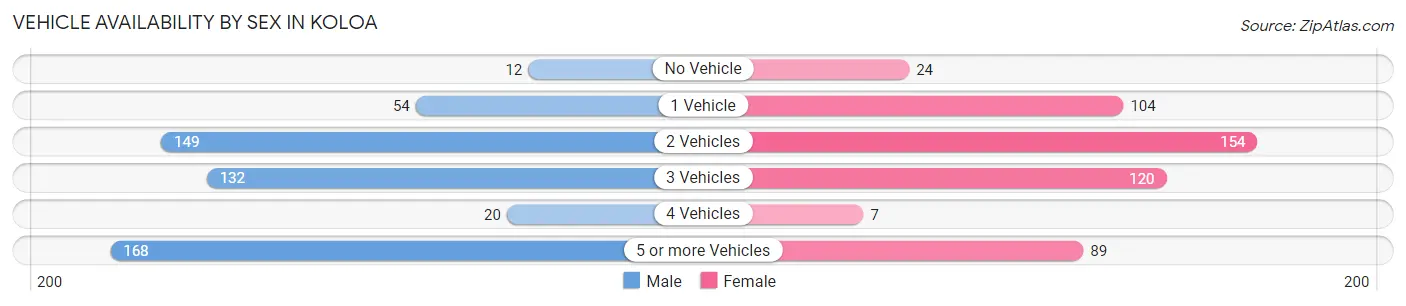
Vehicle Availability by Sex in Koloa
The most prevalent vehicle ownership categories in Koloa are males with 5 or more vehicles (168, accounting for 31.4%) and females with 5 or more vehicles (89, making up 33.7%).
| Vehicles Available | Male | Female |
| No Vehicle | 12 (2.2%) | 24 (4.8%) |
| 1 Vehicle | 54 (10.1%) | 104 (20.9%) |
| 2 Vehicles | 149 (27.9%) | 154 (30.9%) |
| 3 Vehicles | 132 (24.7%) | 120 (24.1%) |
| 4 Vehicles | 20 (3.7%) | 7 (1.4%) |
| 5 or more Vehicles | 168 (31.4%) | 89 (17.9%) |
| Total | 535 (100.0%) | 498 (100.0%) |
Commute Time in Koloa
The most frequently occuring commute durations in Koloa are 5 to 9 minutes (231 commuters, 23.5%), 10 to 14 minutes (230 commuters, 23.4%), and 30 to 34 minutes (178 commuters, 18.1%).
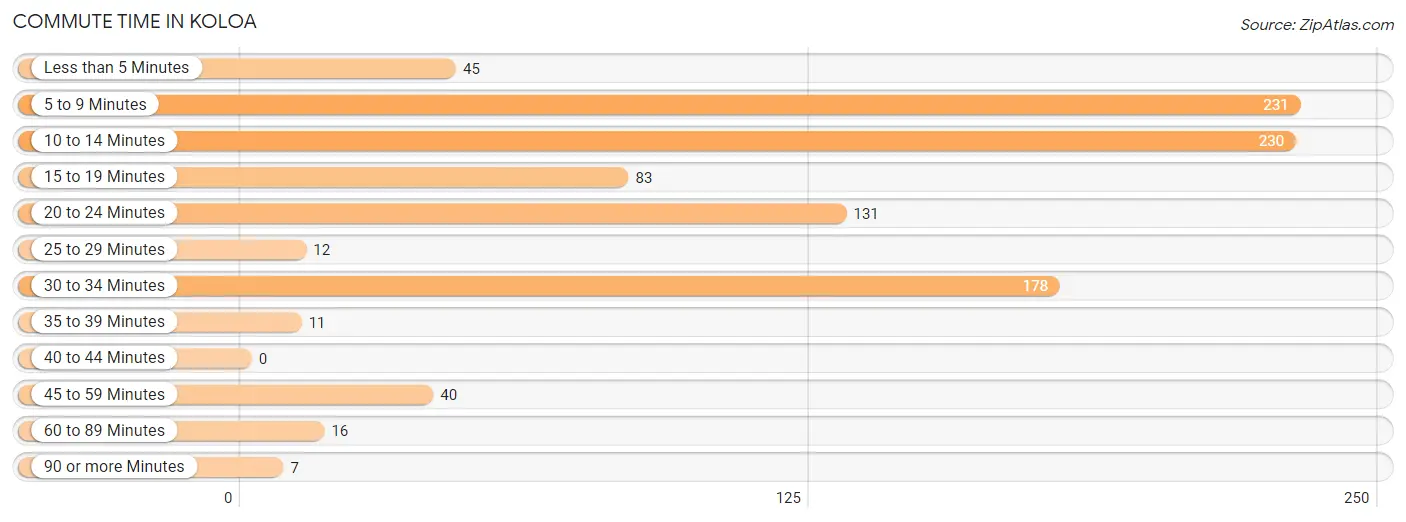
| Commute Time | # Commuters | % Commuters |
| Less than 5 Minutes | 45 | 4.6% |
| 5 to 9 Minutes | 231 | 23.5% |
| 10 to 14 Minutes | 230 | 23.4% |
| 15 to 19 Minutes | 83 | 8.4% |
| 20 to 24 Minutes | 131 | 13.3% |
| 25 to 29 Minutes | 12 | 1.2% |
| 30 to 34 Minutes | 178 | 18.1% |
| 35 to 39 Minutes | 11 | 1.1% |
| 40 to 44 Minutes | 0 | 0.0% |
| 45 to 59 Minutes | 40 | 4.1% |
| 60 to 89 Minutes | 16 | 1.6% |
| 90 or more Minutes | 7 | 0.7% |
Commute Time by Sex in Koloa
The most common commute times in Koloa are 30 to 34 minutes (143 commuters, 27.7%) for males and 5 to 9 minutes (128 commuters, 27.4%) for females.
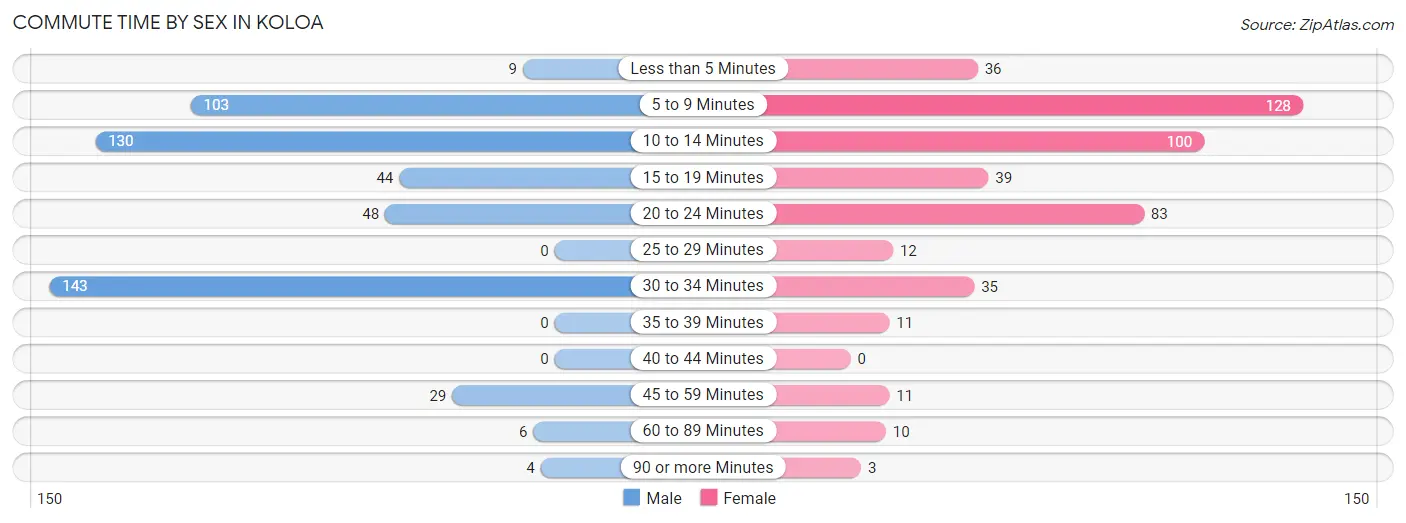
| Commute Time | Male | Female |
| Less than 5 Minutes | 9 (1.7%) | 36 (7.7%) |
| 5 to 9 Minutes | 103 (20.0%) | 128 (27.4%) |
| 10 to 14 Minutes | 130 (25.2%) | 100 (21.4%) |
| 15 to 19 Minutes | 44 (8.5%) | 39 (8.3%) |
| 20 to 24 Minutes | 48 (9.3%) | 83 (17.7%) |
| 25 to 29 Minutes | 0 (0.0%) | 12 (2.6%) |
| 30 to 34 Minutes | 143 (27.7%) | 35 (7.5%) |
| 35 to 39 Minutes | 0 (0.0%) | 11 (2.4%) |
| 40 to 44 Minutes | 0 (0.0%) | 0 (0.0%) |
| 45 to 59 Minutes | 29 (5.6%) | 11 (2.4%) |
| 60 to 89 Minutes | 6 (1.2%) | 10 (2.1%) |
| 90 or more Minutes | 4 (0.8%) | 3 (0.6%) |
Time of Departure to Work by Sex in Koloa
The most frequent times of departure to work in Koloa are 7:30 AM to 7:59 AM (106, 20.5%) for males and 12:00 PM to 3:59 PM (77, 16.5%) for females.
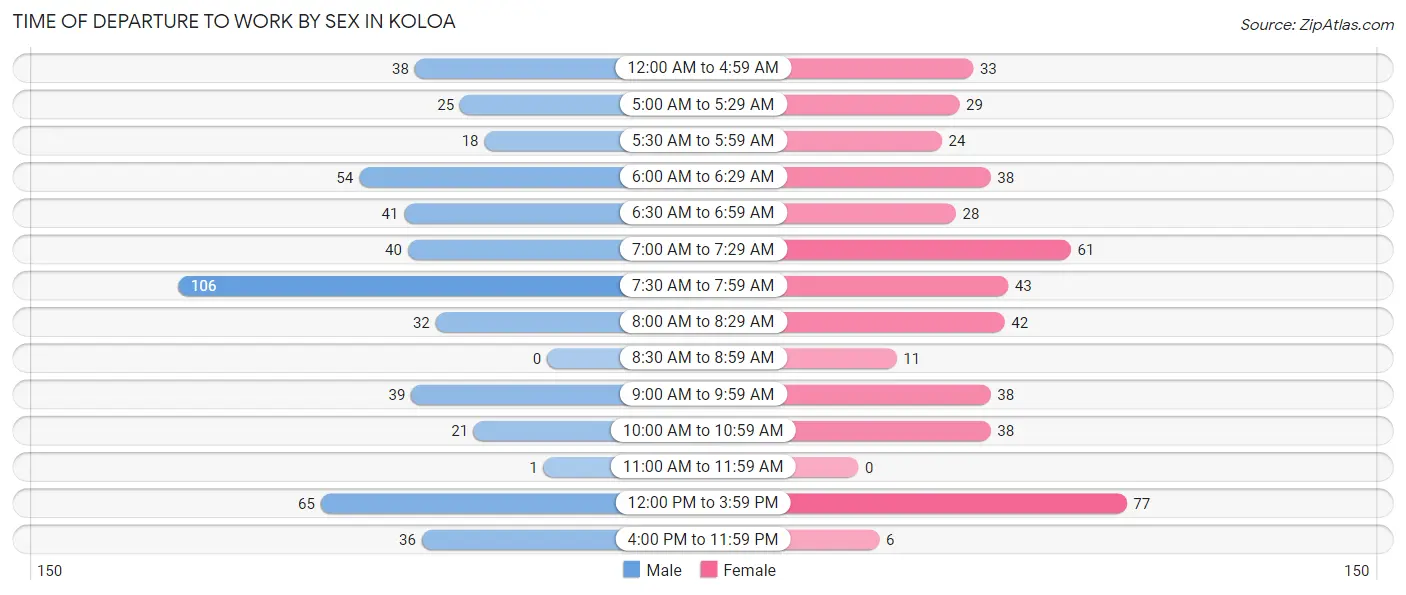
| Time of Departure | Male | Female |
| 12:00 AM to 4:59 AM | 38 (7.4%) | 33 (7.0%) |
| 5:00 AM to 5:29 AM | 25 (4.8%) | 29 (6.2%) |
| 5:30 AM to 5:59 AM | 18 (3.5%) | 24 (5.1%) |
| 6:00 AM to 6:29 AM | 54 (10.5%) | 38 (8.1%) |
| 6:30 AM to 6:59 AM | 41 (8.0%) | 28 (6.0%) |
| 7:00 AM to 7:29 AM | 40 (7.7%) | 61 (13.0%) |
| 7:30 AM to 7:59 AM | 106 (20.5%) | 43 (9.2%) |
| 8:00 AM to 8:29 AM | 32 (6.2%) | 42 (9.0%) |
| 8:30 AM to 8:59 AM | 0 (0.0%) | 11 (2.4%) |
| 9:00 AM to 9:59 AM | 39 (7.6%) | 38 (8.1%) |
| 10:00 AM to 10:59 AM | 21 (4.1%) | 38 (8.1%) |
| 11:00 AM to 11:59 AM | 1 (0.2%) | 0 (0.0%) |
| 12:00 PM to 3:59 PM | 65 (12.6%) | 77 (16.5%) |
| 4:00 PM to 11:59 PM | 36 (7.0%) | 6 (1.3%) |
| Total | 516 (100.0%) | 468 (100.0%) |
Housing Occupancy in Koloa
Occupancy by Ownership in Koloa
Of the total 700 dwellings in Koloa, owner-occupied units account for 324 (46.3%), while renter-occupied units make up 376 (53.7%).
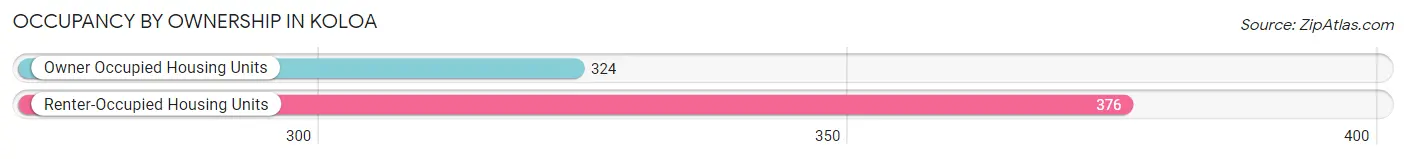
| Occupancy | # Housing Units | % Housing Units |
| Owner Occupied Housing Units | 324 | 46.3% |
| Renter-Occupied Housing Units | 376 | 53.7% |
| Total Occupied Housing Units | 700 | 100.0% |
Occupancy by Household Size in Koloa
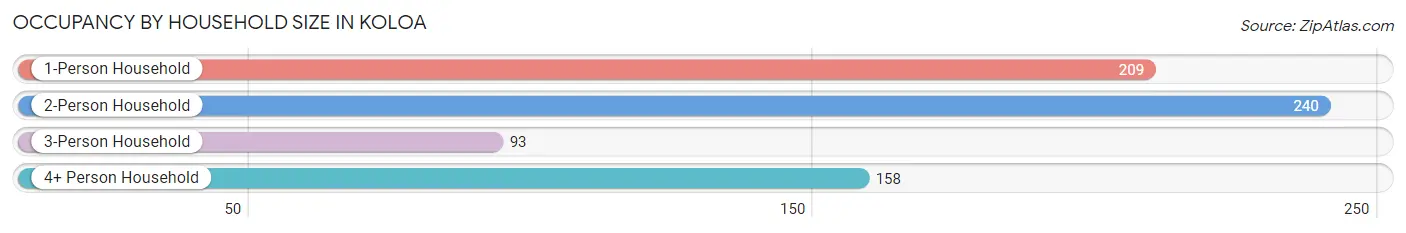
| Household Size | # Housing Units | % Housing Units |
| 1-Person Household | 209 | 29.9% |
| 2-Person Household | 240 | 34.3% |
| 3-Person Household | 93 | 13.3% |
| 4+ Person Household | 158 | 22.6% |
| Total Housing Units | 700 | 100.0% |
Occupancy by Ownership by Household Size in Koloa
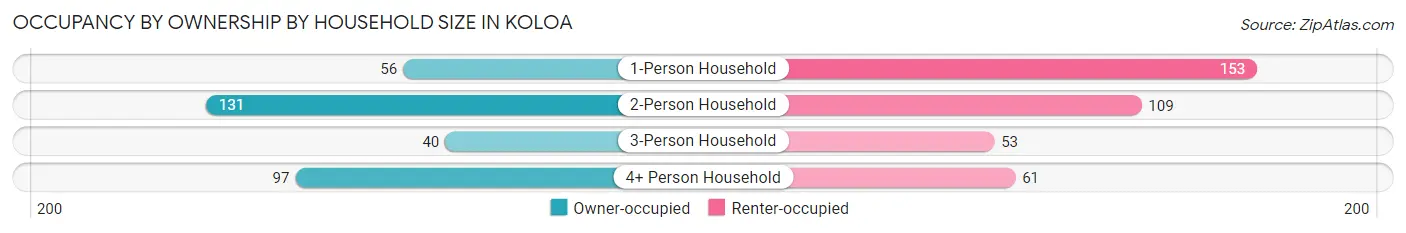
| Household Size | Owner-occupied | Renter-occupied |
| 1-Person Household | 56 (26.8%) | 153 (73.2%) |
| 2-Person Household | 131 (54.6%) | 109 (45.4%) |
| 3-Person Household | 40 (43.0%) | 53 (57.0%) |
| 4+ Person Household | 97 (61.4%) | 61 (38.6%) |
| Total Housing Units | 324 (46.3%) | 376 (53.7%) |
Occupancy by Educational Attainment in Koloa
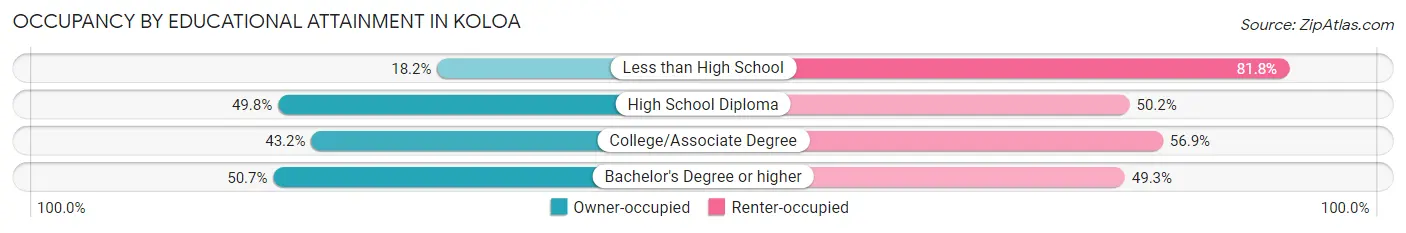
| Household Size | Owner-occupied | Renter-occupied |
| Less than High School | 6 (18.2%) | 27 (81.8%) |
| High School Diploma | 104 (49.8%) | 105 (50.2%) |
| College/Associate Degree | 104 (43.1%) | 137 (56.9%) |
| Bachelor's Degree or higher | 110 (50.7%) | 107 (49.3%) |
Occupancy by Age of Householder in Koloa
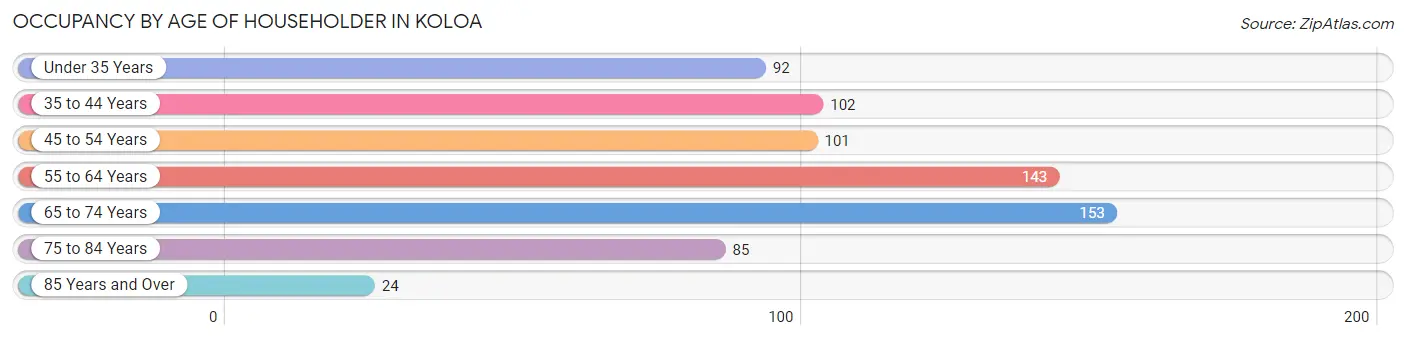
| Age Bracket | # Households | % Households |
| Under 35 Years | 92 | 13.1% |
| 35 to 44 Years | 102 | 14.6% |
| 45 to 54 Years | 101 | 14.4% |
| 55 to 64 Years | 143 | 20.4% |
| 65 to 74 Years | 153 | 21.9% |
| 75 to 84 Years | 85 | 12.1% |
| 85 Years and Over | 24 | 3.4% |
| Total | 700 | 100.0% |
Housing Finances in Koloa
Median Income by Occupancy in Koloa
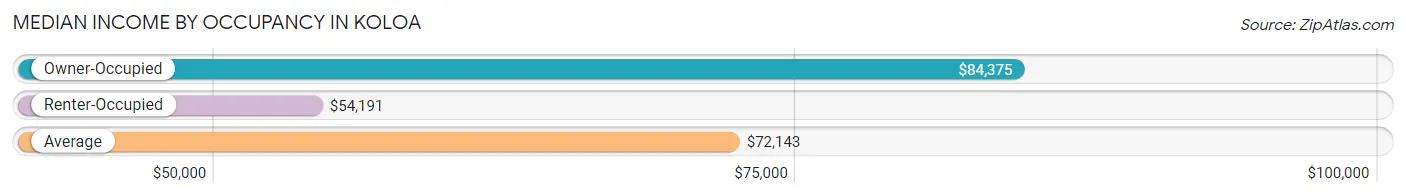
| Occupancy Type | # Households | Median Income |
| Owner-Occupied | 324 (46.3%) | $84,375 |
| Renter-Occupied | 376 (53.7%) | $54,191 |
| Average | 700 (100.0%) | $72,143 |
Occupancy by Householder Income Bracket in Koloa
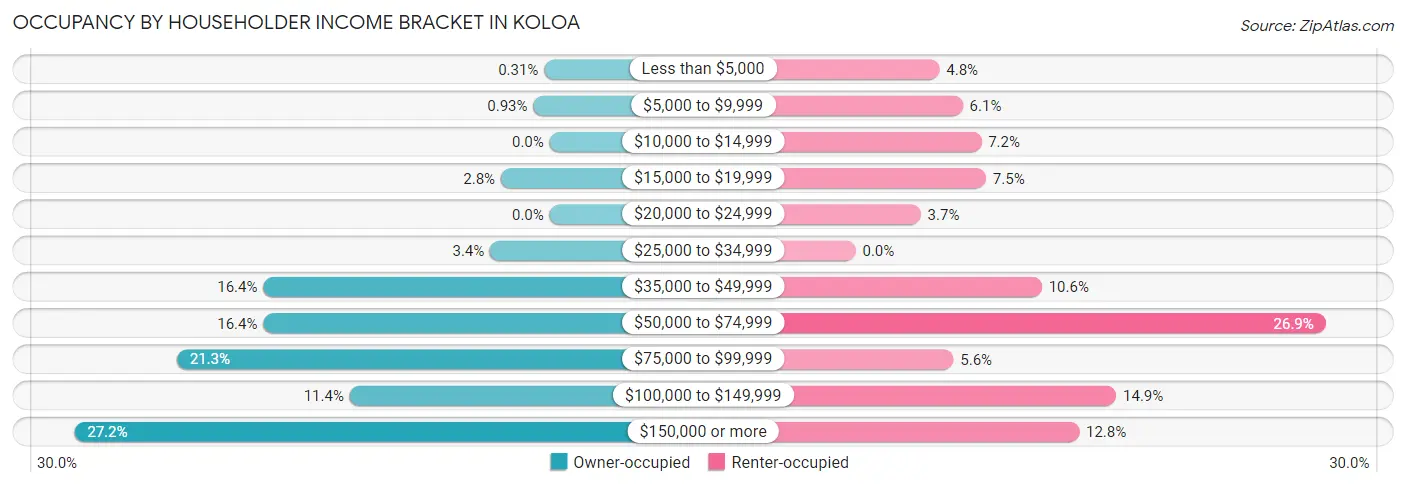
| Income Bracket | Owner-occupied | Renter-occupied |
| Less than $5,000 | 1 (0.3%) | 18 (4.8%) |
| $5,000 to $9,999 | 3 (0.9%) | 23 (6.1%) |
| $10,000 to $14,999 | 0 (0.0%) | 27 (7.2%) |
| $15,000 to $19,999 | 9 (2.8%) | 28 (7.4%) |
| $20,000 to $24,999 | 0 (0.0%) | 14 (3.7%) |
| $25,000 to $34,999 | 11 (3.4%) | 0 (0.0%) |
| $35,000 to $49,999 | 53 (16.4%) | 40 (10.6%) |
| $50,000 to $74,999 | 53 (16.4%) | 101 (26.9%) |
| $75,000 to $99,999 | 69 (21.3%) | 21 (5.6%) |
| $100,000 to $149,999 | 37 (11.4%) | 56 (14.9%) |
| $150,000 or more | 88 (27.2%) | 48 (12.8%) |
| Total | 324 (100.0%) | 376 (100.0%) |
Monthly Housing Cost Tiers in Koloa
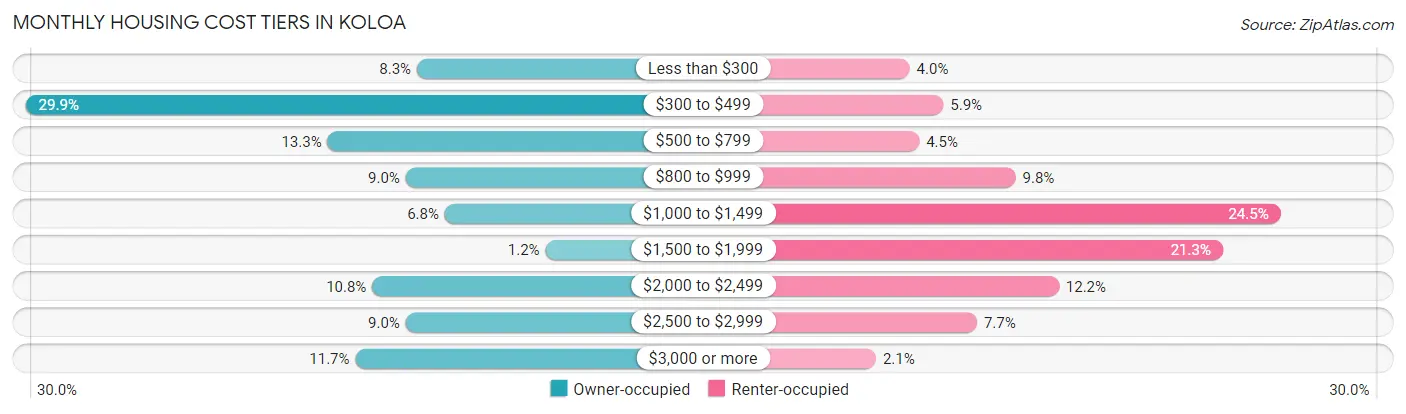
| Monthly Cost | Owner-occupied | Renter-occupied |
| Less than $300 | 27 (8.3%) | 15 (4.0%) |
| $300 to $499 | 97 (29.9%) | 22 (5.9%) |
| $500 to $799 | 43 (13.3%) | 17 (4.5%) |
| $800 to $999 | 29 (8.9%) | 37 (9.8%) |
| $1,000 to $1,499 | 22 (6.8%) | 92 (24.5%) |
| $1,500 to $1,999 | 4 (1.2%) | 80 (21.3%) |
| $2,000 to $2,499 | 35 (10.8%) | 46 (12.2%) |
| $2,500 to $2,999 | 29 (8.9%) | 29 (7.7%) |
| $3,000 or more | 38 (11.7%) | 8 (2.1%) |
| Total | 324 (100.0%) | 376 (100.0%) |
Physical Housing Characteristics in Koloa
Housing Structures in Koloa
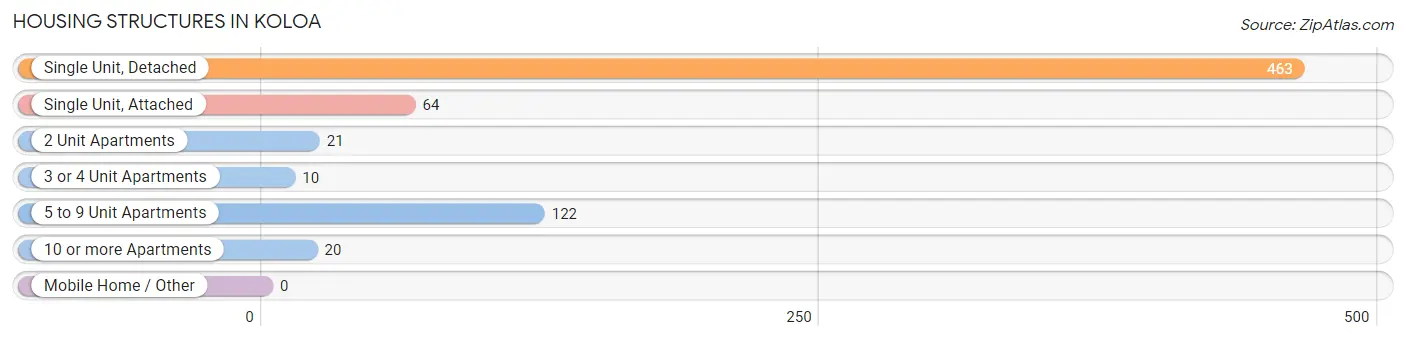
| Structure Type | # Housing Units | % Housing Units |
| Single Unit, Detached | 463 | 66.1% |
| Single Unit, Attached | 64 | 9.1% |
| 2 Unit Apartments | 21 | 3.0% |
| 3 or 4 Unit Apartments | 10 | 1.4% |
| 5 to 9 Unit Apartments | 122 | 17.4% |
| 10 or more Apartments | 20 | 2.9% |
| Mobile Home / Other | 0 | 0.0% |
| Total | 700 | 100.0% |
Housing Structures by Occupancy in Koloa
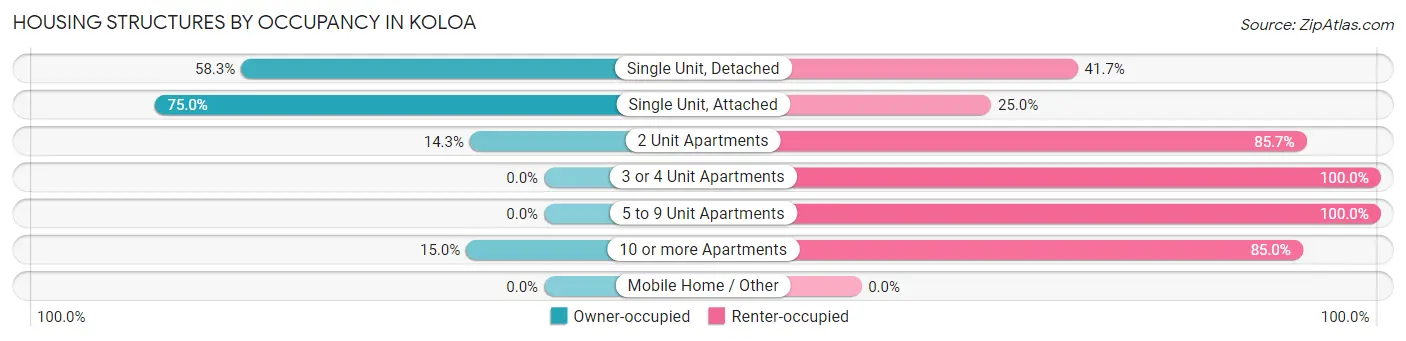
| Structure Type | Owner-occupied | Renter-occupied |
| Single Unit, Detached | 270 (58.3%) | 193 (41.7%) |
| Single Unit, Attached | 48 (75.0%) | 16 (25.0%) |
| 2 Unit Apartments | 3 (14.3%) | 18 (85.7%) |
| 3 or 4 Unit Apartments | 0 (0.0%) | 10 (100.0%) |
| 5 to 9 Unit Apartments | 0 (0.0%) | 122 (100.0%) |
| 10 or more Apartments | 3 (15.0%) | 17 (85.0%) |
| Mobile Home / Other | 0 (0.0%) | 0 (0.0%) |
| Total | 324 (46.3%) | 376 (53.7%) |
Housing Structures by Number of Rooms in Koloa
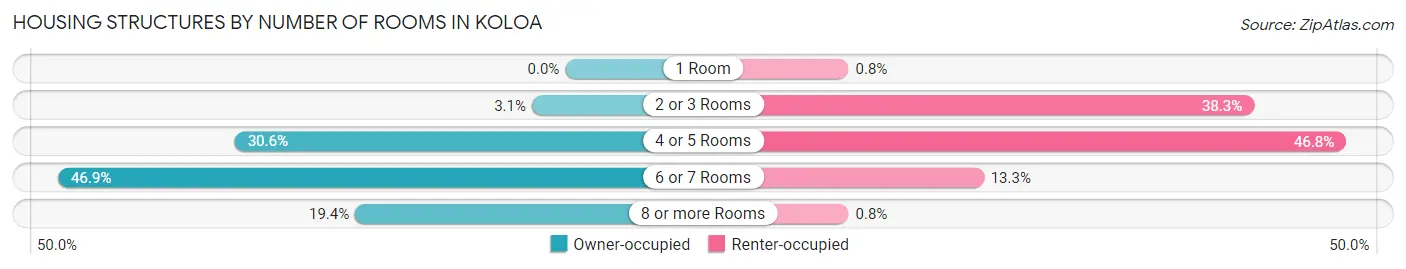
| Number of Rooms | Owner-occupied | Renter-occupied |
| 1 Room | 0 (0.0%) | 3 (0.8%) |
| 2 or 3 Rooms | 10 (3.1%) | 144 (38.3%) |
| 4 or 5 Rooms | 99 (30.6%) | 176 (46.8%) |
| 6 or 7 Rooms | 152 (46.9%) | 50 (13.3%) |
| 8 or more Rooms | 63 (19.4%) | 3 (0.8%) |
| Total | 324 (100.0%) | 376 (100.0%) |
Housing Structure by Heating Type in Koloa
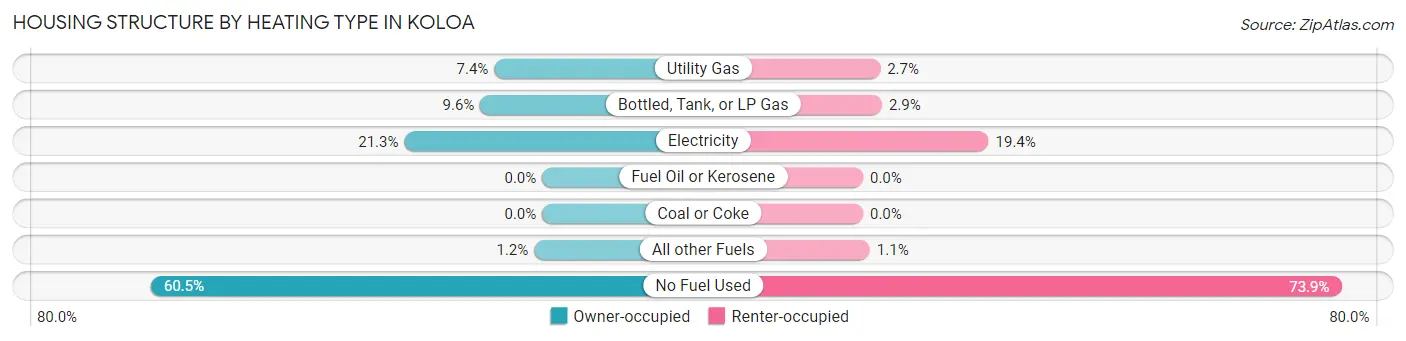
| Heating Type | Owner-occupied | Renter-occupied |
| Utility Gas | 24 (7.4%) | 10 (2.7%) |
| Bottled, Tank, or LP Gas | 31 (9.6%) | 11 (2.9%) |
| Electricity | 69 (21.3%) | 73 (19.4%) |
| Fuel Oil or Kerosene | 0 (0.0%) | 0 (0.0%) |
| Coal or Coke | 0 (0.0%) | 0 (0.0%) |
| All other Fuels | 4 (1.2%) | 4 (1.1%) |
| No Fuel Used | 196 (60.5%) | 278 (73.9%) |
| Total | 324 (100.0%) | 376 (100.0%) |
Household Vehicle Usage in Koloa
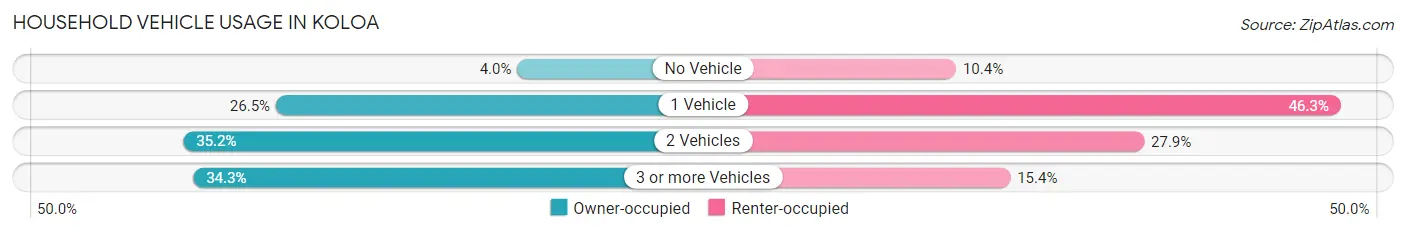
| Vehicles per Household | Owner-occupied | Renter-occupied |
| No Vehicle | 13 (4.0%) | 39 (10.4%) |
| 1 Vehicle | 86 (26.5%) | 174 (46.3%) |
| 2 Vehicles | 114 (35.2%) | 105 (27.9%) |
| 3 or more Vehicles | 111 (34.3%) | 58 (15.4%) |
| Total | 324 (100.0%) | 376 (100.0%) |
Real Estate & Mortgages in Koloa
Real Estate and Mortgage Overview in Koloa
| Characteristic | Without Mortgage | With Mortgage |
| Housing Units | 183 | 141 |
| Median Property Value | $693,000 | $834,000 |
| Median Household Income | $62,813 | $58 |
| Monthly Housing Costs | $416 | $38 |
| Real Estate Taxes | $1,130 | $4 |
Property Value by Mortgage Status in Koloa
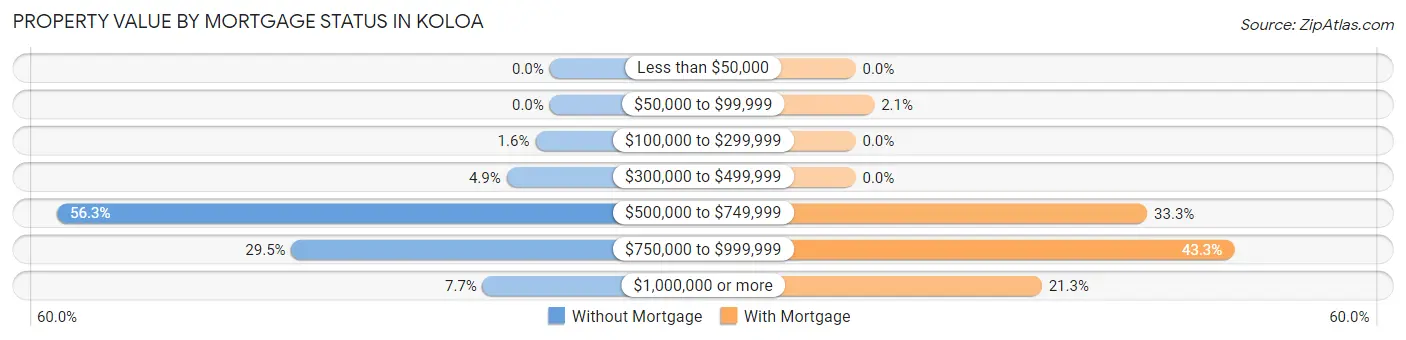
| Property Value | Without Mortgage | With Mortgage |
| Less than $50,000 | 0 (0.0%) | 0 (0.0%) |
| $50,000 to $99,999 | 0 (0.0%) | 3 (2.1%) |
| $100,000 to $299,999 | 3 (1.6%) | 0 (0.0%) |
| $300,000 to $499,999 | 9 (4.9%) | 0 (0.0%) |
| $500,000 to $749,999 | 103 (56.3%) | 47 (33.3%) |
| $750,000 to $999,999 | 54 (29.5%) | 61 (43.3%) |
| $1,000,000 or more | 14 (7.6%) | 30 (21.3%) |
| Total | 183 (100.0%) | 141 (100.0%) |
Household Income by Mortgage Status in Koloa
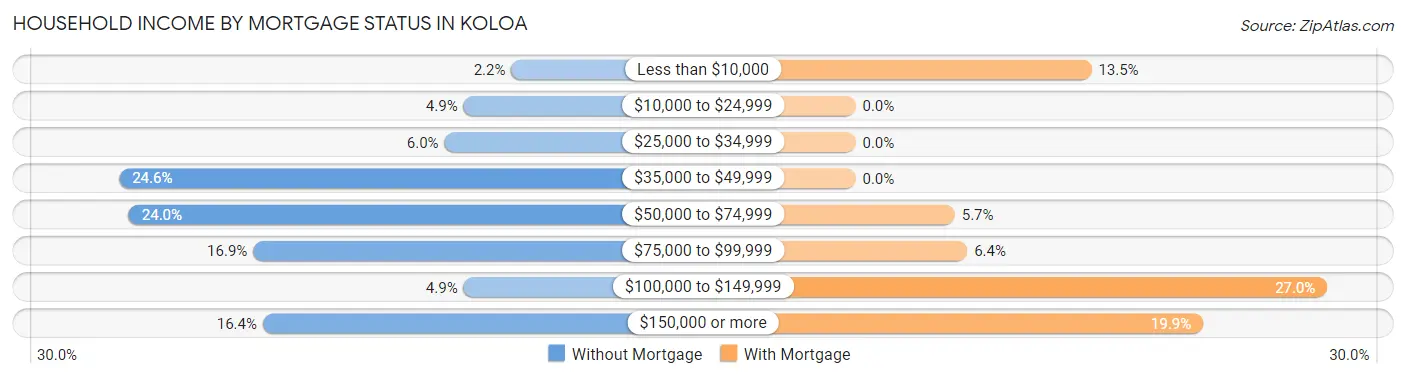
| Household Income | Without Mortgage | With Mortgage |
| Less than $10,000 | 4 (2.2%) | 19 (13.5%) |
| $10,000 to $24,999 | 9 (4.9%) | 0 (0.0%) |
| $25,000 to $34,999 | 11 (6.0%) | 0 (0.0%) |
| $35,000 to $49,999 | 45 (24.6%) | 0 (0.0%) |
| $50,000 to $74,999 | 44 (24.0%) | 8 (5.7%) |
| $75,000 to $99,999 | 31 (16.9%) | 9 (6.4%) |
| $100,000 to $149,999 | 9 (4.9%) | 38 (27.0%) |
| $150,000 or more | 30 (16.4%) | 28 (19.9%) |
| Total | 183 (100.0%) | 141 (100.0%) |
Property Value to Household Income Ratio in Koloa
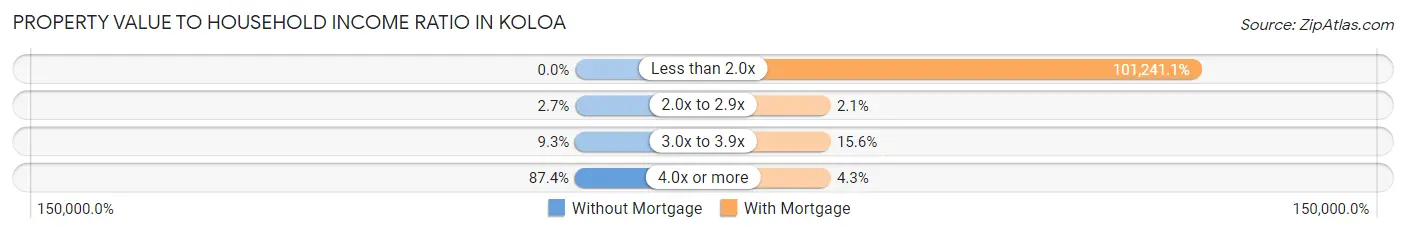
| Value-to-Income Ratio | Without Mortgage | With Mortgage |
| Less than 2.0x | 0 (0.0%) | 142,750 (101,241.1%) |
| 2.0x to 2.9x | 5 (2.7%) | 3 (2.1%) |
| 3.0x to 3.9x | 17 (9.3%) | 22 (15.6%) |
| 4.0x or more | 160 (87.4%) | 6 (4.3%) |
| Total | 183 (100.0%) | 141 (100.0%) |
Real Estate Taxes by Mortgage Status in Koloa
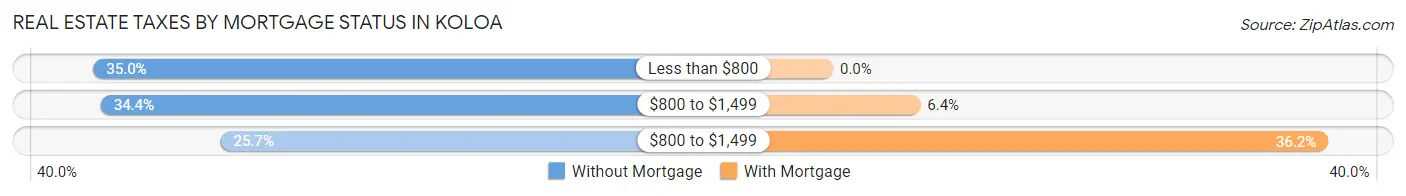
| Property Taxes | Without Mortgage | With Mortgage |
| Less than $800 | 64 (35.0%) | 0 (0.0%) |
| $800 to $1,499 | 63 (34.4%) | 9 (6.4%) |
| $800 to $1,499 | 47 (25.7%) | 51 (36.2%) |
| Total | 183 (100.0%) | 141 (100.0%) |
Health & Disability in Koloa
Health Insurance Coverage by Age in Koloa
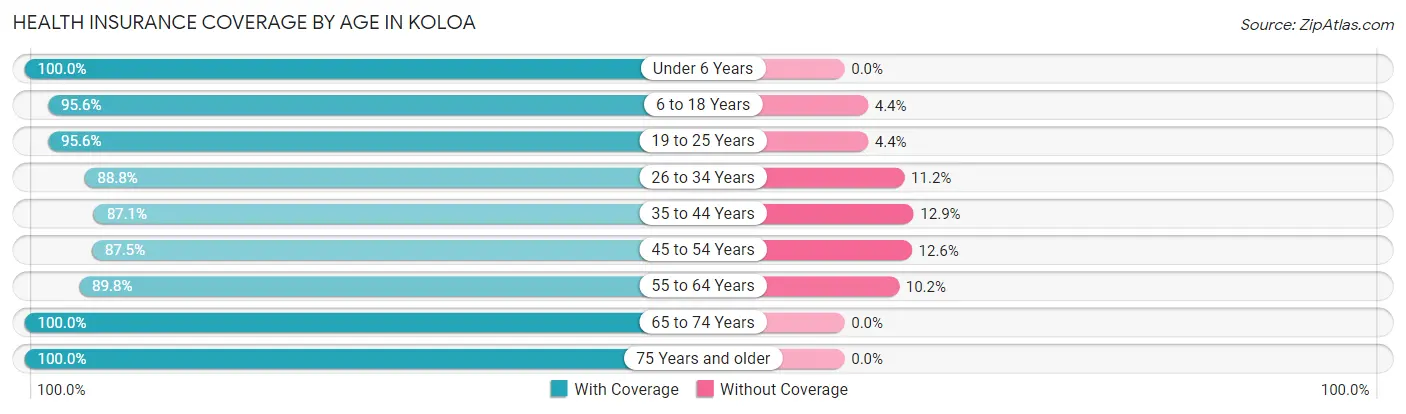
| Age Bracket | With Coverage | Without Coverage |
| Under 6 Years | 181 (100.0%) | 0 (0.0%) |
| 6 to 18 Years | 437 (95.6%) | 20 (4.4%) |
| 19 to 25 Years | 109 (95.6%) | 5 (4.4%) |
| 26 to 34 Years | 191 (88.8%) | 24 (11.2%) |
| 35 to 44 Years | 277 (87.1%) | 41 (12.9%) |
| 45 to 54 Years | 223 (87.5%) | 32 (12.6%) |
| 55 to 64 Years | 230 (89.8%) | 26 (10.2%) |
| 65 to 74 Years | 244 (100.0%) | 0 (0.0%) |
| 75 Years and older | 189 (100.0%) | 0 (0.0%) |
| Total | 2,081 (93.4%) | 148 (6.6%) |
Health Insurance Coverage by Citizenship Status in Koloa
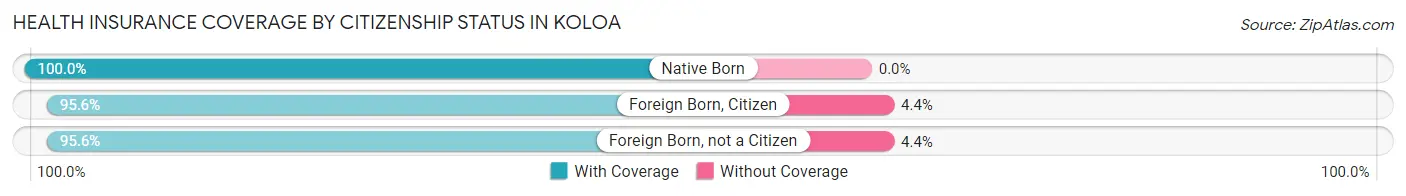
| Citizenship Status | With Coverage | Without Coverage |
| Native Born | 181 (100.0%) | 0 (0.0%) |
| Foreign Born, Citizen | 437 (95.6%) | 20 (4.4%) |
| Foreign Born, not a Citizen | 109 (95.6%) | 5 (4.4%) |
Health Insurance Coverage by Household Income in Koloa
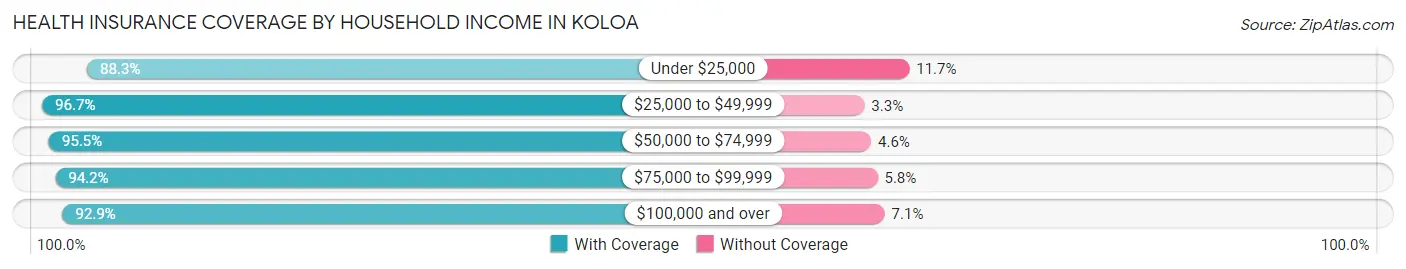
| Household Income | With Coverage | Without Coverage |
| Under $25,000 | 196 (88.3%) | 26 (11.7%) |
| $25,000 to $49,999 | 176 (96.7%) | 6 (3.3%) |
| $50,000 to $74,999 | 315 (95.5%) | 15 (4.5%) |
| $75,000 to $99,999 | 327 (94.2%) | 20 (5.8%) |
| $100,000 and over | 1,061 (92.9%) | 81 (7.1%) |
Public vs Private Health Insurance Coverage by Age in Koloa
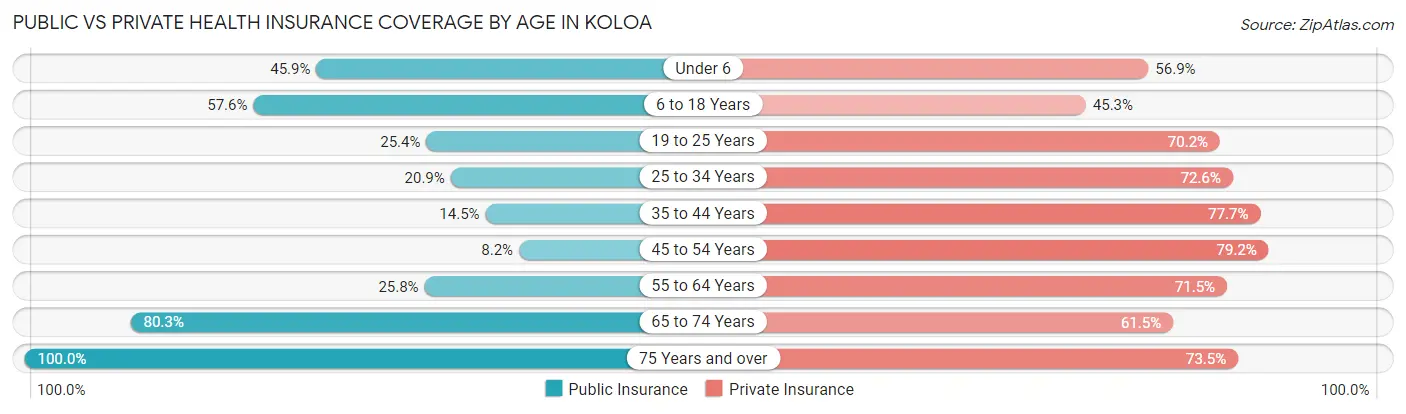
| Age Bracket | Public Insurance | Private Insurance |
| Under 6 | 83 (45.9%) | 103 (56.9%) |
| 6 to 18 Years | 263 (57.6%) | 207 (45.3%) |
| 19 to 25 Years | 29 (25.4%) | 80 (70.2%) |
| 25 to 34 Years | 45 (20.9%) | 156 (72.6%) |
| 35 to 44 Years | 46 (14.5%) | 247 (77.7%) |
| 45 to 54 Years | 21 (8.2%) | 202 (79.2%) |
| 55 to 64 Years | 66 (25.8%) | 183 (71.5%) |
| 65 to 74 Years | 196 (80.3%) | 150 (61.5%) |
| 75 Years and over | 189 (100.0%) | 139 (73.5%) |
| Total | 938 (42.1%) | 1,467 (65.8%) |
Disability Status by Sex by Age in Koloa
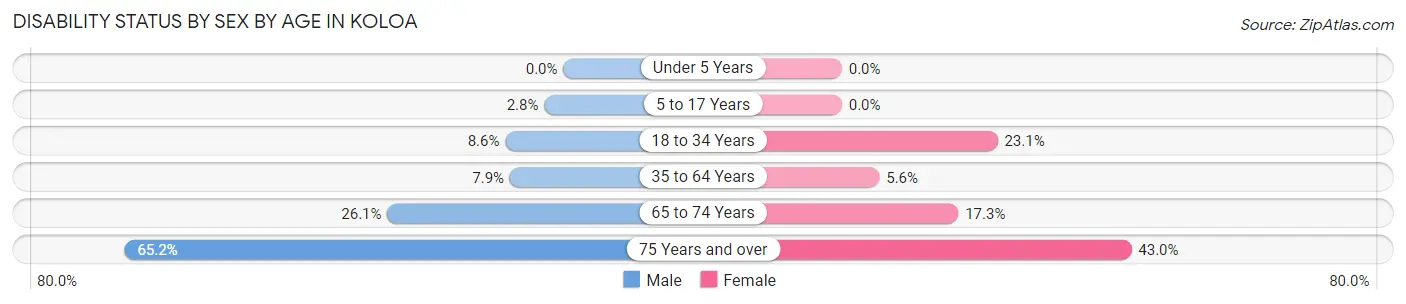
| Age Bracket | Male | Female |
| Under 5 Years | 0 (0.0%) | 0 (0.0%) |
| 5 to 17 Years | 6 (2.8%) | 0 (0.0%) |
| 18 to 34 Years | 15 (8.6%) | 43 (23.1%) |
| 35 to 64 Years | 33 (7.9%) | 23 (5.6%) |
| 65 to 74 Years | 29 (26.1%) | 23 (17.3%) |
| 75 Years and over | 58 (65.2%) | 43 (43.0%) |
Disability Class by Sex by Age in Koloa
Disability Class: Hearing Difficulty
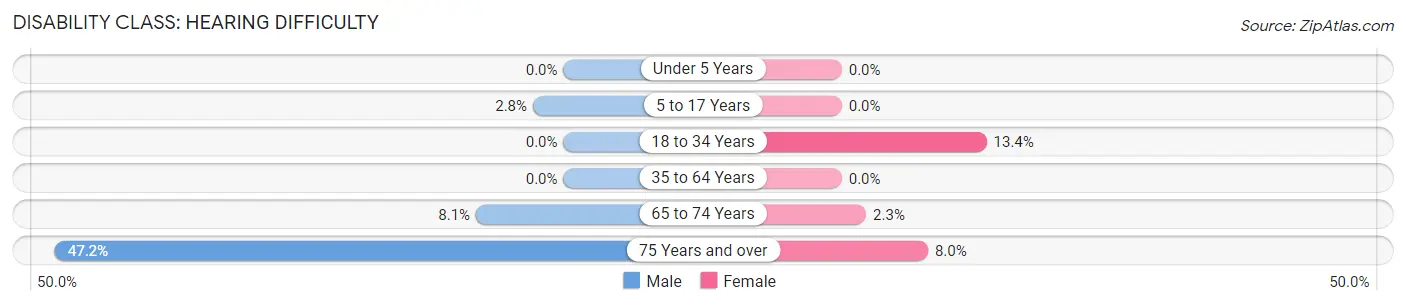
| Age Bracket | Male | Female |
| Under 5 Years | 0 (0.0%) | 0 (0.0%) |
| 5 to 17 Years | 6 (2.8%) | 0 (0.0%) |
| 18 to 34 Years | 0 (0.0%) | 25 (13.4%) |
| 35 to 64 Years | 0 (0.0%) | 0 (0.0%) |
| 65 to 74 Years | 9 (8.1%) | 3 (2.3%) |
| 75 Years and over | 42 (47.2%) | 8 (8.0%) |
Disability Class: Vision Difficulty
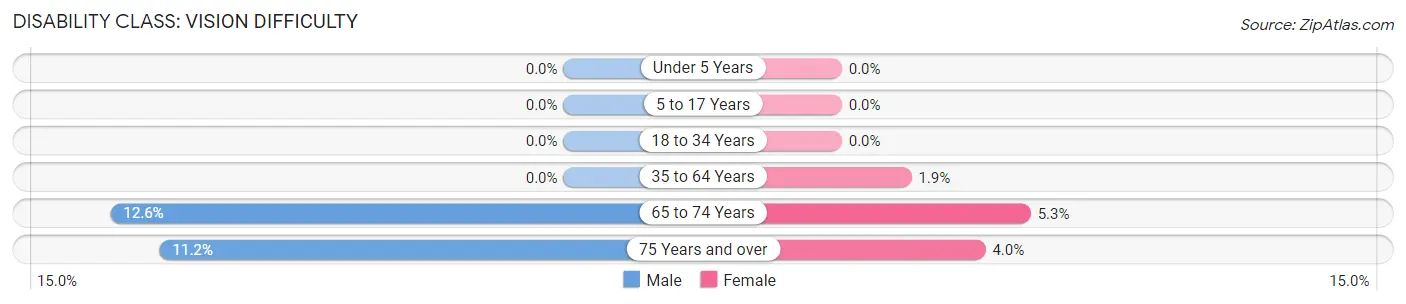
| Age Bracket | Male | Female |
| Under 5 Years | 0 (0.0%) | 0 (0.0%) |
| 5 to 17 Years | 0 (0.0%) | 0 (0.0%) |
| 18 to 34 Years | 0 (0.0%) | 0 (0.0%) |
| 35 to 64 Years | 0 (0.0%) | 8 (1.9%) |
| 65 to 74 Years | 14 (12.6%) | 7 (5.3%) |
| 75 Years and over | 10 (11.2%) | 4 (4.0%) |
Disability Class: Cognitive Difficulty
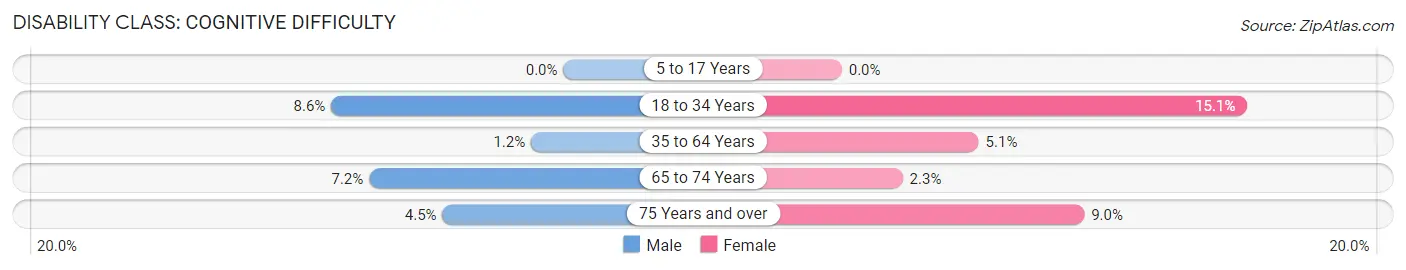
| Age Bracket | Male | Female |
| 5 to 17 Years | 0 (0.0%) | 0 (0.0%) |
| 18 to 34 Years | 15 (8.6%) | 28 (15.0%) |
| 35 to 64 Years | 5 (1.2%) | 21 (5.1%) |
| 65 to 74 Years | 8 (7.2%) | 3 (2.3%) |
| 75 Years and over | 4 (4.5%) | 9 (9.0%) |
Disability Class: Ambulatory Difficulty
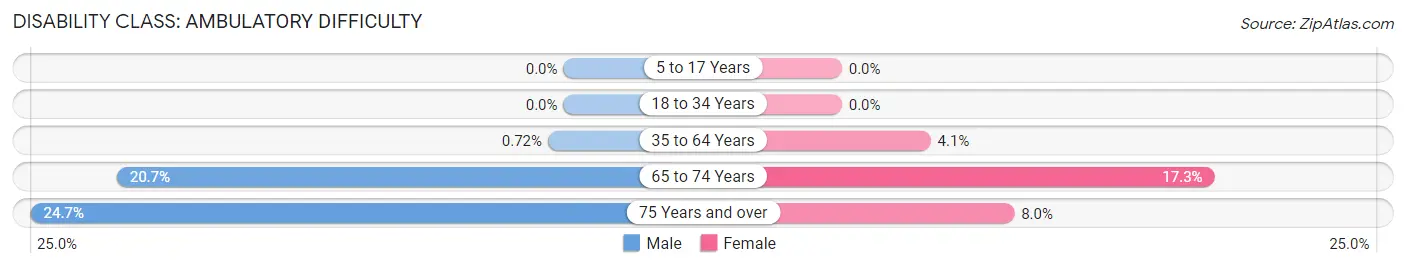
| Age Bracket | Male | Female |
| 5 to 17 Years | 0 (0.0%) | 0 (0.0%) |
| 18 to 34 Years | 0 (0.0%) | 0 (0.0%) |
| 35 to 64 Years | 3 (0.7%) | 17 (4.1%) |
| 65 to 74 Years | 23 (20.7%) | 23 (17.3%) |
| 75 Years and over | 22 (24.7%) | 8 (8.0%) |
Disability Class: Self-Care Difficulty
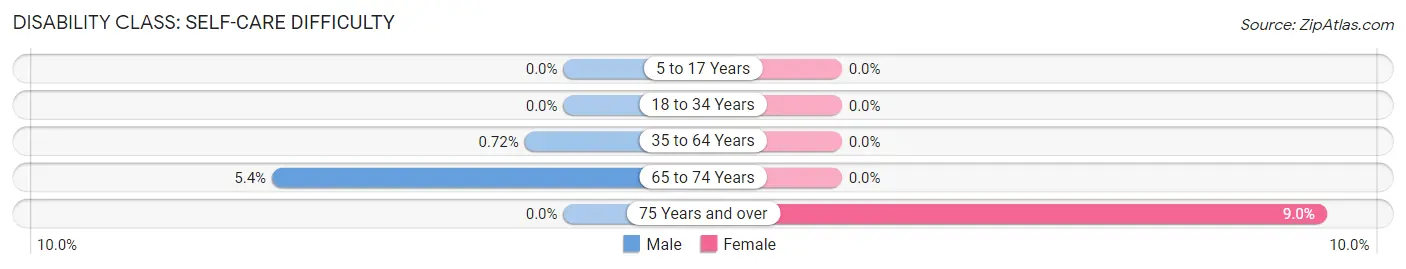
| Age Bracket | Male | Female |
| 5 to 17 Years | 0 (0.0%) | 0 (0.0%) |
| 18 to 34 Years | 0 (0.0%) | 0 (0.0%) |
| 35 to 64 Years | 3 (0.7%) | 0 (0.0%) |
| 65 to 74 Years | 6 (5.4%) | 0 (0.0%) |
| 75 Years and over | 0 (0.0%) | 9 (9.0%) |
Technology Access in Koloa
Computing Device Access in Koloa
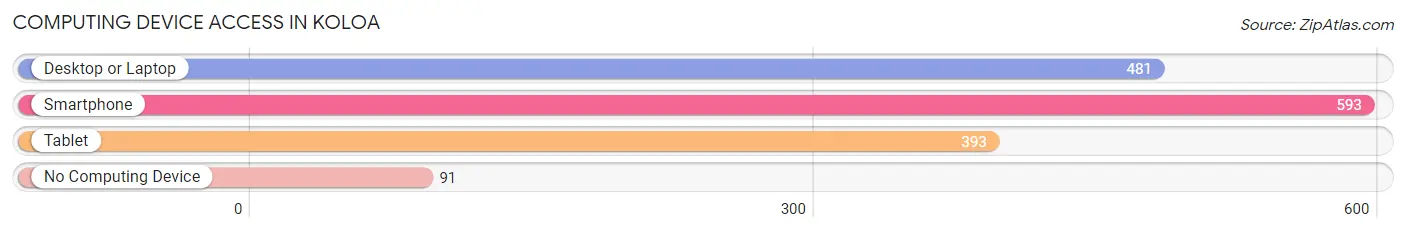
| Device Type | # Households | % Households |
| Desktop or Laptop | 481 | 68.7% |
| Smartphone | 593 | 84.7% |
| Tablet | 393 | 56.1% |
| No Computing Device | 91 | 13.0% |
| Total | 700 | 100.0% |
Internet Access in Koloa
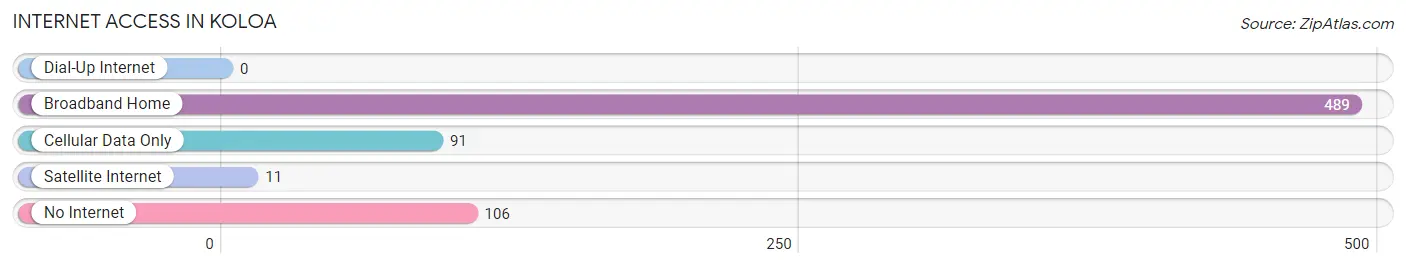
| Internet Type | # Households | % Households |
| Dial-Up Internet | 0 | 0.0% |
| Broadband Home | 489 | 69.9% |
| Cellular Data Only | 91 | 13.0% |
| Satellite Internet | 11 | 1.6% |
| No Internet | 106 | 15.1% |
| Total | 700 | 100.0% |
Koloa Summary
Koloa is a census-designated place (CDP) located in Kauai County, Hawaii, United States. The population was 2,099 at the 2010 census. Koloa is located on the south shore of the island of Kauai, and is the site of the first sugar plantation in the Hawaiian Islands.
Geography
Koloa is located at 21°53'25" North, 159°30'25" West (21.890278, -159.506944). According to the United States Census Bureau, the CDP has a total area of 2.2 square miles (5.7 km2), all of it land.
History
Koloa was the site of the first sugar plantation in the Hawaiian Islands. The first sugar mill was built in 1835 by Ladd & Co., a partnership between William Ladd and the British firm of William and Henry Alexander. The plantation was initially successful, but eventually went bankrupt in 1848. The plantation was then taken over by the Koloa Sugar Company, which was founded in 1849. The company was successful and eventually became the largest sugar producer in the Hawaiian Islands.
The plantation was eventually sold to C. Brewer & Co. in 1900, and the company continued to operate the plantation until it was closed in 1996. The plantation was then converted into a shopping center, which opened in 1998.
Economy
Koloa is home to several businesses, including a shopping center, a golf course, and several restaurants. The shopping center includes a grocery store, a drug store, and several clothing stores. The golf course is the Poipu Bay Golf Course, which is a championship golf course designed by Robert Trent Jones, Jr.
The economy of Koloa is largely based on tourism. The area is home to several resorts, including the Grand Hyatt Kauai Resort and Spa, the Sheraton Kauai Resort, and the Marriott's Waiohai Beach Club. The area is also home to several beaches, including Poipu Beach, which is one of the most popular beaches in Hawaii.
Demographics
As of the census of 2000, there were 2,099 people, 845 households, and 545 families residing in the CDP. The population density was 945.3 people per square mile (364.7/km2). There were 945 housing units at an average density of 425.3 per square mile (164.2/km2). The racial makeup of the CDP was 44.2% White, 0.7% African American, 0.4% Native American, 28.2% Asian, 8.2% Pacific Islander, 0.7% from other races, and 17.0% from two or more races. Hispanic or Latino of any race were 6.2% of the population.
There were 845 households, out of which 28.2% had children under the age of 18 living with them, 48.2% were married couples living together, 11.2% had a female householder with no husband present, and 36.2% were non-families. 28.2% of all households were made up of individuals, and 8.2% had someone living alone who was 65 years of age or older. The average household size was 2.48 and the average family size was 3.06.
In the CDP, the population was spread out, with 24.2% under the age of 18, 6.2% from 18 to 24, 28.2% from 25 to 44, 28.2% from 45 to 64, and 13.2% who were 65 years of age or older. The median age was 40 years. For every 100 females, there were 97.2 males. For every 100 females age 18 and over, there were 95.2 males.
The median income for a household in the CDP was $50,000, and the median income for a family was $56,250. Males had a median income of $36,250 versus $30,000 for females. The per capita income for the CDP was $25,000. About 5.2% of families and 8.2% of the population were below the poverty line, including 8.2% of those under age 18 and none of those age 65 or over.
Common Questions
What is Per Capita Income in Koloa?
Per Capita income in Koloa is $33,917.
What is the Median Family Income in Koloa?
Median Family Income in Koloa is $87,000.
What is the Median Household income in Koloa?
Median Household Income in Koloa is $72,143.
What is Income or Wage Gap in Koloa?
Income or Wage Gap in Koloa is 22.0%.
Women in Koloa earn 78.0 cents for every dollar earned by a man.
What is Inequality or Gini Index in Koloa?
Inequality or Gini Index in Koloa is 0.44.
What is the Total Population of Koloa?
Total Population of Koloa is 2,281.
What is the Total Male Population of Koloa?
Total Male Population of Koloa is 1,091.
What is the Total Female Population of Koloa?
Total Female Population of Koloa is 1,190.
What is the Ratio of Males per 100 Females in Koloa?
There are 91.68 Males per 100 Females in Koloa.
What is the Ratio of Females per 100 Males in Koloa?
There are 109.07 Females per 100 Males in Koloa.
What is the Median Population Age in Koloa?
Median Population Age in Koloa is 38.2 Years.
What is the Average Family Size in Koloa
Average Family Size in Koloa is 4.0 People.
What is the Average Household Size in Koloa
Average Household Size in Koloa is 3.2 People.
How Large is the Labor Force in Koloa?
There are 1,183 People in the Labor Forcein in Koloa.
What is the Percentage of People in the Labor Force in Koloa?
68.4% of People are in the Labor Force in Koloa.
What is the Unemployment Rate in Koloa?
Unemployment Rate in Koloa is 9.5%.