Waimanalo Beach, HI Map & Demographics
Waimanalo Beach Map
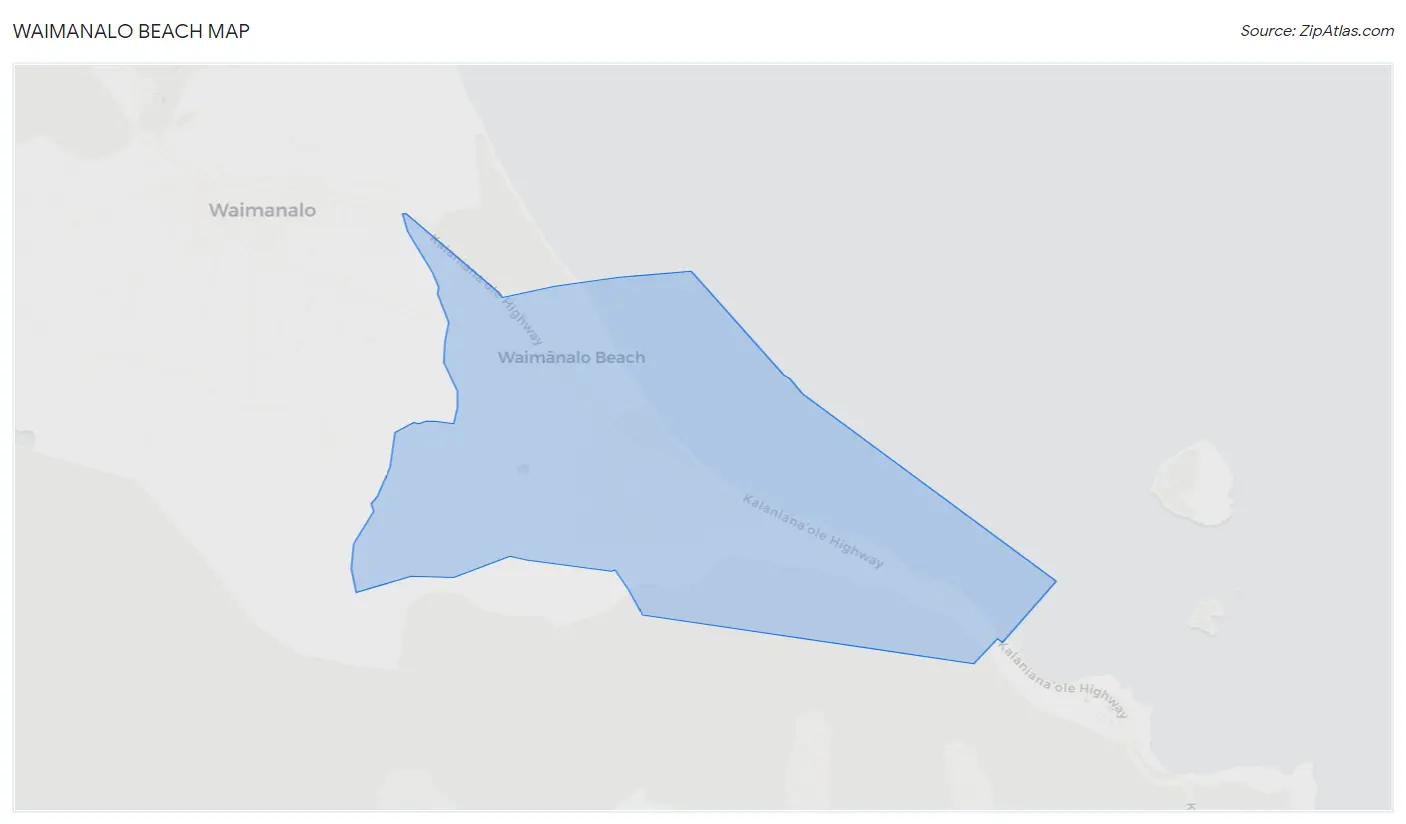
Waimanalo Beach Overview
$37,482
PER CAPITA INCOME
$117,969
AVG FAMILY INCOME
$104,643
AVG HOUSEHOLD INCOME
1.4%
WAGE / INCOME GAP [ % ]
98.6¢/ $1
WAGE / INCOME GAP [ $ ]
0.46
INEQUALITY / GINI INDEX
4,475
TOTAL POPULATION
2,215
MALE POPULATION
2,260
FEMALE POPULATION
98.01
MALES / 100 FEMALES
102.03
FEMALES / 100 MALES
46.5
MEDIAN AGE
4.2
AVG FAMILY SIZE
3.9
AVG HOUSEHOLD SIZE
2,161
LABOR FORCE [ PEOPLE ]
58.1%
PERCENT IN LABOR FORCE
4.8%
UNEMPLOYMENT RATE
Income in Waimanalo Beach
Income Overview in Waimanalo Beach
Per Capita Income in Waimanalo Beach is $37,482, while median incomes of families and households are $117,969 and $104,643 respectively.
| Characteristic | Number | Measure |
| Per Capita Income | 4,475 | $37,482 |
| Median Family Income | 944 | $117,969 |
| Mean Family Income | 944 | $150,378 |
| Median Household Income | 1,146 | $104,643 |
| Mean Household Income | 1,146 | $144,606 |
| Income Deficit | 944 | $0 |
| Wage / Income Gap (%) | 4,475 | 1.43% |
| Wage / Income Gap ($) | 4,475 | 98.57¢ per $1 |
| Gini / Inequality Index | 4,475 | 0.46 |
Earnings by Sex in Waimanalo Beach
Average Earnings in Waimanalo Beach are $41,707, $42,031 for men and $41,429 for women, a difference of 1.4%.
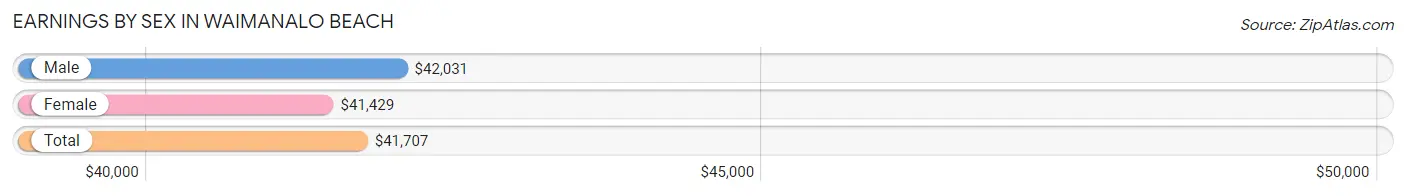
| Sex | Number | Average Earnings |
| Male | 1,218 (54.4%) | $42,031 |
| Female | 1,022 (45.6%) | $41,429 |
| Total | 2,240 (100.0%) | $41,707 |
Earnings by Sex by Income Bracket in Waimanalo Beach
The most common earnings brackets in Waimanalo Beach are $100,000+ for men (184 | 15.1%) and $35,000 to $39,999 for women (94 | 9.2%).
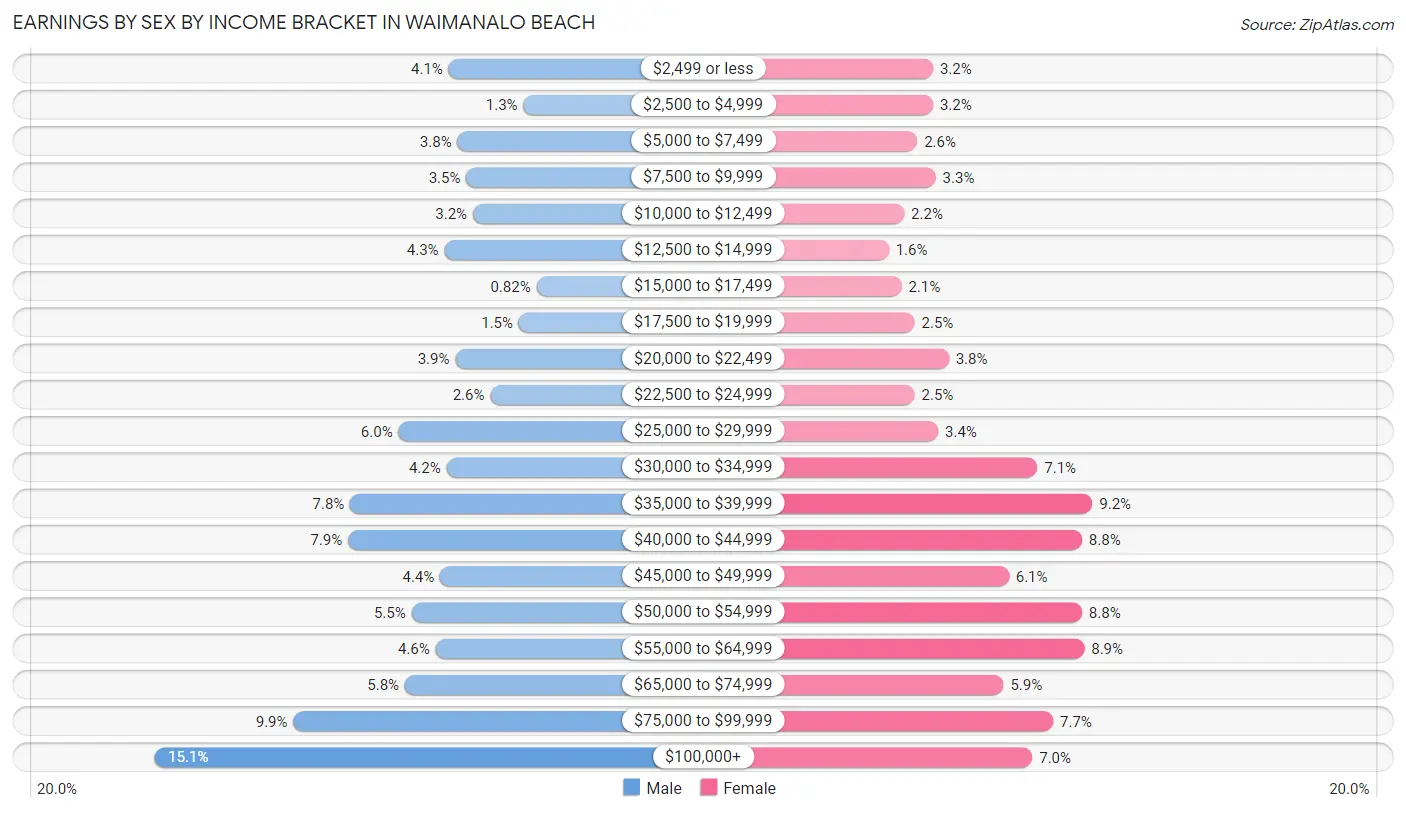
| Income | Male | Female |
| $2,499 or less | 50 (4.1%) | 33 (3.2%) |
| $2,500 to $4,999 | 16 (1.3%) | 33 (3.2%) |
| $5,000 to $7,499 | 46 (3.8%) | 27 (2.6%) |
| $7,500 to $9,999 | 42 (3.5%) | 34 (3.3%) |
| $10,000 to $12,499 | 39 (3.2%) | 22 (2.1%) |
| $12,500 to $14,999 | 52 (4.3%) | 16 (1.6%) |
| $15,000 to $17,499 | 10 (0.8%) | 21 (2.1%) |
| $17,500 to $19,999 | 18 (1.5%) | 26 (2.5%) |
| $20,000 to $22,499 | 47 (3.9%) | 39 (3.8%) |
| $22,500 to $24,999 | 31 (2.5%) | 26 (2.5%) |
| $25,000 to $29,999 | 73 (6.0%) | 35 (3.4%) |
| $30,000 to $34,999 | 51 (4.2%) | 73 (7.1%) |
| $35,000 to $39,999 | 95 (7.8%) | 94 (9.2%) |
| $40,000 to $44,999 | 96 (7.9%) | 90 (8.8%) |
| $45,000 to $49,999 | 54 (4.4%) | 62 (6.1%) |
| $50,000 to $54,999 | 67 (5.5%) | 90 (8.8%) |
| $55,000 to $64,999 | 56 (4.6%) | 91 (8.9%) |
| $65,000 to $74,999 | 70 (5.8%) | 60 (5.9%) |
| $75,000 to $99,999 | 121 (9.9%) | 79 (7.7%) |
| $100,000+ | 184 (15.1%) | 71 (7.0%) |
| Total | 1,218 (100.0%) | 1,022 (100.0%) |
Earnings by Sex by Educational Attainment in Waimanalo Beach
Average earnings in Waimanalo Beach are $46,776 for men and $43,750 for women, a difference of 6.5%. Men with an educational attainment of bachelor's degree enjoy the highest average annual earnings of $68,403, while those with high school diploma education earn the least with $43,629. Women with an educational attainment of less than high school earn the most with the average annual earnings of $61,071, while those with high school diploma education have the smallest earnings of $37,946.
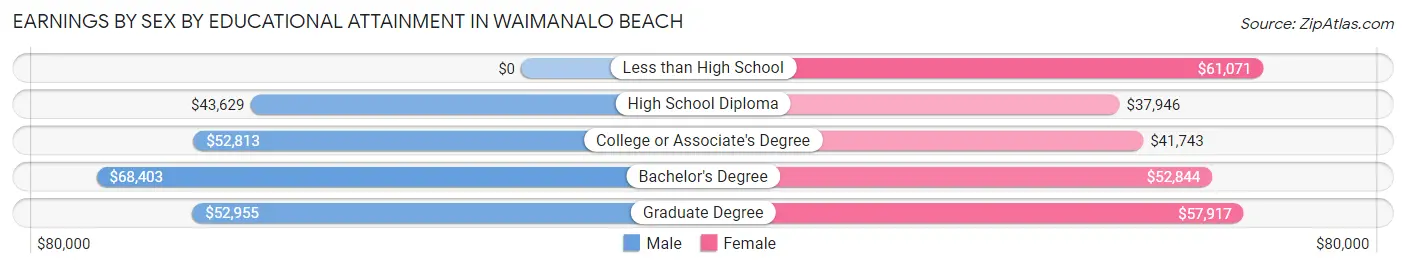
| Educational Attainment | Male Income | Female Income |
| Less than High School | - | - |
| High School Diploma | $43,629 | $37,946 |
| College or Associate's Degree | $52,813 | $41,743 |
| Bachelor's Degree | $68,403 | $52,844 |
| Graduate Degree | $52,955 | $57,917 |
| Total | $46,776 | $43,750 |
Family Income in Waimanalo Beach
Family Income Brackets in Waimanalo Beach
According to the Waimanalo Beach family income data, there are 205 families falling into the $200,000+ income range, which is the most common income bracket and makes up 21.7% of all families. Conversely, the $10,000 to $14,999 income bracket is the least frequent group with only 3 families (0.3%) belonging to this category.
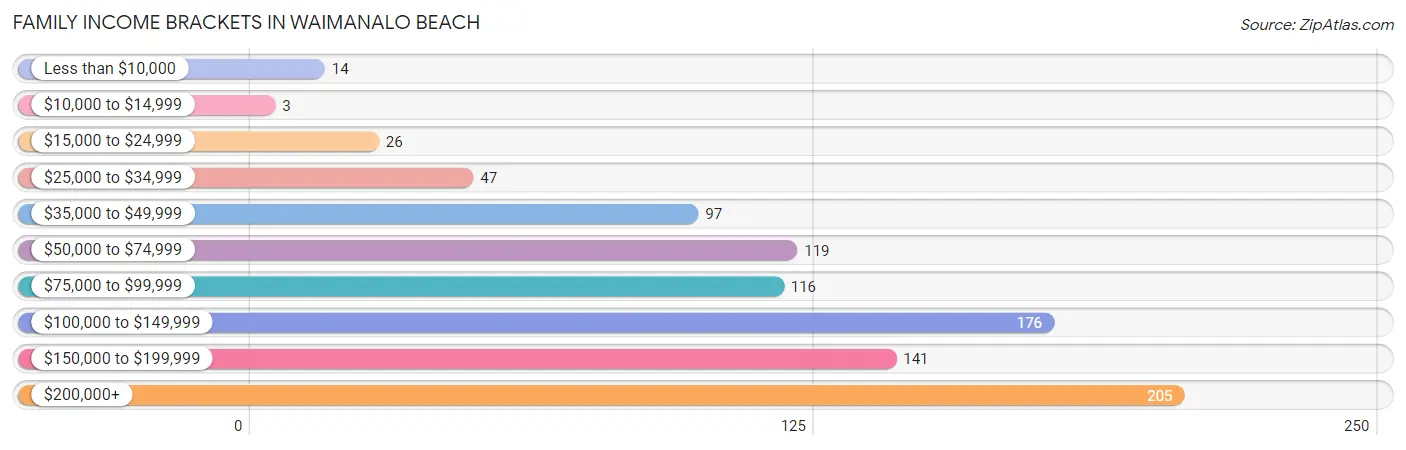
| Income Bracket | # Families | % Families |
| Less than $10,000 | 14 | 1.5% |
| $10,000 to $14,999 | 3 | 0.3% |
| $15,000 to $24,999 | 26 | 2.8% |
| $25,000 to $34,999 | 47 | 5.0% |
| $35,000 to $49,999 | 97 | 10.3% |
| $50,000 to $74,999 | 119 | 12.6% |
| $75,000 to $99,999 | 116 | 12.3% |
| $100,000 to $149,999 | 176 | 18.6% |
| $150,000 to $199,999 | 141 | 14.9% |
| $200,000+ | 205 | 21.7% |
Family Income by Famaliy Size in Waimanalo Beach
7+ person families (122 | 12.9%) account for the highest median family income in Waimanalo Beach with $181,250 per family, while 3-person families (154 | 16.3%) have the highest median income of $37,917 per family member.
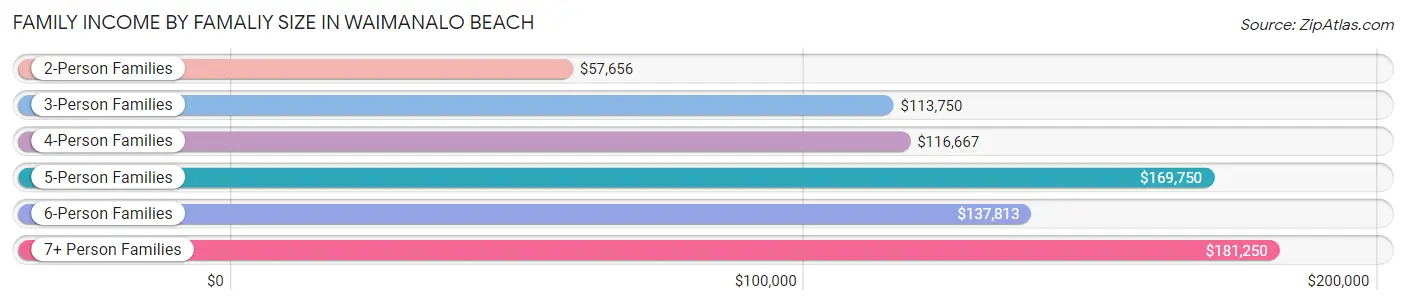
| Income Bracket | # Families | Median Income |
| 2-Person Families | 301 (31.9%) | $57,656 |
| 3-Person Families | 154 (16.3%) | $113,750 |
| 4-Person Families | 166 (17.6%) | $116,667 |
| 5-Person Families | 152 (16.1%) | $169,750 |
| 6-Person Families | 49 (5.2%) | $137,813 |
| 7+ Person Families | 122 (12.9%) | $181,250 |
| Total | 944 (100.0%) | $117,969 |
Family Income by Number of Earners in Waimanalo Beach
The median family income in Waimanalo Beach is $117,969, with families comprising 3+ earners (308) having the highest median family income of $181,250, while families with no earners (116) have the lowest median family income of $41,250, accounting for 32.6% and 12.3% of families, respectively.
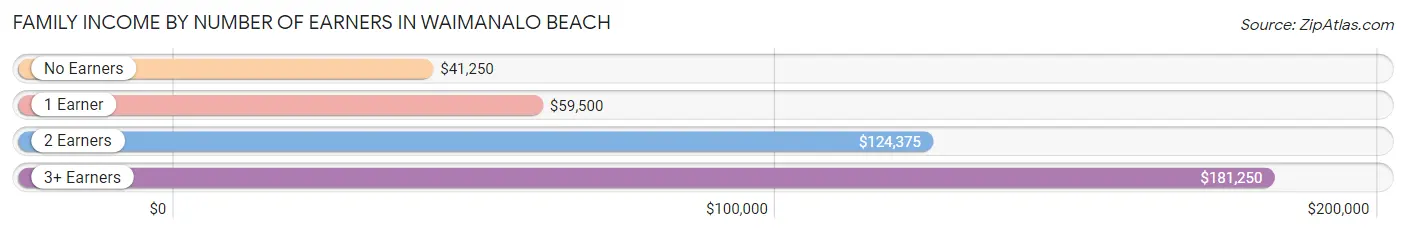
| Number of Earners | # Families | Median Income |
| No Earners | 116 (12.3%) | $41,250 |
| 1 Earner | 248 (26.3%) | $59,500 |
| 2 Earners | 272 (28.8%) | $124,375 |
| 3+ Earners | 308 (32.6%) | $181,250 |
| Total | 944 (100.0%) | $117,969 |
Household Income in Waimanalo Beach
Household Income Brackets in Waimanalo Beach
With 243 households falling in the category, the $200,000+ income range is the most frequent in Waimanalo Beach, accounting for 21.2% of all households. In contrast, only 6 households (0.5%) fall into the $10,000 to $14,999 income bracket, making it the least populous group.
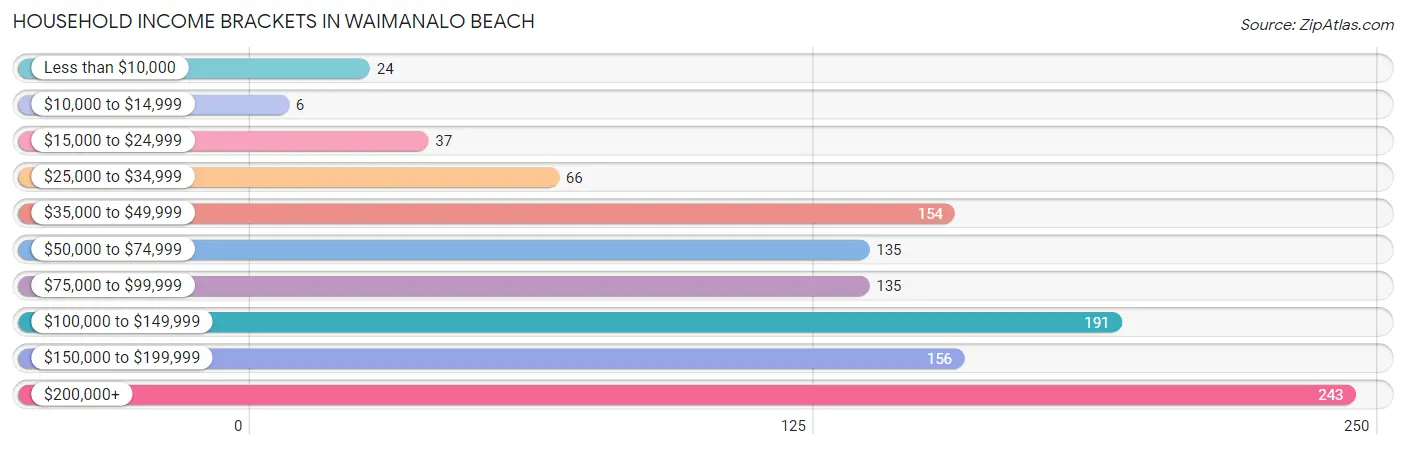
| Income Bracket | # Households | % Households |
| Less than $10,000 | 24 | 2.1% |
| $10,000 to $14,999 | 6 | 0.5% |
| $15,000 to $24,999 | 37 | 3.2% |
| $25,000 to $34,999 | 66 | 5.8% |
| $35,000 to $49,999 | 154 | 13.4% |
| $50,000 to $74,999 | 135 | 11.8% |
| $75,000 to $99,999 | 135 | 11.8% |
| $100,000 to $149,999 | 191 | 16.7% |
| $150,000 to $199,999 | 156 | 13.6% |
| $200,000+ | 243 | 21.2% |
Household Income by Householder Age in Waimanalo Beach
The median household income in Waimanalo Beach is $104,643, with the highest median household income of $140,625 found in the 45 to 64 years age bracket for the primary householder. A total of 430 households (37.5%) fall into this category. Meanwhile, the 15 to 24 years age bracket for the primary householder has the lowest median household income of $0, with 8 households (0.7%) in this group.
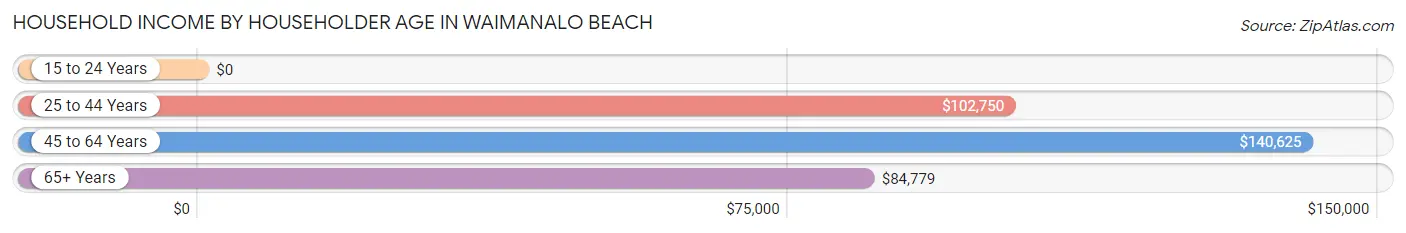
| Income Bracket | # Households | Median Income |
| 15 to 24 Years | 8 (0.7%) | $0 |
| 25 to 44 Years | 128 (11.2%) | $102,750 |
| 45 to 64 Years | 430 (37.5%) | $140,625 |
| 65+ Years | 580 (50.6%) | $84,779 |
| Total | 1,146 (100.0%) | $104,643 |
Poverty in Waimanalo Beach
Income Below Poverty by Sex and Age in Waimanalo Beach
With 5.6% poverty level for males and 6.9% for females among the residents of Waimanalo Beach, 6 to 11 year old males and 75 year old and over females are the most vulnerable to poverty, with 17 males (14.9%) and 70 females (18.0%) in their respective age groups living below the poverty level.
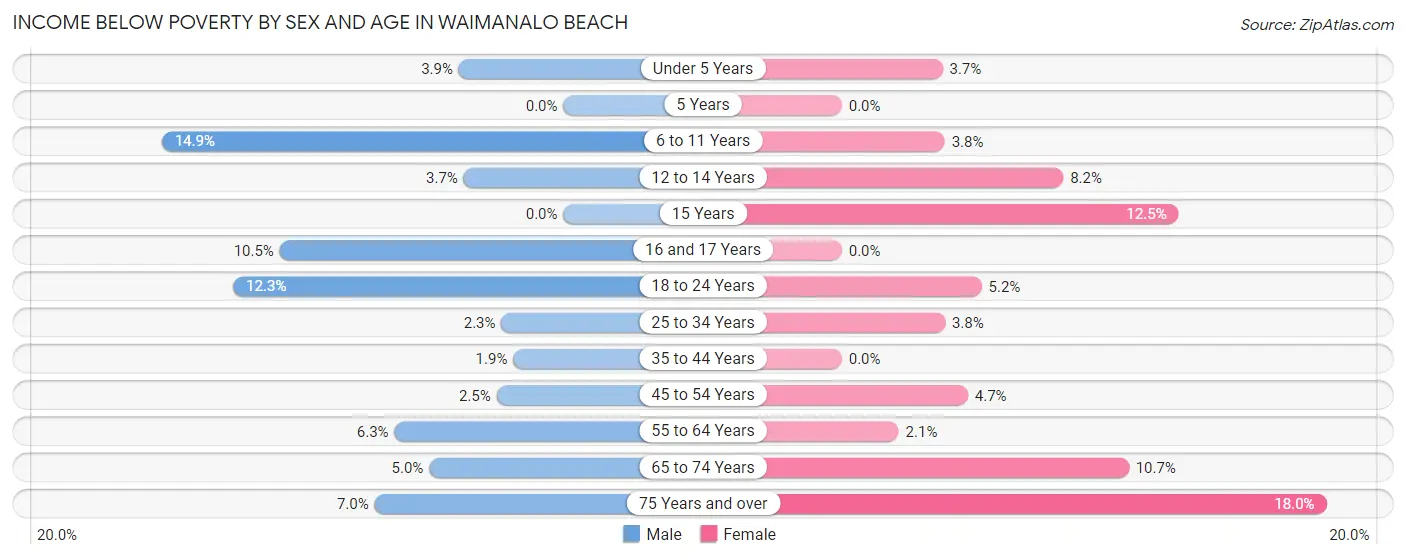
| Age Bracket | Male | Female |
| Under 5 Years | 4 (3.9%) | 4 (3.7%) |
| 5 Years | 0 (0.0%) | 0 (0.0%) |
| 6 to 11 Years | 17 (14.9%) | 5 (3.8%) |
| 12 to 14 Years | 4 (3.7%) | 6 (8.2%) |
| 15 Years | 0 (0.0%) | 4 (12.5%) |
| 16 and 17 Years | 8 (10.5%) | 0 (0.0%) |
| 18 to 24 Years | 26 (12.3%) | 8 (5.2%) |
| 25 to 34 Years | 6 (2.3%) | 7 (3.8%) |
| 35 to 44 Years | 4 (1.9%) | 0 (0.0%) |
| 45 to 54 Years | 8 (2.5%) | 13 (4.7%) |
| 55 to 64 Years | 19 (6.3%) | 6 (2.1%) |
| 65 to 74 Years | 14 (5.0%) | 31 (10.6%) |
| 75 Years and over | 11 (7.0%) | 70 (18.0%) |
| Total | 121 (5.6%) | 154 (6.9%) |
Income Above Poverty by Sex and Age in Waimanalo Beach
According to the poverty statistics in Waimanalo Beach, males aged 5 years and females aged 5 years are the age groups that are most secure financially, with 100.0% of males and 100.0% of females in these age groups living above the poverty line.
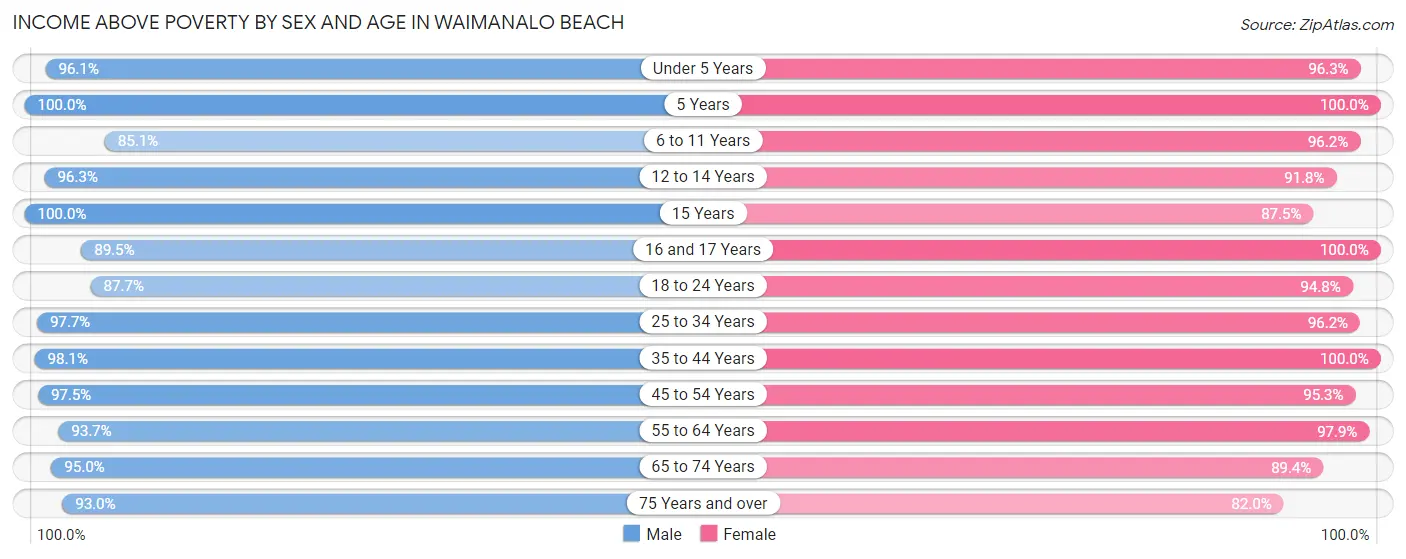
| Age Bracket | Male | Female |
| Under 5 Years | 99 (96.1%) | 103 (96.3%) |
| 5 Years | 19 (100.0%) | 6 (100.0%) |
| 6 to 11 Years | 97 (85.1%) | 126 (96.2%) |
| 12 to 14 Years | 104 (96.3%) | 67 (91.8%) |
| 15 Years | 11 (100.0%) | 28 (87.5%) |
| 16 and 17 Years | 68 (89.5%) | 69 (100.0%) |
| 18 to 24 Years | 186 (87.7%) | 146 (94.8%) |
| 25 to 34 Years | 255 (97.7%) | 176 (96.2%) |
| 35 to 44 Years | 211 (98.1%) | 245 (100.0%) |
| 45 to 54 Years | 314 (97.5%) | 265 (95.3%) |
| 55 to 64 Years | 284 (93.7%) | 278 (97.9%) |
| 65 to 74 Years | 267 (95.0%) | 260 (89.3%) |
| 75 Years and over | 146 (93.0%) | 319 (82.0%) |
| Total | 2,061 (94.5%) | 2,088 (93.1%) |
Income Below Poverty Among Married-Couple Families in Waimanalo Beach
The poverty statistics for married-couple families in Waimanalo Beach show that 3.2% or 18 of the total 555 families live below the poverty line. Families with no children have the highest poverty rate of 5.4%, comprising of 18 families. On the other hand, families with 1 or 2 children have the lowest poverty rate of 0.0%, which includes 0 families.
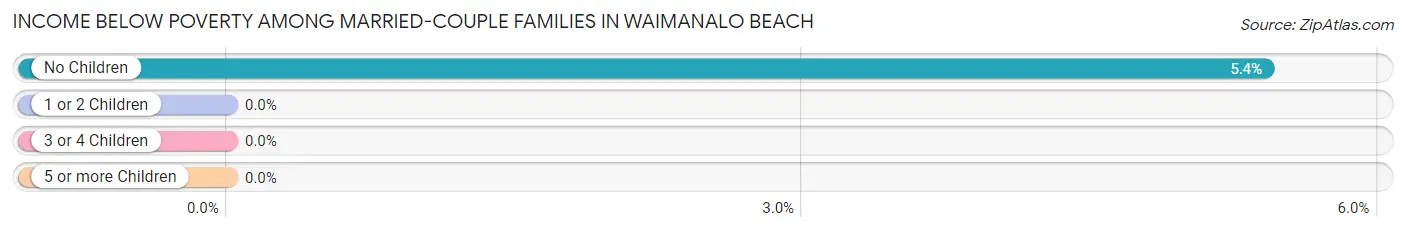
| Children | Above Poverty | Below Poverty |
| No Children | 315 (94.6%) | 18 (5.4%) |
| 1 or 2 Children | 137 (100.0%) | 0 (0.0%) |
| 3 or 4 Children | 69 (100.0%) | 0 (0.0%) |
| 5 or more Children | 16 (100.0%) | 0 (0.0%) |
| Total | 537 (96.8%) | 18 (3.2%) |
Income Below Poverty Among Single-Parent Households in Waimanalo Beach
According to the poverty data in Waimanalo Beach, 5.4% or 7 single-father households and 6.5% or 17 single-mother households are living below the poverty line. Among single-father households, those with 1 or 2 children have the highest poverty rate, with 4 households (7.8%) experiencing poverty. Likewise, among single-mother households, those with 3 or 4 children have the highest poverty rate, with 8 households (61.5%) falling below the poverty line.
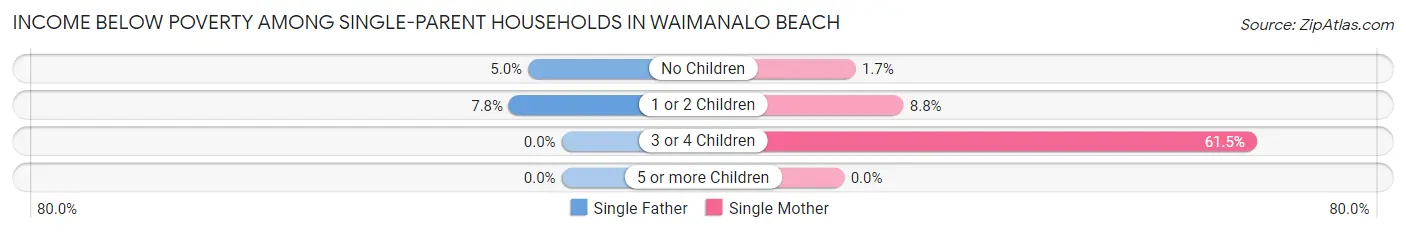
| Children | Single Father | Single Mother |
| No Children | 3 (5.0%) | 3 (1.7%) |
| 1 or 2 Children | 4 (7.8%) | 6 (8.8%) |
| 3 or 4 Children | 0 (0.0%) | 8 (61.5%) |
| 5 or more Children | 0 (0.0%) | 0 (0.0%) |
| Total | 7 (5.4%) | 17 (6.5%) |
Income Below Poverty Among Married-Couple vs Single-Parent Households in Waimanalo Beach
The poverty data for Waimanalo Beach shows that 18 of the married-couple family households (3.2%) and 24 of the single-parent households (6.2%) are living below the poverty level. Within the married-couple family households, those with no children have the highest poverty rate, with 18 households (5.4%) falling below the poverty line. Among the single-parent households, those with 3 or 4 children have the highest poverty rate, with 8 household (30.8%) living below poverty.
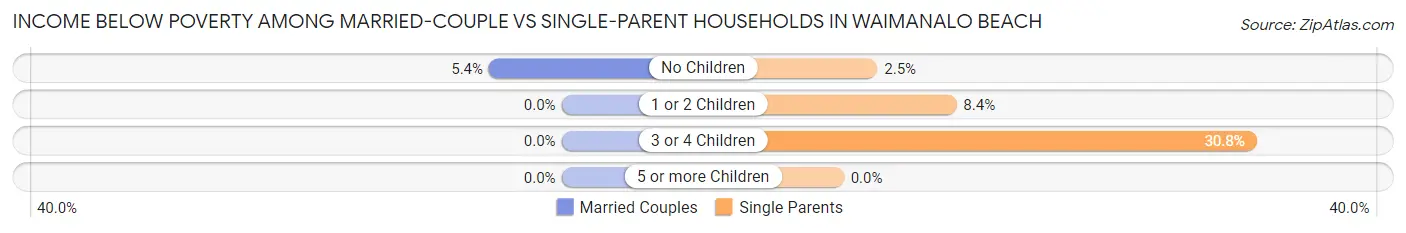
| Children | Married-Couple Families | Single-Parent Households |
| No Children | 18 (5.4%) | 6 (2.5%) |
| 1 or 2 Children | 0 (0.0%) | 10 (8.4%) |
| 3 or 4 Children | 0 (0.0%) | 8 (30.8%) |
| 5 or more Children | 0 (0.0%) | 0 (0.0%) |
| Total | 18 (3.2%) | 24 (6.2%) |
Race in Waimanalo Beach
The most populous races in Waimanalo Beach are Two or more Races (2,014 | 45.0%), Hawaiian / Pacific (1,784 | 39.9%), and White / Caucasian (429 | 9.6%).
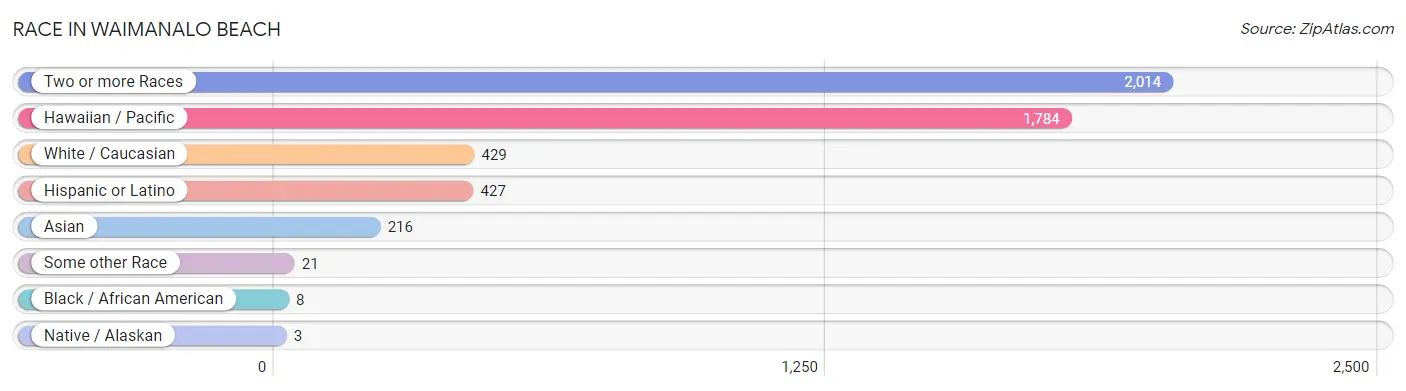
| Race | # Population | % Population |
| Asian | 216 | 4.8% |
| Black / African American | 8 | 0.2% |
| Hawaiian / Pacific | 1,784 | 39.9% |
| Hispanic or Latino | 427 | 9.5% |
| Native / Alaskan | 3 | 0.1% |
| White / Caucasian | 429 | 9.6% |
| Two or more Races | 2,014 | 45.0% |
| Some other Race | 21 | 0.5% |
| Total | 4,475 | 100.0% |
Ancestry in Waimanalo Beach
The most populous ancestries reported in Waimanalo Beach are Native Hawaiian (3,534 | 79.0%), Indian (Asian) (1,083 | 24.2%), Bhutanese (654 | 14.6%), Korean (410 | 9.2%), and Puerto Rican (279 | 6.2%), together accounting for 133.2% of all Waimanalo Beach residents.
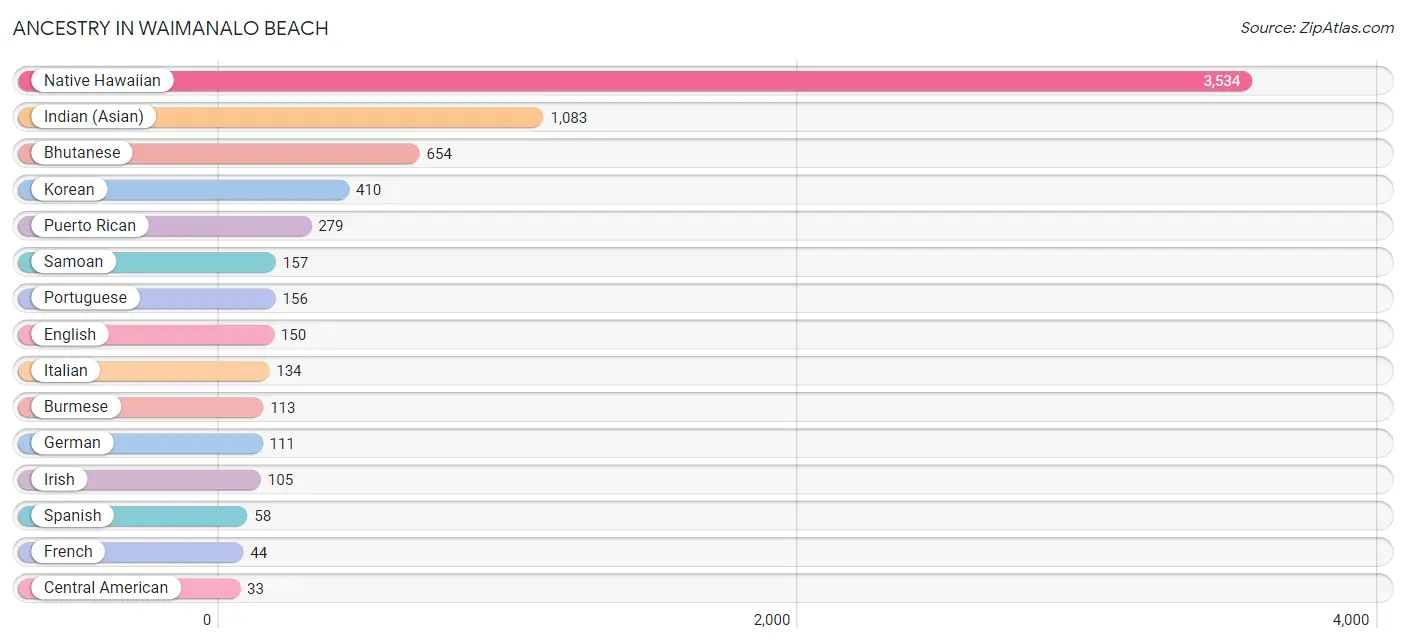
| Ancestry | # Population | % Population |
| Bhutanese | 654 | 14.6% |
| British | 18 | 0.4% |
| Burmese | 113 | 2.5% |
| Central American | 33 | 0.7% |
| Central American Indian | 29 | 0.6% |
| Cherokee | 21 | 0.5% |
| Colombian | 1 | 0.0% |
| Danish | 5 | 0.1% |
| Dutch | 2 | 0.0% |
| English | 150 | 3.4% |
| European | 15 | 0.3% |
| Finnish | 7 | 0.2% |
| French | 44 | 1.0% |
| German | 111 | 2.5% |
| Guatemalan | 29 | 0.6% |
| Hopi | 10 | 0.2% |
| Indian (Asian) | 1,083 | 24.2% |
| Inupiat | 3 | 0.1% |
| Irish | 105 | 2.4% |
| Iroquois | 4 | 0.1% |
| Italian | 134 | 3.0% |
| Korean | 410 | 9.2% |
| Mexican | 15 | 0.3% |
| Native Hawaiian | 3,534 | 79.0% |
| Norwegian | 30 | 0.7% |
| Polish | 18 | 0.4% |
| Portuguese | 156 | 3.5% |
| Puerto Rican | 279 | 6.2% |
| Romanian | 5 | 0.1% |
| Russian | 11 | 0.3% |
| Salvadoran | 4 | 0.1% |
| Samoan | 157 | 3.5% |
| Scotch-Irish | 6 | 0.1% |
| Scottish | 30 | 0.7% |
| Sioux | 8 | 0.2% |
| Slovene | 9 | 0.2% |
| South American | 1 | 0.0% |
| Spaniard | 20 | 0.4% |
| Spanish | 58 | 1.3% |
| Sri Lankan | 17 | 0.4% |
| Swedish | 6 | 0.1% |
| Swiss | 2 | 0.0% |
| Thai | 5 | 0.1% |
| Tongan | 31 | 0.7% |
| Welsh | 3 | 0.1% | View All 45 Rows |
Immigrants in Waimanalo Beach
The most numerous immigrant groups reported in Waimanalo Beach came from Asia (77 | 1.7%), Eastern Asia (48 | 1.1%), Europe (34 | 0.8%), China (33 | 0.7%), and South Eastern Asia (29 | 0.6%), together accounting for 4.9% of all Waimanalo Beach residents.
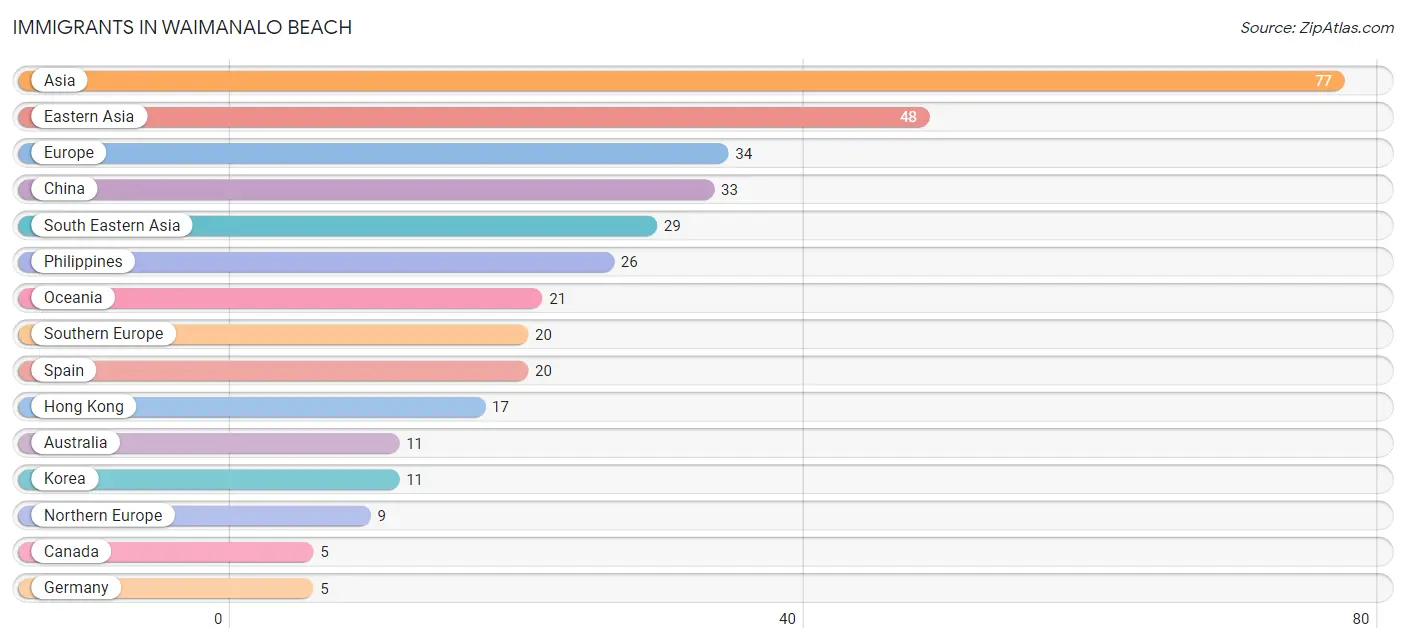
| Immigration Origin | # Population | % Population |
| Asia | 77 | 1.7% |
| Australia | 11 | 0.3% |
| Canada | 5 | 0.1% |
| China | 33 | 0.7% |
| Colombia | 1 | 0.0% |
| Eastern Asia | 48 | 1.1% |
| England | 3 | 0.1% |
| Europe | 34 | 0.8% |
| Germany | 5 | 0.1% |
| Hong Kong | 17 | 0.4% |
| Japan | 4 | 0.1% |
| Korea | 11 | 0.3% |
| Latin America | 1 | 0.0% |
| Northern Europe | 9 | 0.2% |
| Oceania | 21 | 0.5% |
| Philippines | 26 | 0.6% |
| South America | 1 | 0.0% |
| South Eastern Asia | 29 | 0.6% |
| Southern Europe | 20 | 0.4% |
| Spain | 20 | 0.4% |
| Vietnam | 3 | 0.1% |
| Western Europe | 5 | 0.1% | View All 22 Rows |
Sex and Age in Waimanalo Beach
Sex and Age in Waimanalo Beach
The most populous age groups in Waimanalo Beach are 55 to 59 Years (193 | 8.7%) for men and 85 Years and over (203 | 9.0%) for women.
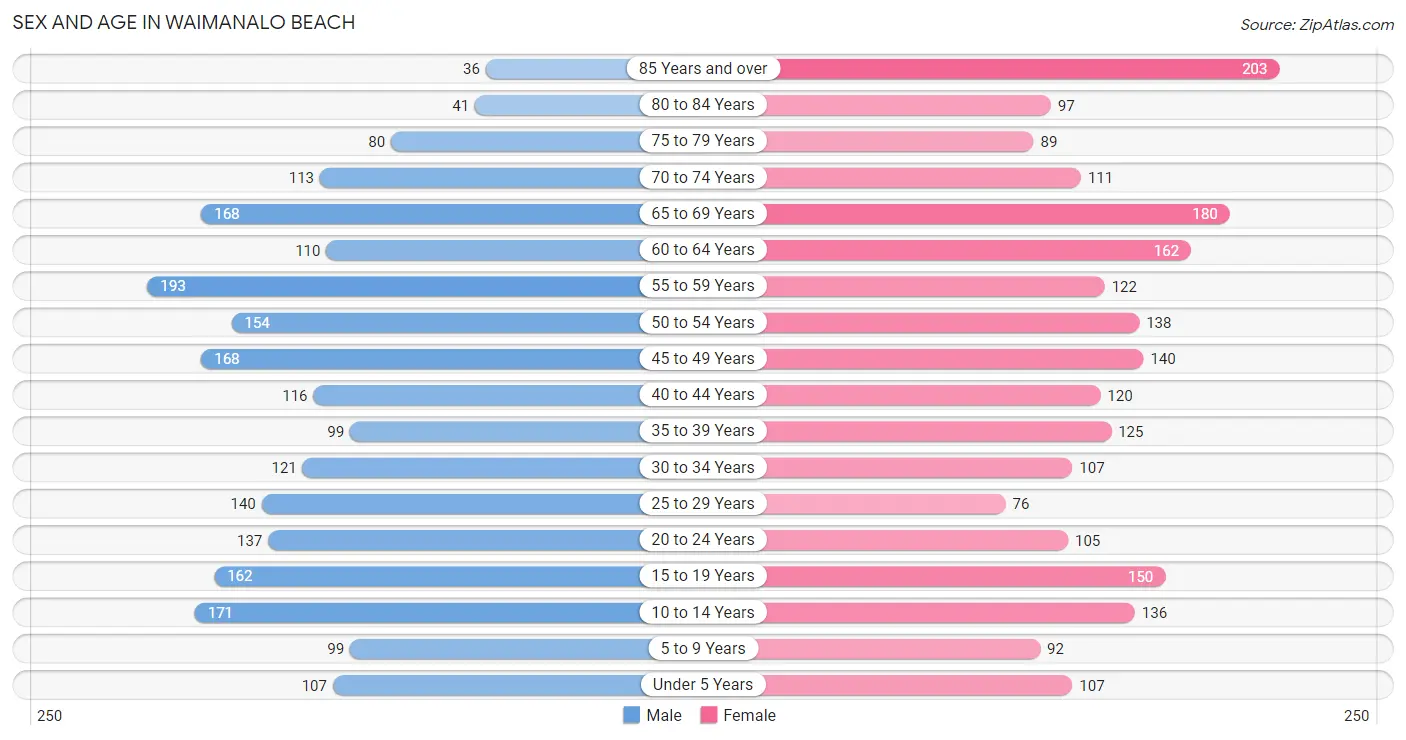
| Age Bracket | Male | Female |
| Under 5 Years | 107 (4.8%) | 107 (4.7%) |
| 5 to 9 Years | 99 (4.5%) | 92 (4.1%) |
| 10 to 14 Years | 171 (7.7%) | 136 (6.0%) |
| 15 to 19 Years | 162 (7.3%) | 150 (6.6%) |
| 20 to 24 Years | 137 (6.2%) | 105 (4.6%) |
| 25 to 29 Years | 140 (6.3%) | 76 (3.4%) |
| 30 to 34 Years | 121 (5.5%) | 107 (4.7%) |
| 35 to 39 Years | 99 (4.5%) | 125 (5.5%) |
| 40 to 44 Years | 116 (5.2%) | 120 (5.3%) |
| 45 to 49 Years | 168 (7.6%) | 140 (6.2%) |
| 50 to 54 Years | 154 (7.0%) | 138 (6.1%) |
| 55 to 59 Years | 193 (8.7%) | 122 (5.4%) |
| 60 to 64 Years | 110 (5.0%) | 162 (7.2%) |
| 65 to 69 Years | 168 (7.6%) | 180 (8.0%) |
| 70 to 74 Years | 113 (5.1%) | 111 (4.9%) |
| 75 to 79 Years | 80 (3.6%) | 89 (3.9%) |
| 80 to 84 Years | 41 (1.8%) | 97 (4.3%) |
| 85 Years and over | 36 (1.6%) | 203 (9.0%) |
| Total | 2,215 (100.0%) | 2,260 (100.0%) |
Families and Households in Waimanalo Beach
Median Family Size in Waimanalo Beach
The median family size in Waimanalo Beach is 4.23 persons per family, with married-couple families (555 | 58.8%) accounting for the largest median family size of 4.54 persons per family. On the other hand, single female/mother families (260 | 27.5%) represent the smallest median family size with 3.70 persons per family.
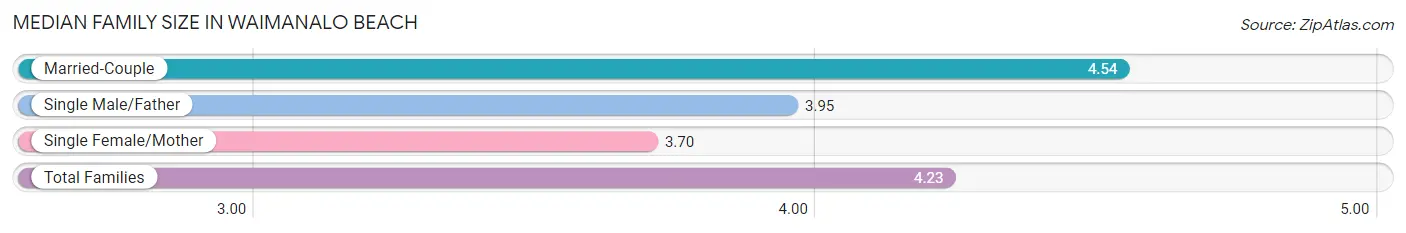
| Family Type | # Families | Family Size |
| Married-Couple | 555 (58.8%) | 4.54 |
| Single Male/Father | 129 (13.7%) | 3.95 |
| Single Female/Mother | 260 (27.5%) | 3.70 |
| Total Families | 944 (100.0%) | 4.23 |
Median Household Size in Waimanalo Beach
The median household size in Waimanalo Beach is 3.90 persons per household, with married-couple households (555 | 48.4%) accounting for the largest median household size of 4.74 persons per household. non-family households (202 | 17.6%) represent the smallest median household size with 1.25 persons per household.
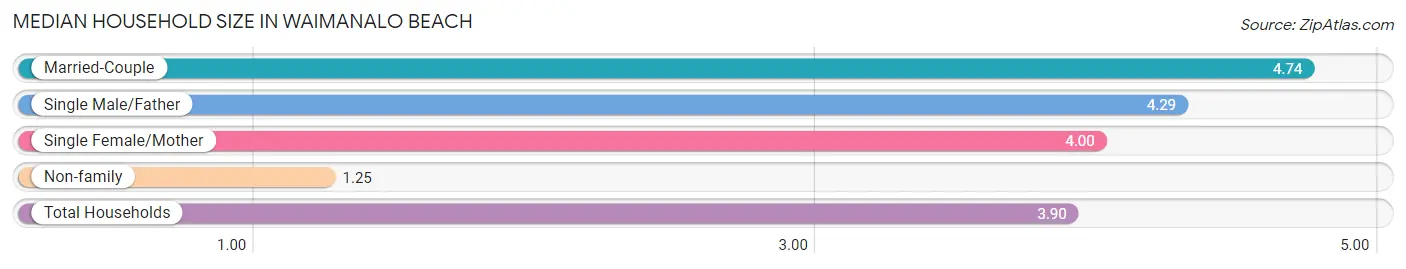
| Household Type | # Households | Household Size |
| Married-Couple | 555 (48.4%) | 4.74 |
| Single Male/Father | 129 (11.3%) | 4.29 |
| Single Female/Mother | 260 (22.7%) | 4.00 |
| Non-family | 202 (17.6%) | 1.25 |
| Total Households | 1,146 (100.0%) | 3.90 |
Household Size by Marriage Status in Waimanalo Beach
Out of a total of 1,146 households in Waimanalo Beach, 944 (82.4%) are family households, while 202 (17.6%) are nonfamily households. The most numerous type of family households are 2-person households, comprising 272, and the most common type of nonfamily households are 1-person households, comprising 157.
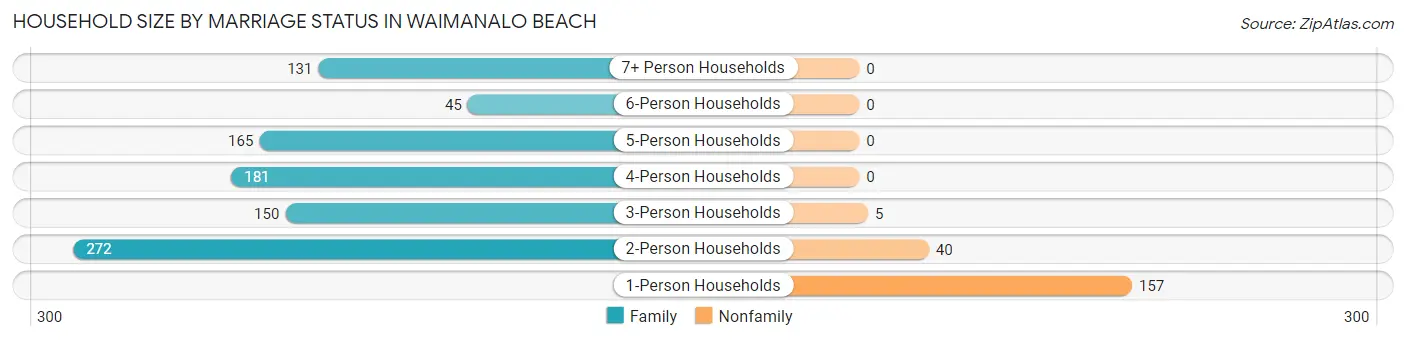
| Household Size | Family Households | Nonfamily Households |
| 1-Person Households | - | 157 (13.7%) |
| 2-Person Households | 272 (23.7%) | 40 (3.5%) |
| 3-Person Households | 150 (13.1%) | 5 (0.4%) |
| 4-Person Households | 181 (15.8%) | 0 (0.0%) |
| 5-Person Households | 165 (14.4%) | 0 (0.0%) |
| 6-Person Households | 45 (3.9%) | 0 (0.0%) |
| 7+ Person Households | 131 (11.4%) | 0 (0.0%) |
| Total | 944 (82.4%) | 202 (17.6%) |
Female Fertility in Waimanalo Beach
Fertility by Age in Waimanalo Beach
Average fertility rate in Waimanalo Beach is 42.0 births per 1,000 women. Women in the age bracket of 20 to 34 years have the highest fertility rate with 108.0 births per 1,000 women. Women in the age bracket of 20 to 34 years acount for 83.8% of all women with births.
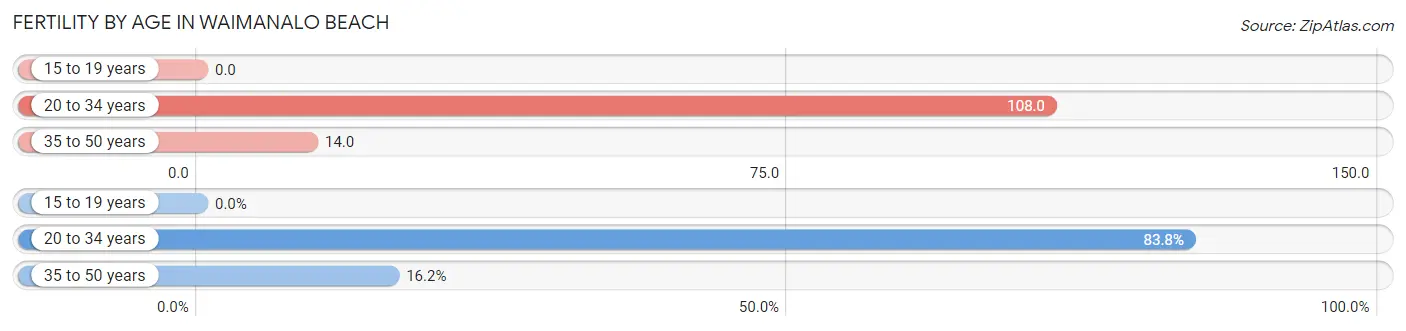
| Age Bracket | Women with Births | Births / 1,000 Women |
| 15 to 19 years | 0 (0.0%) | 0.0 |
| 20 to 34 years | 31 (83.8%) | 108.0 |
| 35 to 50 years | 6 (16.2%) | 14.0 |
| Total | 37 (100.0%) | 42.0 |
Fertility by Age by Marriage Status in Waimanalo Beach
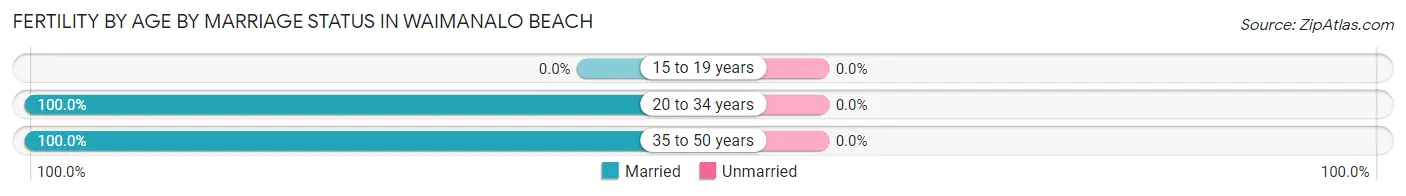
| Age Bracket | Married | Unmarried |
| 15 to 19 years | 0 (0.0%) | 0 (0.0%) |
| 20 to 34 years | 31 (100.0%) | 0 (0.0%) |
| 35 to 50 years | 6 (100.0%) | 0 (0.0%) |
| Total | 37 (100.0%) | 0 (0.0%) |
Fertility by Education in Waimanalo Beach
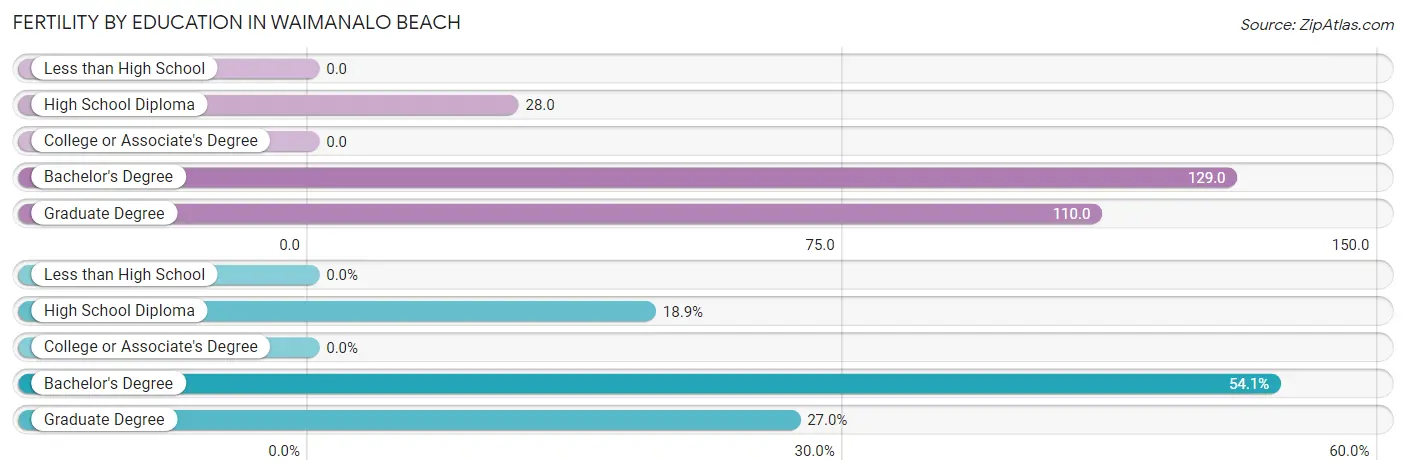
| Educational Attainment | Women with Births | Births / 1,000 Women |
| Less than High School | 0 (0.0%) | 0.0 |
| High School Diploma | 7 (18.9%) | 28.0 |
| College or Associate's Degree | 0 (0.0%) | 0.0 |
| Bachelor's Degree | 20 (54.0%) | 129.0 |
| Graduate Degree | 10 (27.0%) | 110.0 |
| Total | 37 (100.0%) | 42.0 |
Fertility by Education by Marriage Status in Waimanalo Beach
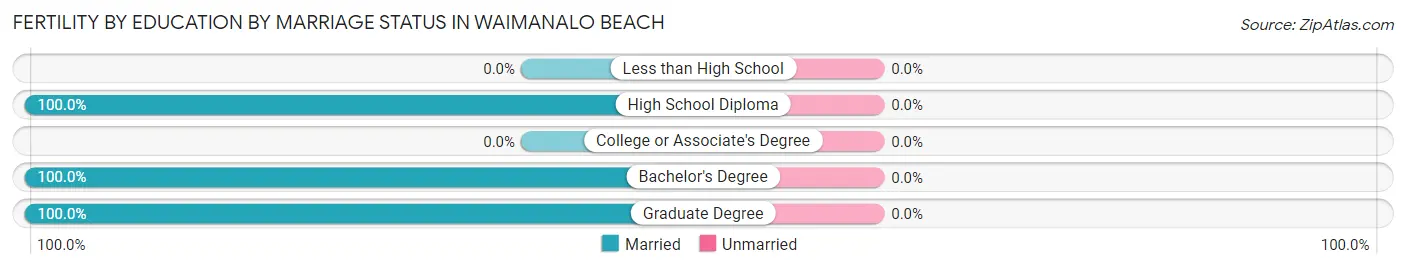
| Educational Attainment | Married | Unmarried |
| Less than High School | 0 (0.0%) | 0 (0.0%) |
| High School Diploma | 7 (100.0%) | 0 (0.0%) |
| College or Associate's Degree | 0 (0.0%) | 0 (0.0%) |
| Bachelor's Degree | 20 (100.0%) | 0 (0.0%) |
| Graduate Degree | 10 (100.0%) | 0 (0.0%) |
| Total | 37 (100.0%) | 0 (0.0%) |
Employment Characteristics in Waimanalo Beach
Employment by Class of Employer in Waimanalo Beach
Among the 1,957 employed individuals in Waimanalo Beach, private company employees (1,007 | 51.5%), not-for-profit organizations (254 | 13.0%), and state government employees (233 | 11.9%) make up the most common classes of employment.
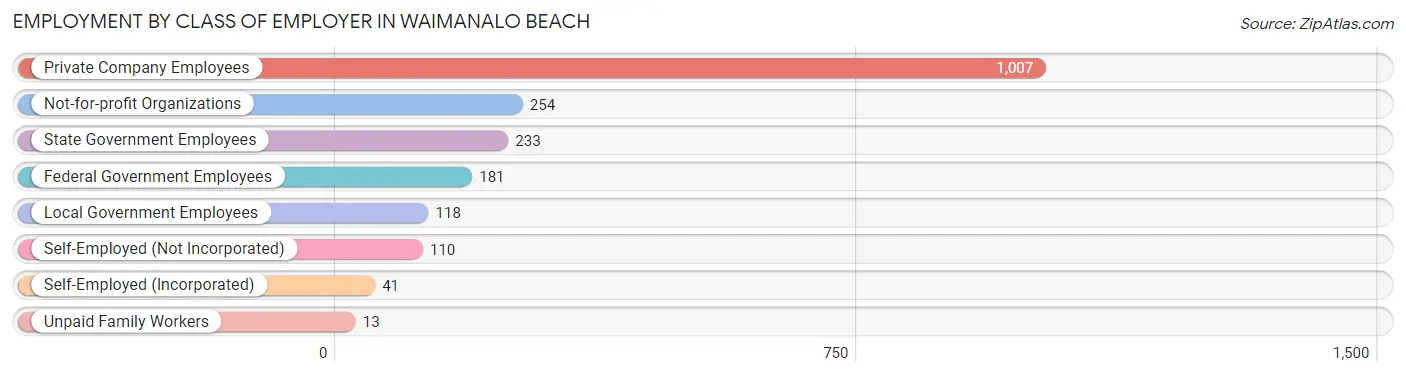
| Employer Class | # Employees | % Employees |
| Private Company Employees | 1,007 | 51.5% |
| Self-Employed (Incorporated) | 41 | 2.1% |
| Self-Employed (Not Incorporated) | 110 | 5.6% |
| Not-for-profit Organizations | 254 | 13.0% |
| Local Government Employees | 118 | 6.0% |
| State Government Employees | 233 | 11.9% |
| Federal Government Employees | 181 | 9.2% |
| Unpaid Family Workers | 13 | 0.7% |
| Total | 1,957 | 100.0% |
Employment Status by Age in Waimanalo Beach
According to the labor force statistics for Waimanalo Beach, out of the total population over 16 years of age (3,720), 58.1% or 2,161 individuals are in the labor force, with 4.8% or 104 of them unemployed. The age group with the highest labor force participation rate is 35 to 44 years, with 93.3% or 429 individuals in the labor force. Within the labor force, the 25 to 29 years age range has the highest percentage of unemployed individuals, with 13.7% or 23 of them being unemployed.
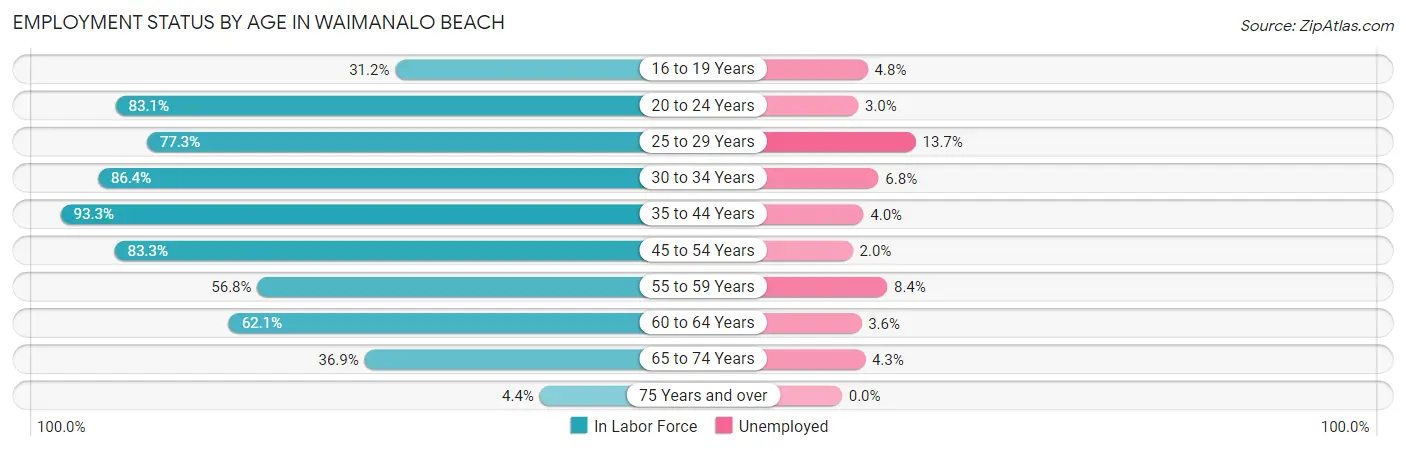
| Age Bracket | In Labor Force | Unemployed |
| 16 to 19 Years | 84 (31.2%) | 4 (4.8%) |
| 20 to 24 Years | 201 (83.1%) | 6 (3.0%) |
| 25 to 29 Years | 167 (77.3%) | 23 (13.7%) |
| 30 to 34 Years | 197 (86.4%) | 13 (6.8%) |
| 35 to 44 Years | 429 (93.3%) | 17 (4.0%) |
| 45 to 54 Years | 500 (83.3%) | 10 (2.0%) |
| 55 to 59 Years | 179 (56.8%) | 15 (8.4%) |
| 60 to 64 Years | 169 (62.1%) | 6 (3.6%) |
| 65 to 74 Years | 211 (36.9%) | 9 (4.3%) |
| 75 Years and over | 24 (4.4%) | 0 (0.0%) |
| Total | 2,161 (58.1%) | 104 (4.8%) |
Employment Status by Educational Attainment in Waimanalo Beach
According to labor force statistics for Waimanalo Beach, 78.5% of individuals (1,641) out of the total population between 25 and 64 years of age (2,091) are in the labor force, with 5.1% or 84 of them being unemployed. The group with the highest labor force participation rate are those with the educational attainment of bachelor's degree or higher, with 89.2% or 518 individuals in the labor force. Within the labor force, individuals with less than high school education have the highest percentage of unemployment, with 13.0% or 6 of them being unemployed.
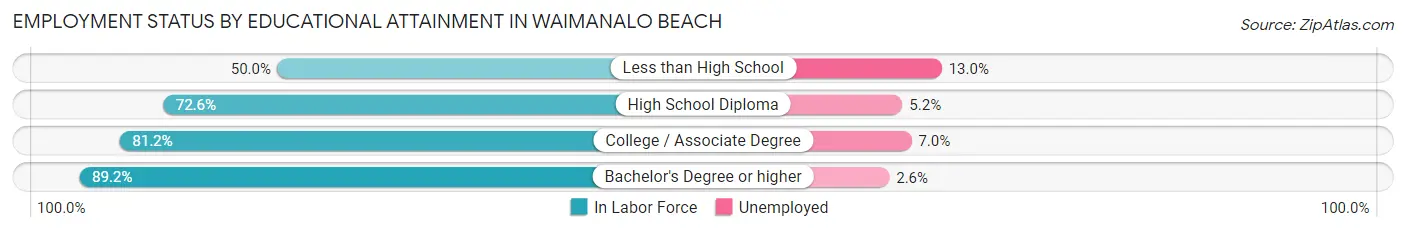
| Educational Attainment | In Labor Force | Unemployed |
| Less than High School | 46 (50.0%) | 12 (13.0%) |
| High School Diploma | 632 (72.6%) | 45 (5.2%) |
| College / Associate Degree | 445 (81.2%) | 38 (7.0%) |
| Bachelor's Degree or higher | 518 (89.2%) | 15 (2.6%) |
| Total | 1,641 (78.5%) | 107 (5.1%) |
Employment Occupations by Sex in Waimanalo Beach
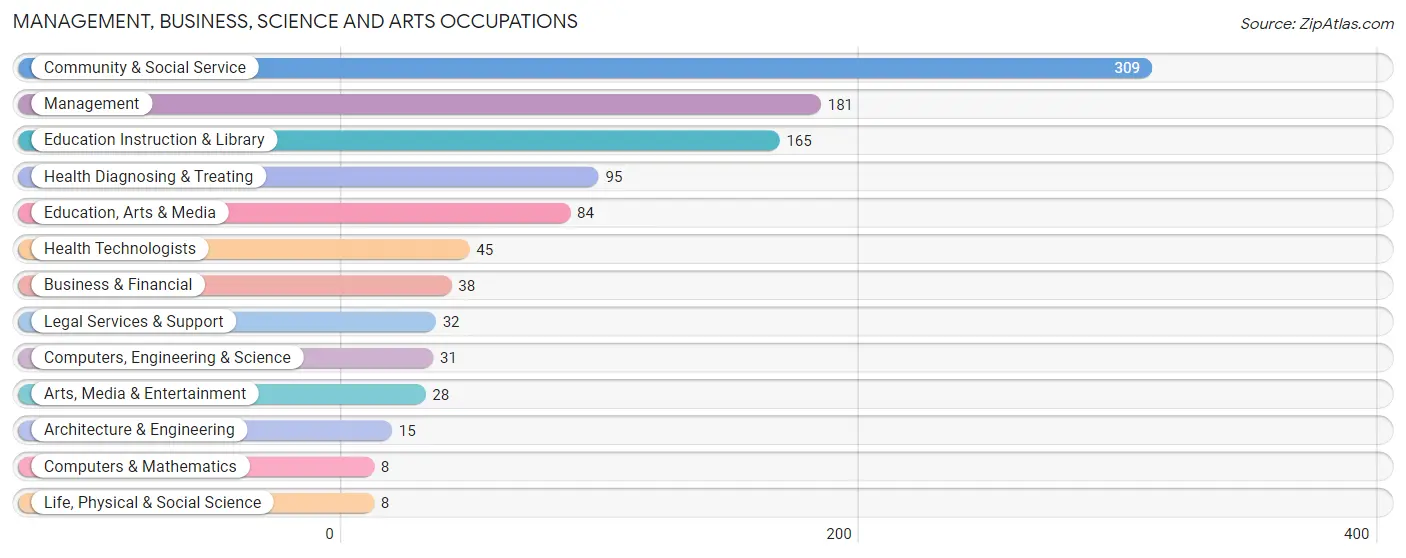
Management, Business, Science and Arts Occupations
The most common Management, Business, Science and Arts occupations in Waimanalo Beach are Community & Social Service (309 | 15.1%), Management (181 | 8.9%), Education Instruction & Library (165 | 8.1%), Health Diagnosing & Treating (95 | 4.6%), and Education, Arts & Media (84 | 4.1%).
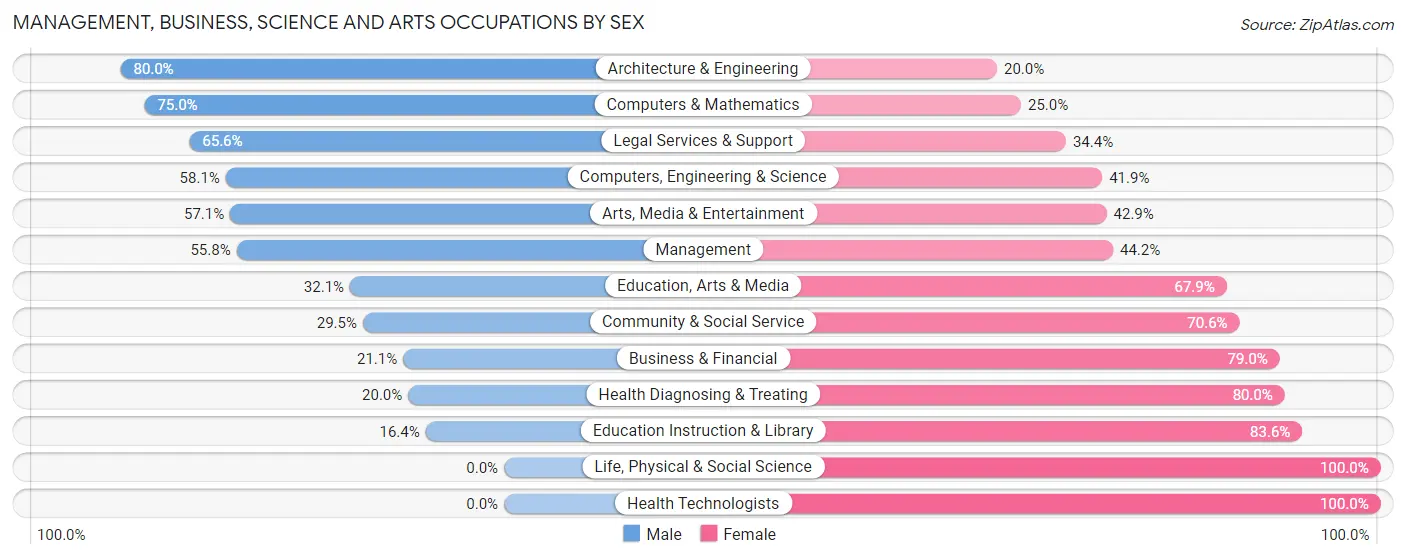
Management, Business, Science and Arts Occupations by Sex
Within the Management, Business, Science and Arts occupations in Waimanalo Beach, the most male-oriented occupations are Architecture & Engineering (80.0%), Computers & Mathematics (75.0%), and Legal Services & Support (65.6%), while the most female-oriented occupations are Life, Physical & Social Science (100.0%), Health Technologists (100.0%), and Education Instruction & Library (83.6%).
| Occupation | Male | Female |
| Management | 101 (55.8%) | 80 (44.2%) |
| Business & Financial | 8 (21.0%) | 30 (78.9%) |
| Computers, Engineering & Science | 18 (58.1%) | 13 (41.9%) |
| Computers & Mathematics | 6 (75.0%) | 2 (25.0%) |
| Architecture & Engineering | 12 (80.0%) | 3 (20.0%) |
| Life, Physical & Social Science | 0 (0.0%) | 8 (100.0%) |
| Community & Social Service | 91 (29.4%) | 218 (70.6%) |
| Education, Arts & Media | 27 (32.1%) | 57 (67.9%) |
| Legal Services & Support | 21 (65.6%) | 11 (34.4%) |
| Education Instruction & Library | 27 (16.4%) | 138 (83.6%) |
| Arts, Media & Entertainment | 16 (57.1%) | 12 (42.9%) |
| Health Diagnosing & Treating | 19 (20.0%) | 76 (80.0%) |
| Health Technologists | 0 (0.0%) | 45 (100.0%) |
| Total (Category) | 237 (36.2%) | 417 (63.8%) |
| Total (Overall) | 1,077 (52.8%) | 964 (47.2%) |
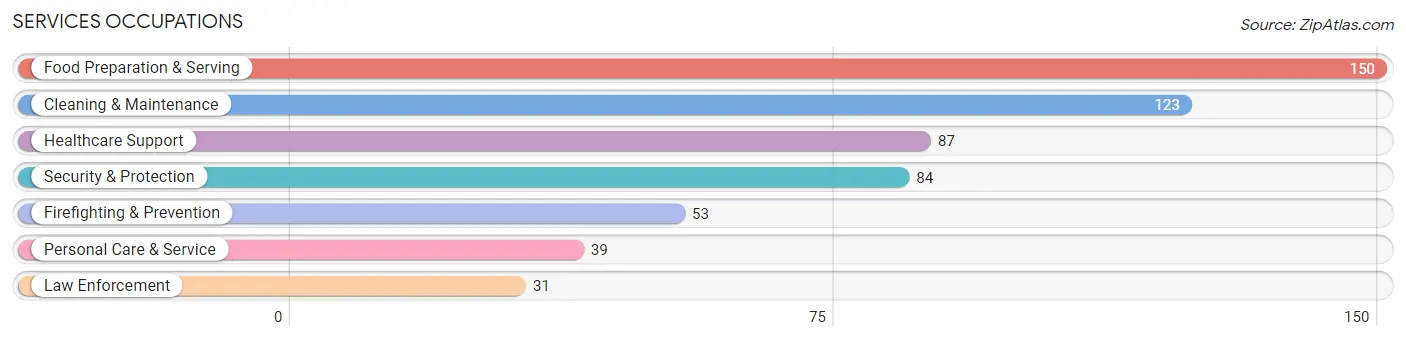
Services Occupations
The most common Services occupations in Waimanalo Beach are Food Preparation & Serving (150 | 7.3%), Cleaning & Maintenance (123 | 6.0%), Healthcare Support (87 | 4.3%), Security & Protection (84 | 4.1%), and Firefighting & Prevention (53 | 2.6%).
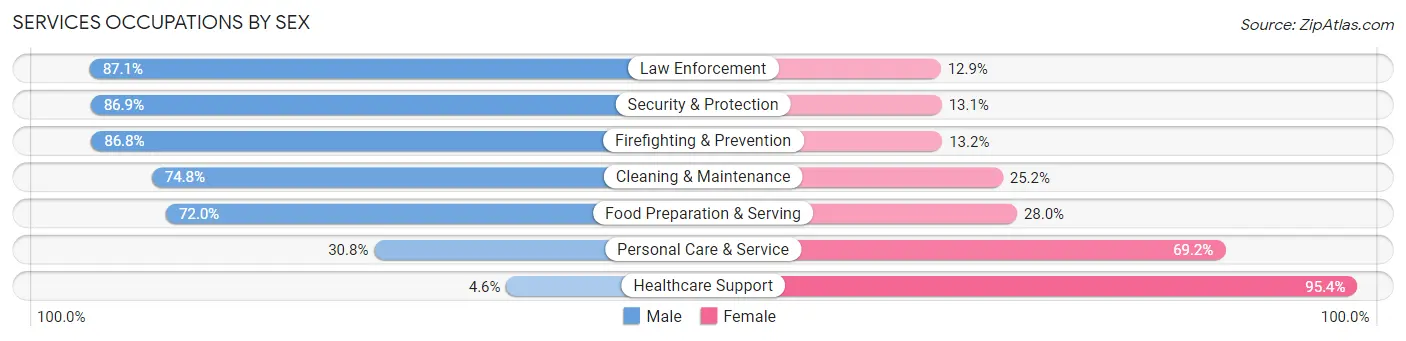
Services Occupations by Sex
Within the Services occupations in Waimanalo Beach, the most male-oriented occupations are Law Enforcement (87.1%), Security & Protection (86.9%), and Firefighting & Prevention (86.8%), while the most female-oriented occupations are Healthcare Support (95.4%), Personal Care & Service (69.2%), and Food Preparation & Serving (28.0%).
| Occupation | Male | Female |
| Healthcare Support | 4 (4.6%) | 83 (95.4%) |
| Security & Protection | 73 (86.9%) | 11 (13.1%) |
| Firefighting & Prevention | 46 (86.8%) | 7 (13.2%) |
| Law Enforcement | 27 (87.1%) | 4 (12.9%) |
| Food Preparation & Serving | 108 (72.0%) | 42 (28.0%) |
| Cleaning & Maintenance | 92 (74.8%) | 31 (25.2%) |
| Personal Care & Service | 12 (30.8%) | 27 (69.2%) |
| Total (Category) | 289 (59.8%) | 194 (40.2%) |
| Total (Overall) | 1,077 (52.8%) | 964 (47.2%) |
Sales and Office Occupations
The most common Sales and Office occupations in Waimanalo Beach are Office & Administration (273 | 13.4%), and Sales & Related (174 | 8.5%).
Sales and Office Occupations by Sex
| Occupation | Male | Female |
| Sales & Related | 90 (51.7%) | 84 (48.3%) |
| Office & Administration | 42 (15.4%) | 231 (84.6%) |
| Total (Category) | 132 (29.5%) | 315 (70.5%) |
| Total (Overall) | 1,077 (52.8%) | 964 (47.2%) |
Natural Resources, Construction and Maintenance Occupations
The most common Natural Resources, Construction and Maintenance occupations in Waimanalo Beach are Construction & Extraction (139 | 6.8%), Installation, Maintenance & Repair (52 | 2.5%), and Farming, Fishing & Forestry (18 | 0.9%).
Natural Resources, Construction and Maintenance Occupations by Sex
| Occupation | Male | Female |
| Farming, Fishing & Forestry | 15 (83.3%) | 3 (16.7%) |
| Construction & Extraction | 136 (97.8%) | 3 (2.2%) |
| Installation, Maintenance & Repair | 49 (94.2%) | 3 (5.8%) |
| Total (Category) | 200 (95.7%) | 9 (4.3%) |
| Total (Overall) | 1,077 (52.8%) | 964 (47.2%) |
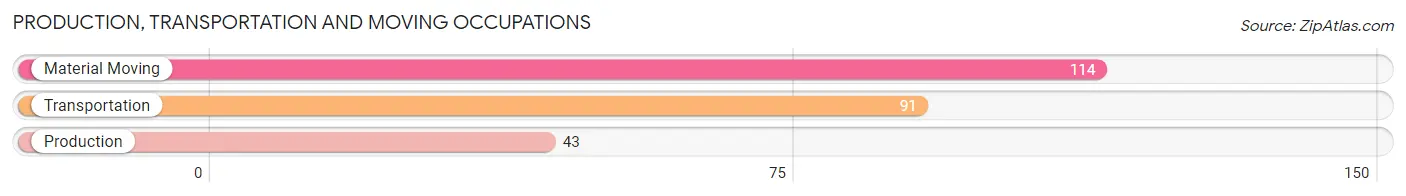
Production, Transportation and Moving Occupations
The most common Production, Transportation and Moving occupations in Waimanalo Beach are Material Moving (114 | 5.6%), Transportation (91 | 4.5%), and Production (43 | 2.1%).
Production, Transportation and Moving Occupations by Sex
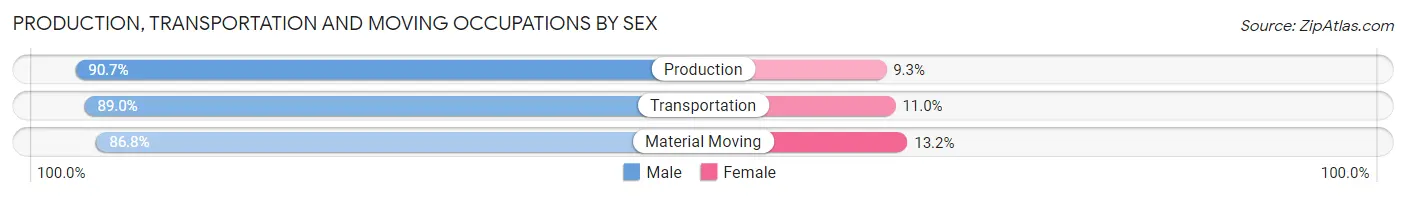
| Occupation | Male | Female |
| Production | 39 (90.7%) | 4 (9.3%) |
| Transportation | 81 (89.0%) | 10 (11.0%) |
| Material Moving | 99 (86.8%) | 15 (13.2%) |
| Total (Category) | 219 (88.3%) | 29 (11.7%) |
| Total (Overall) | 1,077 (52.8%) | 964 (47.2%) |
Employment Industries by Sex in Waimanalo Beach
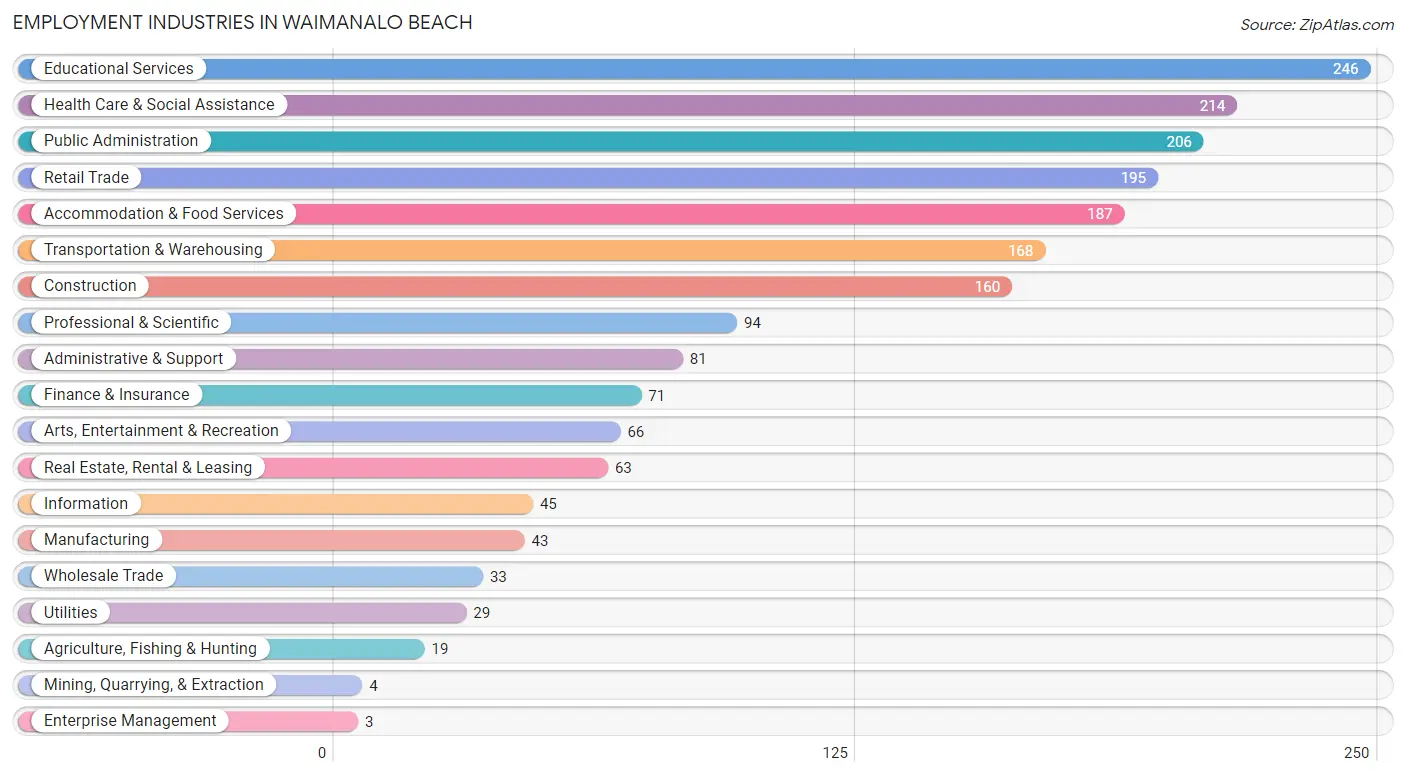
Employment Industries in Waimanalo Beach
The major employment industries in Waimanalo Beach include Educational Services (246 | 12.0%), Health Care & Social Assistance (214 | 10.5%), Public Administration (206 | 10.1%), Retail Trade (195 | 9.6%), and Accommodation & Food Services (187 | 9.2%).
Employment Industries by Sex in Waimanalo Beach
The Waimanalo Beach industries that see more men than women are Mining, Quarrying, & Extraction (100.0%), Information (86.7%), and Utilities (86.2%), whereas the industries that tend to have a higher number of women are Enterprise Management (100.0%), Arts, Entertainment & Recreation (78.8%), and Educational Services (78.0%).

| Industry | Male | Female |
| Agriculture, Fishing & Hunting | 16 (84.2%) | 3 (15.8%) |
| Mining, Quarrying, & Extraction | 4 (100.0%) | 0 (0.0%) |
| Construction | 128 (80.0%) | 32 (20.0%) |
| Manufacturing | 34 (79.1%) | 9 (20.9%) |
| Wholesale Trade | 16 (48.5%) | 17 (51.5%) |
| Retail Trade | 101 (51.8%) | 94 (48.2%) |
| Transportation & Warehousing | 118 (70.2%) | 50 (29.8%) |
| Utilities | 25 (86.2%) | 4 (13.8%) |
| Information | 39 (86.7%) | 6 (13.3%) |
| Finance & Insurance | 36 (50.7%) | 35 (49.3%) |
| Real Estate, Rental & Leasing | 34 (54.0%) | 29 (46.0%) |
| Professional & Scientific | 58 (61.7%) | 36 (38.3%) |
| Enterprise Management | 0 (0.0%) | 3 (100.0%) |
| Administrative & Support | 66 (81.5%) | 15 (18.5%) |
| Educational Services | 54 (22.0%) | 192 (78.0%) |
| Health Care & Social Assistance | 58 (27.1%) | 156 (72.9%) |
| Arts, Entertainment & Recreation | 14 (21.2%) | 52 (78.8%) |
| Accommodation & Food Services | 107 (57.2%) | 80 (42.8%) |
| Public Administration | 138 (67.0%) | 68 (33.0%) |
| Total | 1,077 (52.8%) | 964 (47.2%) |
Education in Waimanalo Beach
School Enrollment in Waimanalo Beach
The most common levels of schooling among the 915 students in Waimanalo Beach are high school (272 | 29.7%), middle school (211 | 23.1%), and elementary school (164 | 17.9%).
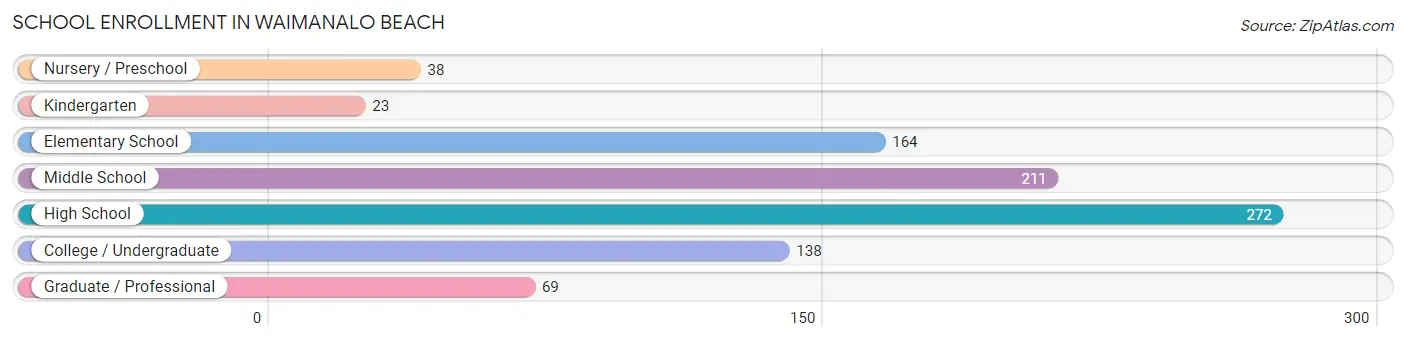
| School Level | # Students | % Students |
| Nursery / Preschool | 38 | 4.2% |
| Kindergarten | 23 | 2.5% |
| Elementary School | 164 | 17.9% |
| Middle School | 211 | 23.1% |
| High School | 272 | 29.7% |
| College / Undergraduate | 138 | 15.1% |
| Graduate / Professional | 69 | 7.5% |
| Total | 915 | 100.0% |
School Enrollment by Age by Funding Source in Waimanalo Beach
Out of a total of 915 students who are enrolled in schools in Waimanalo Beach, 273 (29.8%) attend a private institution, while the remaining 642 (70.2%) are enrolled in public schools. The age group of 18 to 19 year olds has the highest likelihood of being enrolled in private schools, with 35 (58.3% in the age bracket) enrolled. Conversely, the age group of 20 to 24 year olds has the lowest likelihood of being enrolled in a private school, with 54 (100.0% in the age bracket) attending a public institution.
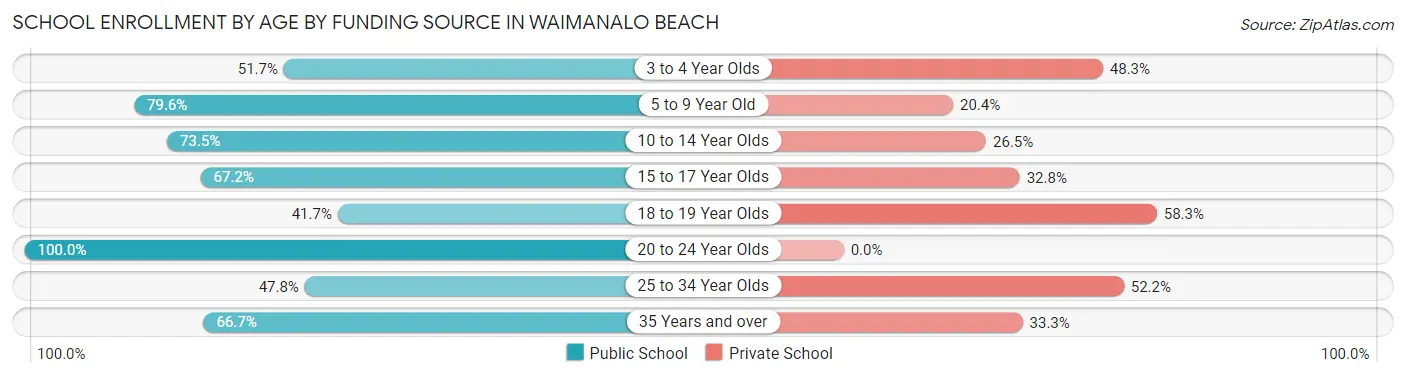
| Age Bracket | Public School | Private School |
| 3 to 4 Year Olds | 15 (51.7%) | 14 (48.3%) |
| 5 to 9 Year Old | 129 (79.6%) | 33 (20.4%) |
| 10 to 14 Year Olds | 216 (73.5%) | 78 (26.5%) |
| 15 to 17 Year Olds | 123 (67.2%) | 60 (32.8%) |
| 18 to 19 Year Olds | 25 (41.7%) | 35 (58.3%) |
| 20 to 24 Year Olds | 54 (100.0%) | 0 (0.0%) |
| 25 to 34 Year Olds | 22 (47.8%) | 24 (52.2%) |
| 35 Years and over | 58 (66.7%) | 29 (33.3%) |
| Total | 642 (70.2%) | 273 (29.8%) |
Educational Attainment by Field of Study in Waimanalo Beach
Business (154 | 17.6%), social sciences (127 | 14.5%), education (122 | 13.9%), science & technology (108 | 12.3%), and arts & humanities (67 | 7.6%) are the most common fields of study among 876 individuals in Waimanalo Beach who have obtained a bachelor's degree or higher.
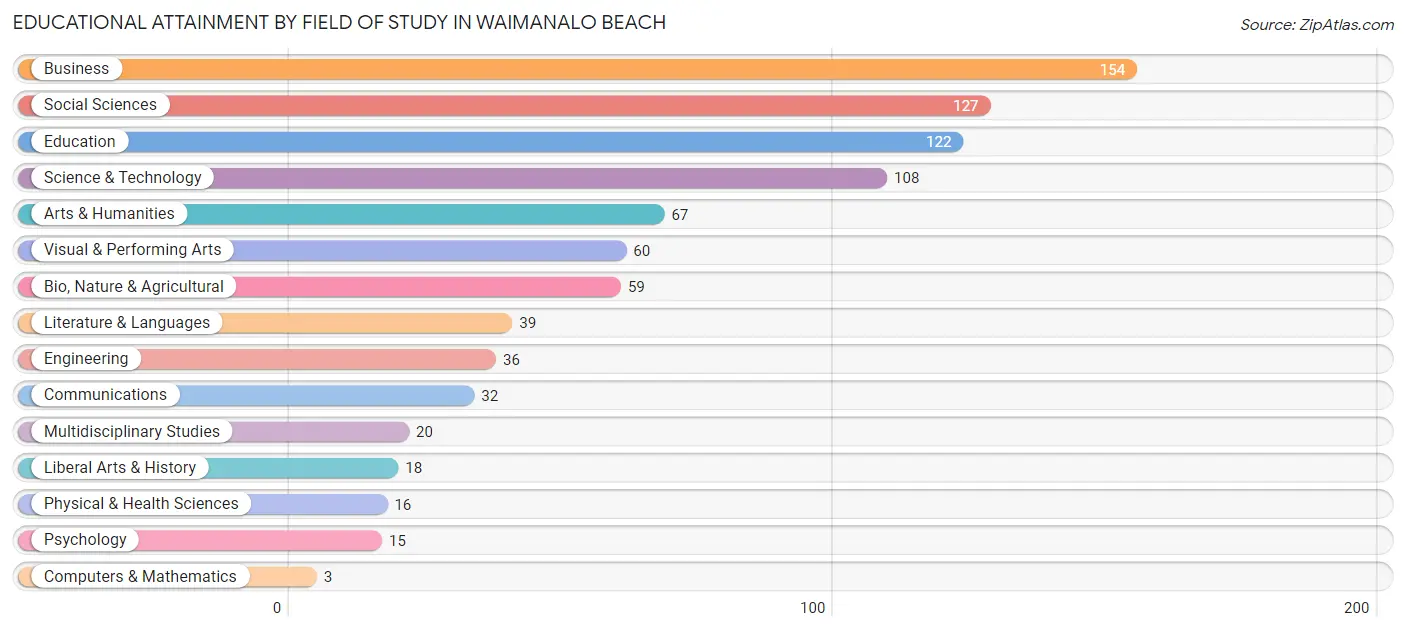
| Field of Study | # Graduates | % Graduates |
| Computers & Mathematics | 3 | 0.3% |
| Bio, Nature & Agricultural | 59 | 6.7% |
| Physical & Health Sciences | 16 | 1.8% |
| Psychology | 15 | 1.7% |
| Social Sciences | 127 | 14.5% |
| Engineering | 36 | 4.1% |
| Multidisciplinary Studies | 20 | 2.3% |
| Science & Technology | 108 | 12.3% |
| Business | 154 | 17.6% |
| Education | 122 | 13.9% |
| Literature & Languages | 39 | 4.4% |
| Liberal Arts & History | 18 | 2.1% |
| Visual & Performing Arts | 60 | 6.9% |
| Communications | 32 | 3.6% |
| Arts & Humanities | 67 | 7.6% |
| Total | 876 | 100.0% |
Transportation & Commute in Waimanalo Beach
Vehicle Availability by Sex in Waimanalo Beach
The most prevalent vehicle ownership categories in Waimanalo Beach are males with 3 vehicles (327, accounting for 32.0%) and females with 3 vehicles (303, making up 34.9%).
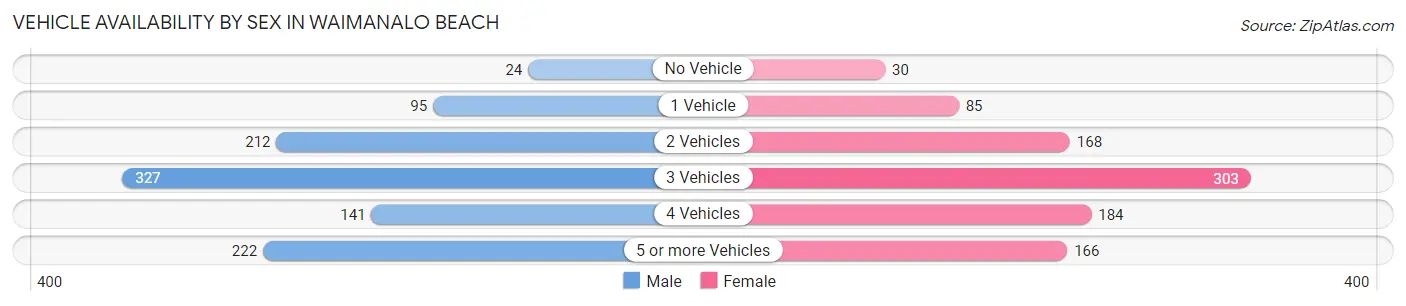
| Vehicles Available | Male | Female |
| No Vehicle | 24 (2.4%) | 30 (3.2%) |
| 1 Vehicle | 95 (9.3%) | 85 (9.1%) |
| 2 Vehicles | 212 (20.8%) | 168 (17.9%) |
| 3 Vehicles | 327 (32.0%) | 303 (32.4%) |
| 4 Vehicles | 141 (13.8%) | 184 (19.7%) |
| 5 or more Vehicles | 222 (21.7%) | 166 (17.7%) |
| Total | 1,021 (100.0%) | 936 (100.0%) |
Commute Time in Waimanalo Beach
The most frequently occuring commute durations in Waimanalo Beach are 45 to 59 minutes (373 commuters, 20.2%), 30 to 34 minutes (320 commuters, 17.3%), and 20 to 24 minutes (180 commuters, 9.8%).
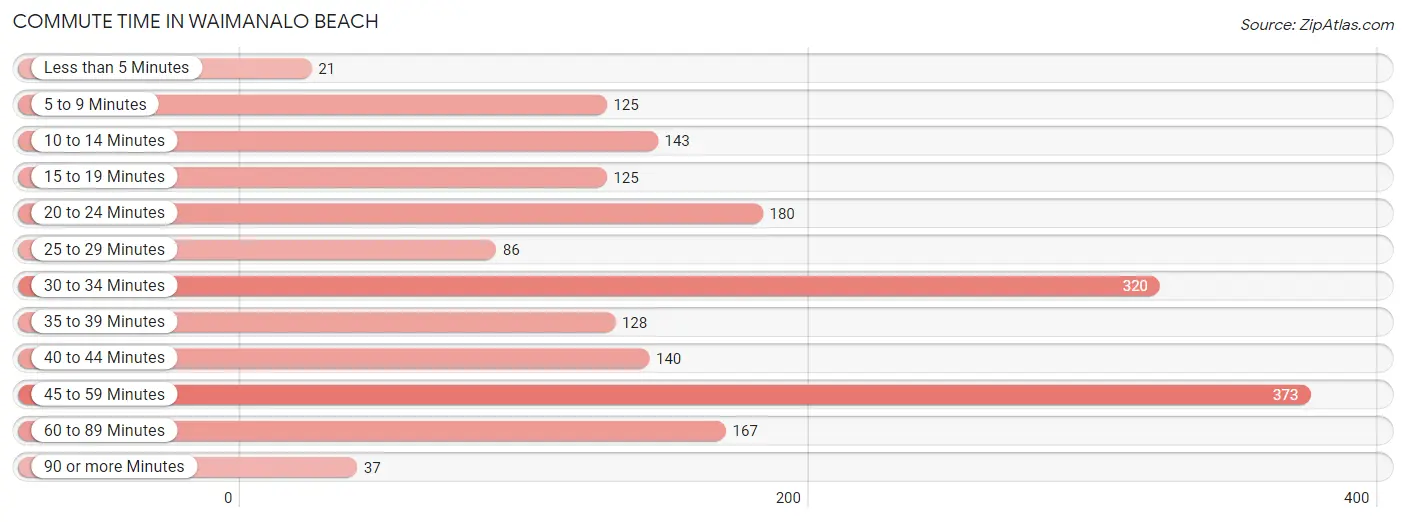
| Commute Time | # Commuters | % Commuters |
| Less than 5 Minutes | 21 | 1.1% |
| 5 to 9 Minutes | 125 | 6.8% |
| 10 to 14 Minutes | 143 | 7.7% |
| 15 to 19 Minutes | 125 | 6.8% |
| 20 to 24 Minutes | 180 | 9.8% |
| 25 to 29 Minutes | 86 | 4.7% |
| 30 to 34 Minutes | 320 | 17.3% |
| 35 to 39 Minutes | 128 | 6.9% |
| 40 to 44 Minutes | 140 | 7.6% |
| 45 to 59 Minutes | 373 | 20.2% |
| 60 to 89 Minutes | 167 | 9.0% |
| 90 or more Minutes | 37 | 2.0% |
Commute Time by Sex in Waimanalo Beach
The most common commute times in Waimanalo Beach are 45 to 59 minutes (221 commuters, 22.3%) for males and 45 to 59 minutes (152 commuters, 17.8%) for females.
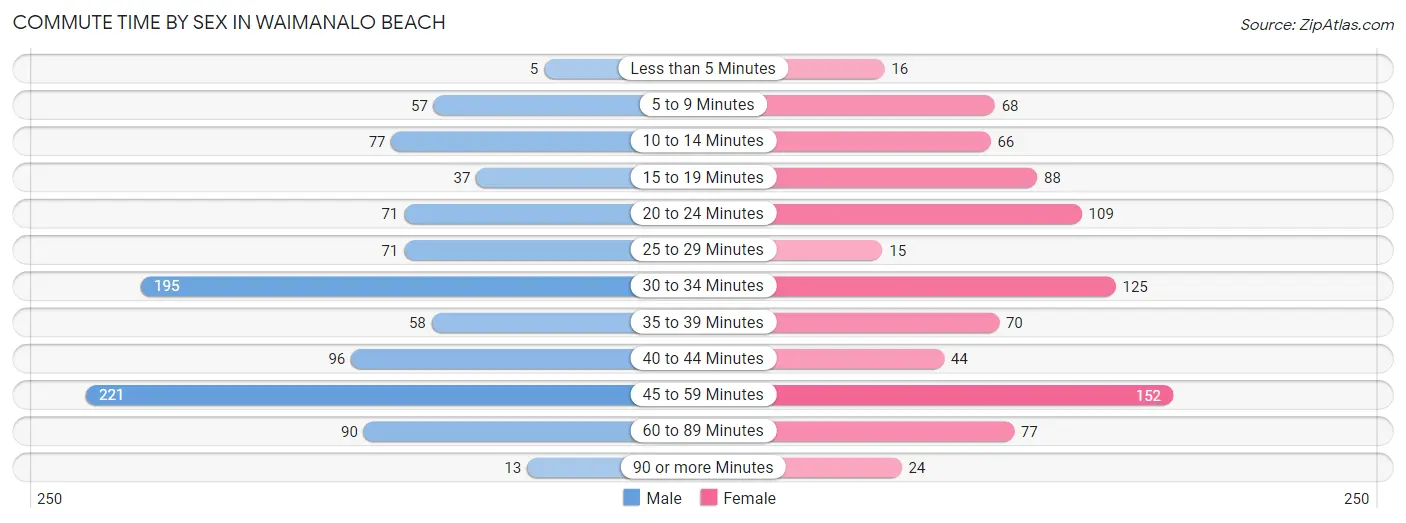
| Commute Time | Male | Female |
| Less than 5 Minutes | 5 (0.5%) | 16 (1.9%) |
| 5 to 9 Minutes | 57 (5.8%) | 68 (8.0%) |
| 10 to 14 Minutes | 77 (7.8%) | 66 (7.7%) |
| 15 to 19 Minutes | 37 (3.7%) | 88 (10.3%) |
| 20 to 24 Minutes | 71 (7.2%) | 109 (12.8%) |
| 25 to 29 Minutes | 71 (7.2%) | 15 (1.8%) |
| 30 to 34 Minutes | 195 (19.7%) | 125 (14.6%) |
| 35 to 39 Minutes | 58 (5.9%) | 70 (8.2%) |
| 40 to 44 Minutes | 96 (9.7%) | 44 (5.1%) |
| 45 to 59 Minutes | 221 (22.3%) | 152 (17.8%) |
| 60 to 89 Minutes | 90 (9.1%) | 77 (9.0%) |
| 90 or more Minutes | 13 (1.3%) | 24 (2.8%) |
Time of Departure to Work by Sex in Waimanalo Beach
The most frequent times of departure to work in Waimanalo Beach are 7:00 AM to 7:29 AM (187, 18.9%) for males and 7:00 AM to 7:29 AM (128, 15.0%) for females.
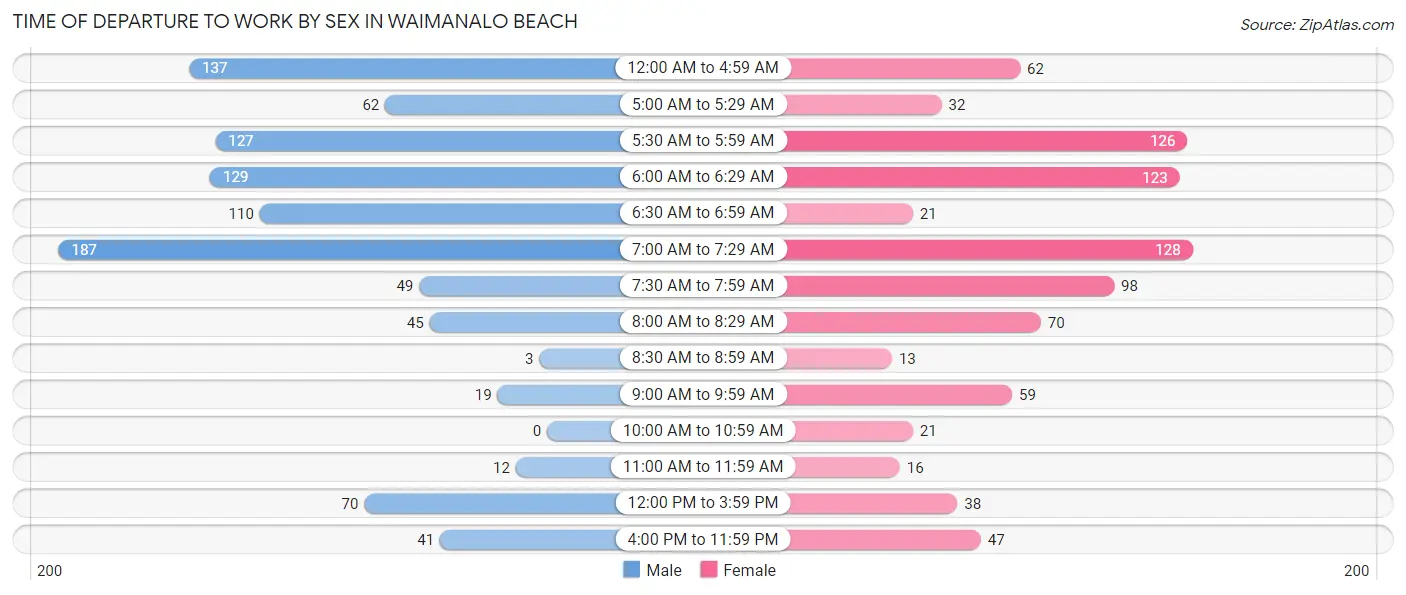
| Time of Departure | Male | Female |
| 12:00 AM to 4:59 AM | 137 (13.8%) | 62 (7.3%) |
| 5:00 AM to 5:29 AM | 62 (6.3%) | 32 (3.7%) |
| 5:30 AM to 5:59 AM | 127 (12.8%) | 126 (14.7%) |
| 6:00 AM to 6:29 AM | 129 (13.0%) | 123 (14.4%) |
| 6:30 AM to 6:59 AM | 110 (11.1%) | 21 (2.5%) |
| 7:00 AM to 7:29 AM | 187 (18.9%) | 128 (15.0%) |
| 7:30 AM to 7:59 AM | 49 (4.9%) | 98 (11.5%) |
| 8:00 AM to 8:29 AM | 45 (4.5%) | 70 (8.2%) |
| 8:30 AM to 8:59 AM | 3 (0.3%) | 13 (1.5%) |
| 9:00 AM to 9:59 AM | 19 (1.9%) | 59 (6.9%) |
| 10:00 AM to 10:59 AM | 0 (0.0%) | 21 (2.5%) |
| 11:00 AM to 11:59 AM | 12 (1.2%) | 16 (1.9%) |
| 12:00 PM to 3:59 PM | 70 (7.1%) | 38 (4.4%) |
| 4:00 PM to 11:59 PM | 41 (4.1%) | 47 (5.5%) |
| Total | 991 (100.0%) | 854 (100.0%) |
Housing Occupancy in Waimanalo Beach
Occupancy by Ownership in Waimanalo Beach
Of the total 1,146 dwellings in Waimanalo Beach, owner-occupied units account for 939 (81.9%), while renter-occupied units make up 207 (18.1%).
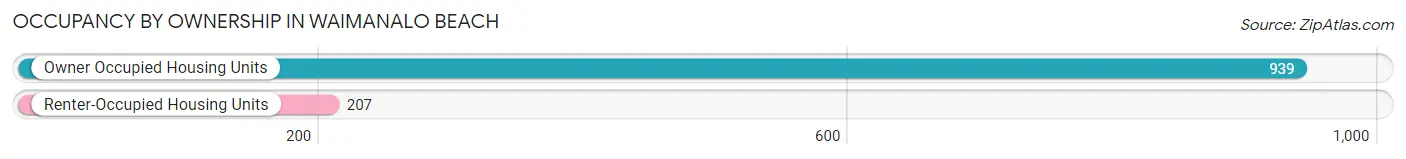
| Occupancy | # Housing Units | % Housing Units |
| Owner Occupied Housing Units | 939 | 81.9% |
| Renter-Occupied Housing Units | 207 | 18.1% |
| Total Occupied Housing Units | 1,146 | 100.0% |
Occupancy by Household Size in Waimanalo Beach
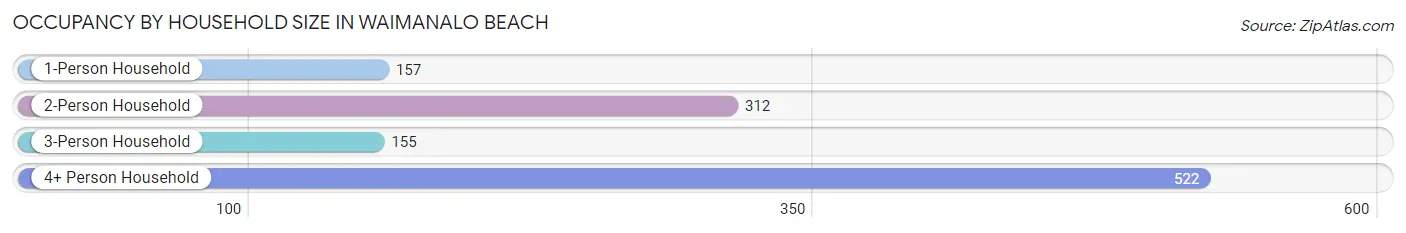
| Household Size | # Housing Units | % Housing Units |
| 1-Person Household | 157 | 13.7% |
| 2-Person Household | 312 | 27.2% |
| 3-Person Household | 155 | 13.5% |
| 4+ Person Household | 522 | 45.6% |
| Total Housing Units | 1,146 | 100.0% |
Occupancy by Ownership by Household Size in Waimanalo Beach
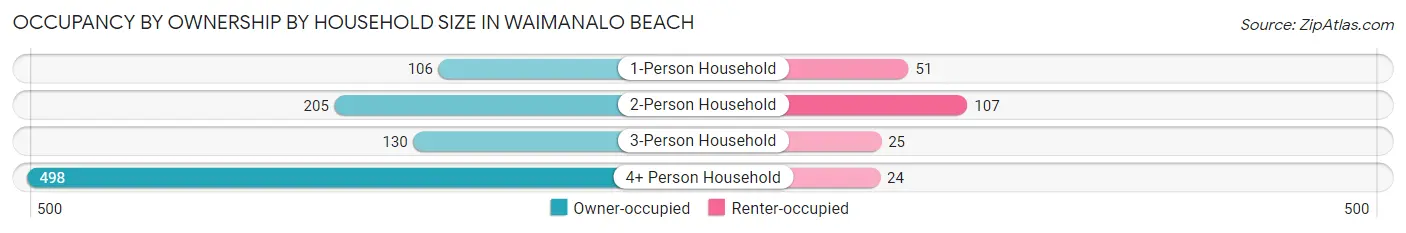
| Household Size | Owner-occupied | Renter-occupied |
| 1-Person Household | 106 (67.5%) | 51 (32.5%) |
| 2-Person Household | 205 (65.7%) | 107 (34.3%) |
| 3-Person Household | 130 (83.9%) | 25 (16.1%) |
| 4+ Person Household | 498 (95.4%) | 24 (4.6%) |
| Total Housing Units | 939 (81.9%) | 207 (18.1%) |
Occupancy by Educational Attainment in Waimanalo Beach
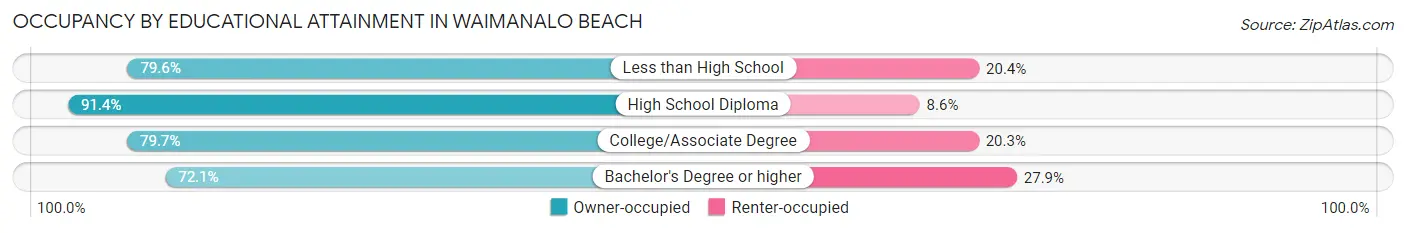
| Household Size | Owner-occupied | Renter-occupied |
| Less than High School | 78 (79.6%) | 20 (20.4%) |
| High School Diploma | 392 (91.4%) | 37 (8.6%) |
| College/Associate Degree | 239 (79.7%) | 61 (20.3%) |
| Bachelor's Degree or higher | 230 (72.1%) | 89 (27.9%) |
Occupancy by Age of Householder in Waimanalo Beach
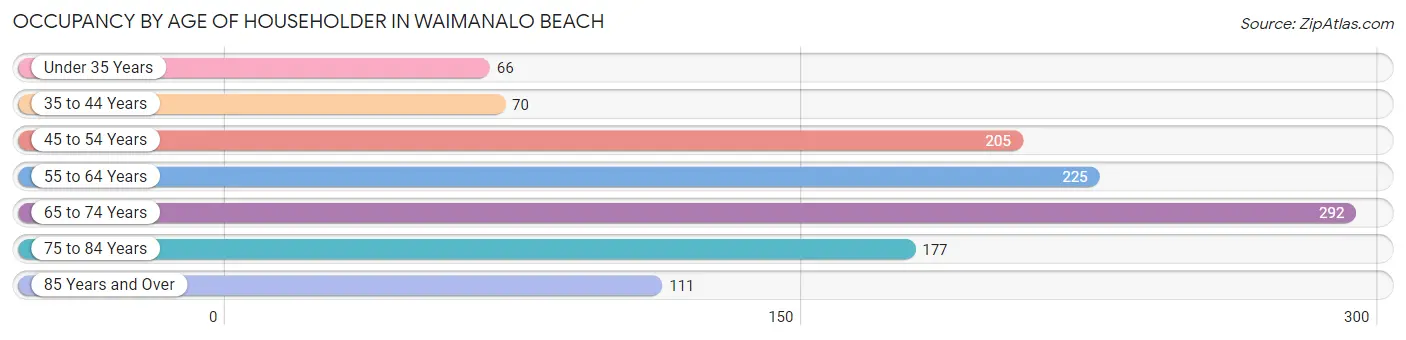
| Age Bracket | # Households | % Households |
| Under 35 Years | 66 | 5.8% |
| 35 to 44 Years | 70 | 6.1% |
| 45 to 54 Years | 205 | 17.9% |
| 55 to 64 Years | 225 | 19.6% |
| 65 to 74 Years | 292 | 25.5% |
| 75 to 84 Years | 177 | 15.4% |
| 85 Years and Over | 111 | 9.7% |
| Total | 1,146 | 100.0% |
Housing Finances in Waimanalo Beach
Median Income by Occupancy in Waimanalo Beach
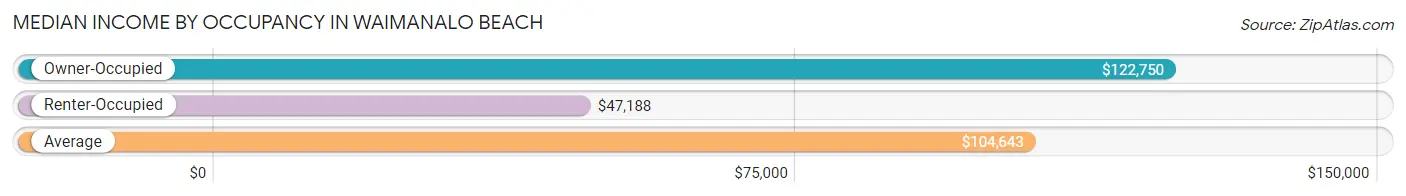
| Occupancy Type | # Households | Median Income |
| Owner-Occupied | 939 (81.9%) | $122,750 |
| Renter-Occupied | 207 (18.1%) | $47,188 |
| Average | 1,146 (100.0%) | $104,643 |
Occupancy by Householder Income Bracket in Waimanalo Beach
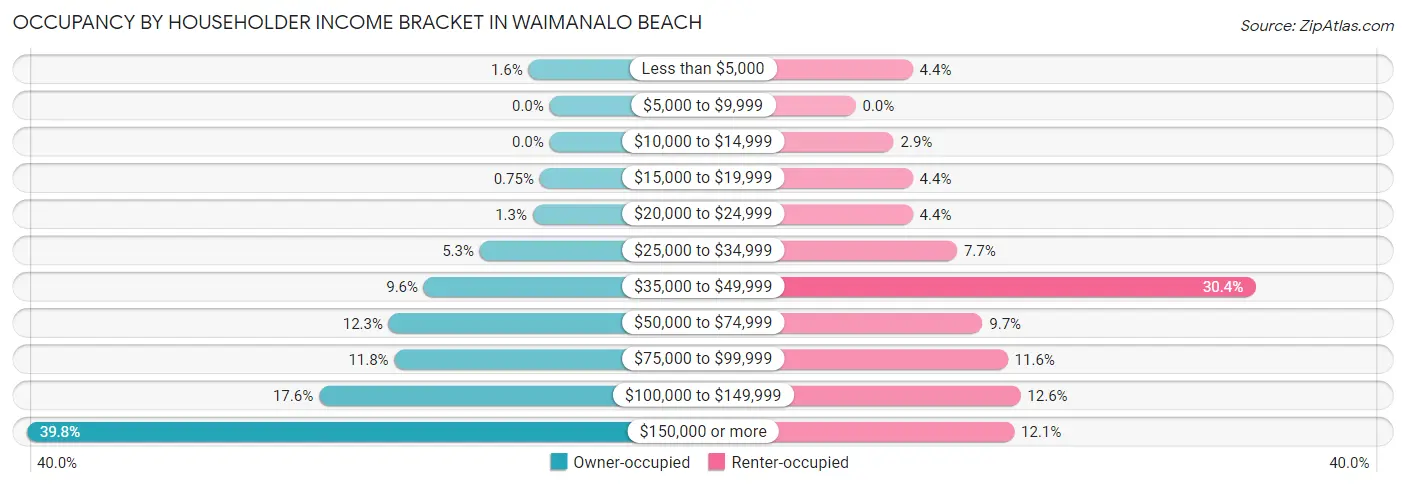
| Income Bracket | Owner-occupied | Renter-occupied |
| Less than $5,000 | 15 (1.6%) | 9 (4.3%) |
| $5,000 to $9,999 | 0 (0.0%) | 0 (0.0%) |
| $10,000 to $14,999 | 0 (0.0%) | 6 (2.9%) |
| $15,000 to $19,999 | 7 (0.7%) | 9 (4.3%) |
| $20,000 to $24,999 | 12 (1.3%) | 9 (4.3%) |
| $25,000 to $34,999 | 50 (5.3%) | 16 (7.7%) |
| $35,000 to $49,999 | 90 (9.6%) | 63 (30.4%) |
| $50,000 to $74,999 | 115 (12.2%) | 20 (9.7%) |
| $75,000 to $99,999 | 111 (11.8%) | 24 (11.6%) |
| $100,000 to $149,999 | 165 (17.6%) | 26 (12.6%) |
| $150,000 or more | 374 (39.8%) | 25 (12.1%) |
| Total | 939 (100.0%) | 207 (100.0%) |
Monthly Housing Cost Tiers in Waimanalo Beach
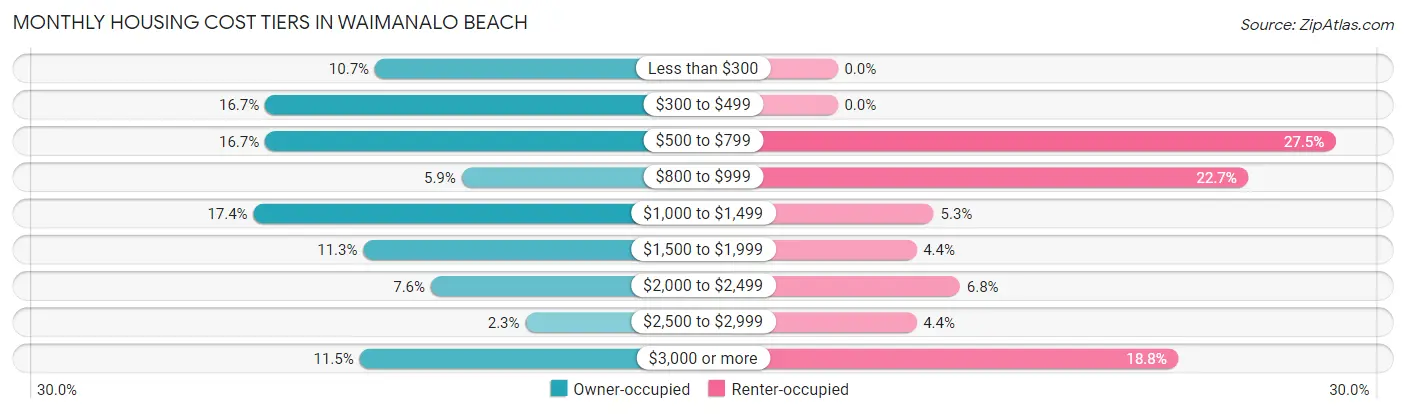
| Monthly Cost | Owner-occupied | Renter-occupied |
| Less than $300 | 100 (10.6%) | 0 (0.0%) |
| $300 to $499 | 157 (16.7%) | 0 (0.0%) |
| $500 to $799 | 157 (16.7%) | 57 (27.5%) |
| $800 to $999 | 55 (5.9%) | 47 (22.7%) |
| $1,000 to $1,499 | 163 (17.4%) | 11 (5.3%) |
| $1,500 to $1,999 | 106 (11.3%) | 9 (4.3%) |
| $2,000 to $2,499 | 71 (7.6%) | 14 (6.8%) |
| $2,500 to $2,999 | 22 (2.3%) | 9 (4.3%) |
| $3,000 or more | 108 (11.5%) | 39 (18.8%) |
| Total | 939 (100.0%) | 207 (100.0%) |
Physical Housing Characteristics in Waimanalo Beach
Housing Structures in Waimanalo Beach
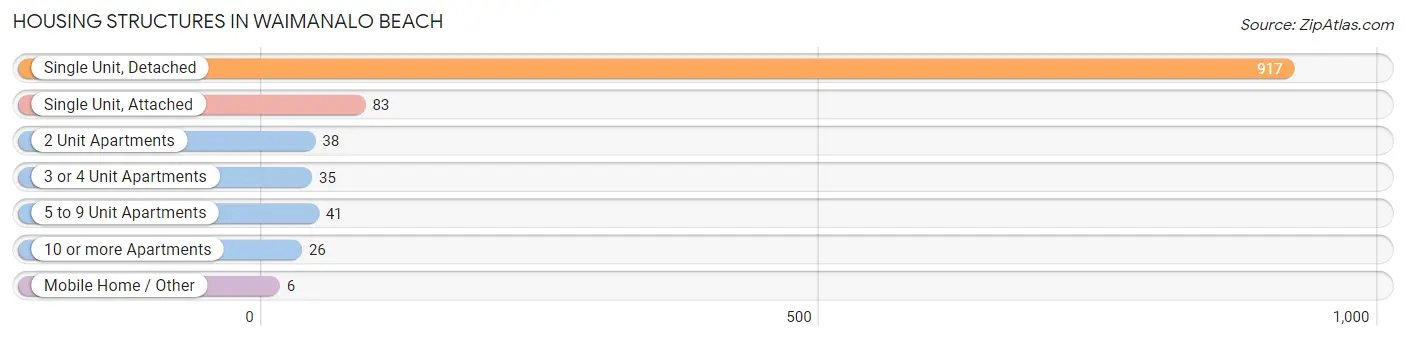
| Structure Type | # Housing Units | % Housing Units |
| Single Unit, Detached | 917 | 80.0% |
| Single Unit, Attached | 83 | 7.2% |
| 2 Unit Apartments | 38 | 3.3% |
| 3 or 4 Unit Apartments | 35 | 3.0% |
| 5 to 9 Unit Apartments | 41 | 3.6% |
| 10 or more Apartments | 26 | 2.3% |
| Mobile Home / Other | 6 | 0.5% |
| Total | 1,146 | 100.0% |
Housing Structures by Occupancy in Waimanalo Beach
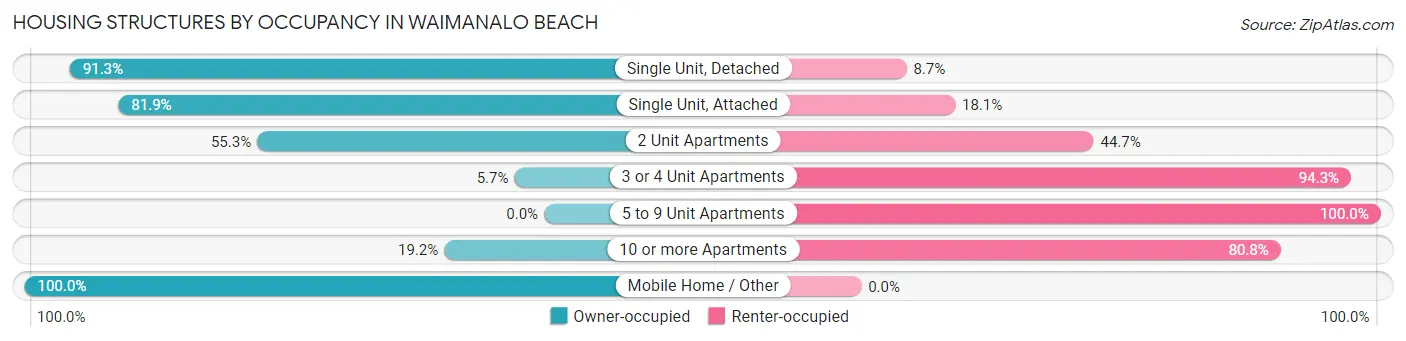
| Structure Type | Owner-occupied | Renter-occupied |
| Single Unit, Detached | 837 (91.3%) | 80 (8.7%) |
| Single Unit, Attached | 68 (81.9%) | 15 (18.1%) |
| 2 Unit Apartments | 21 (55.3%) | 17 (44.7%) |
| 3 or 4 Unit Apartments | 2 (5.7%) | 33 (94.3%) |
| 5 to 9 Unit Apartments | 0 (0.0%) | 41 (100.0%) |
| 10 or more Apartments | 5 (19.2%) | 21 (80.8%) |
| Mobile Home / Other | 6 (100.0%) | 0 (0.0%) |
| Total | 939 (81.9%) | 207 (18.1%) |
Housing Structures by Number of Rooms in Waimanalo Beach
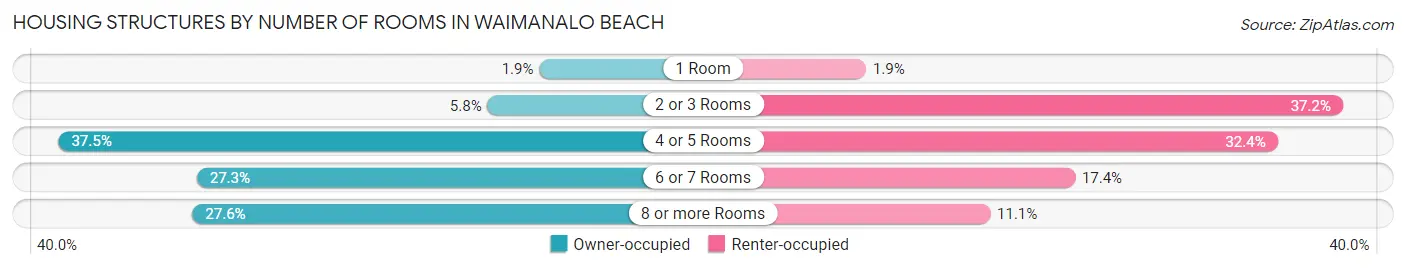
| Number of Rooms | Owner-occupied | Renter-occupied |
| 1 Room | 18 (1.9%) | 4 (1.9%) |
| 2 or 3 Rooms | 54 (5.8%) | 77 (37.2%) |
| 4 or 5 Rooms | 352 (37.5%) | 67 (32.4%) |
| 6 or 7 Rooms | 256 (27.3%) | 36 (17.4%) |
| 8 or more Rooms | 259 (27.6%) | 23 (11.1%) |
| Total | 939 (100.0%) | 207 (100.0%) |
Housing Structure by Heating Type in Waimanalo Beach
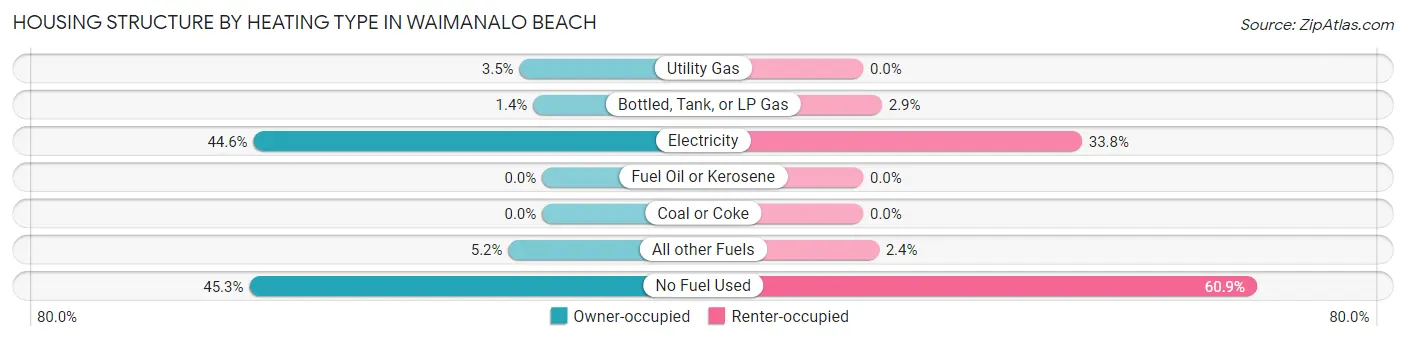
| Heating Type | Owner-occupied | Renter-occupied |
| Utility Gas | 33 (3.5%) | 0 (0.0%) |
| Bottled, Tank, or LP Gas | 13 (1.4%) | 6 (2.9%) |
| Electricity | 419 (44.6%) | 70 (33.8%) |
| Fuel Oil or Kerosene | 0 (0.0%) | 0 (0.0%) |
| Coal or Coke | 0 (0.0%) | 0 (0.0%) |
| All other Fuels | 49 (5.2%) | 5 (2.4%) |
| No Fuel Used | 425 (45.3%) | 126 (60.9%) |
| Total | 939 (100.0%) | 207 (100.0%) |
Household Vehicle Usage in Waimanalo Beach
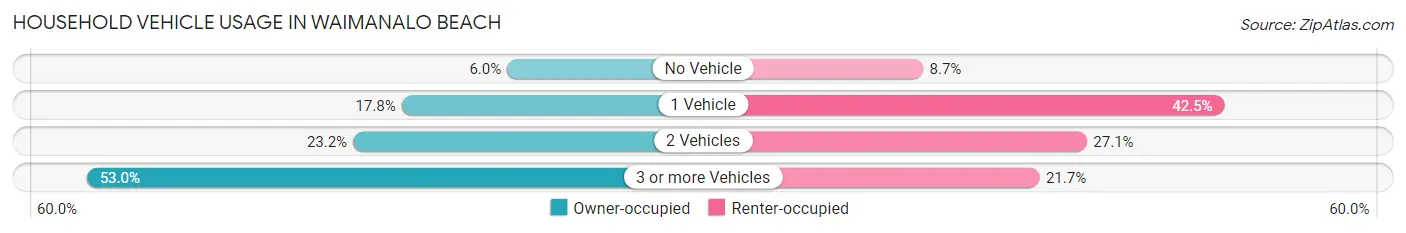
| Vehicles per Household | Owner-occupied | Renter-occupied |
| No Vehicle | 56 (6.0%) | 18 (8.7%) |
| 1 Vehicle | 167 (17.8%) | 88 (42.5%) |
| 2 Vehicles | 218 (23.2%) | 56 (27.1%) |
| 3 or more Vehicles | 498 (53.0%) | 45 (21.7%) |
| Total | 939 (100.0%) | 207 (100.0%) |
Real Estate & Mortgages in Waimanalo Beach
Real Estate and Mortgage Overview in Waimanalo Beach
| Characteristic | Without Mortgage | With Mortgage |
| Housing Units | 502 | 437 |
| Median Property Value | $802,100 | $742,800 |
| Median Household Income | $119,722 | $184 |
| Monthly Housing Costs | $497 | $108 |
| Real Estate Taxes | $375 | $68 |
Property Value by Mortgage Status in Waimanalo Beach
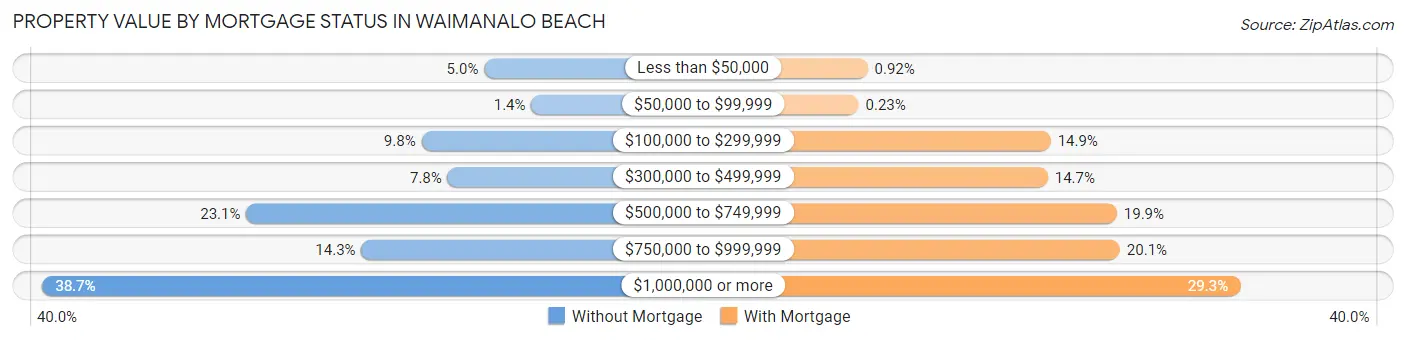
| Property Value | Without Mortgage | With Mortgage |
| Less than $50,000 | 25 (5.0%) | 4 (0.9%) |
| $50,000 to $99,999 | 7 (1.4%) | 1 (0.2%) |
| $100,000 to $299,999 | 49 (9.8%) | 65 (14.9%) |
| $300,000 to $499,999 | 39 (7.8%) | 64 (14.6%) |
| $500,000 to $749,999 | 116 (23.1%) | 87 (19.9%) |
| $750,000 to $999,999 | 72 (14.3%) | 88 (20.1%) |
| $1,000,000 or more | 194 (38.7%) | 128 (29.3%) |
| Total | 502 (100.0%) | 437 (100.0%) |
Household Income by Mortgage Status in Waimanalo Beach
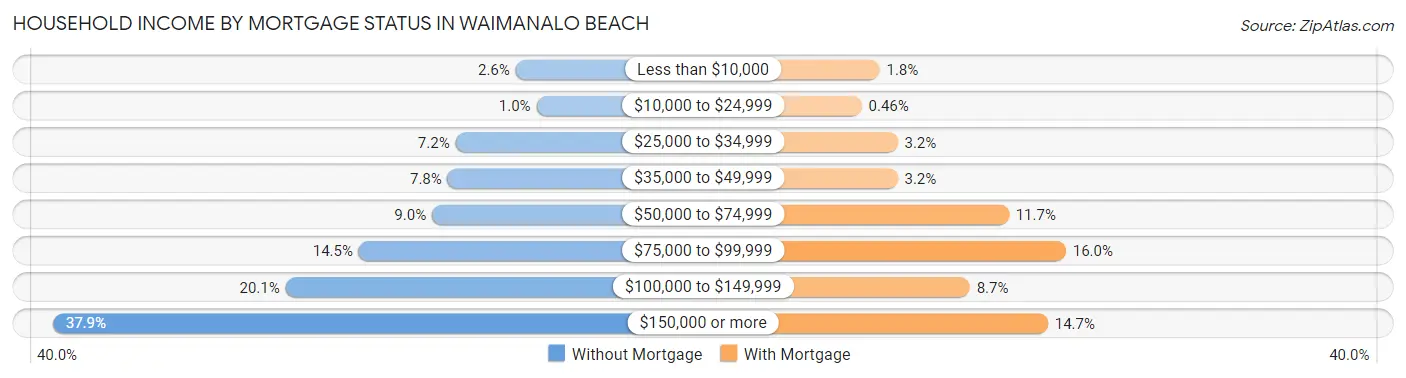
| Household Income | Without Mortgage | With Mortgage |
| Less than $10,000 | 13 (2.6%) | 8 (1.8%) |
| $10,000 to $24,999 | 5 (1.0%) | 2 (0.5%) |
| $25,000 to $34,999 | 36 (7.2%) | 14 (3.2%) |
| $35,000 to $49,999 | 39 (7.8%) | 14 (3.2%) |
| $50,000 to $74,999 | 45 (9.0%) | 51 (11.7%) |
| $75,000 to $99,999 | 73 (14.5%) | 70 (16.0%) |
| $100,000 to $149,999 | 101 (20.1%) | 38 (8.7%) |
| $150,000 or more | 190 (37.9%) | 64 (14.6%) |
| Total | 502 (100.0%) | 437 (100.0%) |
Property Value to Household Income Ratio in Waimanalo Beach
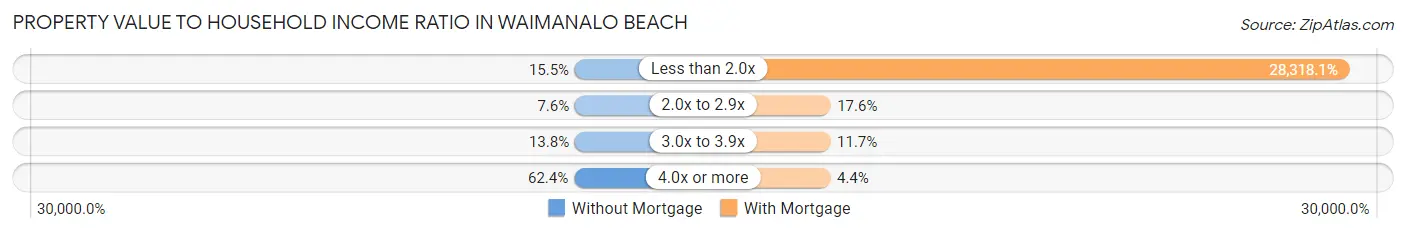
| Value-to-Income Ratio | Without Mortgage | With Mortgage |
| Less than 2.0x | 78 (15.5%) | 123,750 (28,318.1%) |
| 2.0x to 2.9x | 38 (7.6%) | 77 (17.6%) |
| 3.0x to 3.9x | 69 (13.8%) | 51 (11.7%) |
| 4.0x or more | 313 (62.4%) | 19 (4.3%) |
| Total | 502 (100.0%) | 437 (100.0%) |
Real Estate Taxes by Mortgage Status in Waimanalo Beach
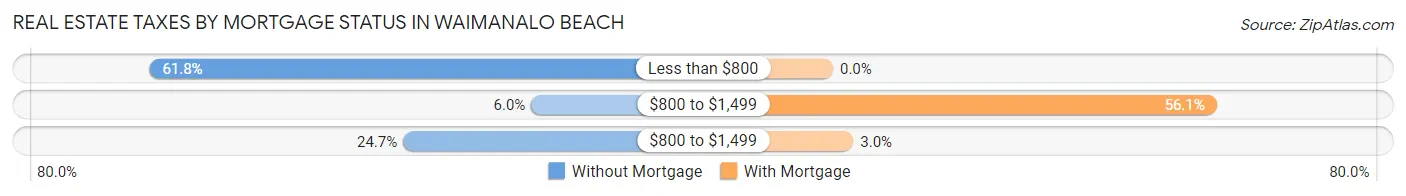
| Property Taxes | Without Mortgage | With Mortgage |
| Less than $800 | 310 (61.8%) | 0 (0.0%) |
| $800 to $1,499 | 30 (6.0%) | 245 (56.1%) |
| $800 to $1,499 | 124 (24.7%) | 13 (3.0%) |
| Total | 502 (100.0%) | 437 (100.0%) |
Health & Disability in Waimanalo Beach
Health Insurance Coverage by Age in Waimanalo Beach
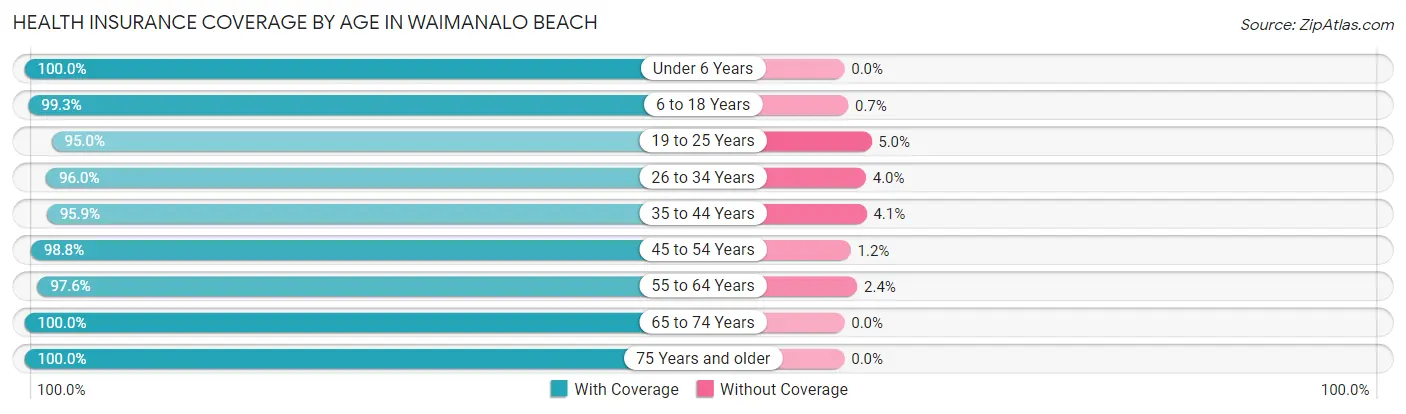
| Age Bracket | With Coverage | Without Coverage |
| Under 6 Years | 242 (100.0%) | 0 (0.0%) |
| 6 to 18 Years | 714 (99.3%) | 5 (0.7%) |
| 19 to 25 Years | 321 (95.0%) | 17 (5.0%) |
| 26 to 34 Years | 383 (96.0%) | 16 (4.0%) |
| 35 to 44 Years | 441 (95.9%) | 19 (4.1%) |
| 45 to 54 Years | 587 (98.8%) | 7 (1.2%) |
| 55 to 64 Years | 573 (97.6%) | 14 (2.4%) |
| 65 to 74 Years | 572 (100.0%) | 0 (0.0%) |
| 75 Years and older | 546 (100.0%) | 0 (0.0%) |
| Total | 4,379 (98.3%) | 78 (1.8%) |
Health Insurance Coverage by Citizenship Status in Waimanalo Beach
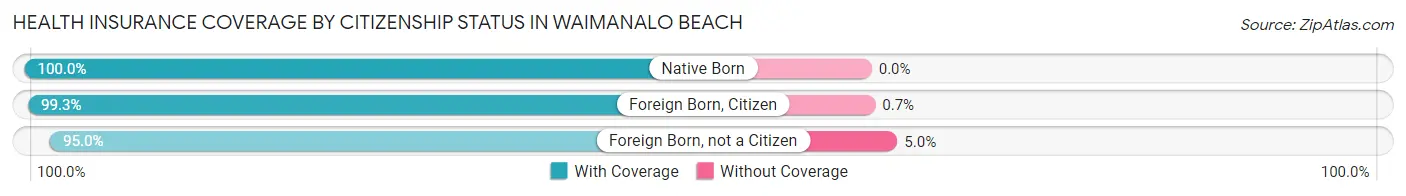
| Citizenship Status | With Coverage | Without Coverage |
| Native Born | 242 (100.0%) | 0 (0.0%) |
| Foreign Born, Citizen | 714 (99.3%) | 5 (0.7%) |
| Foreign Born, not a Citizen | 321 (95.0%) | 17 (5.0%) |
Health Insurance Coverage by Household Income in Waimanalo Beach
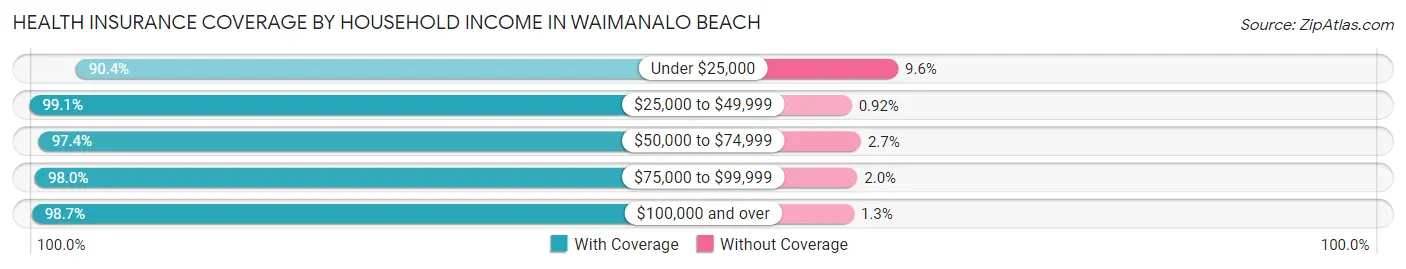
| Household Income | With Coverage | Without Coverage |
| Under $25,000 | 141 (90.4%) | 15 (9.6%) |
| $25,000 to $49,999 | 431 (99.1%) | 4 (0.9%) |
| $50,000 to $74,999 | 368 (97.4%) | 10 (2.6%) |
| $75,000 to $99,999 | 348 (98.0%) | 7 (2.0%) |
| $100,000 and over | 3,091 (98.7%) | 42 (1.3%) |
Public vs Private Health Insurance Coverage by Age in Waimanalo Beach
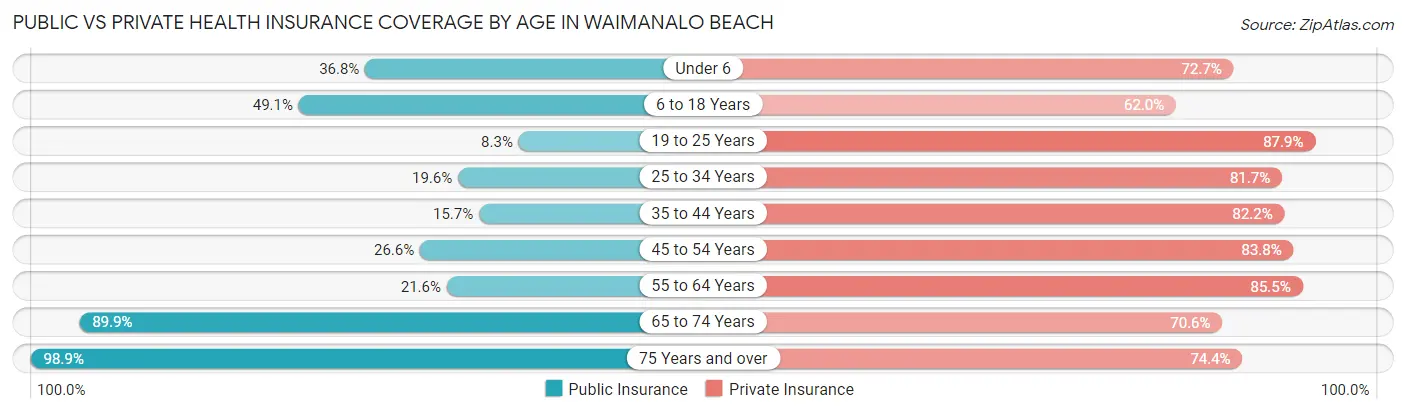
| Age Bracket | Public Insurance | Private Insurance |
| Under 6 | 89 (36.8%) | 176 (72.7%) |
| 6 to 18 Years | 353 (49.1%) | 446 (62.0%) |
| 19 to 25 Years | 28 (8.3%) | 297 (87.9%) |
| 25 to 34 Years | 78 (19.6%) | 326 (81.7%) |
| 35 to 44 Years | 72 (15.7%) | 378 (82.2%) |
| 45 to 54 Years | 158 (26.6%) | 498 (83.8%) |
| 55 to 64 Years | 127 (21.6%) | 502 (85.5%) |
| 65 to 74 Years | 514 (89.9%) | 404 (70.6%) |
| 75 Years and over | 540 (98.9%) | 406 (74.4%) |
| Total | 1,959 (44.0%) | 3,433 (77.0%) |
Disability Status by Sex by Age in Waimanalo Beach
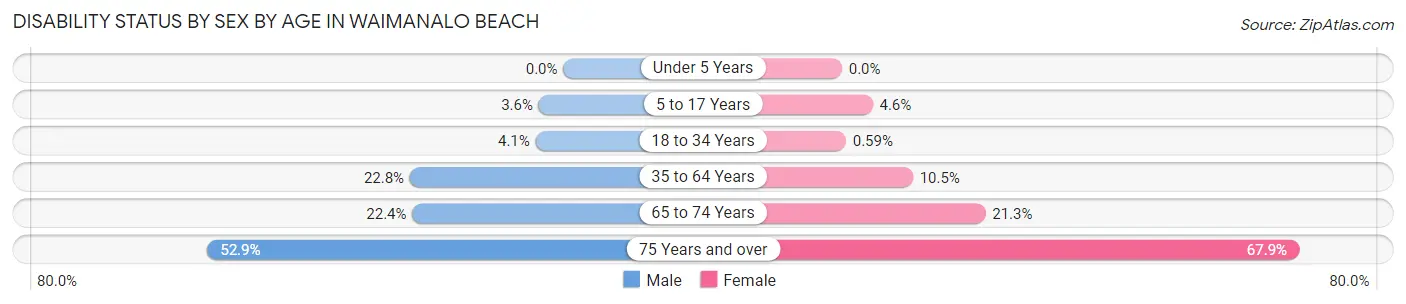
| Age Bracket | Male | Female |
| Under 5 Years | 0 (0.0%) | 0 (0.0%) |
| 5 to 17 Years | 13 (3.6%) | 15 (4.6%) |
| 18 to 34 Years | 19 (4.1%) | 2 (0.6%) |
| 35 to 64 Years | 190 (22.8%) | 85 (10.5%) |
| 65 to 74 Years | 63 (22.4%) | 62 (21.3%) |
| 75 Years and over | 83 (52.9%) | 264 (67.9%) |
Disability Class by Sex by Age in Waimanalo Beach
Disability Class: Hearing Difficulty
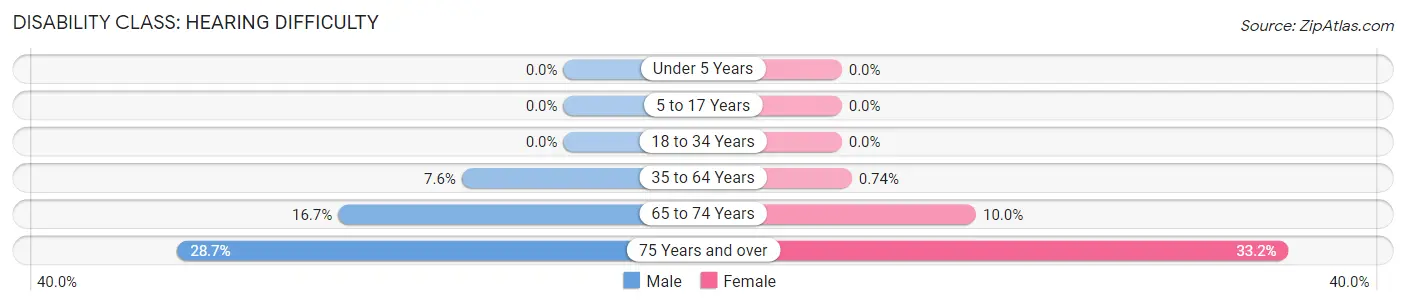
| Age Bracket | Male | Female |
| Under 5 Years | 0 (0.0%) | 0 (0.0%) |
| 5 to 17 Years | 0 (0.0%) | 0 (0.0%) |
| 18 to 34 Years | 0 (0.0%) | 0 (0.0%) |
| 35 to 64 Years | 63 (7.5%) | 6 (0.7%) |
| 65 to 74 Years | 47 (16.7%) | 29 (10.0%) |
| 75 Years and over | 45 (28.7%) | 129 (33.2%) |
Disability Class: Vision Difficulty
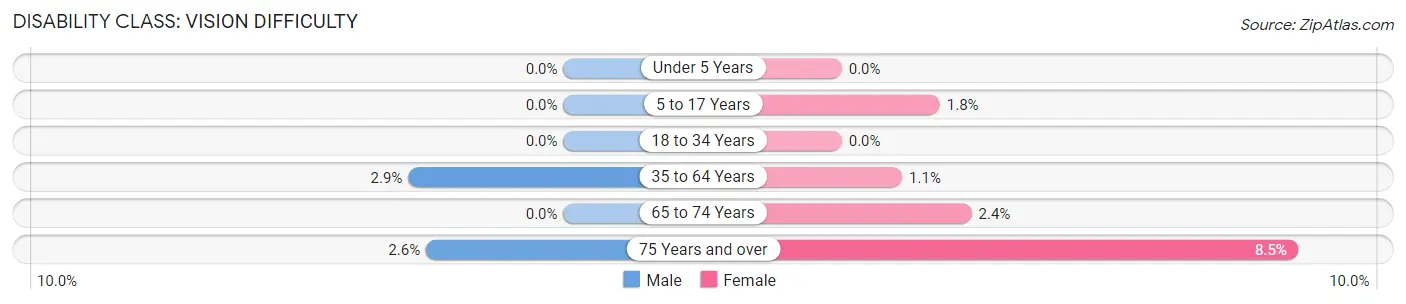
| Age Bracket | Male | Female |
| Under 5 Years | 0 (0.0%) | 0 (0.0%) |
| 5 to 17 Years | 0 (0.0%) | 6 (1.8%) |
| 18 to 34 Years | 0 (0.0%) | 0 (0.0%) |
| 35 to 64 Years | 24 (2.9%) | 9 (1.1%) |
| 65 to 74 Years | 0 (0.0%) | 7 (2.4%) |
| 75 Years and over | 4 (2.5%) | 33 (8.5%) |
Disability Class: Cognitive Difficulty
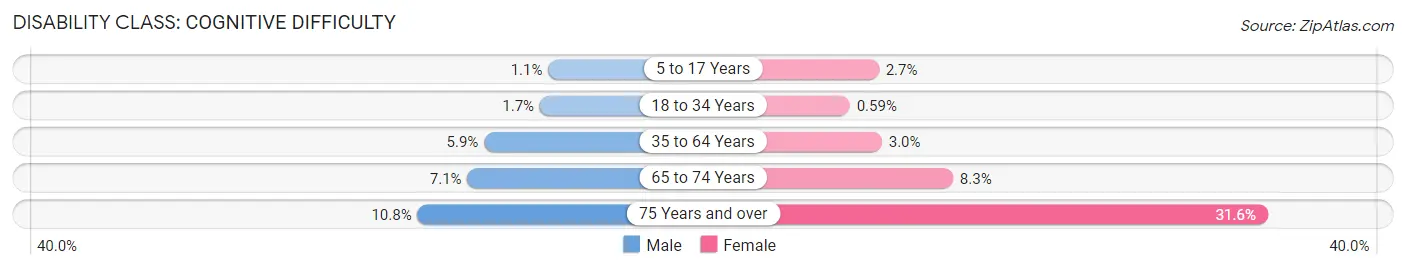
| Age Bracket | Male | Female |
| 5 to 17 Years | 4 (1.1%) | 9 (2.7%) |
| 18 to 34 Years | 8 (1.7%) | 2 (0.6%) |
| 35 to 64 Years | 49 (5.9%) | 24 (3.0%) |
| 65 to 74 Years | 20 (7.1%) | 24 (8.3%) |
| 75 Years and over | 17 (10.8%) | 123 (31.6%) |
Disability Class: Ambulatory Difficulty
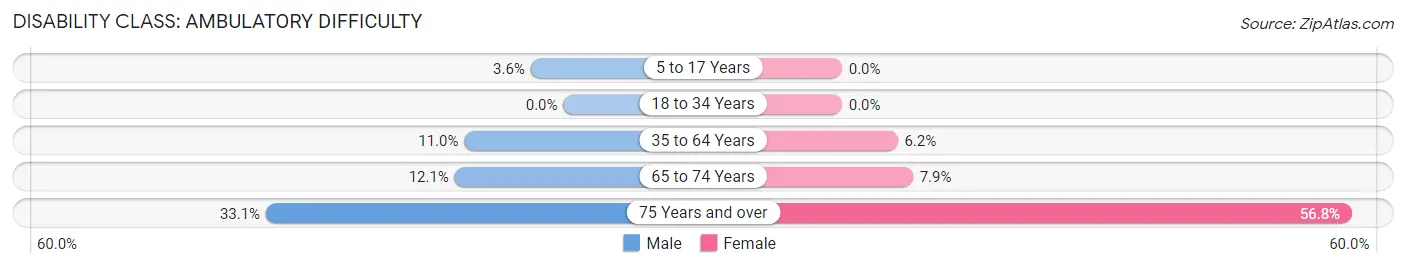
| Age Bracket | Male | Female |
| 5 to 17 Years | 13 (3.6%) | 0 (0.0%) |
| 18 to 34 Years | 0 (0.0%) | 0 (0.0%) |
| 35 to 64 Years | 92 (11.0%) | 50 (6.2%) |
| 65 to 74 Years | 34 (12.1%) | 23 (7.9%) |
| 75 Years and over | 52 (33.1%) | 221 (56.8%) |
Disability Class: Self-Care Difficulty
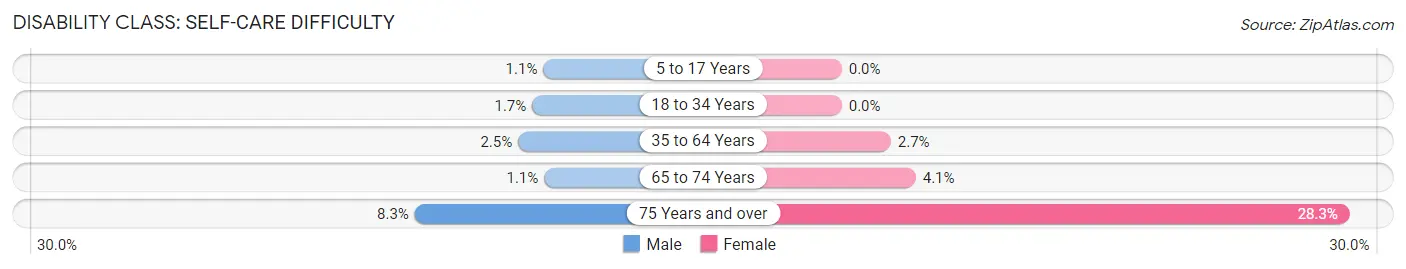
| Age Bracket | Male | Female |
| 5 to 17 Years | 4 (1.1%) | 0 (0.0%) |
| 18 to 34 Years | 8 (1.7%) | 0 (0.0%) |
| 35 to 64 Years | 21 (2.5%) | 22 (2.7%) |
| 65 to 74 Years | 3 (1.1%) | 12 (4.1%) |
| 75 Years and over | 13 (8.3%) | 110 (28.3%) |
Technology Access in Waimanalo Beach
Computing Device Access in Waimanalo Beach
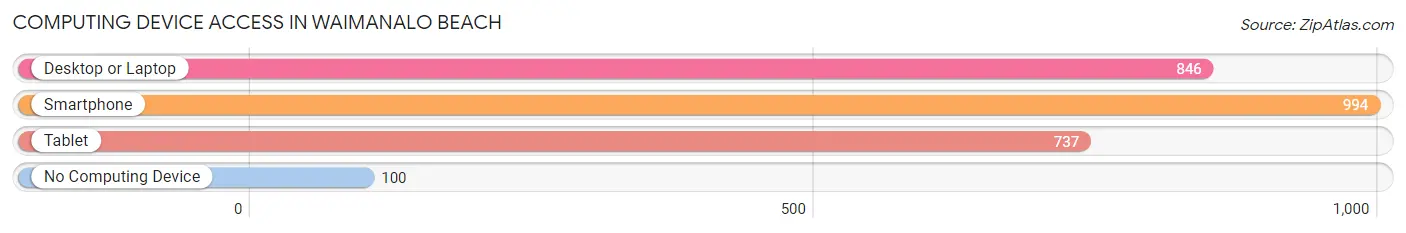
| Device Type | # Households | % Households |
| Desktop or Laptop | 846 | 73.8% |
| Smartphone | 994 | 86.7% |
| Tablet | 737 | 64.3% |
| No Computing Device | 100 | 8.7% |
| Total | 1,146 | 100.0% |
Internet Access in Waimanalo Beach
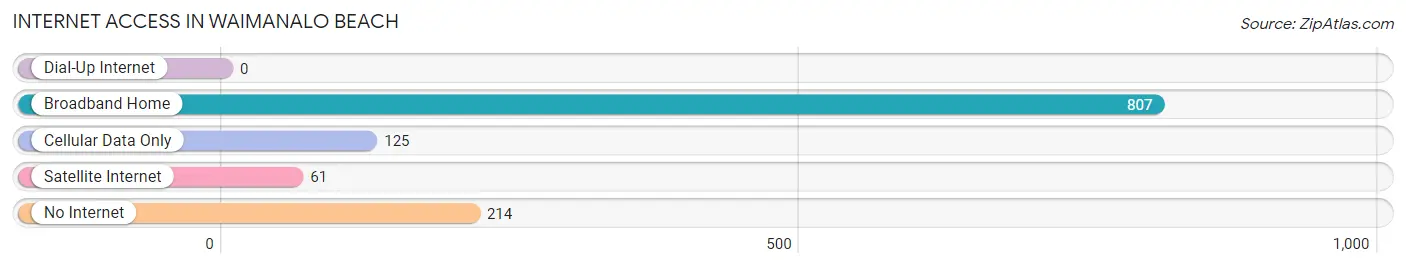
| Internet Type | # Households | % Households |
| Dial-Up Internet | 0 | 0.0% |
| Broadband Home | 807 | 70.4% |
| Cellular Data Only | 125 | 10.9% |
| Satellite Internet | 61 | 5.3% |
| No Internet | 214 | 18.7% |
| Total | 1,146 | 100.0% |
Waimanalo Beach Summary
Waimanalo Beach is a small beach community located on the eastern shore of Oahu, Hawaii. It is located about 20 miles east of Honolulu and is part of the City and County of Honolulu. The population of Waimanalo Beach was 4,711 at the 2010 census.
History
The area now known as Waimanalo Beach has been inhabited for centuries by the native Hawaiian people. The area was first settled by Europeans in the early 1800s, when missionaries and whalers began to arrive in the area. The area was originally known as Kailua, but the name was changed to Waimanalo in 1845. The name Waimanalo is derived from the Hawaiian words “wai” meaning “water” and “manalo” meaning “long”.
The area was used for agricultural purposes until the early 1900s, when the first beach resort was built. The resort was called Waimanalo Beach Hotel and it was a popular destination for tourists. The hotel was destroyed by a hurricane in the 1920s and was never rebuilt.
In the 1950s, the area began to be developed as a residential community. The first homes were built in the area in the late 1950s and early 1960s. The area has continued to grow and develop since then and is now a popular residential area.
Geography
Waimanalo Beach is located on the eastern shore of Oahu, Hawaii. It is located about 20 miles east of Honolulu and is part of the City and County of Honolulu. The area is bordered by the Waimanalo Bay to the north, the Pacific Ocean to the east, and the Ko’olau Mountains to the west.
The area is mostly flat and is composed of sandy beaches and low-lying hills. The climate in the area is tropical and humid, with temperatures ranging from the mid-70s to the mid-80s throughout the year.
Economy
The economy of Waimanalo Beach is largely based on tourism and agriculture. The area is home to several resorts and hotels, as well as a number of restaurants and shops. The area is also home to several farms, which produce a variety of fruits and vegetables.
The area is also home to several military bases, including the Marine Corps Base Hawaii and the Naval Air Station Kaneohe Bay. These bases provide a significant number of jobs to the local economy.
Demographics
As of the 2010 census, the population of Waimanalo Beach was 4,711. The racial makeup of the area was 57.3% White, 11.2% Native Hawaiian or Pacific Islander, 8.2% Asian, 0.7% Black or African American, 0.3% from other races, and 22.5% from two or more races.
The median household income in the area was $63,917, and the median family income was $71,917. The per capita income in the area was $25,917. The unemployment rate in the area was 4.2%.
Conclusion
Waimanalo Beach is a small beach community located on the eastern shore of Oahu, Hawaii. It is located about 20 miles east of Honolulu and is part of the City and County of Honolulu. The area has a long history of settlement by native Hawaiians and Europeans, and has been a popular residential area since the 1950s. The economy of the area is largely based on tourism and agriculture, and the area is home to several military bases. The population of Waimanalo Beach was 4,711 at the 2010 census, and the median household income was $63,917.
Common Questions
What is Per Capita Income in Waimanalo Beach?
Per Capita income in Waimanalo Beach is $37,482.
What is the Median Family Income in Waimanalo Beach?
Median Family Income in Waimanalo Beach is $117,969.
What is the Median Household income in Waimanalo Beach?
Median Household Income in Waimanalo Beach is $104,643.
What is Income or Wage Gap in Waimanalo Beach?
Income or Wage Gap in Waimanalo Beach is 1.4%.
Women in Waimanalo Beach earn 98.6 cents for every dollar earned by a man.
What is Inequality or Gini Index in Waimanalo Beach?
Inequality or Gini Index in Waimanalo Beach is 0.46.
What is the Total Population of Waimanalo Beach?
Total Population of Waimanalo Beach is 4,475.
What is the Total Male Population of Waimanalo Beach?
Total Male Population of Waimanalo Beach is 2,215.
What is the Total Female Population of Waimanalo Beach?
Total Female Population of Waimanalo Beach is 2,260.
What is the Ratio of Males per 100 Females in Waimanalo Beach?
There are 98.01 Males per 100 Females in Waimanalo Beach.
What is the Ratio of Females per 100 Males in Waimanalo Beach?
There are 102.03 Females per 100 Males in Waimanalo Beach.
What is the Median Population Age in Waimanalo Beach?
Median Population Age in Waimanalo Beach is 46.5 Years.
What is the Average Family Size in Waimanalo Beach
Average Family Size in Waimanalo Beach is 4.2 People.
What is the Average Household Size in Waimanalo Beach
Average Household Size in Waimanalo Beach is 3.9 People.
How Large is the Labor Force in Waimanalo Beach?
There are 2,161 People in the Labor Forcein in Waimanalo Beach.
What is the Percentage of People in the Labor Force in Waimanalo Beach?
58.1% of People are in the Labor Force in Waimanalo Beach.
What is the Unemployment Rate in Waimanalo Beach?
Unemployment Rate in Waimanalo Beach is 4.8%.