Waimea CDP Kauai County, HI Map & Demographics
Waimea CDP Kauai County Overview
$44,082
PER CAPITA INCOME
$111,250
AVG FAMILY INCOME
$95,972
AVG HOUSEHOLD INCOME
48.8%
WAGE / INCOME GAP [ % ]
51.2¢/ $1
WAGE / INCOME GAP [ $ ]
0.42
INEQUALITY / GINI INDEX
1,951
TOTAL POPULATION
892
MALE POPULATION
1,059
FEMALE POPULATION
84.23
MALES / 100 FEMALES
118.72
FEMALES / 100 MALES
44.1
MEDIAN AGE
3.7
AVG FAMILY SIZE
2.5
AVG HOUSEHOLD SIZE
1,095
LABOR FORCE [ PEOPLE ]
66.7%
PERCENT IN LABOR FORCE
4.8%
UNEMPLOYMENT RATE
Income in Waimea CDP Kauai County
Income Overview in Waimea CDP Kauai County
Per Capita Income in Waimea CDP Kauai County is $44,082, while median incomes of families and households are $111,250 and $95,972 respectively.
| Characteristic | Number | Measure |
| Per Capita Income | 1,951 | $44,082 |
| Median Family Income | 396 | $111,250 |
| Mean Family Income | 396 | $140,573 |
| Median Household Income | 747 | $95,972 |
| Mean Household Income | 747 | $106,552 |
| Income Deficit | 396 | $0 |
| Wage / Income Gap (%) | 1,951 | 48.77% |
| Wage / Income Gap ($) | 1,951 | 51.23¢ per $1 |
| Gini / Inequality Index | 1,951 | 0.42 |
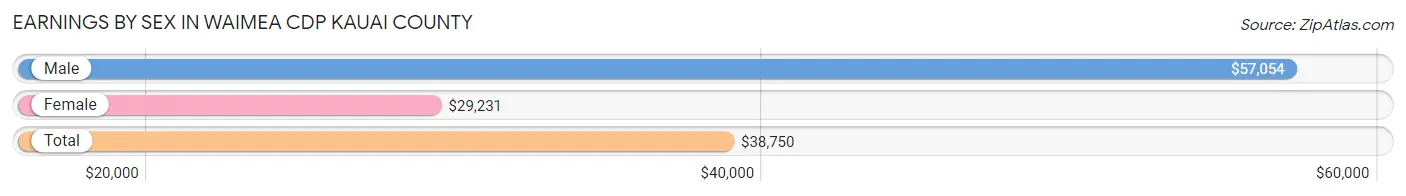
Earnings by Sex in Waimea CDP Kauai County
Average Earnings in Waimea CDP Kauai County are $38,750, $57,054 for men and $29,231 for women, a difference of 48.8%.
| Sex | Number | Average Earnings |
| Male | 551 (50.7%) | $57,054 |
| Female | 536 (49.3%) | $29,231 |
| Total | 1,087 (100.0%) | $38,750 |
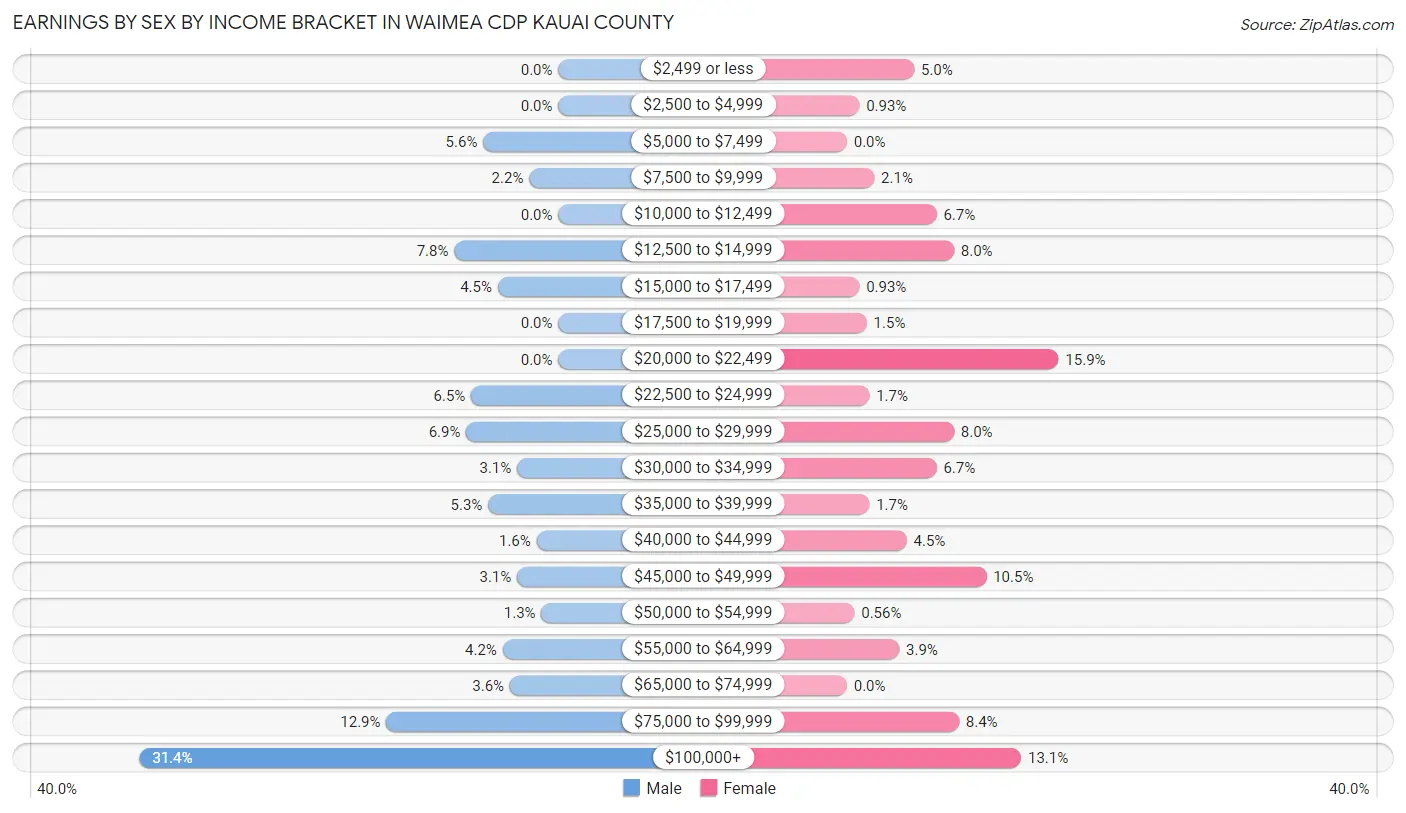
Earnings by Sex by Income Bracket in Waimea CDP Kauai County
The most common earnings brackets in Waimea CDP Kauai County are $100,000+ for men (173 | 31.4%) and $20,000 to $22,499 for women (85 | 15.9%).
| Income | Male | Female |
| $2,499 or less | 0 (0.0%) | 27 (5.0%) |
| $2,500 to $4,999 | 0 (0.0%) | 5 (0.9%) |
| $5,000 to $7,499 | 31 (5.6%) | 0 (0.0%) |
| $7,500 to $9,999 | 12 (2.2%) | 11 (2.1%) |
| $10,000 to $12,499 | 0 (0.0%) | 36 (6.7%) |
| $12,500 to $14,999 | 43 (7.8%) | 43 (8.0%) |
| $15,000 to $17,499 | 25 (4.5%) | 5 (0.9%) |
| $17,500 to $19,999 | 0 (0.0%) | 8 (1.5%) |
| $20,000 to $22,499 | 0 (0.0%) | 85 (15.9%) |
| $22,500 to $24,999 | 36 (6.5%) | 9 (1.7%) |
| $25,000 to $29,999 | 38 (6.9%) | 43 (8.0%) |
| $30,000 to $34,999 | 17 (3.1%) | 36 (6.7%) |
| $35,000 to $39,999 | 29 (5.3%) | 9 (1.7%) |
| $40,000 to $44,999 | 9 (1.6%) | 24 (4.5%) |
| $45,000 to $49,999 | 17 (3.1%) | 56 (10.4%) |
| $50,000 to $54,999 | 7 (1.3%) | 3 (0.6%) |
| $55,000 to $64,999 | 23 (4.2%) | 21 (3.9%) |
| $65,000 to $74,999 | 20 (3.6%) | 0 (0.0%) |
| $75,000 to $99,999 | 71 (12.9%) | 45 (8.4%) |
| $100,000+ | 173 (31.4%) | 70 (13.1%) |
| Total | 551 (100.0%) | 536 (100.0%) |
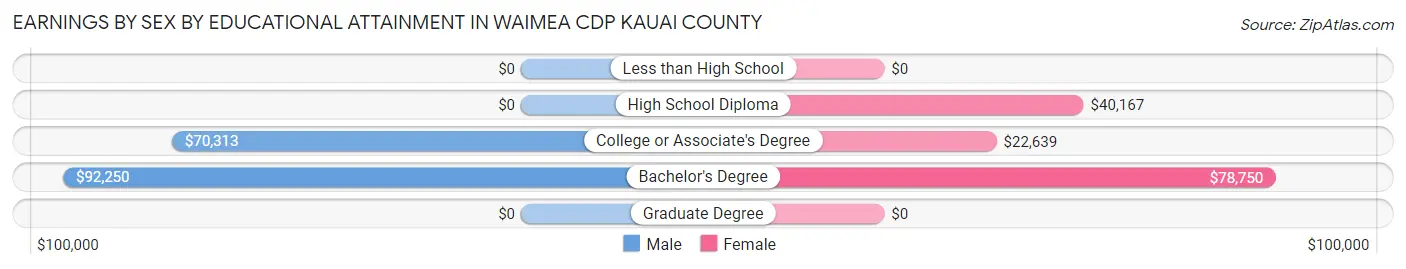
Earnings by Sex by Educational Attainment in Waimea CDP Kauai County
Average earnings in Waimea CDP Kauai County are $70,625 for men and $32,969 for women, a difference of 53.3%. Men with an educational attainment of bachelor's degree enjoy the highest average annual earnings of $92,250, while those with college or associate's degree education earn the least with $70,313. Women with an educational attainment of bachelor's degree earn the most with the average annual earnings of $78,750, while those with college or associate's degree education have the smallest earnings of $22,639.
| Educational Attainment | Male Income | Female Income |
| Less than High School | - | - |
| High School Diploma | - | - |
| College or Associate's Degree | $70,313 | $22,639 |
| Bachelor's Degree | $92,250 | $78,750 |
| Graduate Degree | - | - |
| Total | $70,625 | $32,969 |
Family Income in Waimea CDP Kauai County
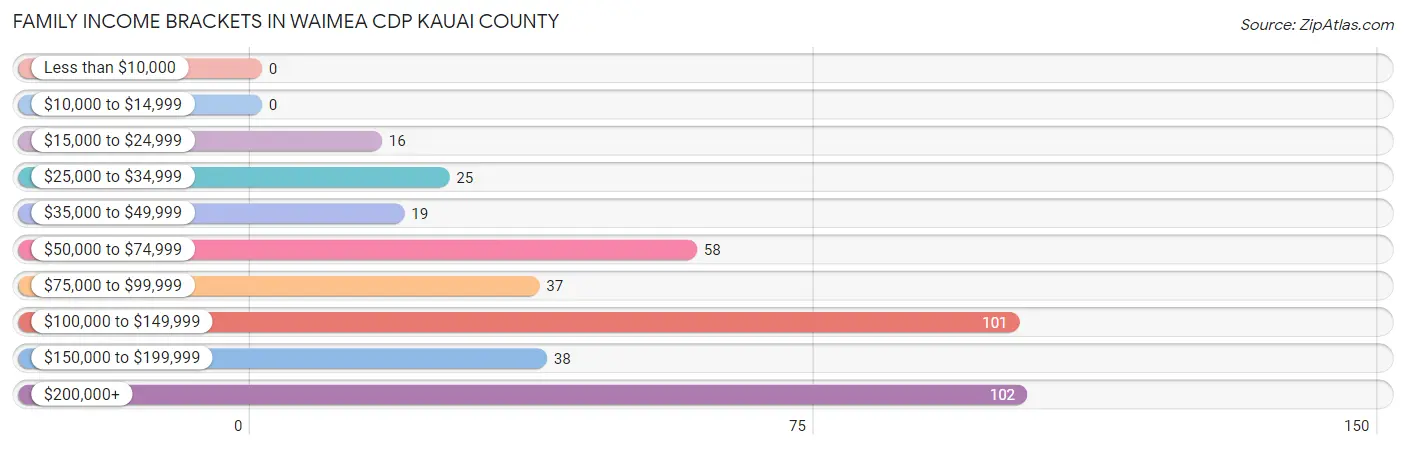
Family Income Brackets in Waimea CDP Kauai County
According to the Waimea CDP Kauai County family income data, there are 102 families falling into the $200,000+ income range, which is the most common income bracket and makes up 25.8% of all families.
| Income Bracket | # Families | % Families |
| Less than $10,000 | 0 | 0.0% |
| $10,000 to $14,999 | 0 | 0.0% |
| $15,000 to $24,999 | 16 | 4.0% |
| $25,000 to $34,999 | 25 | 6.3% |
| $35,000 to $49,999 | 19 | 4.8% |
| $50,000 to $74,999 | 58 | 14.6% |
| $75,000 to $99,999 | 37 | 9.3% |
| $100,000 to $149,999 | 101 | 25.5% |
| $150,000 to $199,999 | 38 | 9.6% |
| $200,000+ | 102 | 25.8% |
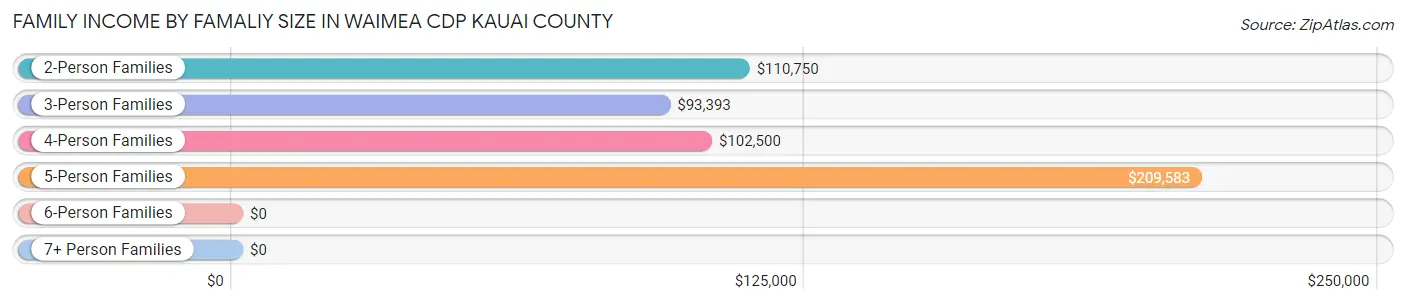
Family Income by Famaliy Size in Waimea CDP Kauai County
5-person families (47 | 11.9%) account for the highest median family income in Waimea CDP Kauai County with $209,583 per family, while 2-person families (190 | 48.0%) have the highest median income of $55,375 per family member.
| Income Bracket | # Families | Median Income |
| 2-Person Families | 190 (48.0%) | $110,750 |
| 3-Person Families | 60 (15.1%) | $93,393 |
| 4-Person Families | 72 (18.2%) | $102,500 |
| 5-Person Families | 47 (11.9%) | $209,583 |
| 6-Person Families | 23 (5.8%) | $0 |
| 7+ Person Families | 4 (1.0%) | $0 |
| Total | 396 (100.0%) | $111,250 |
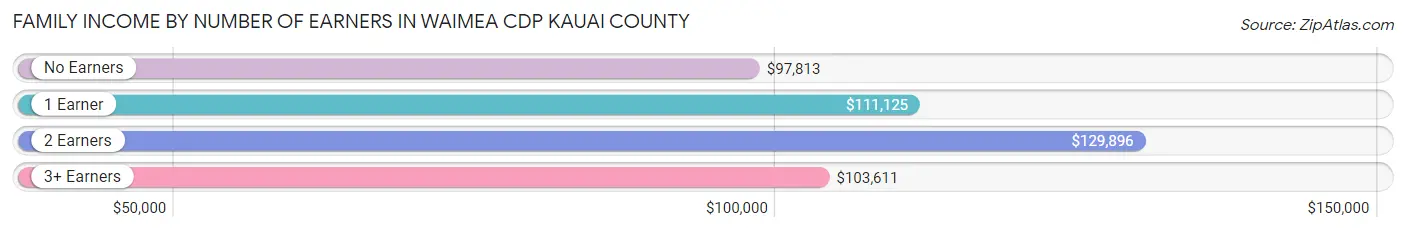
Family Income by Number of Earners in Waimea CDP Kauai County
The median family income in Waimea CDP Kauai County is $111,250, with families comprising 2 earners (151) having the highest median family income of $129,896, while families with no earners (44) have the lowest median family income of $97,813, accounting for 38.1% and 11.1% of families, respectively.
| Number of Earners | # Families | Median Income |
| No Earners | 44 (11.1%) | $97,813 |
| 1 Earner | 131 (33.1%) | $111,125 |
| 2 Earners | 151 (38.1%) | $129,896 |
| 3+ Earners | 70 (17.7%) | $103,611 |
| Total | 396 (100.0%) | $111,250 |
Household Income in Waimea CDP Kauai County
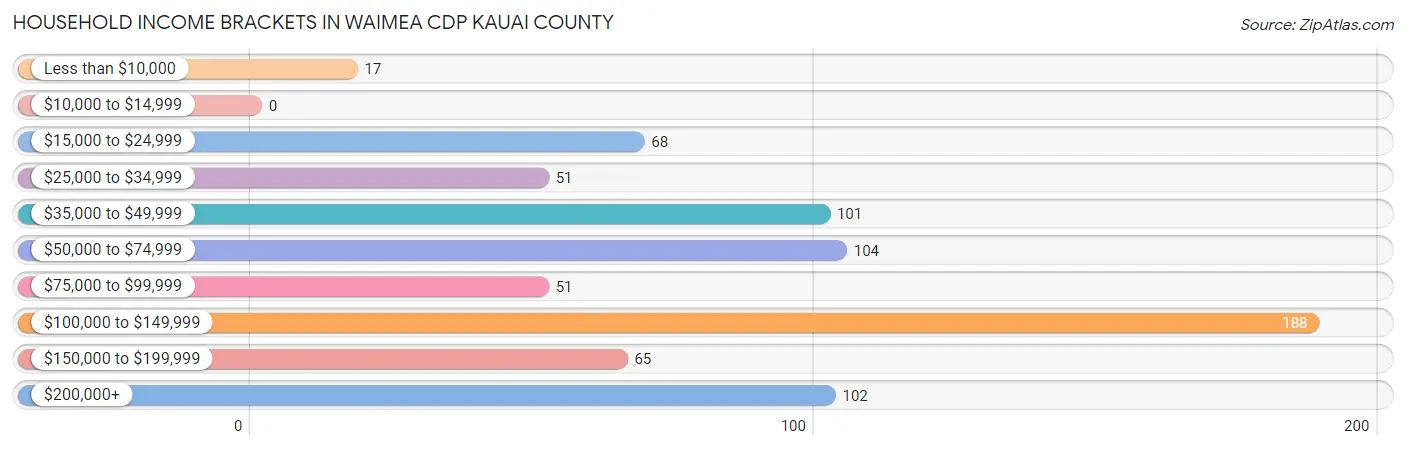
Household Income Brackets in Waimea CDP Kauai County
With 188 households falling in the category, the $100,000 to $149,999 income range is the most frequent in Waimea CDP Kauai County, accounting for 25.2% of all households.
| Income Bracket | # Households | % Households |
| Less than $10,000 | 17 | 2.3% |
| $10,000 to $14,999 | 0 | 0.0% |
| $15,000 to $24,999 | 68 | 9.1% |
| $25,000 to $34,999 | 51 | 6.8% |
| $35,000 to $49,999 | 101 | 13.5% |
| $50,000 to $74,999 | 104 | 13.9% |
| $75,000 to $99,999 | 51 | 6.8% |
| $100,000 to $149,999 | 188 | 25.2% |
| $150,000 to $199,999 | 65 | 8.7% |
| $200,000+ | 102 | 13.7% |
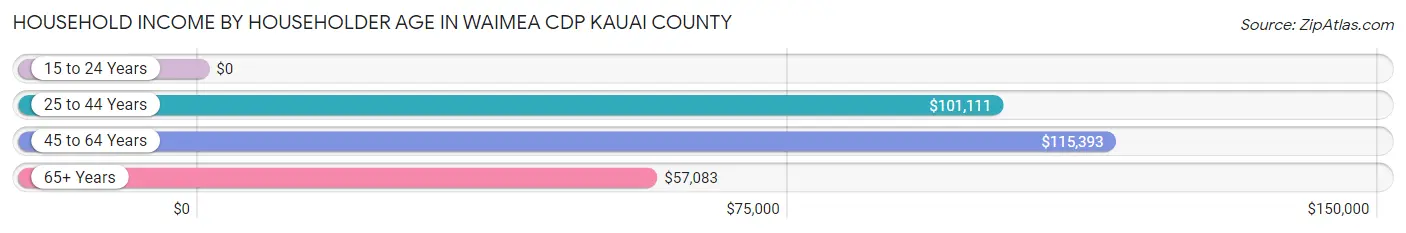
Household Income by Householder Age in Waimea CDP Kauai County
The median household income in Waimea CDP Kauai County is $95,972, with the highest median household income of $115,393 found in the 45 to 64 years age bracket for the primary householder. A total of 265 households (35.5%) fall into this category. Meanwhile, the 15 to 24 years age bracket for the primary householder has the lowest median household income of $0, with 16 households (2.1%) in this group.
| Income Bracket | # Households | Median Income |
| 15 to 24 Years | 16 (2.1%) | $0 |
| 25 to 44 Years | 186 (24.9%) | $101,111 |
| 45 to 64 Years | 265 (35.5%) | $115,393 |
| 65+ Years | 280 (37.5%) | $57,083 |
| Total | 747 (100.0%) | $95,972 |
Poverty in Waimea CDP Kauai County
Income Below Poverty by Sex and Age in Waimea CDP Kauai County
With 4.3% poverty level for males and 8.1% for females among the residents of Waimea CDP Kauai County, 18 to 24 year old males and 16 and 17 year old females are the most vulnerable to poverty, with 16 males (28.1%) and 32 females (84.2%) in their respective age groups living below the poverty level.
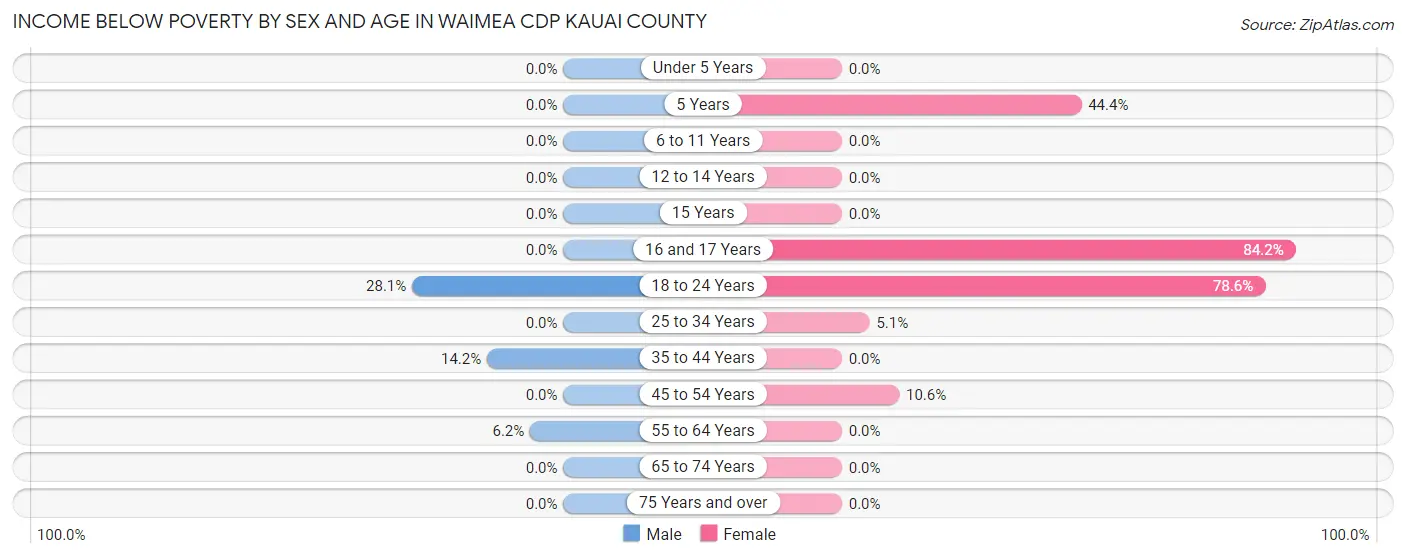
| Age Bracket | Male | Female |
| Under 5 Years | 0 (0.0%) | 0 (0.0%) |
| 5 Years | 0 (0.0%) | 8 (44.4%) |
| 6 to 11 Years | 0 (0.0%) | 0 (0.0%) |
| 12 to 14 Years | 0 (0.0%) | 0 (0.0%) |
| 15 Years | 0 (0.0%) | 0 (0.0%) |
| 16 and 17 Years | 0 (0.0%) | 32 (84.2%) |
| 18 to 24 Years | 16 (28.1%) | 22 (78.6%) |
| 25 to 34 Years | 0 (0.0%) | 9 (5.1%) |
| 35 to 44 Years | 16 (14.2%) | 0 (0.0%) |
| 45 to 54 Years | 0 (0.0%) | 12 (10.6%) |
| 55 to 64 Years | 5 (6.2%) | 0 (0.0%) |
| 65 to 74 Years | 0 (0.0%) | 0 (0.0%) |
| 75 Years and over | 0 (0.0%) | 0 (0.0%) |
| Total | 37 (4.3%) | 83 (8.1%) |
Income Above Poverty by Sex and Age in Waimea CDP Kauai County
According to the poverty statistics in Waimea CDP Kauai County, males aged under 5 years and females aged under 5 years are the age groups that are most secure financially, with 100.0% of males and 100.0% of females in these age groups living above the poverty line.
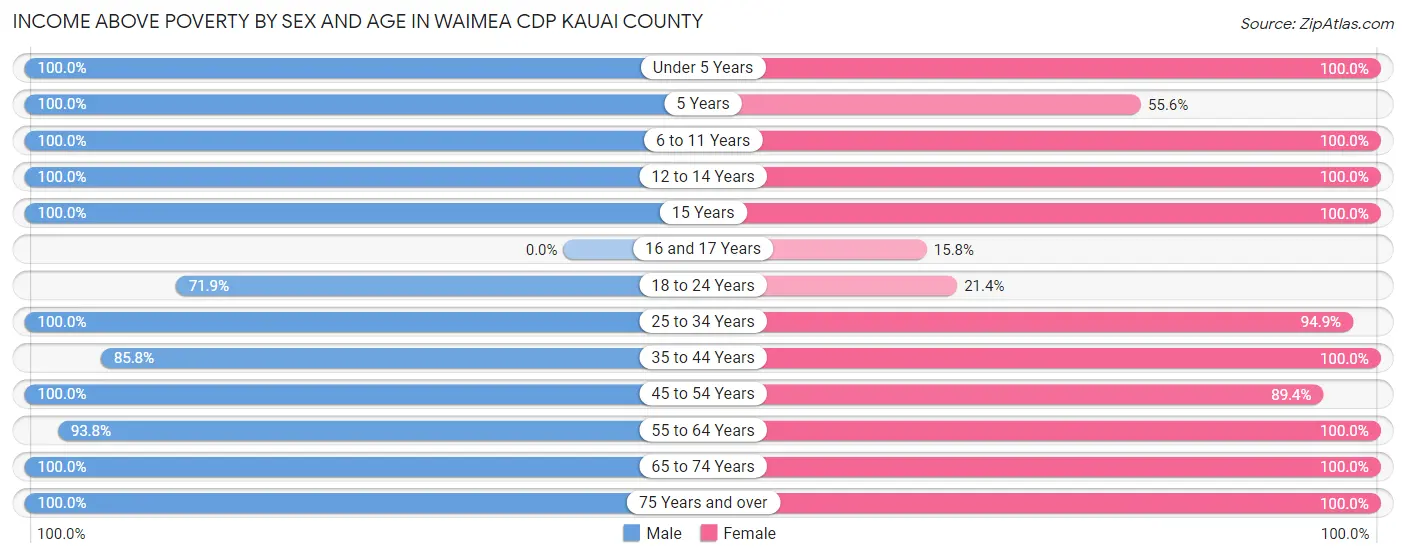
| Age Bracket | Male | Female |
| Under 5 Years | 56 (100.0%) | 10 (100.0%) |
| 5 Years | 14 (100.0%) | 10 (55.6%) |
| 6 to 11 Years | 34 (100.0%) | 97 (100.0%) |
| 12 to 14 Years | 11 (100.0%) | 37 (100.0%) |
| 15 Years | 11 (100.0%) | 21 (100.0%) |
| 16 and 17 Years | 0 (0.0%) | 6 (15.8%) |
| 18 to 24 Years | 41 (71.9%) | 6 (21.4%) |
| 25 to 34 Years | 186 (100.0%) | 166 (94.9%) |
| 35 to 44 Years | 97 (85.8%) | 113 (100.0%) |
| 45 to 54 Years | 123 (100.0%) | 101 (89.4%) |
| 55 to 64 Years | 76 (93.8%) | 150 (100.0%) |
| 65 to 74 Years | 126 (100.0%) | 156 (100.0%) |
| 75 Years and over | 58 (100.0%) | 66 (100.0%) |
| Total | 833 (95.8%) | 939 (91.9%) |
Income Below Poverty Among Married-Couple Families in Waimea CDP Kauai County
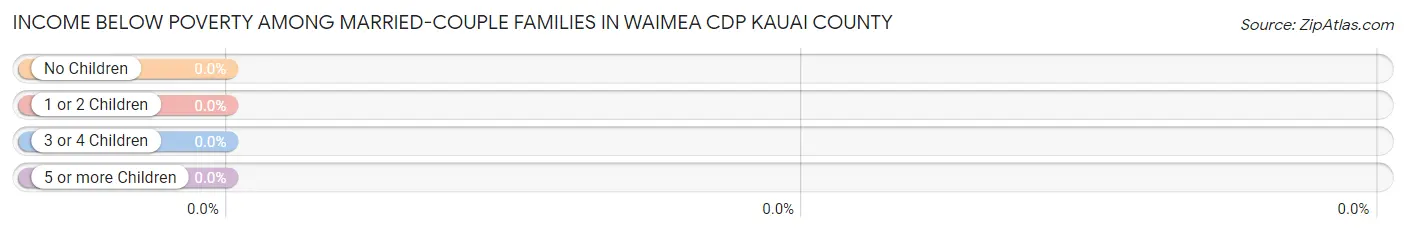
| Children | Above Poverty | Below Poverty |
| No Children | 171 (100.0%) | 0 (0.0%) |
| 1 or 2 Children | 59 (100.0%) | 0 (0.0%) |
| 3 or 4 Children | 13 (100.0%) | 0 (0.0%) |
| 5 or more Children | 0 (0.0%) | 0 (0.0%) |
| Total | 243 (100.0%) | 0 (0.0%) |
Income Below Poverty Among Single-Parent Households in Waimea CDP Kauai County
According to the poverty data in Waimea CDP Kauai County, 29.6% or 16 single-father households and 9.1% or 9 single-mother households are living below the poverty line. Among single-father households, those with no children have the highest poverty rate, with 16 households (39.0%) experiencing poverty. Likewise, among single-mother households, those with 3 or 4 children have the highest poverty rate, with 9 households (34.6%) falling below the poverty line.
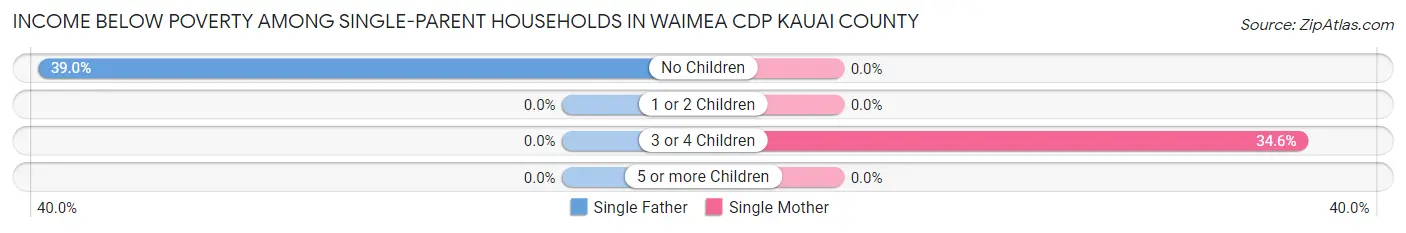
| Children | Single Father | Single Mother |
| No Children | 16 (39.0%) | 0 (0.0%) |
| 1 or 2 Children | 0 (0.0%) | 0 (0.0%) |
| 3 or 4 Children | 0 (0.0%) | 9 (34.6%) |
| 5 or more Children | 0 (0.0%) | 0 (0.0%) |
| Total | 16 (29.6%) | 9 (9.1%) |
Income Below Poverty Among Married-Couple vs Single-Parent Households in Waimea CDP Kauai County
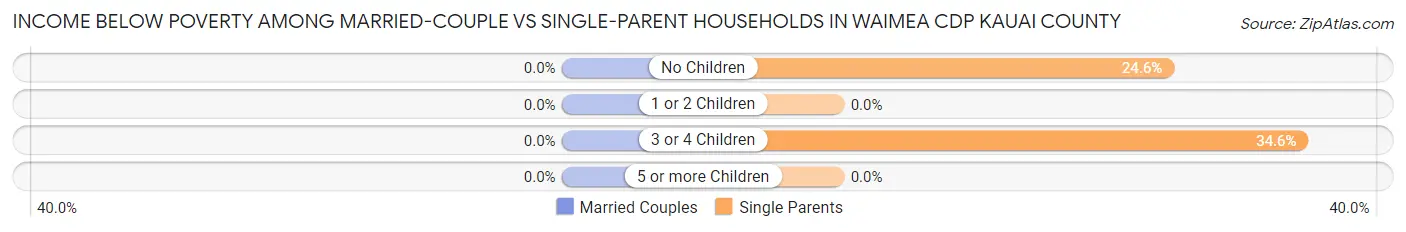
| Children | Married-Couple Families | Single-Parent Households |
| No Children | 0 (0.0%) | 16 (24.6%) |
| 1 or 2 Children | 0 (0.0%) | 0 (0.0%) |
| 3 or 4 Children | 0 (0.0%) | 9 (34.6%) |
| 5 or more Children | 0 (0.0%) | 0 (0.0%) |
| Total | 0 (0.0%) | 25 (16.3%) |
Race in Waimea CDP Kauai County
The most populous races in Waimea CDP Kauai County are Asian (699 | 35.8%), Two or more Races (613 | 31.4%), and White / Caucasian (435 | 22.3%).
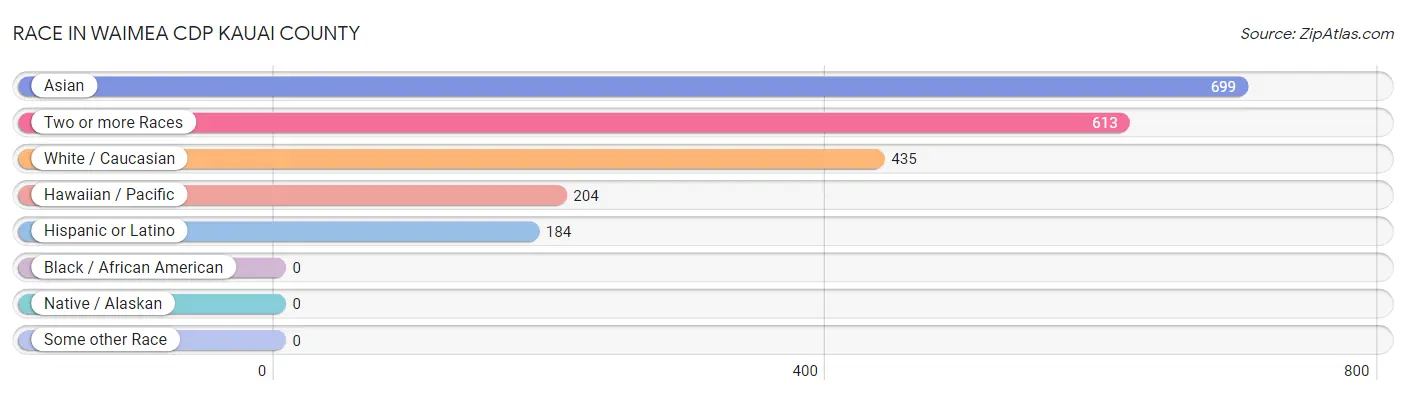
| Race | # Population | % Population |
| Asian | 699 | 35.8% |
| Black / African American | 0 | 0.0% |
| Hawaiian / Pacific | 204 | 10.5% |
| Hispanic or Latino | 184 | 9.4% |
| Native / Alaskan | 0 | 0.0% |
| White / Caucasian | 435 | 22.3% |
| Two or more Races | 613 | 31.4% |
| Some other Race | 0 | 0.0% |
| Total | 1,951 | 100.0% |
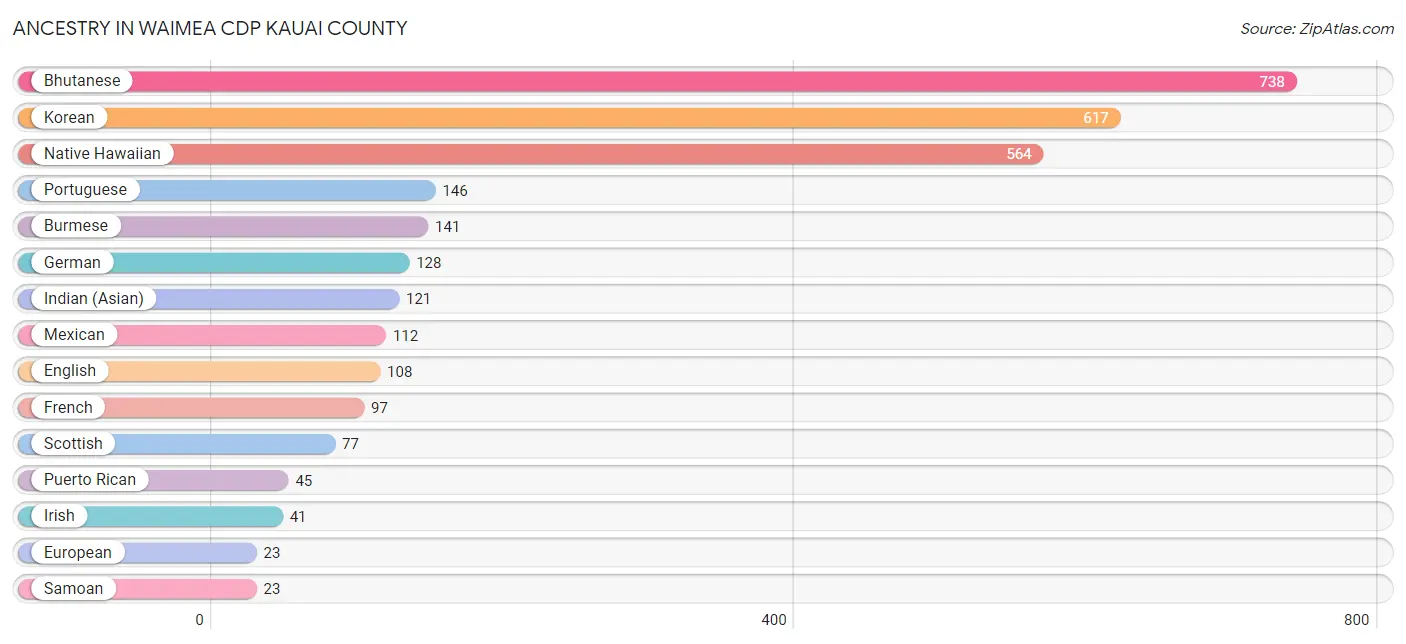
Ancestry in Waimea CDP Kauai County
The most populous ancestries reported in Waimea CDP Kauai County are Bhutanese (738 | 37.8%), Korean (617 | 31.6%), Native Hawaiian (564 | 28.9%), Portuguese (146 | 7.5%), and Burmese (141 | 7.2%), together accounting for 113.1% of all Waimea CDP Kauai County residents.
| Ancestry | # Population | % Population |
| American | 3 | 0.2% |
| Bhutanese | 738 | 37.8% |
| Burmese | 141 | 7.2% |
| Chinese | 20 | 1.0% |
| Czech | 21 | 1.1% |
| Dutch | 3 | 0.2% |
| English | 108 | 5.5% |
| European | 23 | 1.2% |
| French | 97 | 5.0% |
| German | 128 | 6.6% |
| Greek | 21 | 1.1% |
| Guamanian / Chamorro | 12 | 0.6% |
| Indian (Asian) | 121 | 6.2% |
| Irish | 41 | 2.1% |
| Iroquois | 7 | 0.4% |
| Italian | 9 | 0.5% |
| Korean | 617 | 31.6% |
| Mexican | 112 | 5.7% |
| Native Hawaiian | 564 | 28.9% |
| Northern European | 6 | 0.3% |
| Norwegian | 10 | 0.5% |
| Portuguese | 146 | 7.5% |
| Puerto Rican | 45 | 2.3% |
| Russian | 9 | 0.5% |
| Samoan | 23 | 1.2% |
| Scotch-Irish | 18 | 0.9% |
| Scottish | 77 | 4.0% |
| Spanish | 20 | 1.0% |
| Spanish American | 7 | 0.4% |
| Swedish | 3 | 0.2% | View All 30 Rows |
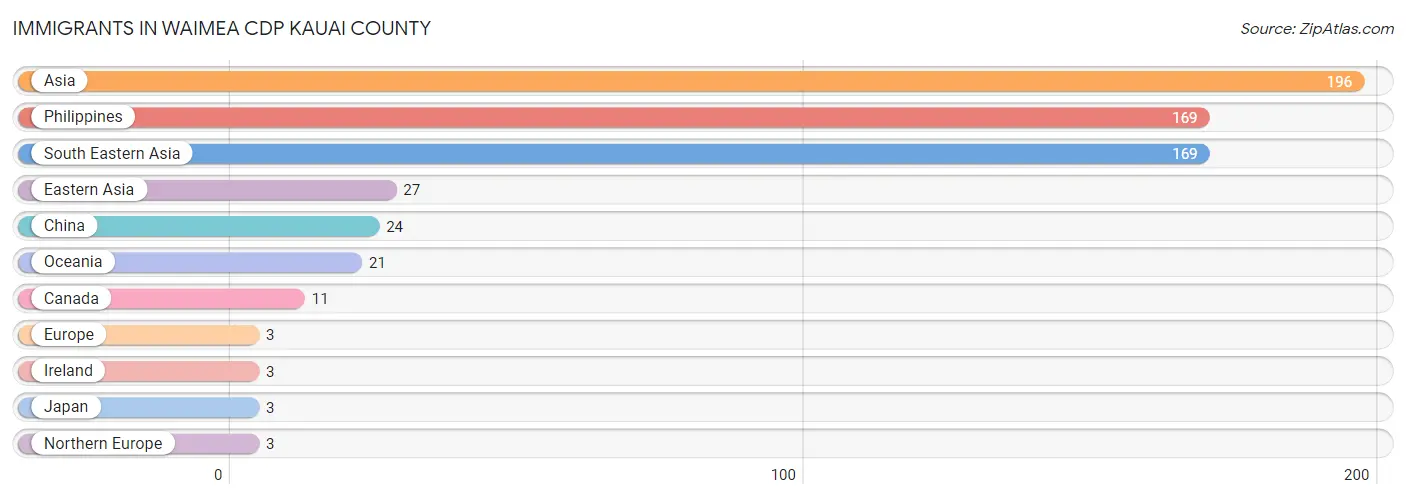
Immigrants in Waimea CDP Kauai County
The most numerous immigrant groups reported in Waimea CDP Kauai County came from Asia (196 | 10.1%), Philippines (169 | 8.7%), South Eastern Asia (169 | 8.7%), Eastern Asia (27 | 1.4%), and China (24 | 1.2%), together accounting for 30.0% of all Waimea CDP Kauai County residents.
| Immigration Origin | # Population | % Population |
| Asia | 196 | 10.1% |
| Canada | 11 | 0.6% |
| China | 24 | 1.2% |
| Eastern Asia | 27 | 1.4% |
| Europe | 3 | 0.2% |
| Ireland | 3 | 0.2% |
| Japan | 3 | 0.2% |
| Northern Europe | 3 | 0.2% |
| Oceania | 21 | 1.1% |
| Philippines | 169 | 8.7% |
| South Eastern Asia | 169 | 8.7% | View All 11 Rows |
Sex and Age in Waimea CDP Kauai County
Sex and Age in Waimea CDP Kauai County
The most populous age groups in Waimea CDP Kauai County are 30 to 34 Years (167 | 18.7%) for men and 30 to 34 Years (110 | 10.4%) for women.
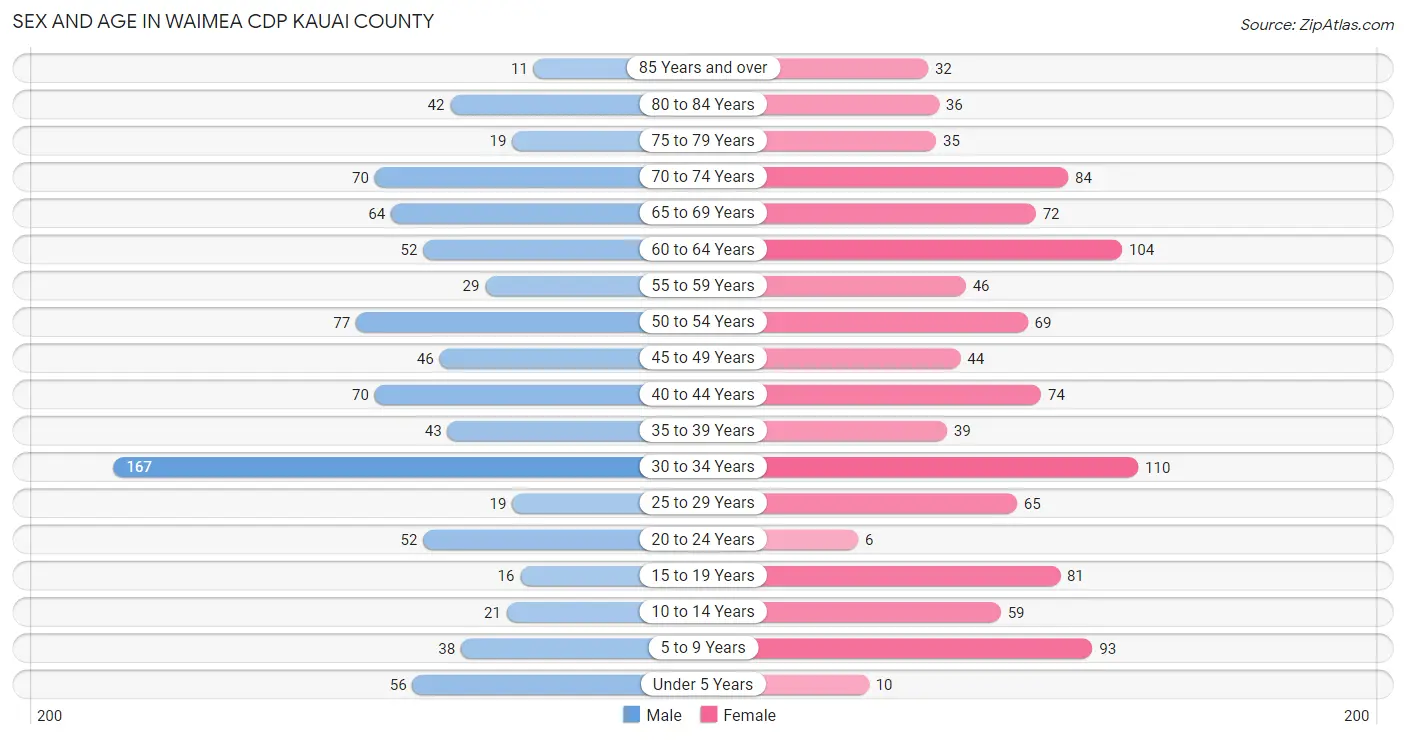
| Age Bracket | Male | Female |
| Under 5 Years | 56 (6.3%) | 10 (0.9%) |
| 5 to 9 Years | 38 (4.3%) | 93 (8.8%) |
| 10 to 14 Years | 21 (2.4%) | 59 (5.6%) |
| 15 to 19 Years | 16 (1.8%) | 81 (7.6%) |
| 20 to 24 Years | 52 (5.8%) | 6 (0.6%) |
| 25 to 29 Years | 19 (2.1%) | 65 (6.1%) |
| 30 to 34 Years | 167 (18.7%) | 110 (10.4%) |
| 35 to 39 Years | 43 (4.8%) | 39 (3.7%) |
| 40 to 44 Years | 70 (7.9%) | 74 (7.0%) |
| 45 to 49 Years | 46 (5.2%) | 44 (4.2%) |
| 50 to 54 Years | 77 (8.6%) | 69 (6.5%) |
| 55 to 59 Years | 29 (3.3%) | 46 (4.3%) |
| 60 to 64 Years | 52 (5.8%) | 104 (9.8%) |
| 65 to 69 Years | 64 (7.2%) | 72 (6.8%) |
| 70 to 74 Years | 70 (7.9%) | 84 (7.9%) |
| 75 to 79 Years | 19 (2.1%) | 35 (3.3%) |
| 80 to 84 Years | 42 (4.7%) | 36 (3.4%) |
| 85 Years and over | 11 (1.2%) | 32 (3.0%) |
| Total | 892 (100.0%) | 1,059 (100.0%) |
Families and Households in Waimea CDP Kauai County
Median Family Size in Waimea CDP Kauai County
The median family size in Waimea CDP Kauai County is 3.66 persons per family, with single female/mother families (99 | 25.0%) accounting for the largest median family size of 5 persons per family. On the other hand, single male/father families (54 | 13.6%) represent the smallest median family size with 2.31 persons per family.
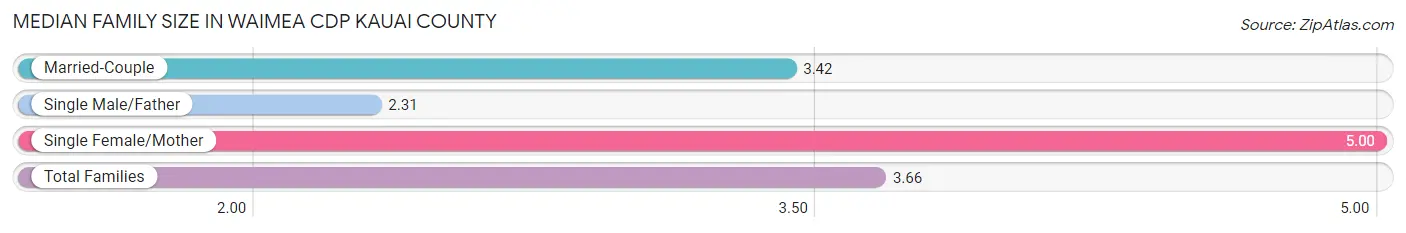
| Family Type | # Families | Family Size |
| Married-Couple | 243 (61.4%) | 3.42 |
| Single Male/Father | 54 (13.6%) | 2.31 |
| Single Female/Mother | 99 (25.0%) | 5.00 |
| Total Families | 396 (100.0%) | 3.66 |
Median Household Size in Waimea CDP Kauai County
The median household size in Waimea CDP Kauai County is 2.53 persons per household, with single female/mother households (99 | 13.3%) accounting for the largest median household size of 5.1 persons per household. non-family households (351 | 47.0%) represent the smallest median household size with 1.10 persons per household.
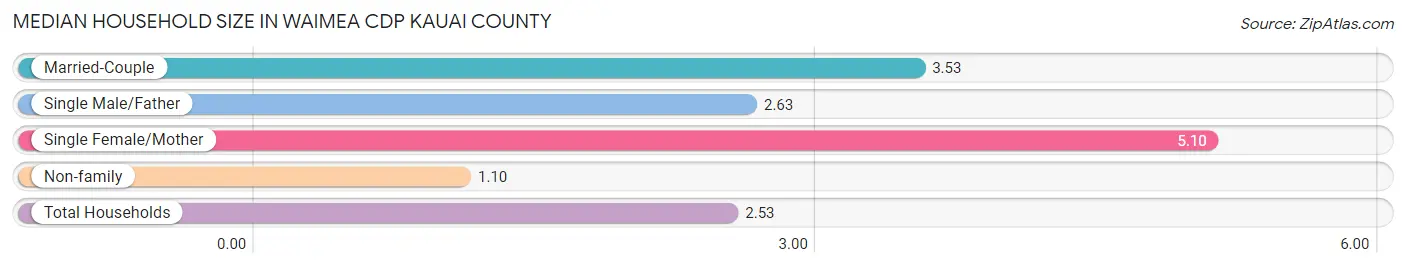
| Household Type | # Households | Household Size |
| Married-Couple | 243 (32.5%) | 3.53 |
| Single Male/Father | 54 (7.2%) | 2.63 |
| Single Female/Mother | 99 (13.3%) | 5.10 |
| Non-family | 351 (47.0%) | 1.10 |
| Total Households | 747 (100.0%) | 2.53 |
Household Size by Marriage Status in Waimea CDP Kauai County
Out of a total of 747 households in Waimea CDP Kauai County, 396 (53.0%) are family households, while 351 (47.0%) are nonfamily households. The most numerous type of family households are 2-person households, comprising 161, and the most common type of nonfamily households are 1-person households, comprising 309.
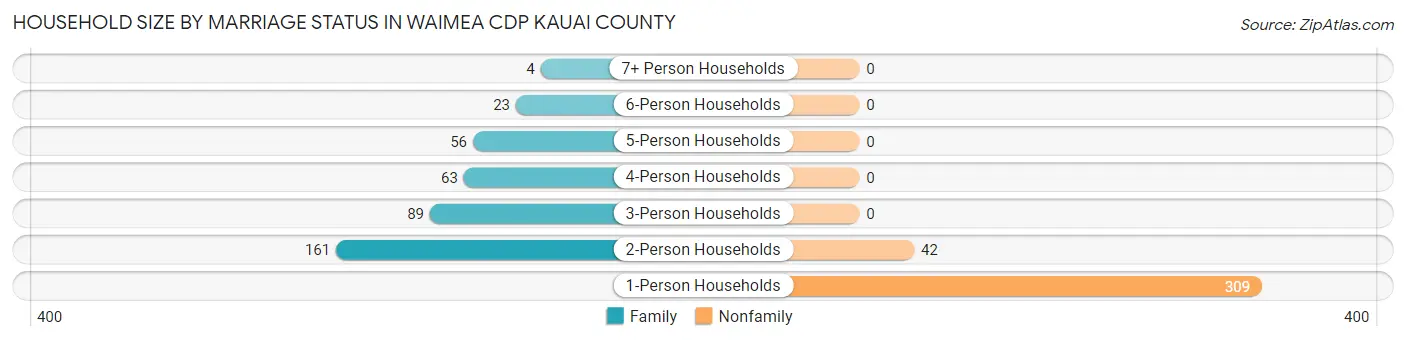
| Household Size | Family Households | Nonfamily Households |
| 1-Person Households | - | 309 (41.4%) |
| 2-Person Households | 161 (21.5%) | 42 (5.6%) |
| 3-Person Households | 89 (11.9%) | 0 (0.0%) |
| 4-Person Households | 63 (8.4%) | 0 (0.0%) |
| 5-Person Households | 56 (7.5%) | 0 (0.0%) |
| 6-Person Households | 23 (3.1%) | 0 (0.0%) |
| 7+ Person Households | 4 (0.5%) | 0 (0.0%) |
| Total | 396 (53.0%) | 351 (47.0%) |
Female Fertility in Waimea CDP Kauai County
Fertility by Age in Waimea CDP Kauai County
Average fertility rate in Waimea CDP Kauai County is 40.0 births per 1,000 women. Women in the age bracket of 20 to 34 years have the highest fertility rate with 94.0 births per 1,000 women. Women in the age bracket of 20 to 34 years acount for 100.0% of all women with births.
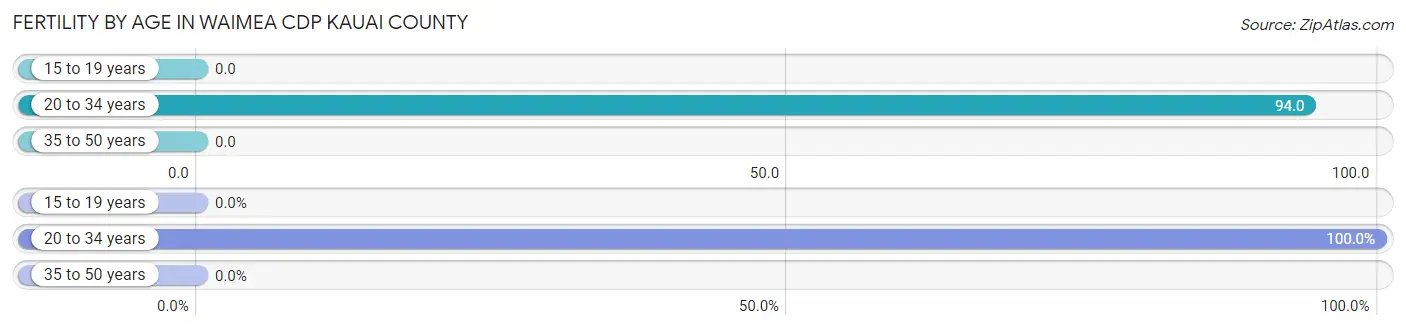
| Age Bracket | Women with Births | Births / 1,000 Women |
| 15 to 19 years | 0 (0.0%) | 0.0 |
| 20 to 34 years | 17 (100.0%) | 94.0 |
| 35 to 50 years | 0 (0.0%) | 0.0 |
| Total | 17 (100.0%) | 40.0 |
Fertility by Age by Marriage Status in Waimea CDP Kauai County
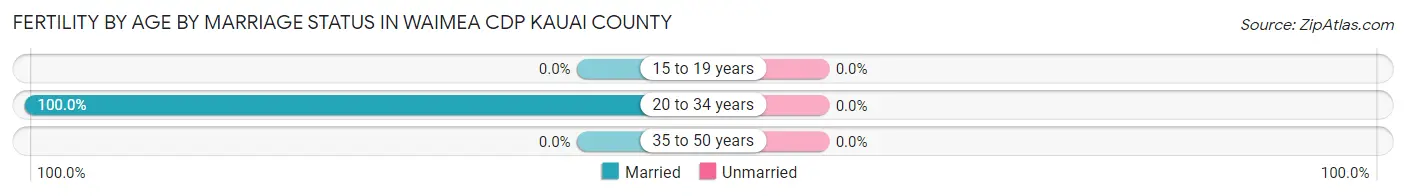
| Age Bracket | Married | Unmarried |
| 15 to 19 years | 0 (0.0%) | 0 (0.0%) |
| 20 to 34 years | 17 (100.0%) | 0 (0.0%) |
| 35 to 50 years | 0 (0.0%) | 0 (0.0%) |
| Total | 17 (100.0%) | 0 (0.0%) |
Fertility by Education in Waimea CDP Kauai County
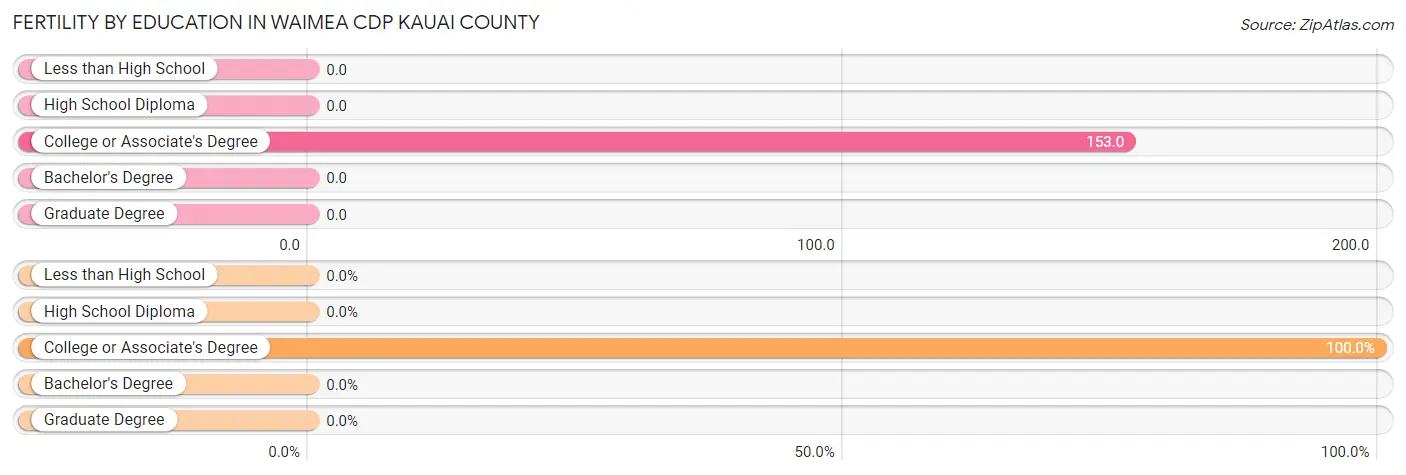
| Educational Attainment | Women with Births | Births / 1,000 Women |
| Less than High School | 0 (0.0%) | 0.0 |
| High School Diploma | 0 (0.0%) | 0.0 |
| College or Associate's Degree | 17 (100.0%) | 153.0 |
| Bachelor's Degree | 0 (0.0%) | 0.0 |
| Graduate Degree | 0 (0.0%) | 0.0 |
| Total | 17 (100.0%) | 40.0 |
Fertility by Education by Marriage Status in Waimea CDP Kauai County
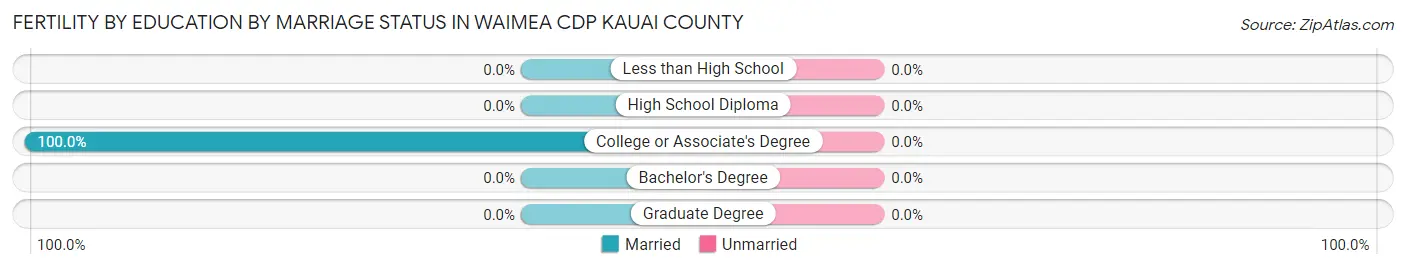
| Educational Attainment | Married | Unmarried |
| Less than High School | 0 (0.0%) | 0 (0.0%) |
| High School Diploma | 0 (0.0%) | 0 (0.0%) |
| College or Associate's Degree | 17 (100.0%) | 0 (0.0%) |
| Bachelor's Degree | 0 (0.0%) | 0 (0.0%) |
| Graduate Degree | 0 (0.0%) | 0 (0.0%) |
| Total | 17 (100.0%) | 0 (0.0%) |
Employment Characteristics in Waimea CDP Kauai County
Employment by Class of Employer in Waimea CDP Kauai County
Among the 1,027 employed individuals in Waimea CDP Kauai County, private company employees (671 | 65.3%), state government employees (128 | 12.5%), and self-employed (not incorporated) (126 | 12.3%) make up the most common classes of employment.
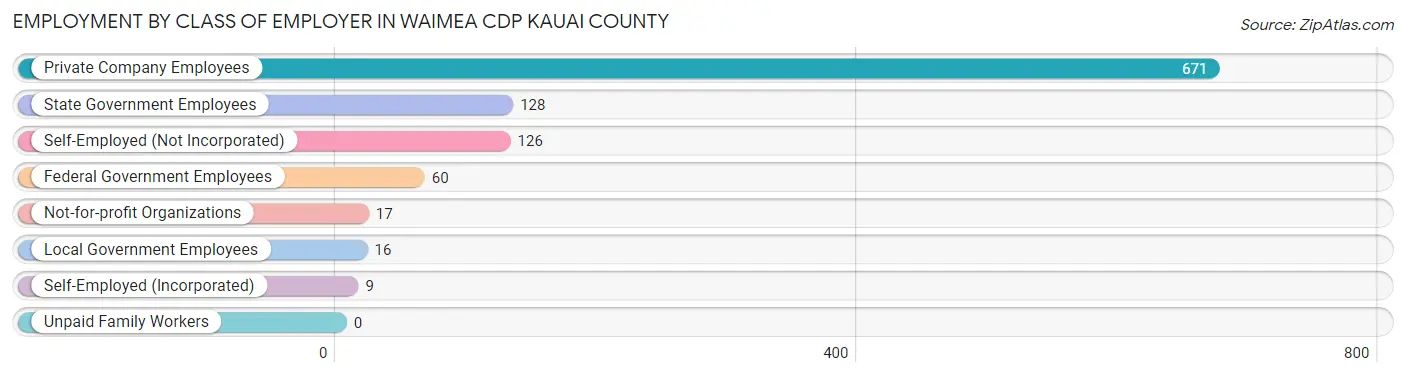
| Employer Class | # Employees | % Employees |
| Private Company Employees | 671 | 65.3% |
| Self-Employed (Incorporated) | 9 | 0.9% |
| Self-Employed (Not Incorporated) | 126 | 12.3% |
| Not-for-profit Organizations | 17 | 1.7% |
| Local Government Employees | 16 | 1.6% |
| State Government Employees | 128 | 12.5% |
| Federal Government Employees | 60 | 5.8% |
| Unpaid Family Workers | 0 | 0.0% |
| Total | 1,027 | 100.0% |
Employment Status by Age in Waimea CDP Kauai County
According to the labor force statistics for Waimea CDP Kauai County, out of the total population over 16 years of age (1,642), 66.7% or 1,095 individuals are in the labor force, with 4.8% or 53 of them unemployed. The age group with the highest labor force participation rate is 20 to 24 years, with 100.0% or 58 individuals in the labor force. Within the labor force, the 30 to 34 years age range has the highest percentage of unemployed individuals, with 12.5% or 34 of them being unemployed.
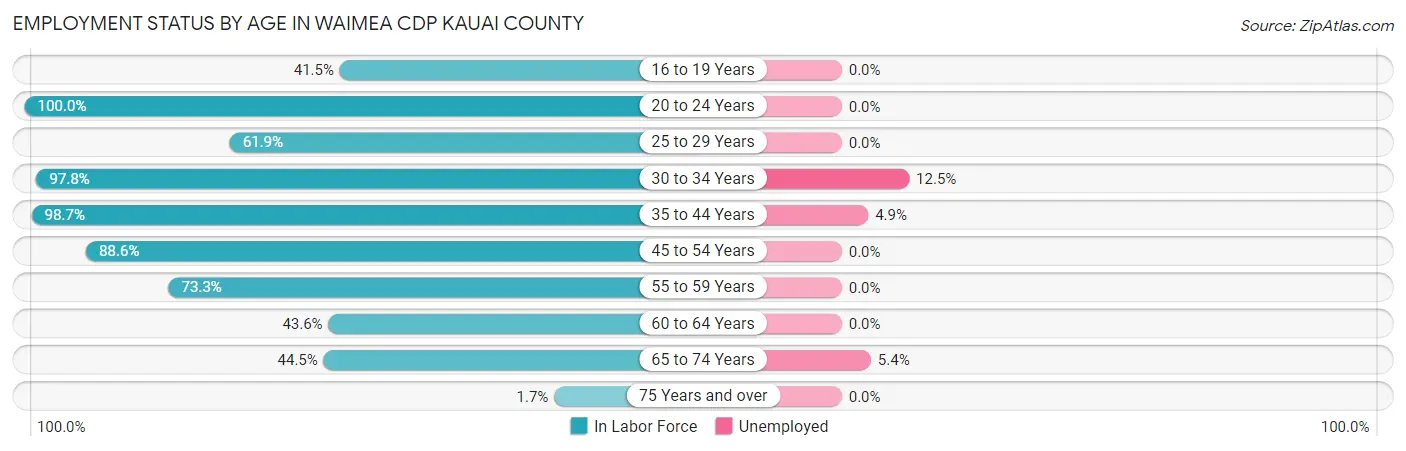
| Age Bracket | In Labor Force | Unemployed |
| 16 to 19 Years | 27 (41.5%) | 0 (0.0%) |
| 20 to 24 Years | 58 (100.0%) | 0 (0.0%) |
| 25 to 29 Years | 52 (61.9%) | 0 (0.0%) |
| 30 to 34 Years | 271 (97.8%) | 34 (12.5%) |
| 35 to 44 Years | 223 (98.7%) | 11 (4.9%) |
| 45 to 54 Years | 209 (88.6%) | 0 (0.0%) |
| 55 to 59 Years | 55 (73.3%) | 0 (0.0%) |
| 60 to 64 Years | 68 (43.6%) | 0 (0.0%) |
| 65 to 74 Years | 129 (44.5%) | 7 (5.4%) |
| 75 Years and over | 3 (1.7%) | 0 (0.0%) |
| Total | 1,095 (66.7%) | 53 (4.8%) |
Employment Status by Educational Attainment in Waimea CDP Kauai County
According to labor force statistics for Waimea CDP Kauai County, 83.3% of individuals (878) out of the total population between 25 and 64 years of age (1,054) are in the labor force, with 5.2% or 46 of them being unemployed. The group with the highest labor force participation rate are those with the educational attainment of bachelor's degree or higher, with 92.6% or 261 individuals in the labor force. Within the labor force, individuals with bachelor's degree or higher education have the highest percentage of unemployment, with 11.9% or 31 of them being unemployed.
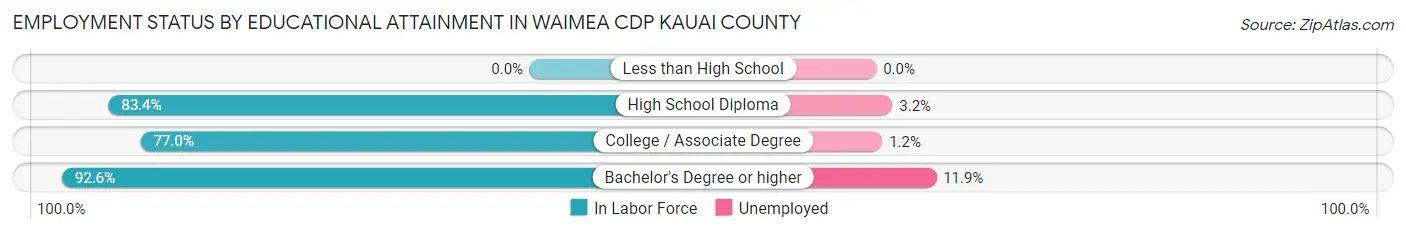
| Educational Attainment | In Labor Force | Unemployed |
| Less than High School | 0 (0.0%) | 0 (0.0%) |
| High School Diploma | 342 (83.4%) | 13 (3.2%) |
| College / Associate Degree | 275 (77.0%) | 4 (1.2%) |
| Bachelor's Degree or higher | 261 (92.6%) | 34 (11.9%) |
| Total | 878 (83.3%) | 55 (5.2%) |
Employment Occupations by Sex in Waimea CDP Kauai County
Management, Business, Science and Arts Occupations
The most common Management, Business, Science and Arts occupations in Waimea CDP Kauai County are Community & Social Service (78 | 7.6%), Business & Financial (70 | 6.8%), Management (53 | 5.2%), Education Instruction & Library (53 | 5.2%), and Computers, Engineering & Science (51 | 5.0%).
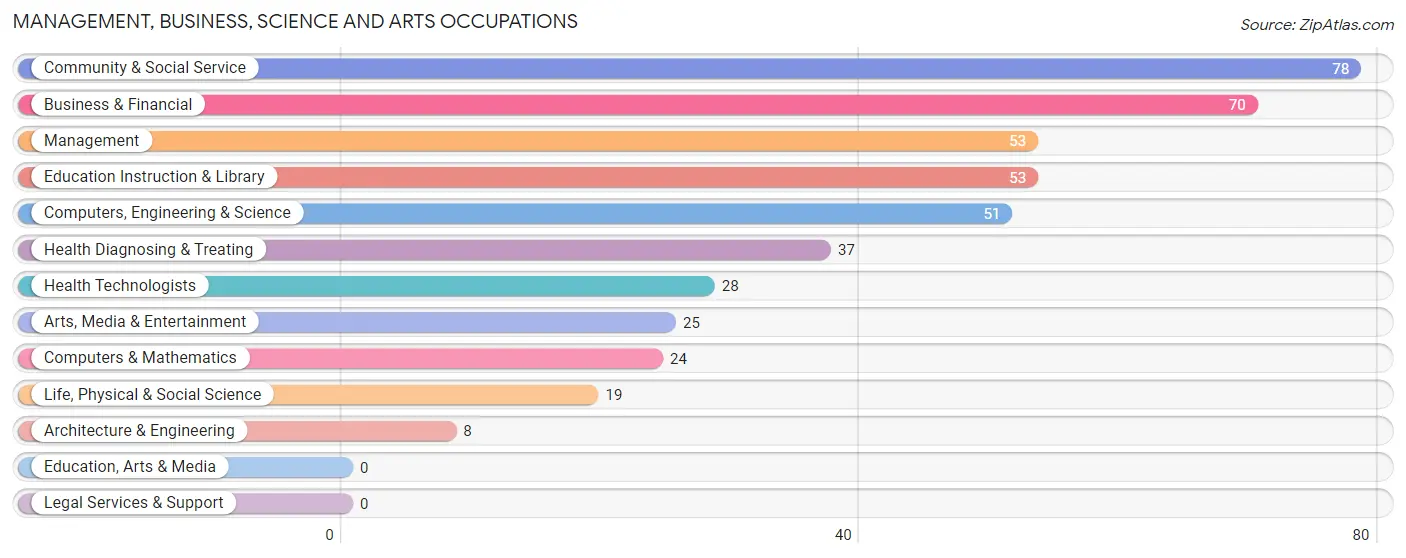
Management, Business, Science and Arts Occupations by Sex
Within the Management, Business, Science and Arts occupations in Waimea CDP Kauai County, the most male-oriented occupations are Computers & Mathematics (100.0%), Architecture & Engineering (100.0%), and Computers, Engineering & Science (86.3%), while the most female-oriented occupations are Health Diagnosing & Treating (100.0%), Health Technologists (100.0%), and Arts, Media & Entertainment (92.0%).
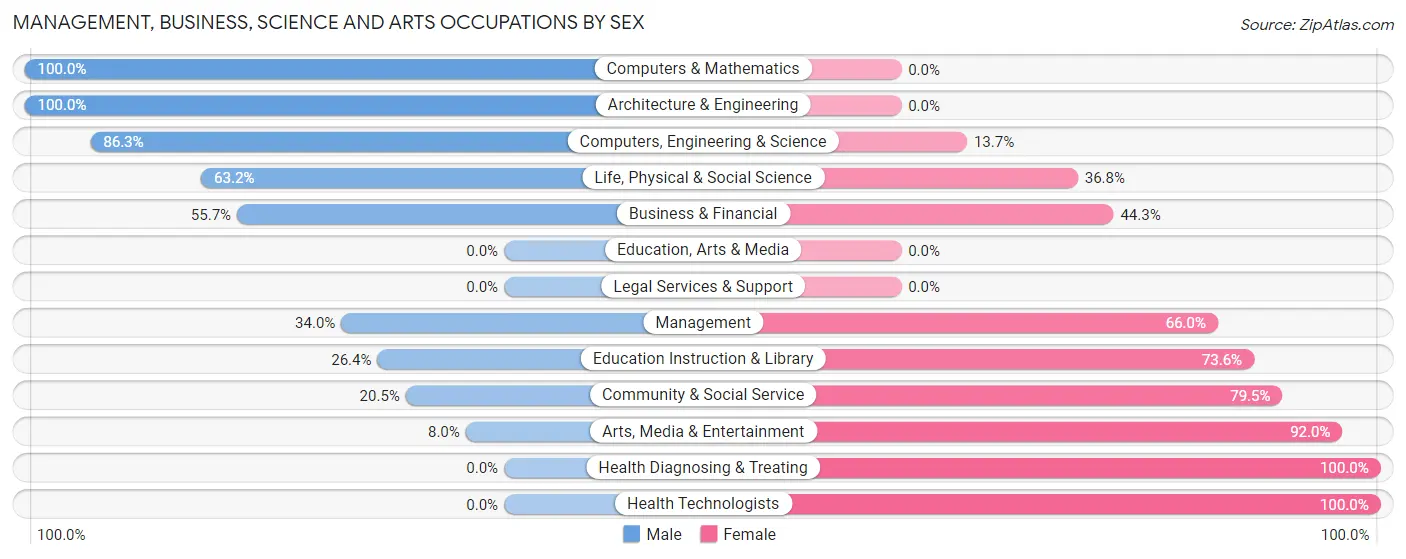
| Occupation | Male | Female |
| Management | 18 (34.0%) | 35 (66.0%) |
| Business & Financial | 39 (55.7%) | 31 (44.3%) |
| Computers, Engineering & Science | 44 (86.3%) | 7 (13.7%) |
| Computers & Mathematics | 24 (100.0%) | 0 (0.0%) |
| Architecture & Engineering | 8 (100.0%) | 0 (0.0%) |
| Life, Physical & Social Science | 12 (63.2%) | 7 (36.8%) |
| Community & Social Service | 16 (20.5%) | 62 (79.5%) |
| Education, Arts & Media | 0 (0.0%) | 0 (0.0%) |
| Legal Services & Support | 0 (0.0%) | 0 (0.0%) |
| Education Instruction & Library | 14 (26.4%) | 39 (73.6%) |
| Arts, Media & Entertainment | 2 (8.0%) | 23 (92.0%) |
| Health Diagnosing & Treating | 0 (0.0%) | 37 (100.0%) |
| Health Technologists | 0 (0.0%) | 28 (100.0%) |
| Total (Category) | 117 (40.5%) | 172 (59.5%) |
| Total (Overall) | 505 (49.4%) | 518 (50.6%) |
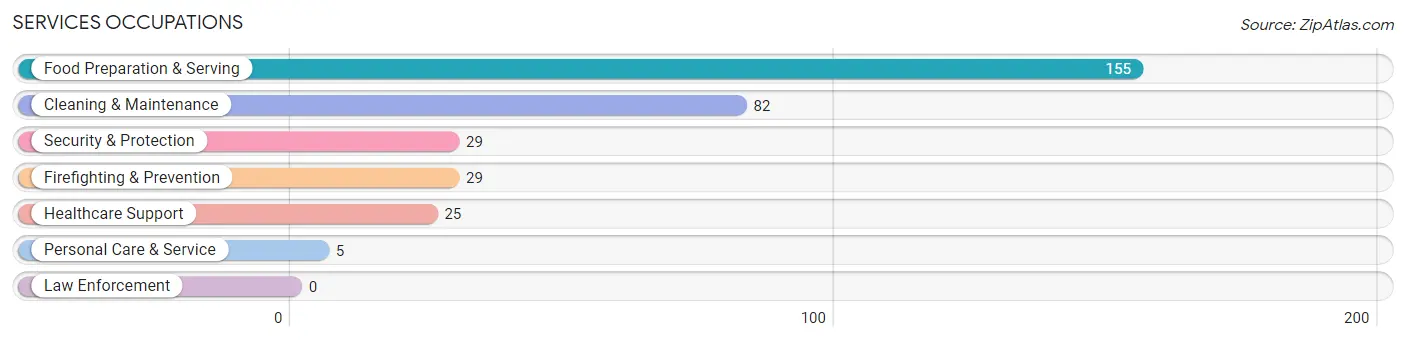
Services Occupations
The most common Services occupations in Waimea CDP Kauai County are Food Preparation & Serving (155 | 15.1%), Cleaning & Maintenance (82 | 8.0%), Security & Protection (29 | 2.8%), Firefighting & Prevention (29 | 2.8%), and Healthcare Support (25 | 2.4%).
Services Occupations by Sex
Within the Services occupations in Waimea CDP Kauai County, the most male-oriented occupations are Security & Protection (100.0%), Firefighting & Prevention (100.0%), and Cleaning & Maintenance (48.8%), while the most female-oriented occupations are Personal Care & Service (100.0%), Food Preparation & Serving (71.6%), and Healthcare Support (60.0%).

| Occupation | Male | Female |
| Healthcare Support | 10 (40.0%) | 15 (60.0%) |
| Security & Protection | 29 (100.0%) | 0 (0.0%) |
| Firefighting & Prevention | 29 (100.0%) | 0 (0.0%) |
| Law Enforcement | 0 (0.0%) | 0 (0.0%) |
| Food Preparation & Serving | 44 (28.4%) | 111 (71.6%) |
| Cleaning & Maintenance | 40 (48.8%) | 42 (51.2%) |
| Personal Care & Service | 0 (0.0%) | 5 (100.0%) |
| Total (Category) | 123 (41.5%) | 173 (58.5%) |
| Total (Overall) | 505 (49.4%) | 518 (50.6%) |
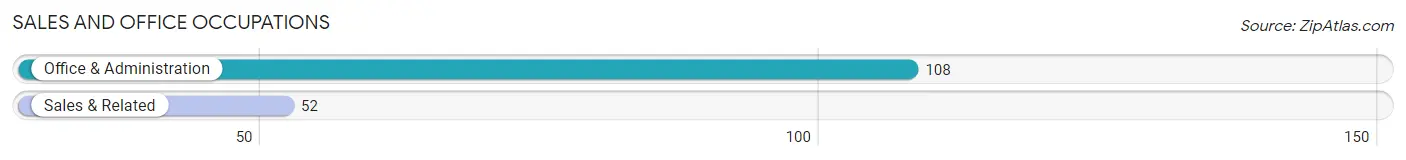
Sales and Office Occupations
The most common Sales and Office occupations in Waimea CDP Kauai County are Office & Administration (108 | 10.6%), and Sales & Related (52 | 5.1%).
Sales and Office Occupations by Sex
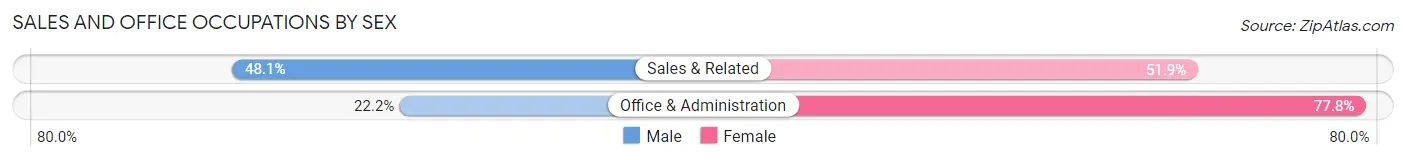
| Occupation | Male | Female |
| Sales & Related | 25 (48.1%) | 27 (51.9%) |
| Office & Administration | 24 (22.2%) | 84 (77.8%) |
| Total (Category) | 49 (30.6%) | 111 (69.4%) |
| Total (Overall) | 505 (49.4%) | 518 (50.6%) |
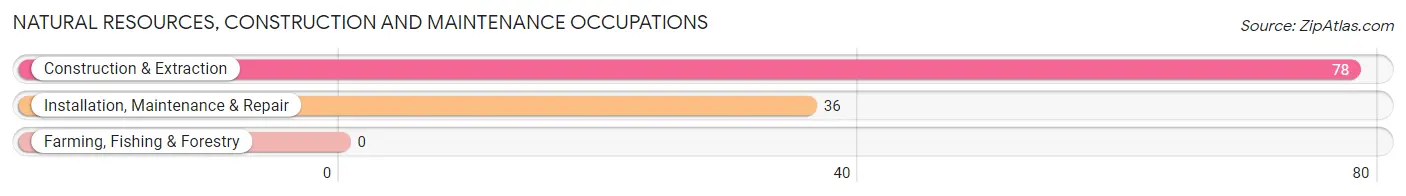
Natural Resources, Construction and Maintenance Occupations
The most common Natural Resources, Construction and Maintenance occupations in Waimea CDP Kauai County are Construction & Extraction (78 | 7.6%), and Installation, Maintenance & Repair (36 | 3.5%).
Natural Resources, Construction and Maintenance Occupations by Sex
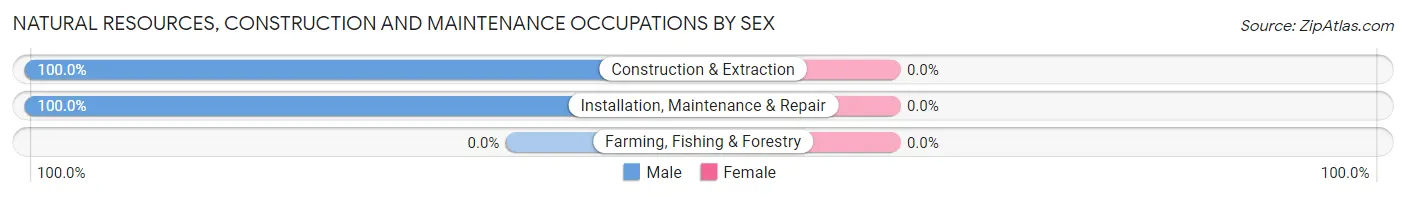
| Occupation | Male | Female |
| Farming, Fishing & Forestry | 0 (0.0%) | 0 (0.0%) |
| Construction & Extraction | 78 (100.0%) | 0 (0.0%) |
| Installation, Maintenance & Repair | 36 (100.0%) | 0 (0.0%) |
| Total (Category) | 114 (100.0%) | 0 (0.0%) |
| Total (Overall) | 505 (49.4%) | 518 (50.6%) |
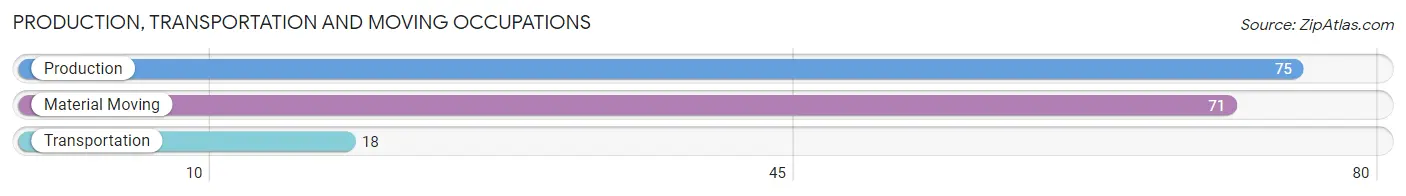
Production, Transportation and Moving Occupations
The most common Production, Transportation and Moving occupations in Waimea CDP Kauai County are Production (75 | 7.3%), Material Moving (71 | 6.9%), and Transportation (18 | 1.8%).
Production, Transportation and Moving Occupations by Sex
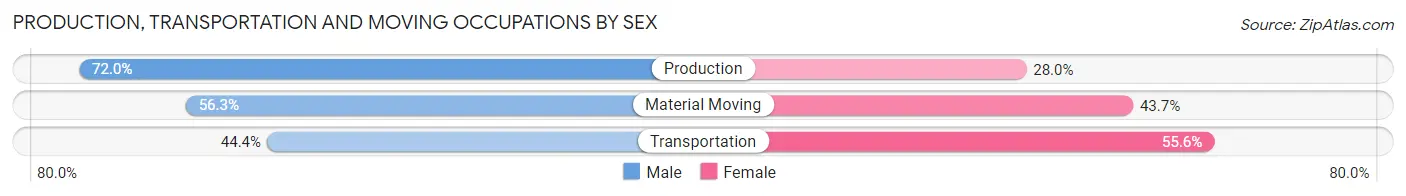
| Occupation | Male | Female |
| Production | 54 (72.0%) | 21 (28.0%) |
| Transportation | 8 (44.4%) | 10 (55.6%) |
| Material Moving | 40 (56.3%) | 31 (43.7%) |
| Total (Category) | 102 (62.2%) | 62 (37.8%) |
| Total (Overall) | 505 (49.4%) | 518 (50.6%) |
Employment Industries by Sex in Waimea CDP Kauai County
Employment Industries in Waimea CDP Kauai County
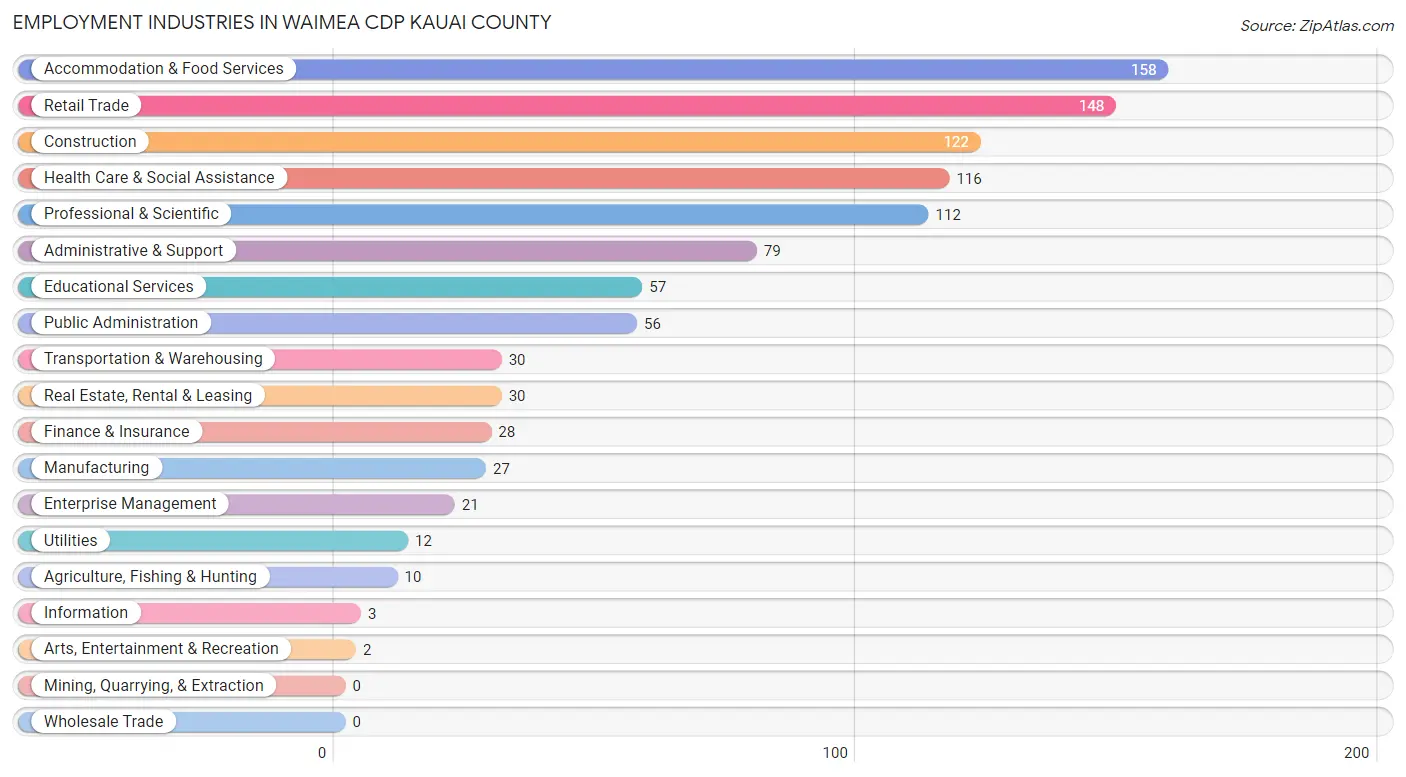
The major employment industries in Waimea CDP Kauai County include Accommodation & Food Services (158 | 15.4%), Retail Trade (148 | 14.5%), Construction (122 | 11.9%), Health Care & Social Assistance (116 | 11.3%), and Professional & Scientific (112 | 11.0%).
Employment Industries by Sex in Waimea CDP Kauai County
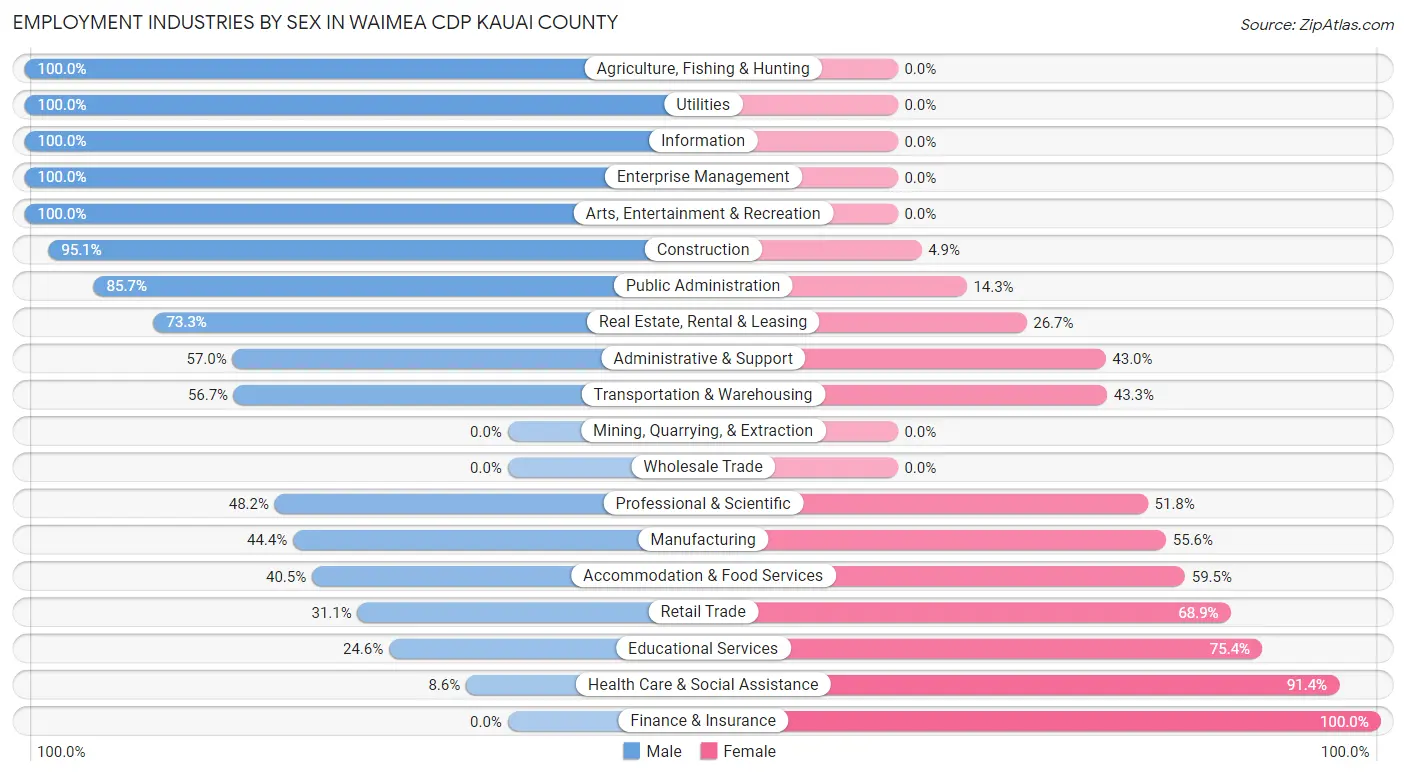
The Waimea CDP Kauai County industries that see more men than women are Agriculture, Fishing & Hunting (100.0%), Utilities (100.0%), and Information (100.0%), whereas the industries that tend to have a higher number of women are Finance & Insurance (100.0%), Health Care & Social Assistance (91.4%), and Educational Services (75.4%).
| Industry | Male | Female |
| Agriculture, Fishing & Hunting | 10 (100.0%) | 0 (0.0%) |
| Mining, Quarrying, & Extraction | 0 (0.0%) | 0 (0.0%) |
| Construction | 116 (95.1%) | 6 (4.9%) |
| Manufacturing | 12 (44.4%) | 15 (55.6%) |
| Wholesale Trade | 0 (0.0%) | 0 (0.0%) |
| Retail Trade | 46 (31.1%) | 102 (68.9%) |
| Transportation & Warehousing | 17 (56.7%) | 13 (43.3%) |
| Utilities | 12 (100.0%) | 0 (0.0%) |
| Information | 3 (100.0%) | 0 (0.0%) |
| Finance & Insurance | 0 (0.0%) | 28 (100.0%) |
| Real Estate, Rental & Leasing | 22 (73.3%) | 8 (26.7%) |
| Professional & Scientific | 54 (48.2%) | 58 (51.8%) |
| Enterprise Management | 21 (100.0%) | 0 (0.0%) |
| Administrative & Support | 45 (57.0%) | 34 (43.0%) |
| Educational Services | 14 (24.6%) | 43 (75.4%) |
| Health Care & Social Assistance | 10 (8.6%) | 106 (91.4%) |
| Arts, Entertainment & Recreation | 2 (100.0%) | 0 (0.0%) |
| Accommodation & Food Services | 64 (40.5%) | 94 (59.5%) |
| Public Administration | 48 (85.7%) | 8 (14.3%) |
| Total | 505 (49.4%) | 518 (50.6%) |
Education in Waimea CDP Kauai County
School Enrollment in Waimea CDP Kauai County
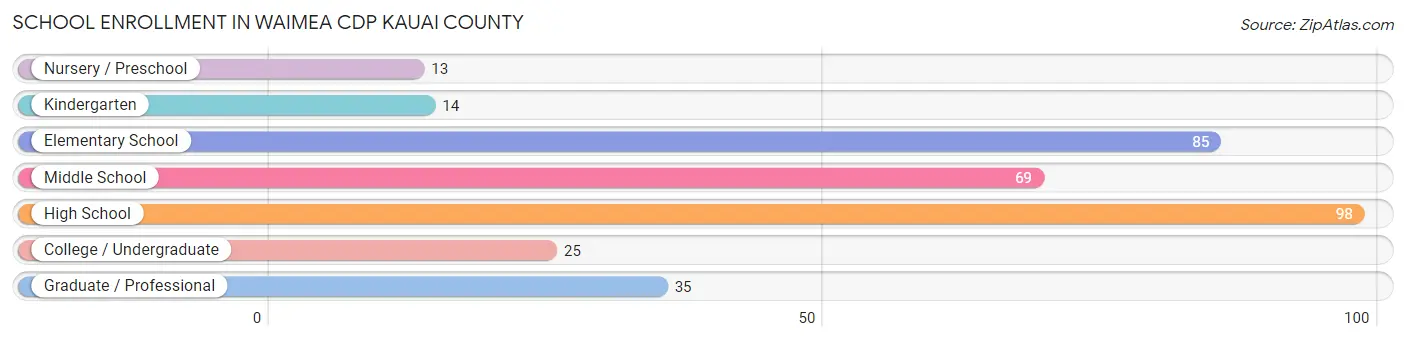
The most common levels of schooling among the 339 students in Waimea CDP Kauai County are high school (98 | 28.9%), elementary school (85 | 25.1%), and middle school (69 | 20.3%).
| School Level | # Students | % Students |
| Nursery / Preschool | 13 | 3.8% |
| Kindergarten | 14 | 4.1% |
| Elementary School | 85 | 25.1% |
| Middle School | 69 | 20.3% |
| High School | 98 | 28.9% |
| College / Undergraduate | 25 | 7.4% |
| Graduate / Professional | 35 | 10.3% |
| Total | 339 | 100.0% |
School Enrollment by Age by Funding Source in Waimea CDP Kauai County
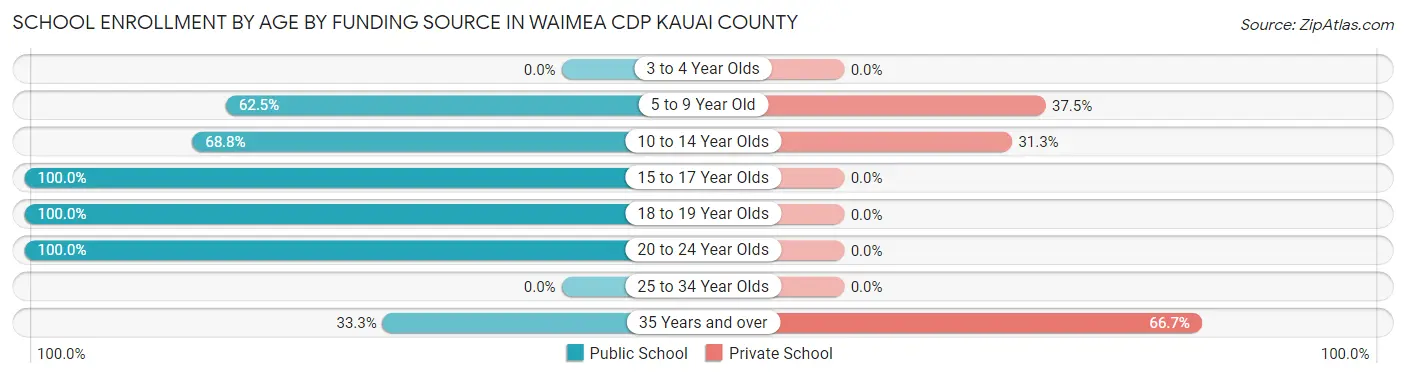
Out of a total of 339 students who are enrolled in schools in Waimea CDP Kauai County, 93 (27.4%) attend a private institution, while the remaining 246 (72.6%) are enrolled in public schools. The age group of 35 years and over has the highest likelihood of being enrolled in private schools, with 26 (66.7% in the age bracket) enrolled. Conversely, the age group of 15 to 17 year olds has the lowest likelihood of being enrolled in a private school, with 70 (100.0% in the age bracket) attending a public institution.
| Age Bracket | Public School | Private School |
| 3 to 4 Year Olds | 0 (0.0%) | 0 (0.0%) |
| 5 to 9 Year Old | 70 (62.5%) | 42 (37.5%) |
| 10 to 14 Year Olds | 55 (68.8%) | 25 (31.2%) |
| 15 to 17 Year Olds | 70 (100.0%) | 0 (0.0%) |
| 18 to 19 Year Olds | 22 (100.0%) | 0 (0.0%) |
| 20 to 24 Year Olds | 16 (100.0%) | 0 (0.0%) |
| 25 to 34 Year Olds | 0 (0.0%) | 0 (0.0%) |
| 35 Years and over | 13 (33.3%) | 26 (66.7%) |
| Total | 246 (72.6%) | 93 (27.4%) |
Educational Attainment by Field of Study in Waimea CDP Kauai County
Business (154 | 31.3%), education (97 | 19.7%), science & technology (83 | 16.9%), bio, nature & agricultural (59 | 12.0%), and engineering (54 | 11.0%) are the most common fields of study among 492 individuals in Waimea CDP Kauai County who have obtained a bachelor's degree or higher.
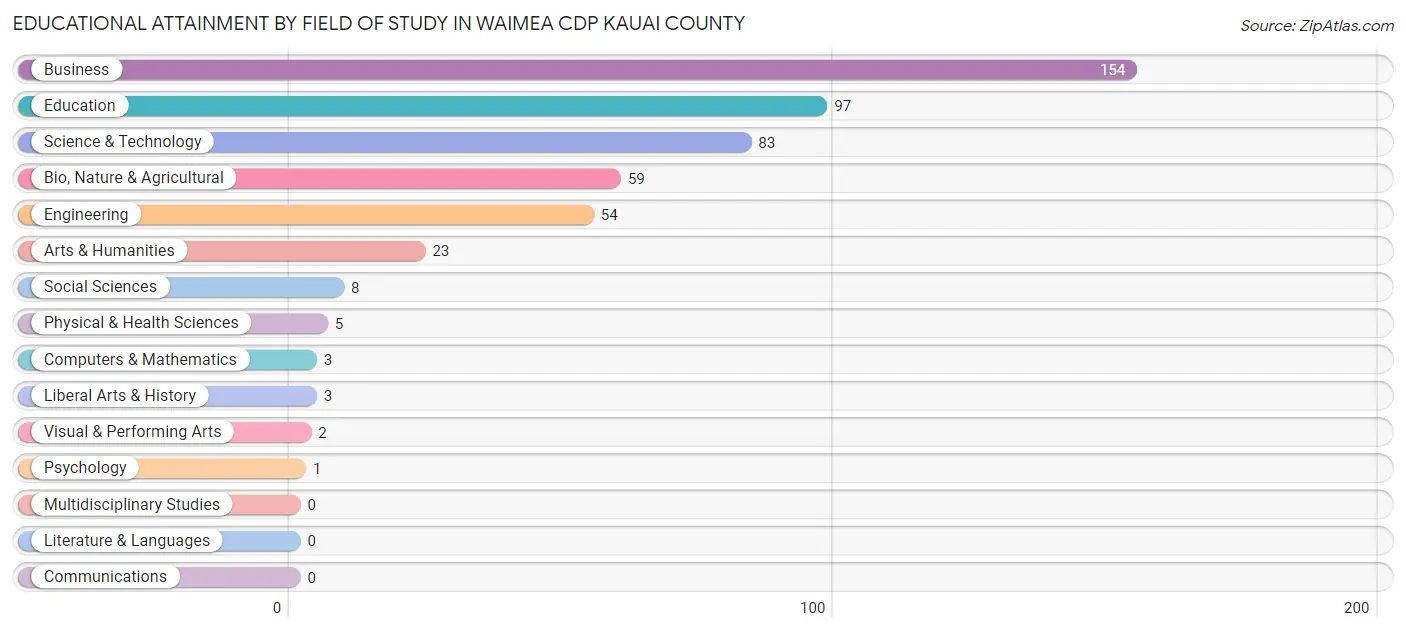
| Field of Study | # Graduates | % Graduates |
| Computers & Mathematics | 3 | 0.6% |
| Bio, Nature & Agricultural | 59 | 12.0% |
| Physical & Health Sciences | 5 | 1.0% |
| Psychology | 1 | 0.2% |
| Social Sciences | 8 | 1.6% |
| Engineering | 54 | 11.0% |
| Multidisciplinary Studies | 0 | 0.0% |
| Science & Technology | 83 | 16.9% |
| Business | 154 | 31.3% |
| Education | 97 | 19.7% |
| Literature & Languages | 0 | 0.0% |
| Liberal Arts & History | 3 | 0.6% |
| Visual & Performing Arts | 2 | 0.4% |
| Communications | 0 | 0.0% |
| Arts & Humanities | 23 | 4.7% |
| Total | 492 | 100.0% |
Transportation & Commute in Waimea CDP Kauai County
Vehicle Availability by Sex in Waimea CDP Kauai County
The most prevalent vehicle ownership categories in Waimea CDP Kauai County are males with 4 vehicles (151, accounting for 29.7%) and females with 4 vehicles (25, making up 29.1%).
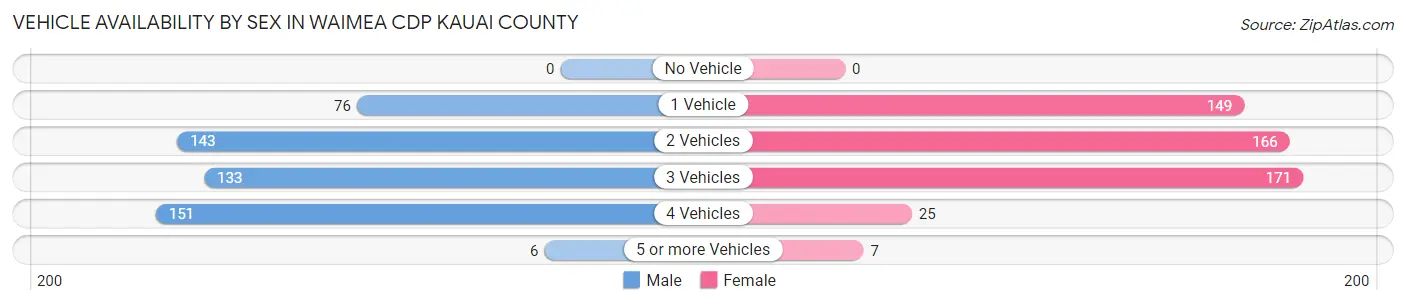
| Vehicles Available | Male | Female |
| No Vehicle | 0 (0.0%) | 0 (0.0%) |
| 1 Vehicle | 76 (14.9%) | 149 (28.8%) |
| 2 Vehicles | 143 (28.1%) | 166 (32.1%) |
| 3 Vehicles | 133 (26.1%) | 171 (33.0%) |
| 4 Vehicles | 151 (29.7%) | 25 (4.8%) |
| 5 or more Vehicles | 6 (1.2%) | 7 (1.3%) |
| Total | 509 (100.0%) | 518 (100.0%) |
Commute Time in Waimea CDP Kauai County
The most frequently occuring commute durations in Waimea CDP Kauai County are 5 to 9 minutes (195 commuters, 20.1%), less than 5 minutes (146 commuters, 15.0%), and 30 to 34 minutes (140 commuters, 14.4%).
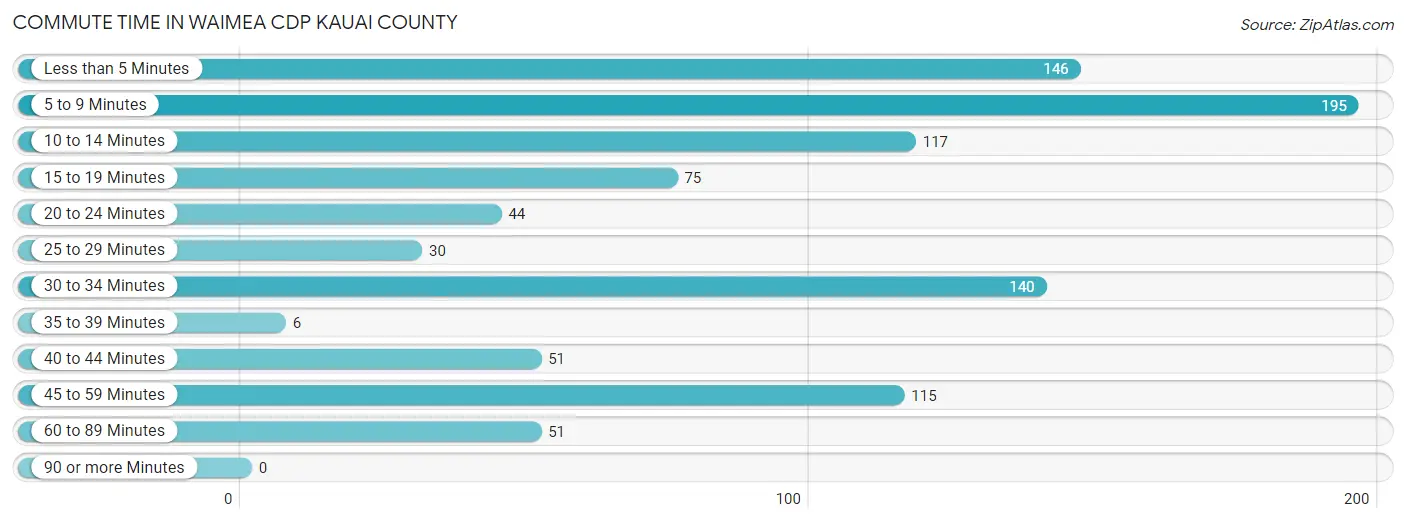
| Commute Time | # Commuters | % Commuters |
| Less than 5 Minutes | 146 | 15.0% |
| 5 to 9 Minutes | 195 | 20.1% |
| 10 to 14 Minutes | 117 | 12.1% |
| 15 to 19 Minutes | 75 | 7.7% |
| 20 to 24 Minutes | 44 | 4.5% |
| 25 to 29 Minutes | 30 | 3.1% |
| 30 to 34 Minutes | 140 | 14.4% |
| 35 to 39 Minutes | 6 | 0.6% |
| 40 to 44 Minutes | 51 | 5.3% |
| 45 to 59 Minutes | 115 | 11.9% |
| 60 to 89 Minutes | 51 | 5.3% |
| 90 or more Minutes | 0 | 0.0% |
Commute Time by Sex in Waimea CDP Kauai County
The most common commute times in Waimea CDP Kauai County are 10 to 14 minutes (72 commuters, 14.9%) for males and 5 to 9 minutes (128 commuters, 26.3%) for females.
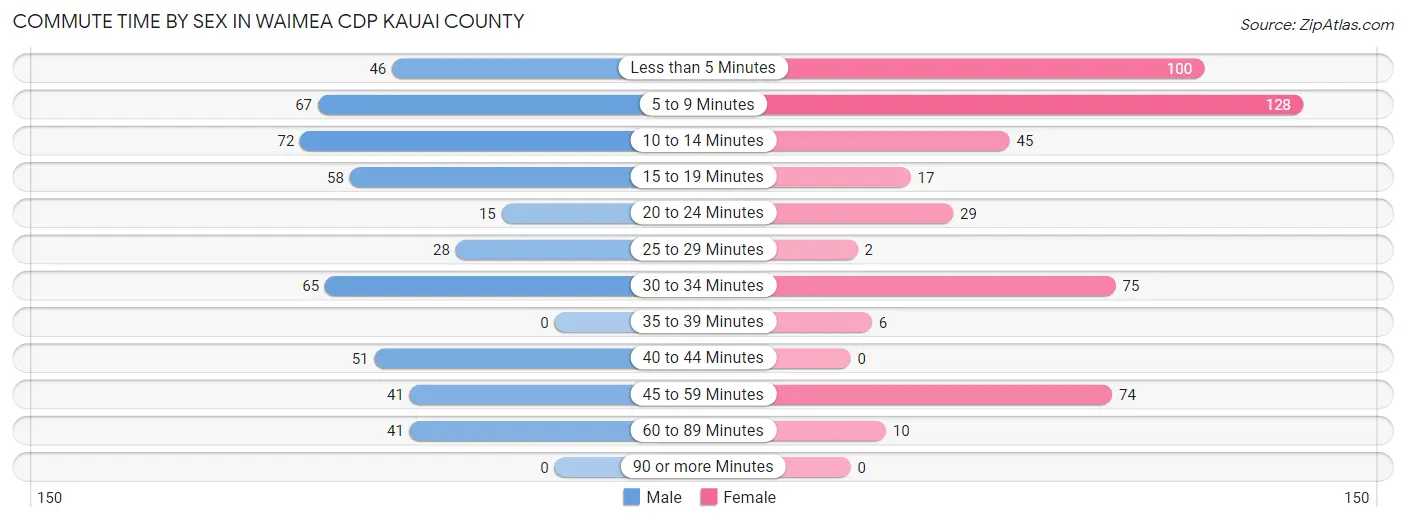
| Commute Time | Male | Female |
| Less than 5 Minutes | 46 (9.5%) | 100 (20.6%) |
| 5 to 9 Minutes | 67 (13.8%) | 128 (26.3%) |
| 10 to 14 Minutes | 72 (14.9%) | 45 (9.3%) |
| 15 to 19 Minutes | 58 (12.0%) | 17 (3.5%) |
| 20 to 24 Minutes | 15 (3.1%) | 29 (6.0%) |
| 25 to 29 Minutes | 28 (5.8%) | 2 (0.4%) |
| 30 to 34 Minutes | 65 (13.4%) | 75 (15.4%) |
| 35 to 39 Minutes | 0 (0.0%) | 6 (1.2%) |
| 40 to 44 Minutes | 51 (10.5%) | 0 (0.0%) |
| 45 to 59 Minutes | 41 (8.5%) | 74 (15.2%) |
| 60 to 89 Minutes | 41 (8.5%) | 10 (2.1%) |
| 90 or more Minutes | 0 (0.0%) | 0 (0.0%) |
Time of Departure to Work by Sex in Waimea CDP Kauai County
The most frequent times of departure to work in Waimea CDP Kauai County are 6:00 AM to 6:29 AM (115, 23.8%) for males and 7:30 AM to 7:59 AM (106, 21.8%) for females.
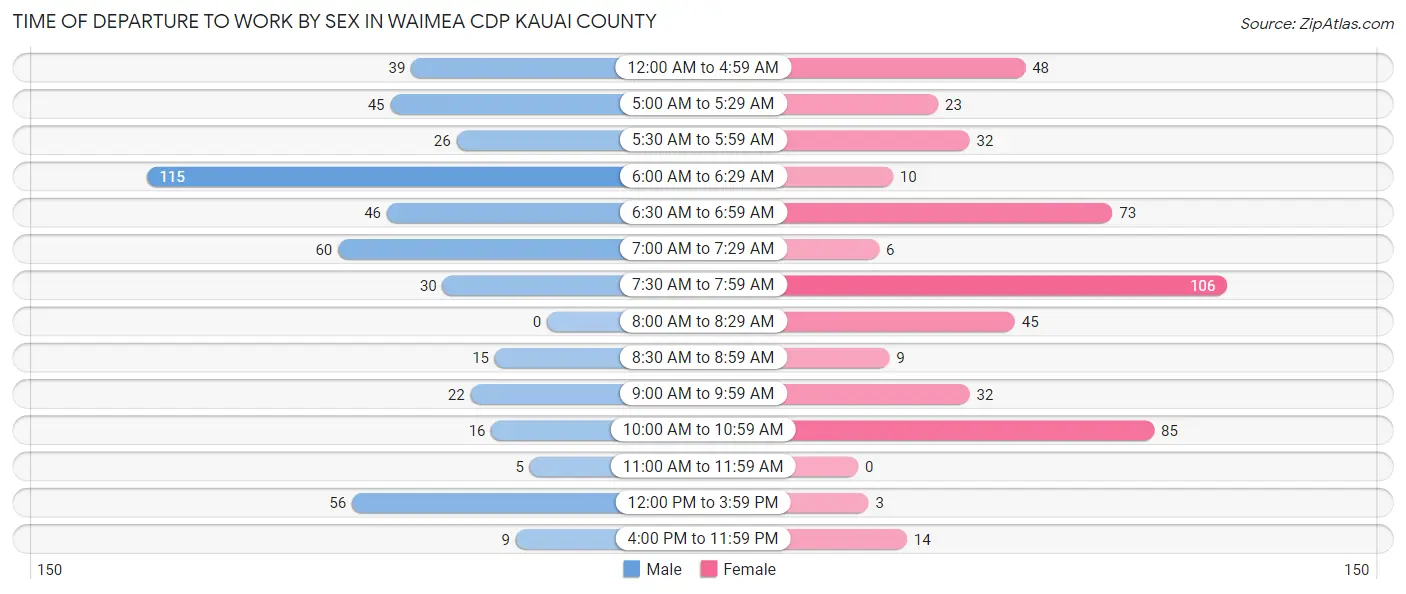
| Time of Departure | Male | Female |
| 12:00 AM to 4:59 AM | 39 (8.1%) | 48 (9.9%) |
| 5:00 AM to 5:29 AM | 45 (9.3%) | 23 (4.7%) |
| 5:30 AM to 5:59 AM | 26 (5.4%) | 32 (6.6%) |
| 6:00 AM to 6:29 AM | 115 (23.8%) | 10 (2.1%) |
| 6:30 AM to 6:59 AM | 46 (9.5%) | 73 (15.0%) |
| 7:00 AM to 7:29 AM | 60 (12.4%) | 6 (1.2%) |
| 7:30 AM to 7:59 AM | 30 (6.2%) | 106 (21.8%) |
| 8:00 AM to 8:29 AM | 0 (0.0%) | 45 (9.3%) |
| 8:30 AM to 8:59 AM | 15 (3.1%) | 9 (1.8%) |
| 9:00 AM to 9:59 AM | 22 (4.5%) | 32 (6.6%) |
| 10:00 AM to 10:59 AM | 16 (3.3%) | 85 (17.5%) |
| 11:00 AM to 11:59 AM | 5 (1.0%) | 0 (0.0%) |
| 12:00 PM to 3:59 PM | 56 (11.6%) | 3 (0.6%) |
| 4:00 PM to 11:59 PM | 9 (1.9%) | 14 (2.9%) |
| Total | 484 (100.0%) | 486 (100.0%) |
Housing Occupancy in Waimea CDP Kauai County
Occupancy by Ownership in Waimea CDP Kauai County
Of the total 747 dwellings in Waimea CDP Kauai County, owner-occupied units account for 296 (39.6%), while renter-occupied units make up 451 (60.4%).
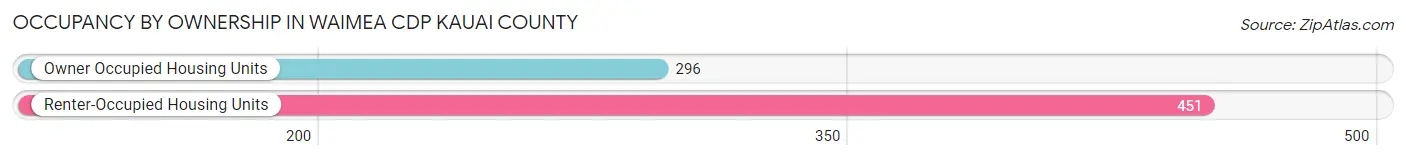
| Occupancy | # Housing Units | % Housing Units |
| Owner Occupied Housing Units | 296 | 39.6% |
| Renter-Occupied Housing Units | 451 | 60.4% |
| Total Occupied Housing Units | 747 | 100.0% |
Occupancy by Household Size in Waimea CDP Kauai County
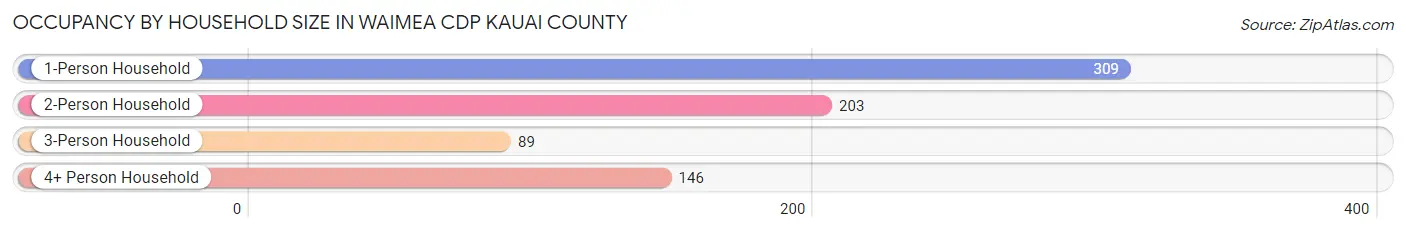
| Household Size | # Housing Units | % Housing Units |
| 1-Person Household | 309 | 41.4% |
| 2-Person Household | 203 | 27.2% |
| 3-Person Household | 89 | 11.9% |
| 4+ Person Household | 146 | 19.5% |
| Total Housing Units | 747 | 100.0% |
Occupancy by Ownership by Household Size in Waimea CDP Kauai County
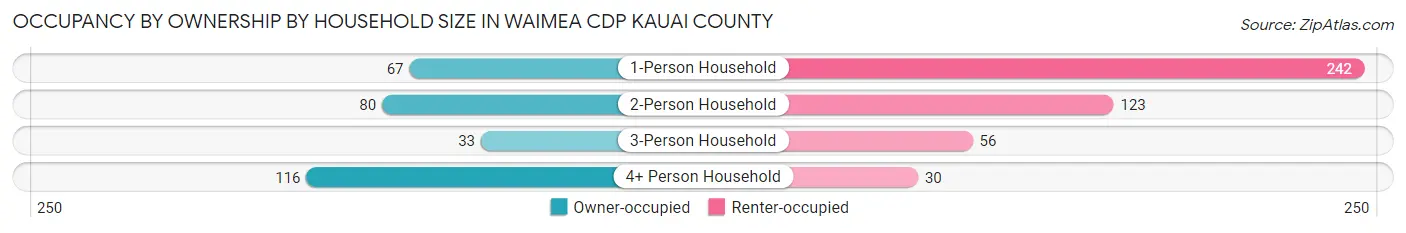
| Household Size | Owner-occupied | Renter-occupied |
| 1-Person Household | 67 (21.7%) | 242 (78.3%) |
| 2-Person Household | 80 (39.4%) | 123 (60.6%) |
| 3-Person Household | 33 (37.1%) | 56 (62.9%) |
| 4+ Person Household | 116 (79.4%) | 30 (20.5%) |
| Total Housing Units | 296 (39.6%) | 451 (60.4%) |
Occupancy by Educational Attainment in Waimea CDP Kauai County
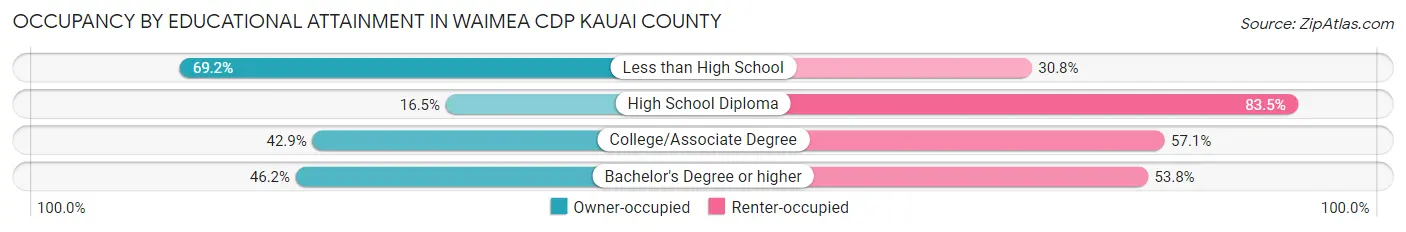
| Household Size | Owner-occupied | Renter-occupied |
| Less than High School | 36 (69.2%) | 16 (30.8%) |
| High School Diploma | 29 (16.5%) | 147 (83.5%) |
| College/Associate Degree | 115 (42.9%) | 153 (57.1%) |
| Bachelor's Degree or higher | 116 (46.2%) | 135 (53.8%) |
Occupancy by Age of Householder in Waimea CDP Kauai County
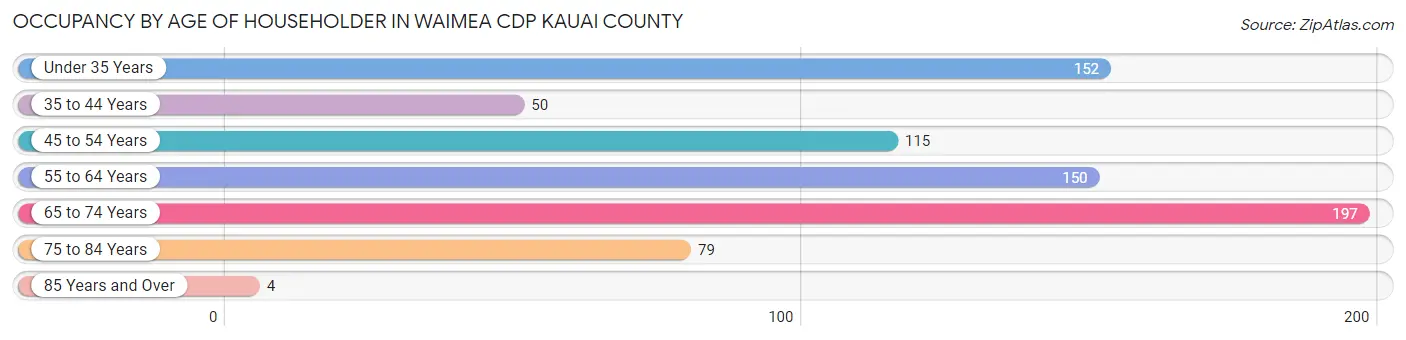
| Age Bracket | # Households | % Households |
| Under 35 Years | 152 | 20.3% |
| 35 to 44 Years | 50 | 6.7% |
| 45 to 54 Years | 115 | 15.4% |
| 55 to 64 Years | 150 | 20.1% |
| 65 to 74 Years | 197 | 26.4% |
| 75 to 84 Years | 79 | 10.6% |
| 85 Years and Over | 4 | 0.5% |
| Total | 747 | 100.0% |
Housing Finances in Waimea CDP Kauai County
Median Income by Occupancy in Waimea CDP Kauai County
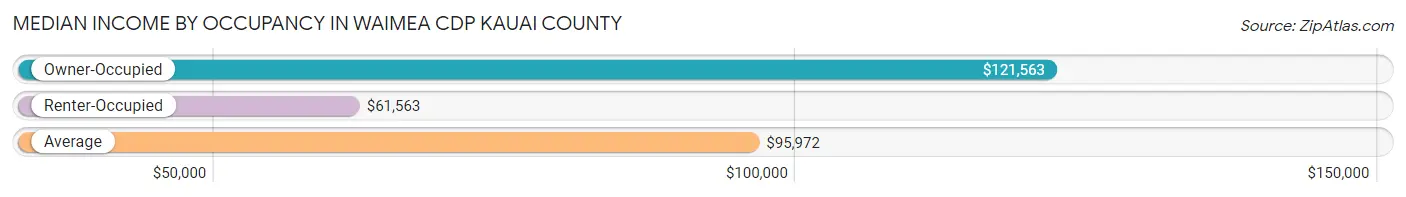
| Occupancy Type | # Households | Median Income |
| Owner-Occupied | 296 (39.6%) | $121,563 |
| Renter-Occupied | 451 (60.4%) | $61,563 |
| Average | 747 (100.0%) | $95,972 |
Occupancy by Householder Income Bracket in Waimea CDP Kauai County
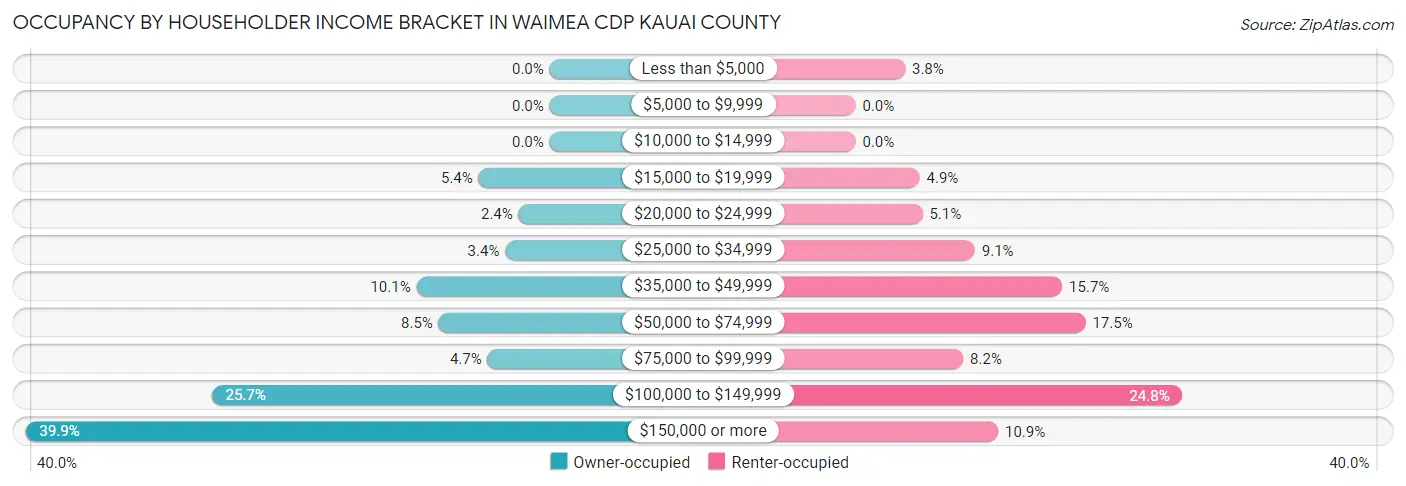
| Income Bracket | Owner-occupied | Renter-occupied |
| Less than $5,000 | 0 (0.0%) | 17 (3.8%) |
| $5,000 to $9,999 | 0 (0.0%) | 0 (0.0%) |
| $10,000 to $14,999 | 0 (0.0%) | 0 (0.0%) |
| $15,000 to $19,999 | 16 (5.4%) | 22 (4.9%) |
| $20,000 to $24,999 | 7 (2.4%) | 23 (5.1%) |
| $25,000 to $34,999 | 10 (3.4%) | 41 (9.1%) |
| $35,000 to $49,999 | 30 (10.1%) | 71 (15.7%) |
| $50,000 to $74,999 | 25 (8.5%) | 79 (17.5%) |
| $75,000 to $99,999 | 14 (4.7%) | 37 (8.2%) |
| $100,000 to $149,999 | 76 (25.7%) | 112 (24.8%) |
| $150,000 or more | 118 (39.9%) | 49 (10.9%) |
| Total | 296 (100.0%) | 451 (100.0%) |
Monthly Housing Cost Tiers in Waimea CDP Kauai County
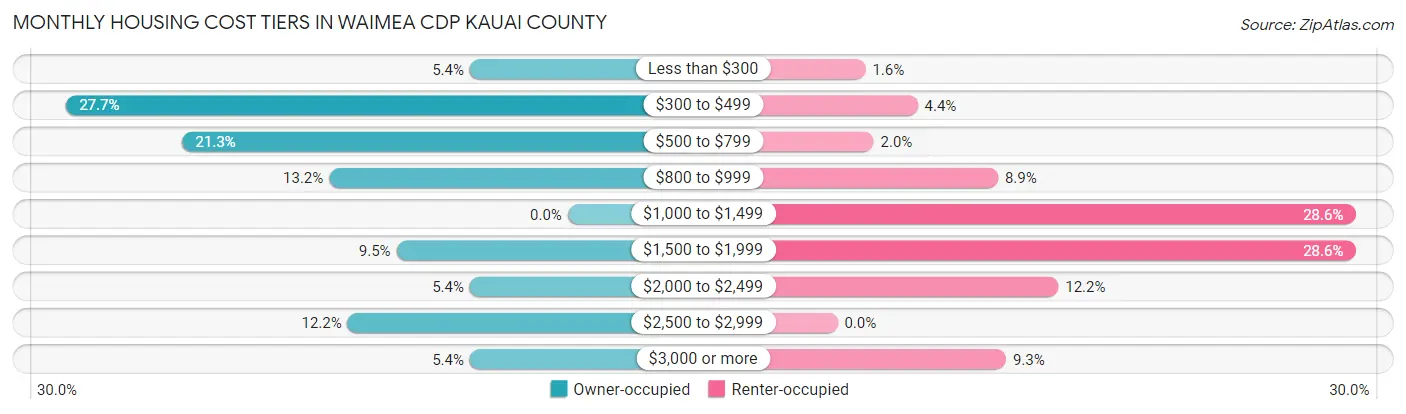
| Monthly Cost | Owner-occupied | Renter-occupied |
| Less than $300 | 16 (5.4%) | 7 (1.5%) |
| $300 to $499 | 82 (27.7%) | 20 (4.4%) |
| $500 to $799 | 63 (21.3%) | 9 (2.0%) |
| $800 to $999 | 39 (13.2%) | 40 (8.9%) |
| $1,000 to $1,499 | 0 (0.0%) | 129 (28.6%) |
| $1,500 to $1,999 | 28 (9.5%) | 129 (28.6%) |
| $2,000 to $2,499 | 16 (5.4%) | 55 (12.2%) |
| $2,500 to $2,999 | 36 (12.2%) | 0 (0.0%) |
| $3,000 or more | 16 (5.4%) | 42 (9.3%) |
| Total | 296 (100.0%) | 451 (100.0%) |
Physical Housing Characteristics in Waimea CDP Kauai County
Housing Structures in Waimea CDP Kauai County
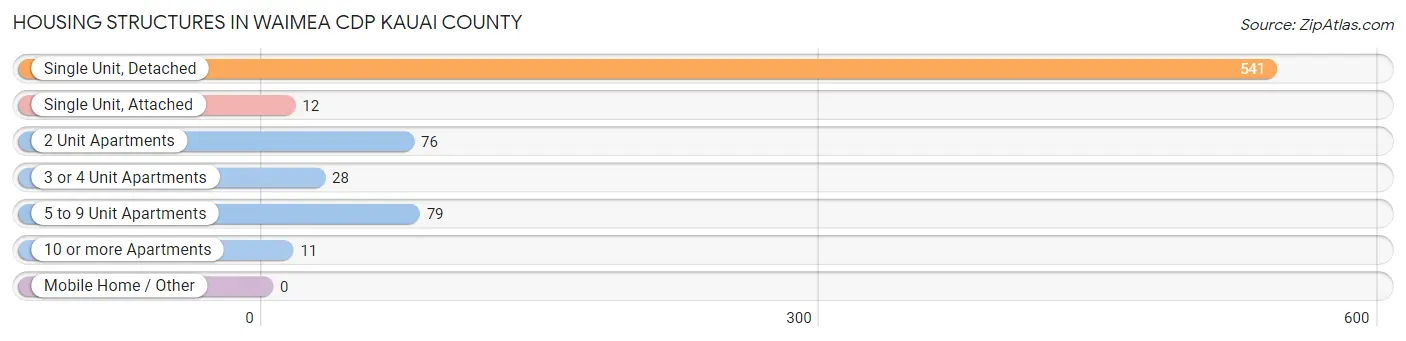
| Structure Type | # Housing Units | % Housing Units |
| Single Unit, Detached | 541 | 72.4% |
| Single Unit, Attached | 12 | 1.6% |
| 2 Unit Apartments | 76 | 10.2% |
| 3 or 4 Unit Apartments | 28 | 3.7% |
| 5 to 9 Unit Apartments | 79 | 10.6% |
| 10 or more Apartments | 11 | 1.5% |
| Mobile Home / Other | 0 | 0.0% |
| Total | 747 | 100.0% |
Housing Structures by Occupancy in Waimea CDP Kauai County
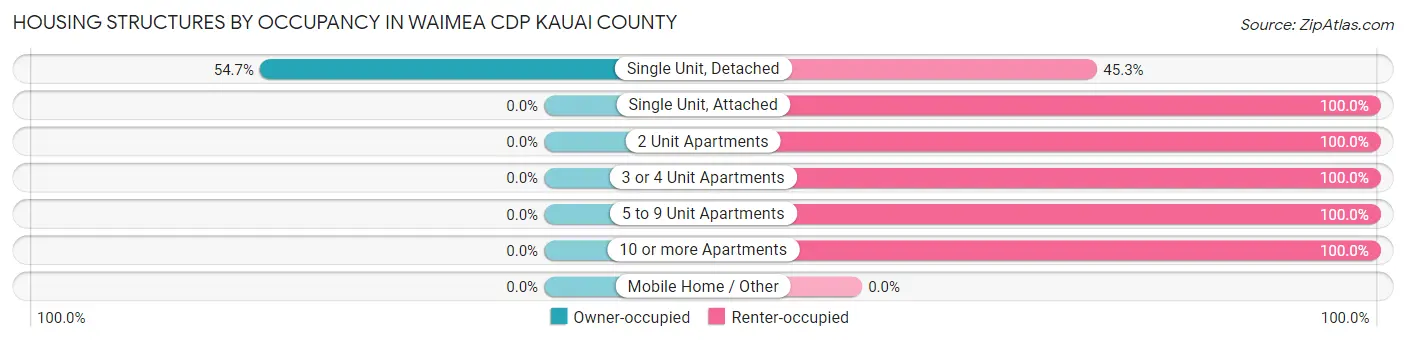
| Structure Type | Owner-occupied | Renter-occupied |
| Single Unit, Detached | 296 (54.7%) | 245 (45.3%) |
| Single Unit, Attached | 0 (0.0%) | 12 (100.0%) |
| 2 Unit Apartments | 0 (0.0%) | 76 (100.0%) |
| 3 or 4 Unit Apartments | 0 (0.0%) | 28 (100.0%) |
| 5 to 9 Unit Apartments | 0 (0.0%) | 79 (100.0%) |
| 10 or more Apartments | 0 (0.0%) | 11 (100.0%) |
| Mobile Home / Other | 0 (0.0%) | 0 (0.0%) |
| Total | 296 (39.6%) | 451 (60.4%) |
Housing Structures by Number of Rooms in Waimea CDP Kauai County
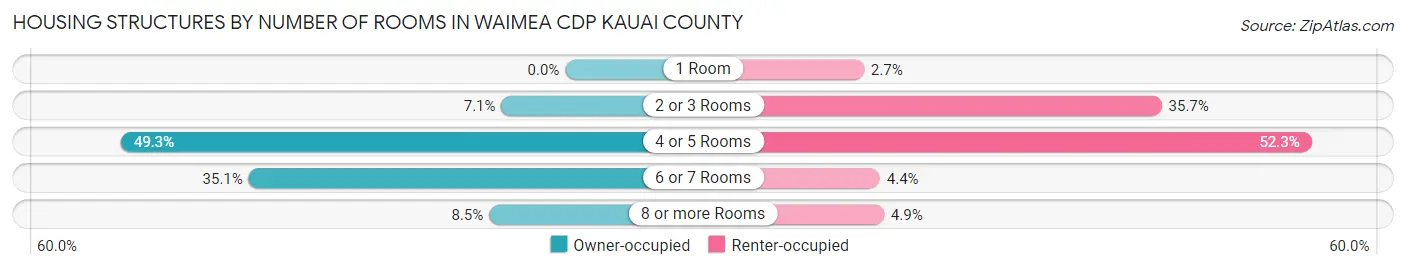
| Number of Rooms | Owner-occupied | Renter-occupied |
| 1 Room | 0 (0.0%) | 12 (2.7%) |
| 2 or 3 Rooms | 21 (7.1%) | 161 (35.7%) |
| 4 or 5 Rooms | 146 (49.3%) | 236 (52.3%) |
| 6 or 7 Rooms | 104 (35.1%) | 20 (4.4%) |
| 8 or more Rooms | 25 (8.5%) | 22 (4.9%) |
| Total | 296 (100.0%) | 451 (100.0%) |
Housing Structure by Heating Type in Waimea CDP Kauai County
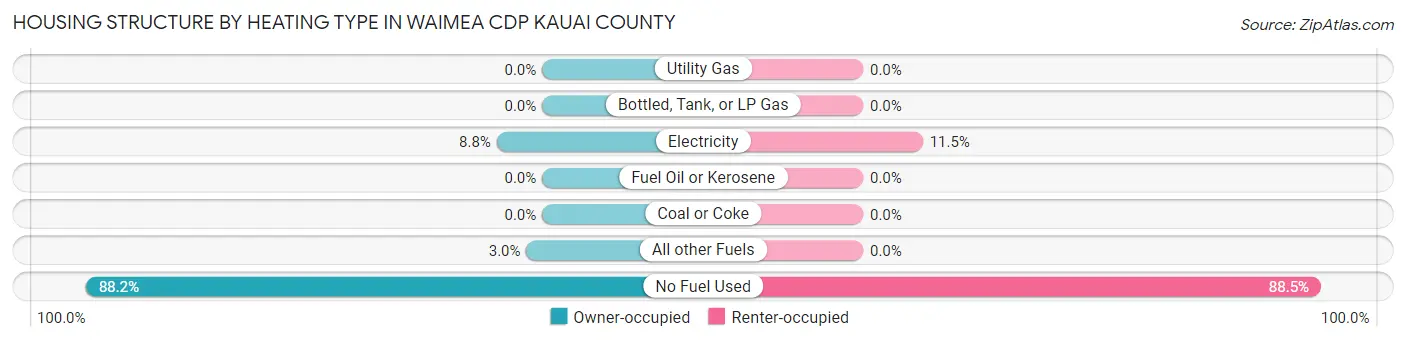
| Heating Type | Owner-occupied | Renter-occupied |
| Utility Gas | 0 (0.0%) | 0 (0.0%) |
| Bottled, Tank, or LP Gas | 0 (0.0%) | 0 (0.0%) |
| Electricity | 26 (8.8%) | 52 (11.5%) |
| Fuel Oil or Kerosene | 0 (0.0%) | 0 (0.0%) |
| Coal or Coke | 0 (0.0%) | 0 (0.0%) |
| All other Fuels | 9 (3.0%) | 0 (0.0%) |
| No Fuel Used | 261 (88.2%) | 399 (88.5%) |
| Total | 296 (100.0%) | 451 (100.0%) |
Household Vehicle Usage in Waimea CDP Kauai County
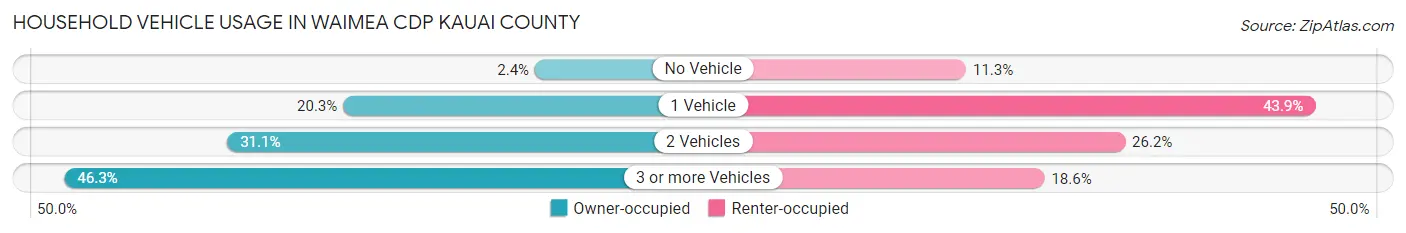
| Vehicles per Household | Owner-occupied | Renter-occupied |
| No Vehicle | 7 (2.4%) | 51 (11.3%) |
| 1 Vehicle | 60 (20.3%) | 198 (43.9%) |
| 2 Vehicles | 92 (31.1%) | 118 (26.2%) |
| 3 or more Vehicles | 137 (46.3%) | 84 (18.6%) |
| Total | 296 (100.0%) | 451 (100.0%) |
Real Estate & Mortgages in Waimea CDP Kauai County
Real Estate and Mortgage Overview in Waimea CDP Kauai County
| Characteristic | Without Mortgage | With Mortgage |
| Housing Units | 175 | 121 |
| Median Property Value | $525,500 | $513,900 |
| Median Household Income | $97,656 | $84 |
| Monthly Housing Costs | $474 | $16 |
| Real Estate Taxes | $953 | $0 |
Property Value by Mortgage Status in Waimea CDP Kauai County
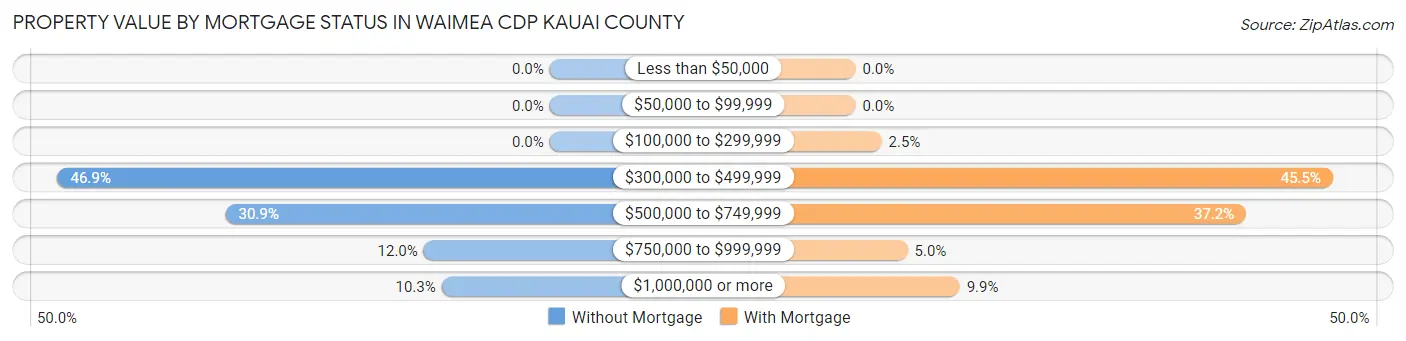
| Property Value | Without Mortgage | With Mortgage |
| Less than $50,000 | 0 (0.0%) | 0 (0.0%) |
| $50,000 to $99,999 | 0 (0.0%) | 0 (0.0%) |
| $100,000 to $299,999 | 0 (0.0%) | 3 (2.5%) |
| $300,000 to $499,999 | 82 (46.9%) | 55 (45.5%) |
| $500,000 to $749,999 | 54 (30.9%) | 45 (37.2%) |
| $750,000 to $999,999 | 21 (12.0%) | 6 (5.0%) |
| $1,000,000 or more | 18 (10.3%) | 12 (9.9%) |
| Total | 175 (100.0%) | 121 (100.0%) |
Household Income by Mortgage Status in Waimea CDP Kauai County
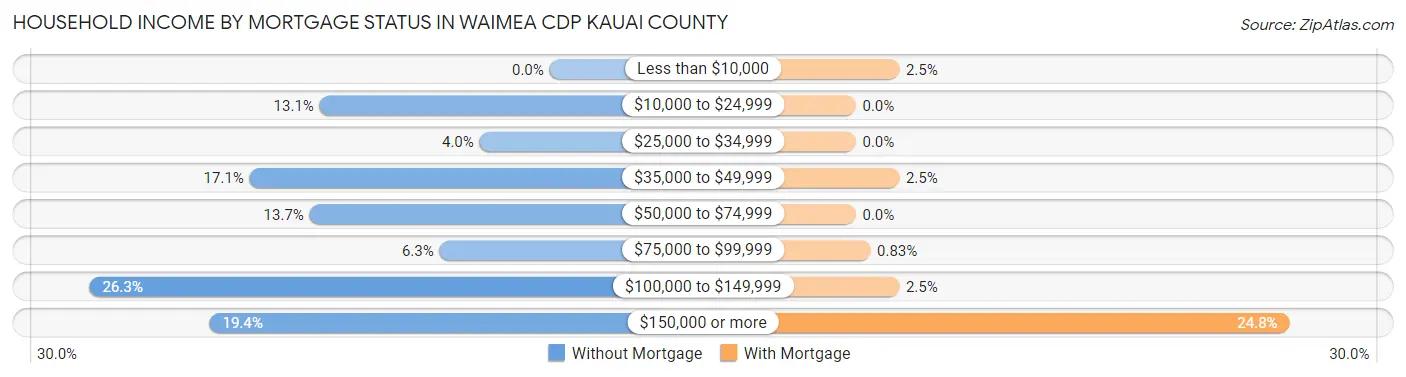
| Household Income | Without Mortgage | With Mortgage |
| Less than $10,000 | 0 (0.0%) | 3 (2.5%) |
| $10,000 to $24,999 | 23 (13.1%) | 0 (0.0%) |
| $25,000 to $34,999 | 7 (4.0%) | 0 (0.0%) |
| $35,000 to $49,999 | 30 (17.1%) | 3 (2.5%) |
| $50,000 to $74,999 | 24 (13.7%) | 0 (0.0%) |
| $75,000 to $99,999 | 11 (6.3%) | 1 (0.8%) |
| $100,000 to $149,999 | 46 (26.3%) | 3 (2.5%) |
| $150,000 or more | 34 (19.4%) | 30 (24.8%) |
| Total | 175 (100.0%) | 121 (100.0%) |
Property Value to Household Income Ratio in Waimea CDP Kauai County
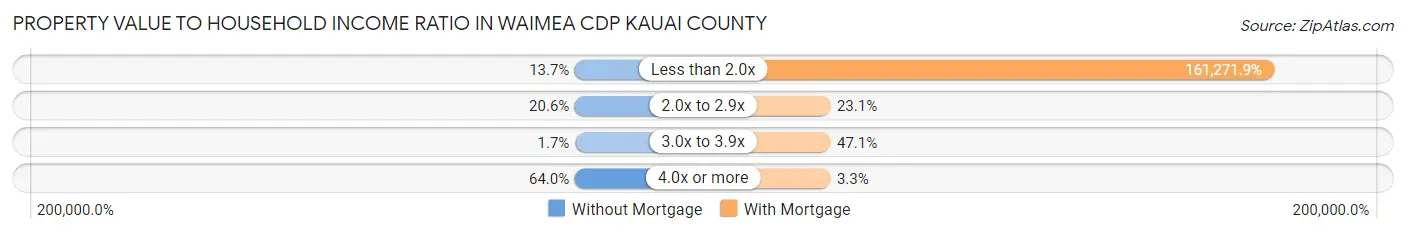
| Value-to-Income Ratio | Without Mortgage | With Mortgage |
| Less than 2.0x | 24 (13.7%) | 195,139 (161,271.9%) |
| 2.0x to 2.9x | 36 (20.6%) | 28 (23.1%) |
| 3.0x to 3.9x | 3 (1.7%) | 57 (47.1%) |
| 4.0x or more | 112 (64.0%) | 4 (3.3%) |
| Total | 175 (100.0%) | 121 (100.0%) |
Real Estate Taxes by Mortgage Status in Waimea CDP Kauai County
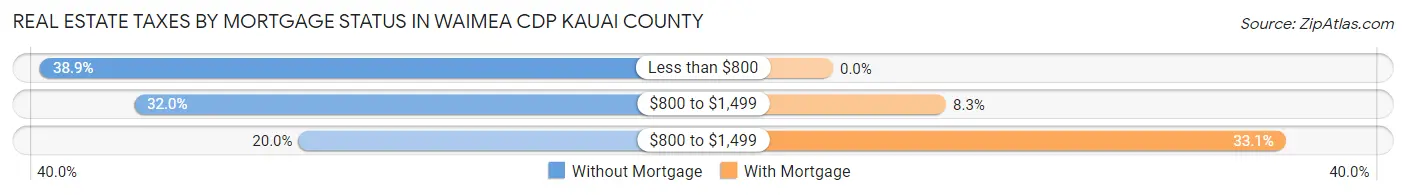
| Property Taxes | Without Mortgage | With Mortgage |
| Less than $800 | 68 (38.9%) | 0 (0.0%) |
| $800 to $1,499 | 56 (32.0%) | 10 (8.3%) |
| $800 to $1,499 | 35 (20.0%) | 40 (33.1%) |
| Total | 175 (100.0%) | 121 (100.0%) |
Health & Disability in Waimea CDP Kauai County
Health Insurance Coverage by Age in Waimea CDP Kauai County
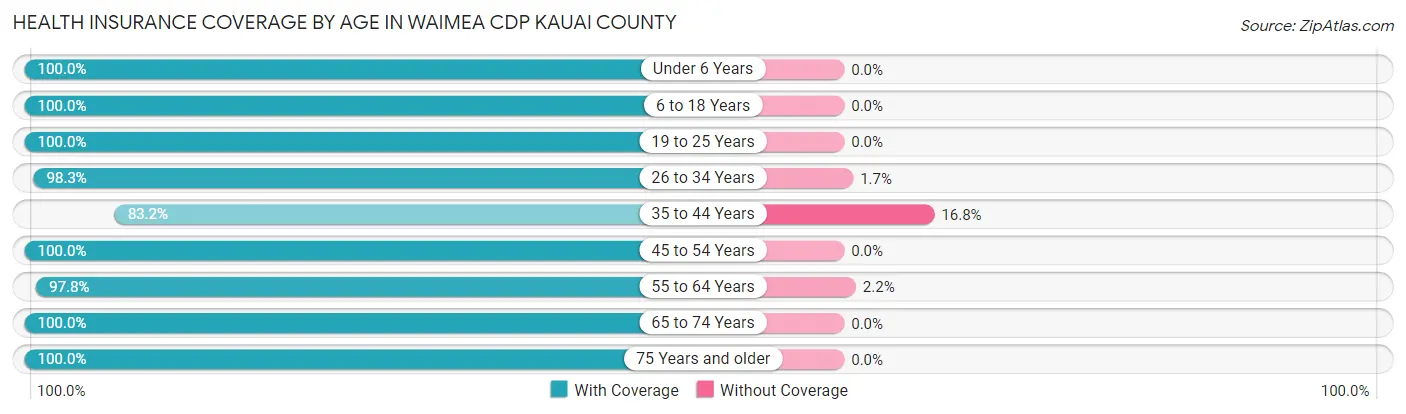
| Age Bracket | With Coverage | Without Coverage |
| Under 6 Years | 98 (100.0%) | 0 (0.0%) |
| 6 to 18 Years | 271 (100.0%) | 0 (0.0%) |
| 19 to 25 Years | 63 (100.0%) | 0 (0.0%) |
| 26 to 34 Years | 355 (98.3%) | 6 (1.7%) |
| 35 to 44 Years | 188 (83.2%) | 38 (16.8%) |
| 45 to 54 Years | 216 (100.0%) | 0 (0.0%) |
| 55 to 64 Years | 226 (97.8%) | 5 (2.2%) |
| 65 to 74 Years | 282 (100.0%) | 0 (0.0%) |
| 75 Years and older | 124 (100.0%) | 0 (0.0%) |
| Total | 1,823 (97.4%) | 49 (2.6%) |
Health Insurance Coverage by Citizenship Status in Waimea CDP Kauai County
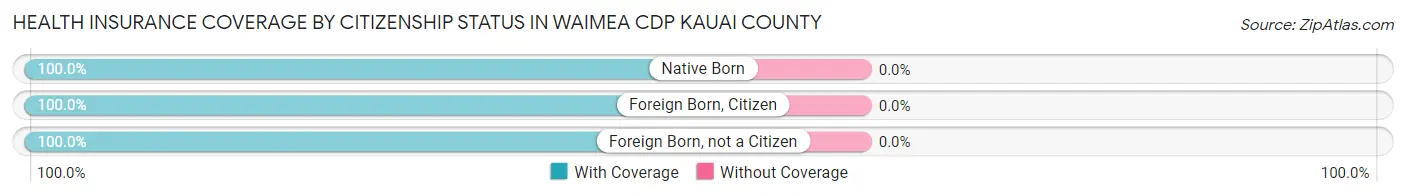
| Citizenship Status | With Coverage | Without Coverage |
| Native Born | 98 (100.0%) | 0 (0.0%) |
| Foreign Born, Citizen | 271 (100.0%) | 0 (0.0%) |
| Foreign Born, not a Citizen | 63 (100.0%) | 0 (0.0%) |
Health Insurance Coverage by Household Income in Waimea CDP Kauai County
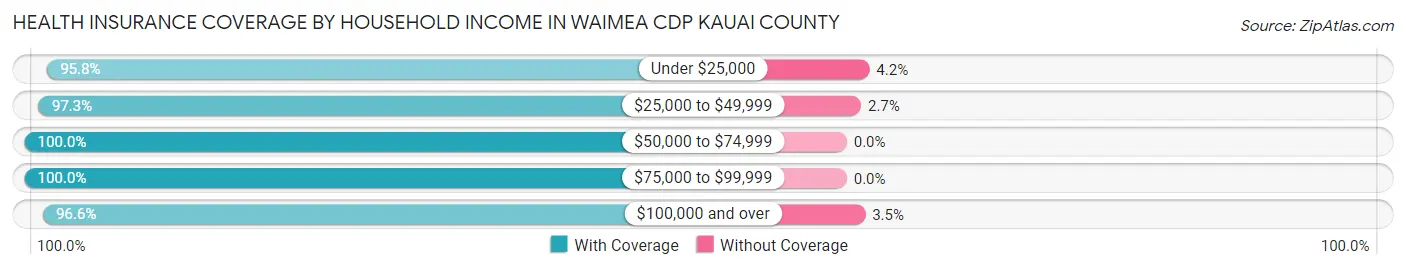
| Household Income | With Coverage | Without Coverage |
| Under $25,000 | 113 (95.8%) | 5 (4.2%) |
| $25,000 to $49,999 | 219 (97.3%) | 6 (2.7%) |
| $50,000 to $74,999 | 265 (100.0%) | 0 (0.0%) |
| $75,000 to $99,999 | 163 (100.0%) | 0 (0.0%) |
| $100,000 and over | 1,063 (96.6%) | 38 (3.5%) |
Public vs Private Health Insurance Coverage by Age in Waimea CDP Kauai County
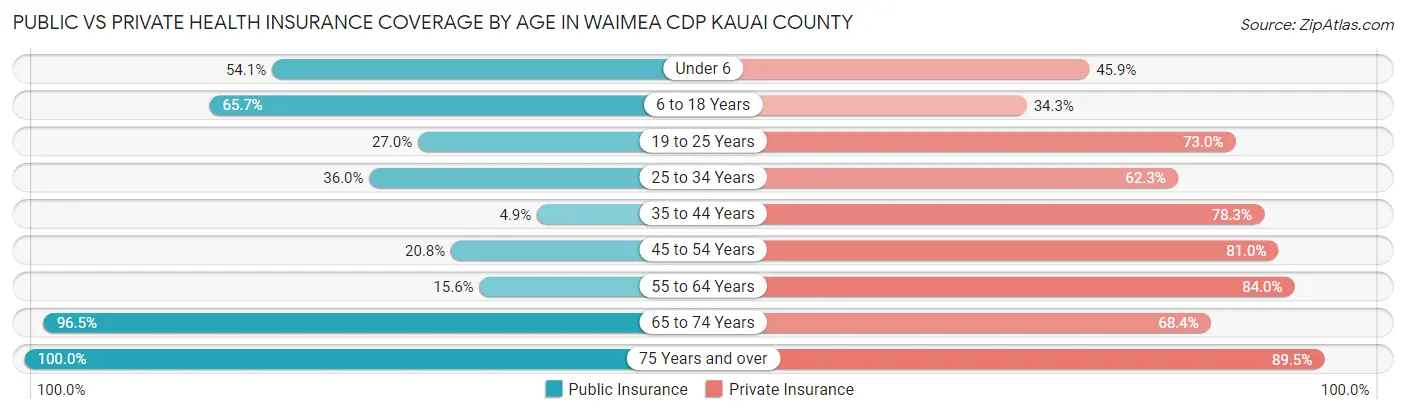
| Age Bracket | Public Insurance | Private Insurance |
| Under 6 | 53 (54.1%) | 45 (45.9%) |
| 6 to 18 Years | 178 (65.7%) | 93 (34.3%) |
| 19 to 25 Years | 17 (27.0%) | 46 (73.0%) |
| 25 to 34 Years | 130 (36.0%) | 225 (62.3%) |
| 35 to 44 Years | 11 (4.9%) | 177 (78.3%) |
| 45 to 54 Years | 45 (20.8%) | 175 (81.0%) |
| 55 to 64 Years | 36 (15.6%) | 194 (84.0%) |
| 65 to 74 Years | 272 (96.5%) | 193 (68.4%) |
| 75 Years and over | 124 (100.0%) | 111 (89.5%) |
| Total | 866 (46.3%) | 1,259 (67.2%) |
Disability Status by Sex by Age in Waimea CDP Kauai County
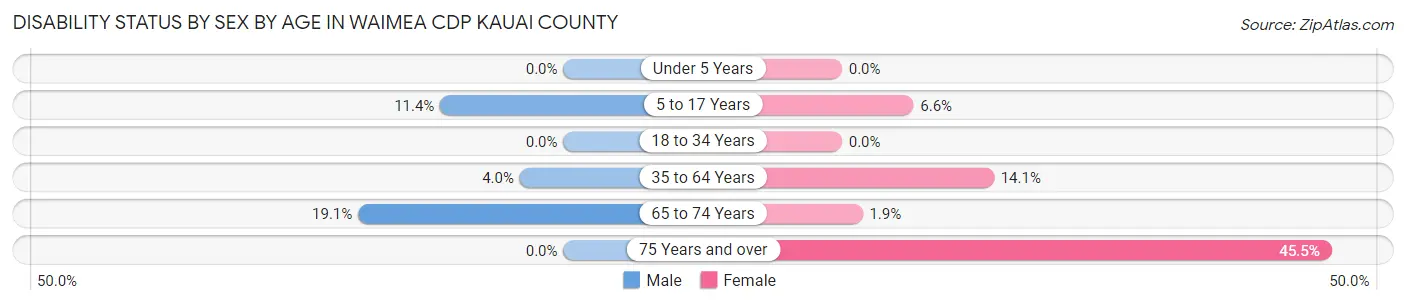
| Age Bracket | Male | Female |
| Under 5 Years | 0 (0.0%) | 0 (0.0%) |
| 5 to 17 Years | 8 (11.4%) | 14 (6.6%) |
| 18 to 34 Years | 0 (0.0%) | 0 (0.0%) |
| 35 to 64 Years | 12 (4.0%) | 53 (14.1%) |
| 65 to 74 Years | 24 (19.1%) | 3 (1.9%) |
| 75 Years and over | 0 (0.0%) | 30 (45.5%) |
Disability Class by Sex by Age in Waimea CDP Kauai County
Disability Class: Hearing Difficulty
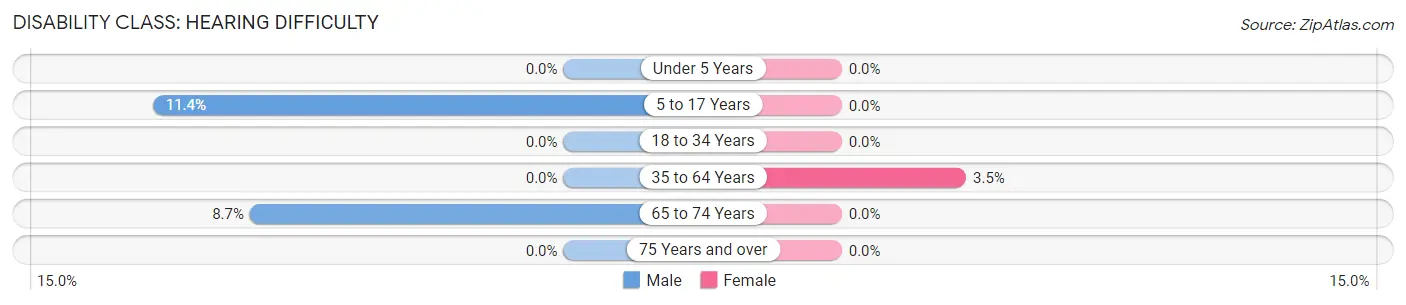
| Age Bracket | Male | Female |
| Under 5 Years | 0 (0.0%) | 0 (0.0%) |
| 5 to 17 Years | 8 (11.4%) | 0 (0.0%) |
| 18 to 34 Years | 0 (0.0%) | 0 (0.0%) |
| 35 to 64 Years | 0 (0.0%) | 13 (3.5%) |
| 65 to 74 Years | 11 (8.7%) | 0 (0.0%) |
| 75 Years and over | 0 (0.0%) | 0 (0.0%) |
Disability Class: Vision Difficulty
| Age Bracket | Male | Female |
| Under 5 Years | 0 (0.0%) | 0 (0.0%) |
| 5 to 17 Years | 0 (0.0%) | 0 (0.0%) |
| 18 to 34 Years | 0 (0.0%) | 0 (0.0%) |
| 35 to 64 Years | 0 (0.0%) | 0 (0.0%) |
| 65 to 74 Years | 0 (0.0%) | 0 (0.0%) |
| 75 Years and over | 0 (0.0%) | 0 (0.0%) |
Disability Class: Cognitive Difficulty
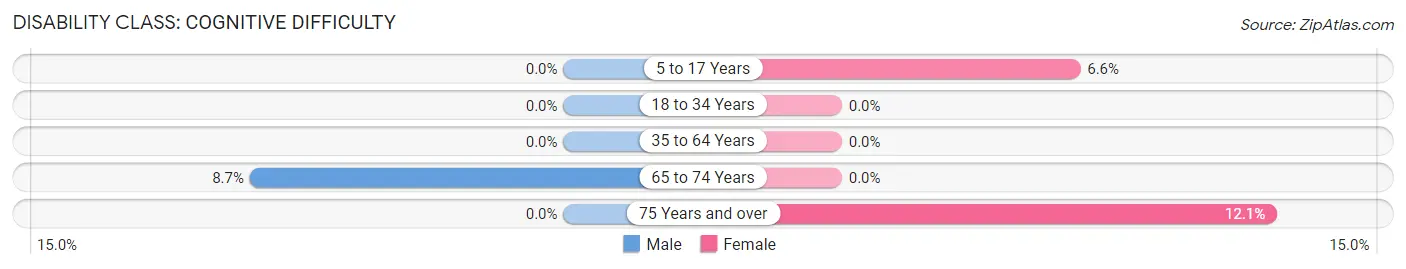
| Age Bracket | Male | Female |
| 5 to 17 Years | 0 (0.0%) | 14 (6.6%) |
| 18 to 34 Years | 0 (0.0%) | 0 (0.0%) |
| 35 to 64 Years | 0 (0.0%) | 0 (0.0%) |
| 65 to 74 Years | 11 (8.7%) | 0 (0.0%) |
| 75 Years and over | 0 (0.0%) | 8 (12.1%) |
Disability Class: Ambulatory Difficulty
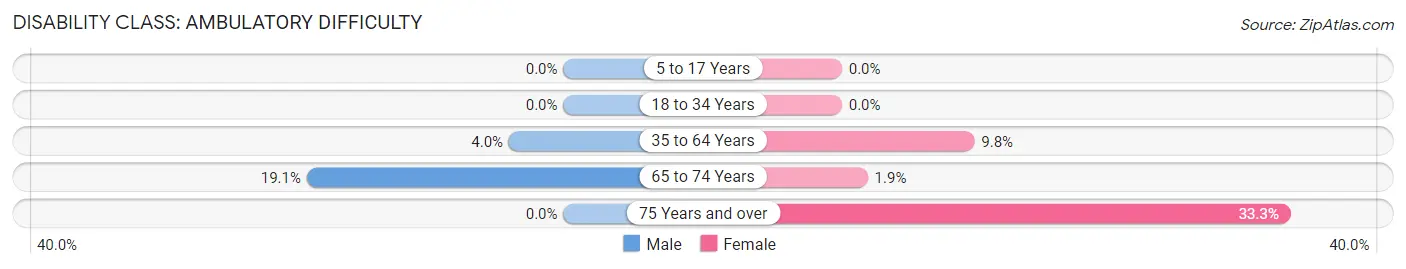
| Age Bracket | Male | Female |
| 5 to 17 Years | 0 (0.0%) | 0 (0.0%) |
| 18 to 34 Years | 0 (0.0%) | 0 (0.0%) |
| 35 to 64 Years | 12 (4.0%) | 37 (9.8%) |
| 65 to 74 Years | 24 (19.1%) | 3 (1.9%) |
| 75 Years and over | 0 (0.0%) | 22 (33.3%) |
Disability Class: Self-Care Difficulty
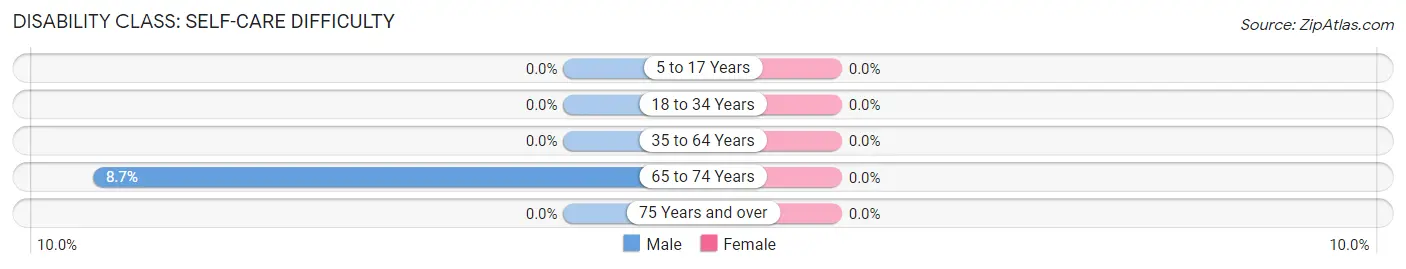
| Age Bracket | Male | Female |
| 5 to 17 Years | 0 (0.0%) | 0 (0.0%) |
| 18 to 34 Years | 0 (0.0%) | 0 (0.0%) |
| 35 to 64 Years | 0 (0.0%) | 0 (0.0%) |
| 65 to 74 Years | 11 (8.7%) | 0 (0.0%) |
| 75 Years and over | 0 (0.0%) | 0 (0.0%) |
Technology Access in Waimea CDP Kauai County
Computing Device Access in Waimea CDP Kauai County

| Device Type | # Households | % Households |
| Desktop or Laptop | 524 | 70.2% |
| Smartphone | 650 | 87.0% |
| Tablet | 410 | 54.9% |
| No Computing Device | 76 | 10.2% |
| Total | 747 | 100.0% |
Internet Access in Waimea CDP Kauai County
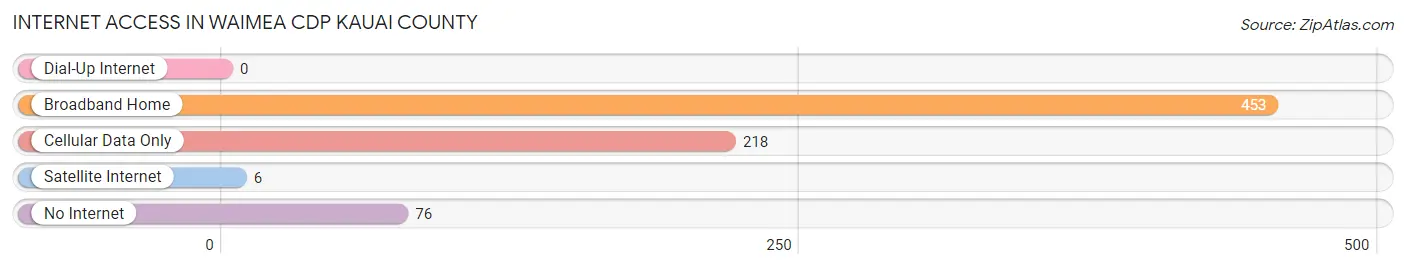
| Internet Type | # Households | % Households |
| Dial-Up Internet | 0 | 0.0% |
| Broadband Home | 453 | 60.6% |
| Cellular Data Only | 218 | 29.2% |
| Satellite Internet | 6 | 0.8% |
| No Internet | 76 | 10.2% |
| Total | 747 | 100.0% |
Waimea CDP Kauai County Summary
Waimea Cdp Kauai County, HI is a census-designated place (CDP) located in Kauai County, Hawaii. The population was 1,855 at the 2010 census. Waimea Cdp is located on the western side of the island of Kauai, and is the largest town on the island. The town is situated at the mouth of the Waimea River, and is the gateway to the Waimea Canyon, one of the most spectacular natural attractions in Hawaii.
History
Waimea Cdp has a long and rich history. The area was first settled by Polynesian voyagers in the late 1700s, and the town was officially established in 1820. The town was named after the Waimea River, which was named after the Hawaiian god of water, Waimea. The town was an important port for the whaling industry in the 19th century, and was also a major center for the sugar industry. In the early 20th century, Waimea Cdp was a major center for the pineapple industry.
Geography
Waimea Cdp is located on the western side of the island of Kauai, at the mouth of the Waimea River. The town is situated at an elevation of about 500 feet above sea level. The town is surrounded by lush tropical rainforest, and is located near the Waimea Canyon, one of the most spectacular natural attractions in Hawaii. The town is located about 25 miles from the island's main airport, Lihue Airport.
Economy
Waimea Cdp is a major center for tourism on the island of Kauai. The town is home to several resorts and hotels, as well as a variety of restaurants and shops. The town is also home to several agricultural operations, including pineapple and sugarcane plantations. The town is also home to several technology companies, including the software company, Xilinx.
Demographics
As of the 2010 census, there were 1,855 people, 690 households, and 463 families residing in Waimea Cdp. The population density was 1,072.3 people per square mile. The racial makeup of the town was 58.3% White, 0.7% African American, 0.3% Native American, 15.2% Asian, 0.2% Pacific Islander, 0.7% from other races, and 24.7% from two or more races. Hispanic or Latino of any race were 8.2% of the population.
The median income for a household in Waimea Cdp was $50,938, and the median income for a family was $60,938. The per capita income for the town was $25,938. About 8.2% of families and 11.2% of the population were below the poverty line, including 15.2% of those under age 18 and 8.2% of those age 65 or over.
Conclusion
Waimea Cdp Kauai County, HI is a census-designated place located in Kauai County, Hawaii. The town has a long and rich history, and is a major center for tourism on the island of Kauai. The town is home to several resorts and hotels, as well as a variety of restaurants and shops. The town is also home to several agricultural operations, including pineapple and sugarcane plantations. The population of Waimea Cdp was 1,855 at the 2010 census, and the median income for a household was $50,938.
Common Questions
What is Per Capita Income in Waimea CDP Kauai County?
Per Capita income in Waimea CDP Kauai County is $44,082.
What is the Median Family Income in Waimea CDP Kauai County?
Median Family Income in Waimea CDP Kauai County is $111,250.
What is the Median Household income in Waimea CDP Kauai County?
Median Household Income in Waimea CDP Kauai County is $95,972.
What is Income or Wage Gap in Waimea CDP Kauai County?
Income or Wage Gap in Waimea CDP Kauai County is 48.8%.
Women in Waimea CDP Kauai County earn 51.2 cents for every dollar earned by a man.
What is Inequality or Gini Index in Waimea CDP Kauai County?
Inequality or Gini Index in Waimea CDP Kauai County is 0.42.
What is the Total Population of Waimea CDP Kauai County?
Total Population of Waimea CDP Kauai County is 1,951.
What is the Total Male Population of Waimea CDP Kauai County?
Total Male Population of Waimea CDP Kauai County is 892.
What is the Total Female Population of Waimea CDP Kauai County?
Total Female Population of Waimea CDP Kauai County is 1,059.
What is the Ratio of Males per 100 Females in Waimea CDP Kauai County?
There are 84.23 Males per 100 Females in Waimea CDP Kauai County.
What is the Ratio of Females per 100 Males in Waimea CDP Kauai County?
There are 118.72 Females per 100 Males in Waimea CDP Kauai County.
What is the Median Population Age in Waimea CDP Kauai County?
Median Population Age in Waimea CDP Kauai County is 44.1 Years.
What is the Average Family Size in Waimea CDP Kauai County
Average Family Size in Waimea CDP Kauai County is 3.7 People.
What is the Average Household Size in Waimea CDP Kauai County
Average Household Size in Waimea CDP Kauai County is 2.5 People.
How Large is the Labor Force in Waimea CDP Kauai County?
There are 1,095 People in the Labor Forcein in Waimea CDP Kauai County.
What is the Percentage of People in the Labor Force in Waimea CDP Kauai County?
66.7% of People are in the Labor Force in Waimea CDP Kauai County.
What is the Unemployment Rate in Waimea CDP Kauai County?
Unemployment Rate in Waimea CDP Kauai County is 4.8%.