Kalaeloa, HI Map & Demographics
Kalaeloa Map
Kalaeloa Overview
$28,571
PER CAPITA INCOME
$99,191
AVG FAMILY INCOME
$82,188
AVG HOUSEHOLD INCOME
22.6%
WAGE / INCOME GAP [ % ]
77.4¢/ $1
WAGE / INCOME GAP [ $ ]
0.39
INEQUALITY / GINI INDEX
2,971
TOTAL POPULATION
1,684
MALE POPULATION
1,287
FEMALE POPULATION
130.85
MALES / 100 FEMALES
76.43
FEMALES / 100 MALES
32.2
MEDIAN AGE
3.5
AVG FAMILY SIZE
2.8
AVG HOUSEHOLD SIZE
1,588
LABOR FORCE [ PEOPLE ]
70.1%
PERCENT IN LABOR FORCE
7.6%
UNEMPLOYMENT RATE
Income in Kalaeloa
Income Overview in Kalaeloa
Per Capita Income in Kalaeloa is $28,571, while median incomes of families and households are $99,191 and $82,188 respectively.
| Characteristic | Number | Measure |
| Per Capita Income | 2,971 | $28,571 |
| Median Family Income | 463 | $99,191 |
| Mean Family Income | 463 | $102,988 |
| Median Household Income | 806 | $82,188 |
| Mean Household Income | 806 | $93,672 |
| Income Deficit | 463 | $0 |
| Wage / Income Gap (%) | 2,971 | 22.61% |
| Wage / Income Gap ($) | 2,971 | 77.39¢ per $1 |
| Gini / Inequality Index | 2,971 | 0.39 |
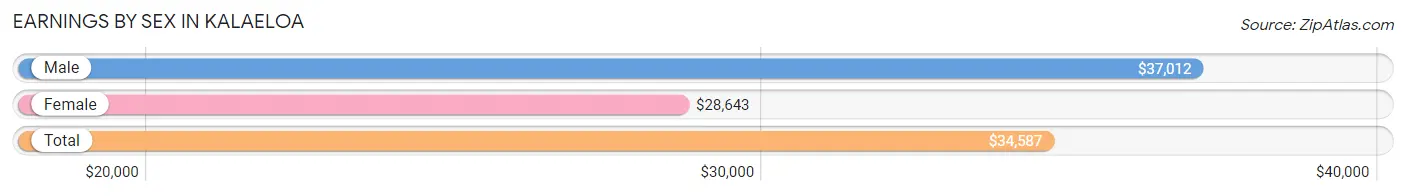
Earnings by Sex in Kalaeloa
Average Earnings in Kalaeloa are $34,587, $37,012 for men and $28,643 for women, a difference of 22.6%.
| Sex | Number | Average Earnings |
| Male | 1,019 (61.1%) | $37,012 |
| Female | 650 (39.0%) | $28,643 |
| Total | 1,669 (100.0%) | $34,587 |
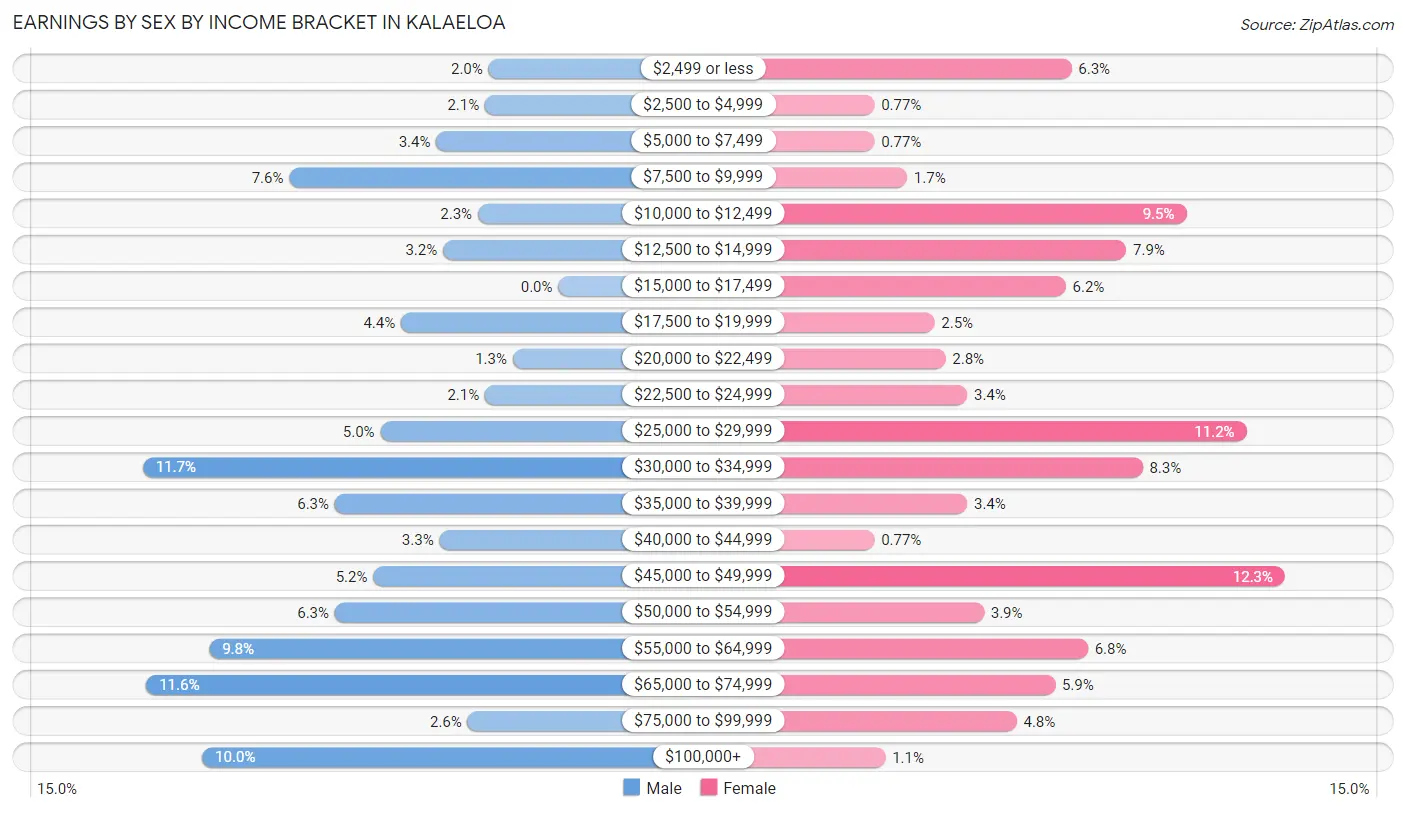
Earnings by Sex by Income Bracket in Kalaeloa
The most common earnings brackets in Kalaeloa are $30,000 to $34,999 for men (119 | 11.7%) and $45,000 to $49,999 for women (80 | 12.3%).
| Income | Male | Female |
| $2,499 or less | 20 (2.0%) | 41 (6.3%) |
| $2,500 to $4,999 | 21 (2.1%) | 5 (0.8%) |
| $5,000 to $7,499 | 35 (3.4%) | 5 (0.8%) |
| $7,500 to $9,999 | 77 (7.6%) | 11 (1.7%) |
| $10,000 to $12,499 | 23 (2.3%) | 62 (9.5%) |
| $12,500 to $14,999 | 33 (3.2%) | 51 (7.9%) |
| $15,000 to $17,499 | 0 (0.0%) | 40 (6.1%) |
| $17,500 to $19,999 | 45 (4.4%) | 16 (2.5%) |
| $20,000 to $22,499 | 13 (1.3%) | 18 (2.8%) |
| $22,500 to $24,999 | 21 (2.1%) | 22 (3.4%) |
| $25,000 to $29,999 | 51 (5.0%) | 73 (11.2%) |
| $30,000 to $34,999 | 119 (11.7%) | 54 (8.3%) |
| $35,000 to $39,999 | 64 (6.3%) | 22 (3.4%) |
| $40,000 to $44,999 | 34 (3.3%) | 5 (0.8%) |
| $45,000 to $49,999 | 53 (5.2%) | 80 (12.3%) |
| $50,000 to $54,999 | 64 (6.3%) | 25 (3.8%) |
| $55,000 to $64,999 | 100 (9.8%) | 44 (6.8%) |
| $65,000 to $74,999 | 118 (11.6%) | 38 (5.9%) |
| $75,000 to $99,999 | 26 (2.5%) | 31 (4.8%) |
| $100,000+ | 102 (10.0%) | 7 (1.1%) |
| Total | 1,019 (100.0%) | 650 (100.0%) |
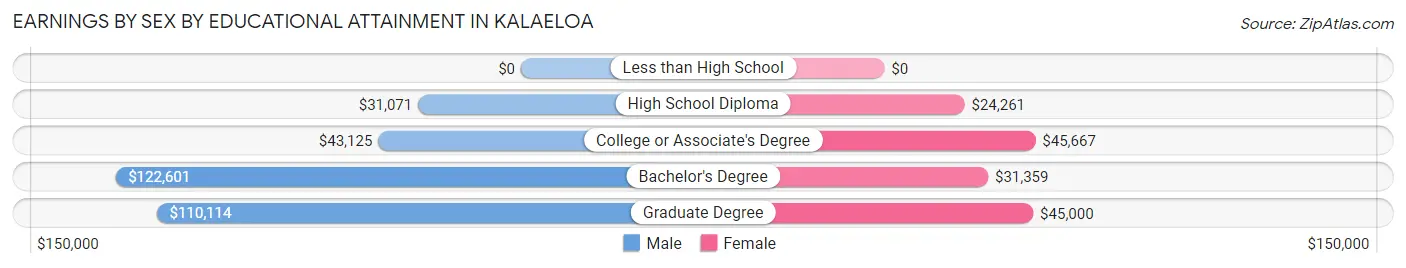
Earnings by Sex by Educational Attainment in Kalaeloa
Average earnings in Kalaeloa are $40,278 for men and $30,109 for women, a difference of 25.3%. Men with an educational attainment of bachelor's degree enjoy the highest average annual earnings of $122,601, while those with high school diploma education earn the least with $31,071. Women with an educational attainment of college or associate's degree earn the most with the average annual earnings of $45,667, while those with high school diploma education have the smallest earnings of $24,261.
| Educational Attainment | Male Income | Female Income |
| Less than High School | - | - |
| High School Diploma | $31,071 | $24,261 |
| College or Associate's Degree | $43,125 | $45,667 |
| Bachelor's Degree | $122,601 | $31,359 |
| Graduate Degree | $110,114 | $45,000 |
| Total | $40,278 | $30,109 |
Family Income in Kalaeloa
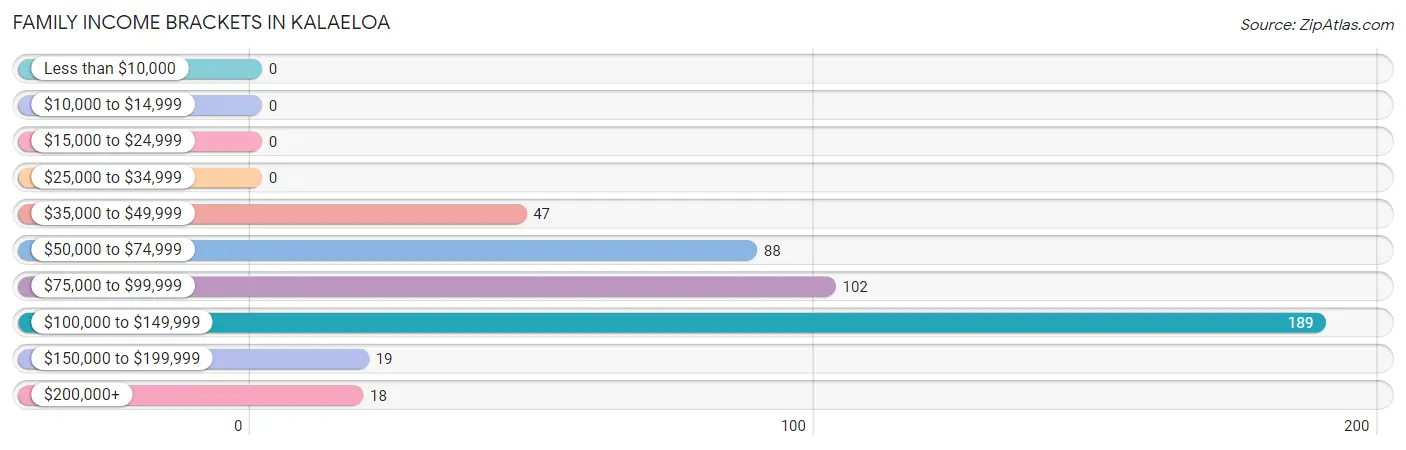
Family Income Brackets in Kalaeloa
According to the Kalaeloa family income data, there are 189 families falling into the $100,000 to $149,999 income range, which is the most common income bracket and makes up 40.8% of all families.
| Income Bracket | # Families | % Families |
| Less than $10,000 | 0 | 0.0% |
| $10,000 to $14,999 | 0 | 0.0% |
| $15,000 to $24,999 | 0 | 0.0% |
| $25,000 to $34,999 | 0 | 0.0% |
| $35,000 to $49,999 | 47 | 10.2% |
| $50,000 to $74,999 | 88 | 19.0% |
| $75,000 to $99,999 | 102 | 22.0% |
| $100,000 to $149,999 | 189 | 40.8% |
| $150,000 to $199,999 | 19 | 4.1% |
| $200,000+ | 18 | 3.9% |
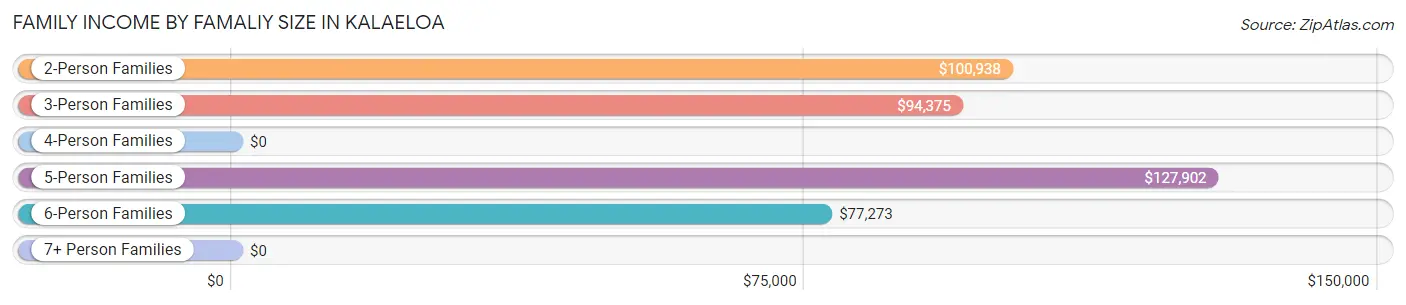
Family Income by Famaliy Size in Kalaeloa
5-person families (59 | 12.7%) account for the highest median family income in Kalaeloa with $127,902 per family, while 2-person families (173 | 37.4%) have the highest median income of $50,469 per family member.
| Income Bracket | # Families | Median Income |
| 2-Person Families | 173 (37.4%) | $100,938 |
| 3-Person Families | 101 (21.8%) | $94,375 |
| 4-Person Families | 77 (16.6%) | $0 |
| 5-Person Families | 59 (12.7%) | $127,902 |
| 6-Person Families | 50 (10.8%) | $77,273 |
| 7+ Person Families | 3 (0.6%) | $0 |
| Total | 463 (100.0%) | $99,191 |
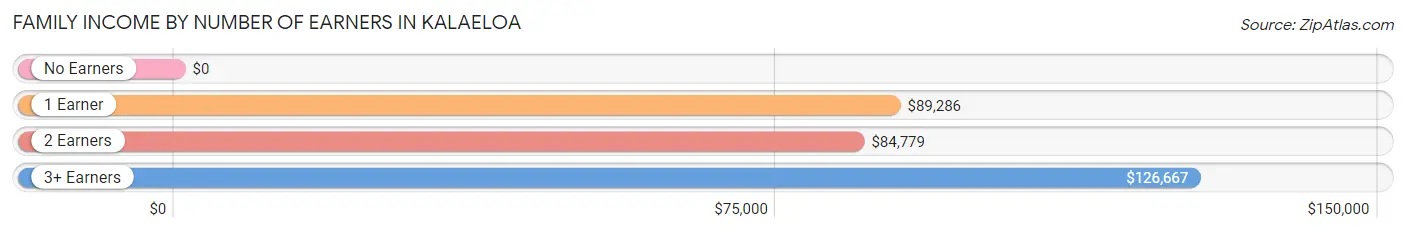
Family Income by Number of Earners in Kalaeloa
| Number of Earners | # Families | Median Income |
| No Earners | 4 (0.9%) | $0 |
| 1 Earner | 140 (30.2%) | $89,286 |
| 2 Earners | 227 (49.0%) | $84,779 |
| 3+ Earners | 92 (19.9%) | $126,667 |
| Total | 463 (100.0%) | $99,191 |
Household Income in Kalaeloa
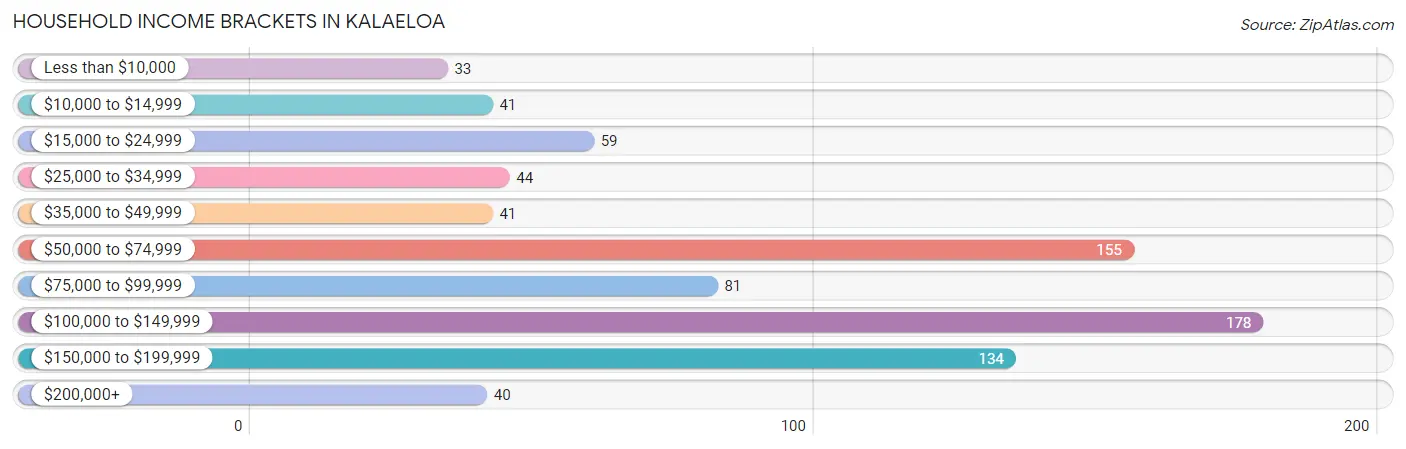
Household Income Brackets in Kalaeloa
With 178 households falling in the category, the $100,000 to $149,999 income range is the most frequent in Kalaeloa, accounting for 22.1% of all households. In contrast, only 33 households (4.1%) fall into the less than $10,000 income bracket, making it the least populous group.
| Income Bracket | # Households | % Households |
| Less than $10,000 | 33 | 4.1% |
| $10,000 to $14,999 | 41 | 5.1% |
| $15,000 to $24,999 | 59 | 7.3% |
| $25,000 to $34,999 | 44 | 5.5% |
| $35,000 to $49,999 | 41 | 5.1% |
| $50,000 to $74,999 | 155 | 19.2% |
| $75,000 to $99,999 | 81 | 10.0% |
| $100,000 to $149,999 | 178 | 22.1% |
| $150,000 to $199,999 | 134 | 16.6% |
| $200,000+ | 40 | 5.0% |
Household Income by Householder Age in Kalaeloa
The median household income in Kalaeloa is $82,188, with the highest median household income of $106,389 found in the 25 to 44 years age bracket for the primary householder. A total of 362 households (44.9%) fall into this category. Meanwhile, the 65+ years age bracket for the primary householder has the lowest median household income of $29,000, with 72 households (8.9%) in this group.
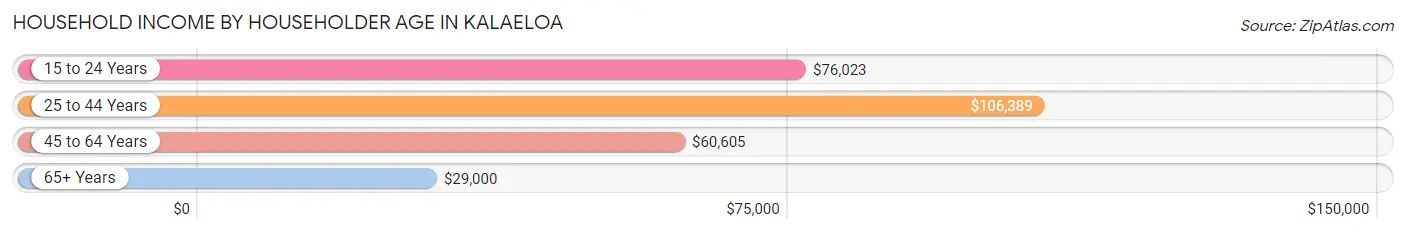
| Income Bracket | # Households | Median Income |
| 15 to 24 Years | 127 (15.8%) | $76,023 |
| 25 to 44 Years | 362 (44.9%) | $106,389 |
| 45 to 64 Years | 245 (30.4%) | $60,605 |
| 65+ Years | 72 (8.9%) | $29,000 |
| Total | 806 (100.0%) | $82,188 |
Poverty in Kalaeloa
Income Below Poverty by Sex and Age in Kalaeloa
With 17.6% poverty level for males and 14.4% for females among the residents of Kalaeloa, 65 to 74 year old males and 35 to 44 year old females are the most vulnerable to poverty, with 35 males (43.2%) and 63 females (30.9%) in their respective age groups living below the poverty level.
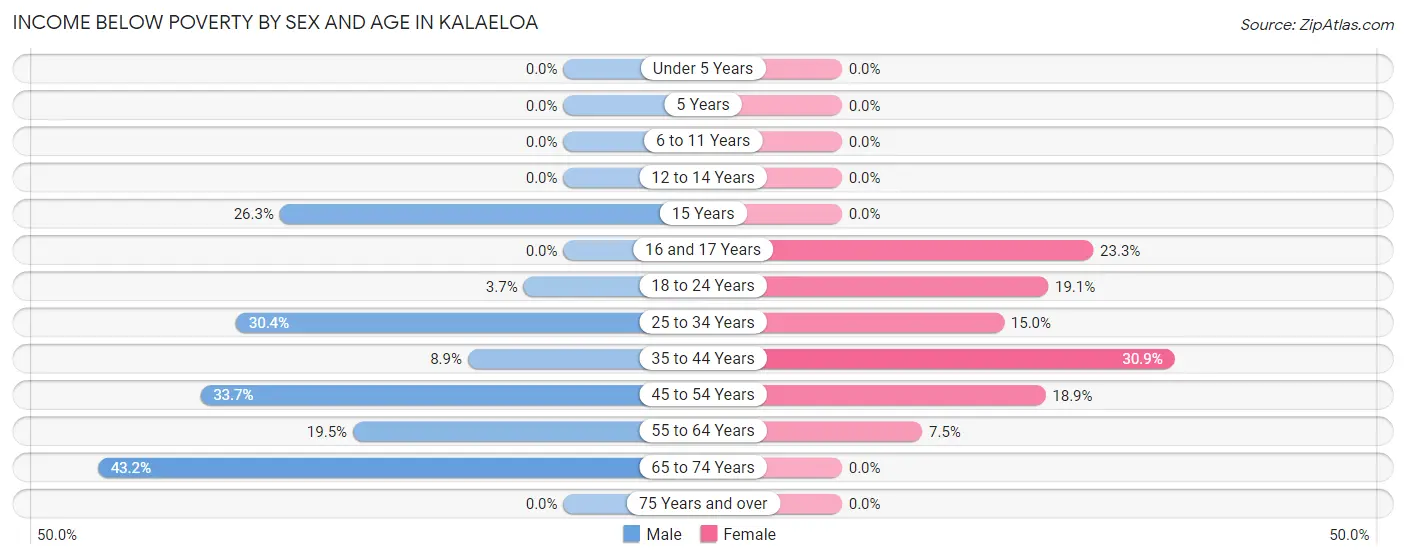
| Age Bracket | Male | Female |
| Under 5 Years | 0 (0.0%) | 0 (0.0%) |
| 5 Years | 0 (0.0%) | 0 (0.0%) |
| 6 to 11 Years | 0 (0.0%) | 0 (0.0%) |
| 12 to 14 Years | 0 (0.0%) | 0 (0.0%) |
| 15 Years | 5 (26.3%) | 0 (0.0%) |
| 16 and 17 Years | 0 (0.0%) | 7 (23.3%) |
| 18 to 24 Years | 8 (3.7%) | 31 (19.1%) |
| 25 to 34 Years | 93 (30.4%) | 40 (15.0%) |
| 35 to 44 Years | 26 (8.9%) | 63 (30.9%) |
| 45 to 54 Years | 61 (33.7%) | 17 (18.9%) |
| 55 to 64 Years | 50 (19.5%) | 7 (7.4%) |
| 65 to 74 Years | 35 (43.2%) | 0 (0.0%) |
| 75 Years and over | 0 (0.0%) | 0 (0.0%) |
| Total | 278 (17.6%) | 165 (14.4%) |
Income Above Poverty by Sex and Age in Kalaeloa
According to the poverty statistics in Kalaeloa, males aged under 5 years and females aged under 5 years are the age groups that are most secure financially, with 100.0% of males and 100.0% of females in these age groups living above the poverty line.
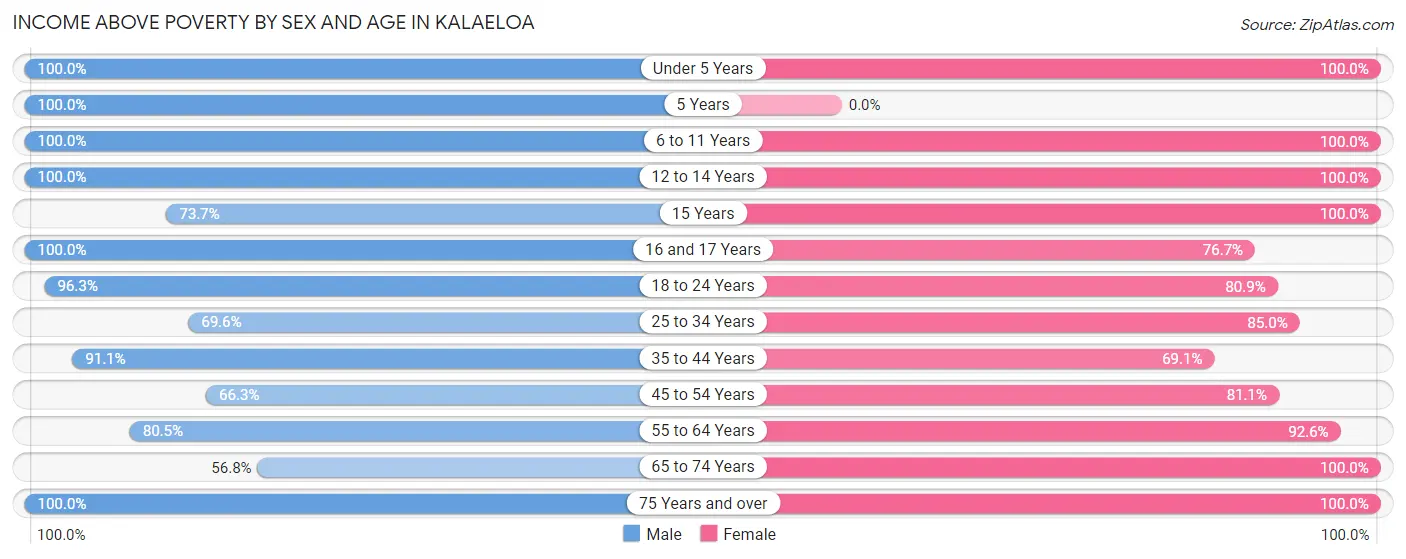
| Age Bracket | Male | Female |
| Under 5 Years | 25 (100.0%) | 55 (100.0%) |
| 5 Years | 15 (100.0%) | 0 (0.0%) |
| 6 to 11 Years | 118 (100.0%) | 128 (100.0%) |
| 12 to 14 Years | 42 (100.0%) | 47 (100.0%) |
| 15 Years | 14 (73.7%) | 19 (100.0%) |
| 16 and 17 Years | 14 (100.0%) | 23 (76.7%) |
| 18 to 24 Years | 208 (96.3%) | 131 (80.9%) |
| 25 to 34 Years | 213 (69.6%) | 226 (85.0%) |
| 35 to 44 Years | 267 (91.1%) | 141 (69.1%) |
| 45 to 54 Years | 120 (66.3%) | 73 (81.1%) |
| 55 to 64 Years | 206 (80.5%) | 87 (92.5%) |
| 65 to 74 Years | 46 (56.8%) | 30 (100.0%) |
| 75 Years and over | 12 (100.0%) | 22 (100.0%) |
| Total | 1,300 (82.4%) | 982 (85.6%) |
Income Below Poverty Among Married-Couple Families in Kalaeloa
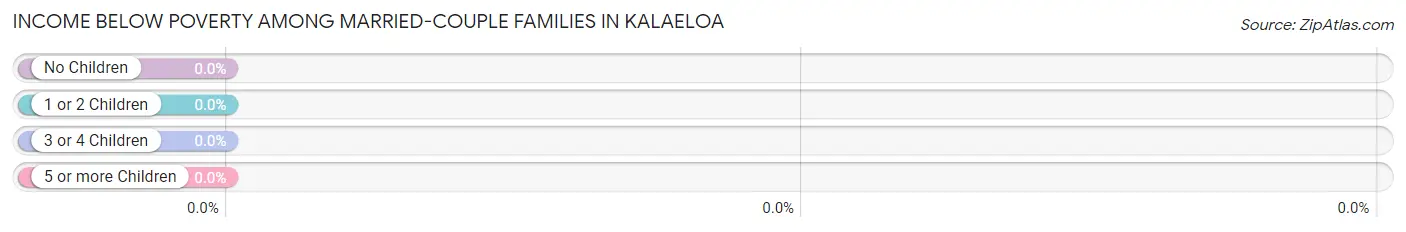
| Children | Above Poverty | Below Poverty |
| No Children | 188 (100.0%) | 0 (0.0%) |
| 1 or 2 Children | 122 (100.0%) | 0 (0.0%) |
| 3 or 4 Children | 31 (100.0%) | 0 (0.0%) |
| 5 or more Children | 0 (0.0%) | 0 (0.0%) |
| Total | 341 (100.0%) | 0 (0.0%) |
Income Below Poverty Among Single-Parent Households in Kalaeloa
| Children | Single Father | Single Mother |
| No Children | 0 (0.0%) | 0 (0.0%) |
| 1 or 2 Children | 0 (0.0%) | 0 (0.0%) |
| 3 or 4 Children | 0 (0.0%) | 0 (0.0%) |
| 5 or more Children | 0 (0.0%) | 0 (0.0%) |
| Total | 0 (0.0%) | 0 (0.0%) |
Income Below Poverty Among Married-Couple vs Single-Parent Households in Kalaeloa
| Children | Married-Couple Families | Single-Parent Households |
| No Children | 0 (0.0%) | 0 (0.0%) |
| 1 or 2 Children | 0 (0.0%) | 0 (0.0%) |
| 3 or 4 Children | 0 (0.0%) | 0 (0.0%) |
| 5 or more Children | 0 (0.0%) | 0 (0.0%) |
| Total | 0 (0.0%) | 0 (0.0%) |
Race in Kalaeloa
The most populous races in Kalaeloa are Hawaiian / Pacific (914 | 30.8%), Two or more Races (895 | 30.1%), and White / Caucasian (522 | 17.6%).
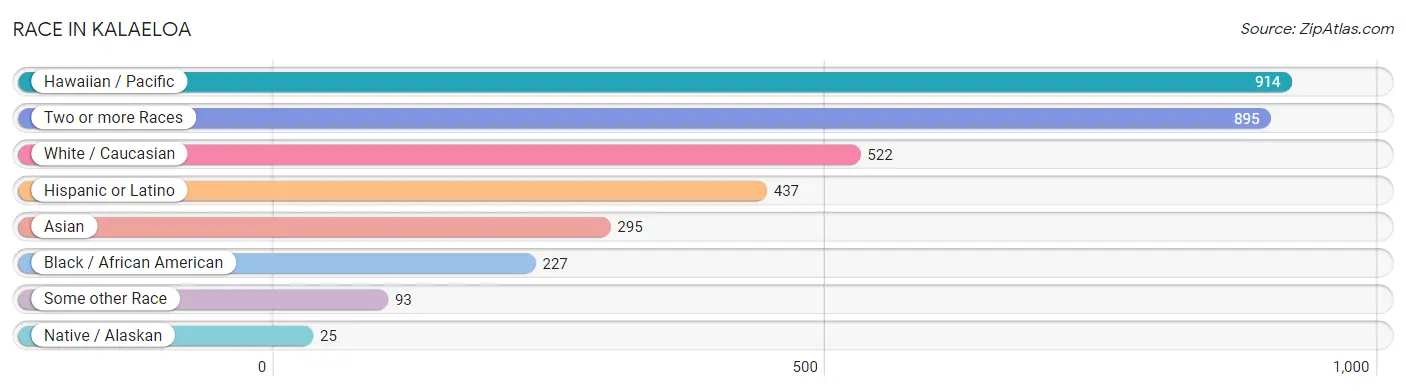
| Race | # Population | % Population |
| Asian | 295 | 9.9% |
| Black / African American | 227 | 7.6% |
| Hawaiian / Pacific | 914 | 30.8% |
| Hispanic or Latino | 437 | 14.7% |
| Native / Alaskan | 25 | 0.8% |
| White / Caucasian | 522 | 17.6% |
| Two or more Races | 895 | 30.1% |
| Some other Race | 93 | 3.1% |
| Total | 2,971 | 100.0% |
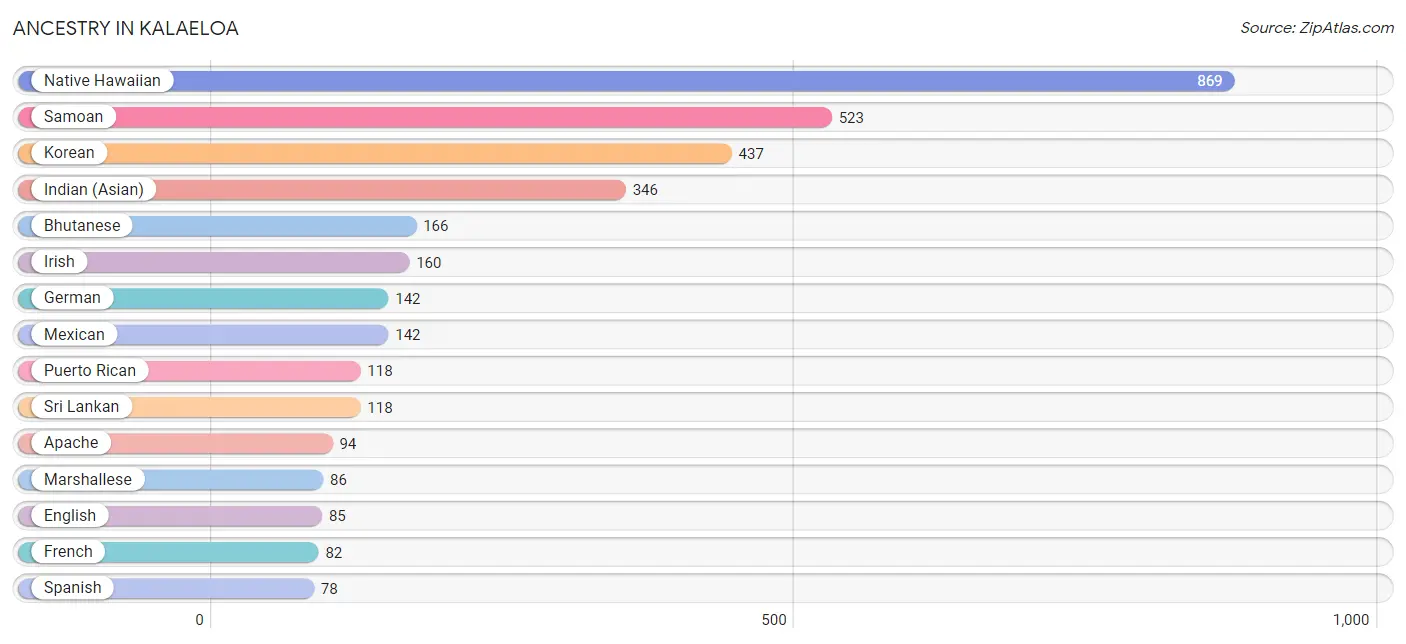
Ancestry in Kalaeloa
The most populous ancestries reported in Kalaeloa are Native Hawaiian (869 | 29.2%), Samoan (523 | 17.6%), Korean (437 | 14.7%), Indian (Asian) (346 | 11.7%), and Bhutanese (166 | 5.6%), together accounting for 78.8% of all Kalaeloa residents.
| Ancestry | # Population | % Population |
| Alaskan Athabascan | 5 | 0.2% |
| Albanian | 4 | 0.1% |
| American | 65 | 2.2% |
| Apache | 94 | 3.2% |
| Bhutanese | 166 | 5.6% |
| Blackfeet | 25 | 0.8% |
| Brazilian | 11 | 0.4% |
| Bulgarian | 13 | 0.4% |
| Burmese | 19 | 0.6% |
| Canadian | 3 | 0.1% |
| Central American | 41 | 1.4% |
| Cherokee | 44 | 1.5% |
| Chilean | 5 | 0.2% |
| Chinese | 4 | 0.1% |
| Chippewa | 9 | 0.3% |
| Costa Rican | 6 | 0.2% |
| Cuban | 40 | 1.3% |
| Dominican | 11 | 0.4% |
| Dutch | 5 | 0.2% |
| English | 85 | 2.9% |
| European | 20 | 0.7% |
| Fijian | 11 | 0.4% |
| French | 82 | 2.8% |
| German | 142 | 4.8% |
| Greek | 5 | 0.2% |
| Guamanian / Chamorro | 9 | 0.3% |
| Honduran | 17 | 0.6% |
| Indian (Asian) | 346 | 11.7% |
| Irish | 160 | 5.4% |
| Iroquois | 2 | 0.1% |
| Italian | 42 | 1.4% |
| Korean | 437 | 14.7% |
| Malaysian | 47 | 1.6% |
| Marshallese | 86 | 2.9% |
| Mexican | 142 | 4.8% |
| Native Hawaiian | 869 | 29.2% |
| Norwegian | 76 | 2.6% |
| Pakistani | 7 | 0.2% |
| Polish | 36 | 1.2% |
| Portuguese | 77 | 2.6% |
| Puerto Rican | 118 | 4.0% |
| Salvadoran | 18 | 0.6% |
| Samoan | 523 | 17.6% |
| Slavic | 13 | 0.4% |
| South American | 5 | 0.2% |
| Spanish | 78 | 2.6% |
| Sri Lankan | 118 | 4.0% |
| Subsaharan African | 3 | 0.1% |
| Swedish | 14 | 0.5% |
| Ukrainian | 37 | 1.3% |
| Welsh | 62 | 2.1% | View All 51 Rows |
Immigrants in Kalaeloa
The most numerous immigrant groups reported in Kalaeloa came from Oceania (304 | 10.2%), Micronesia (107 | 3.6%), Asia (103 | 3.5%), South Eastern Asia (92 | 3.1%), and Philippines (54 | 1.8%), together accounting for 22.2% of all Kalaeloa residents.
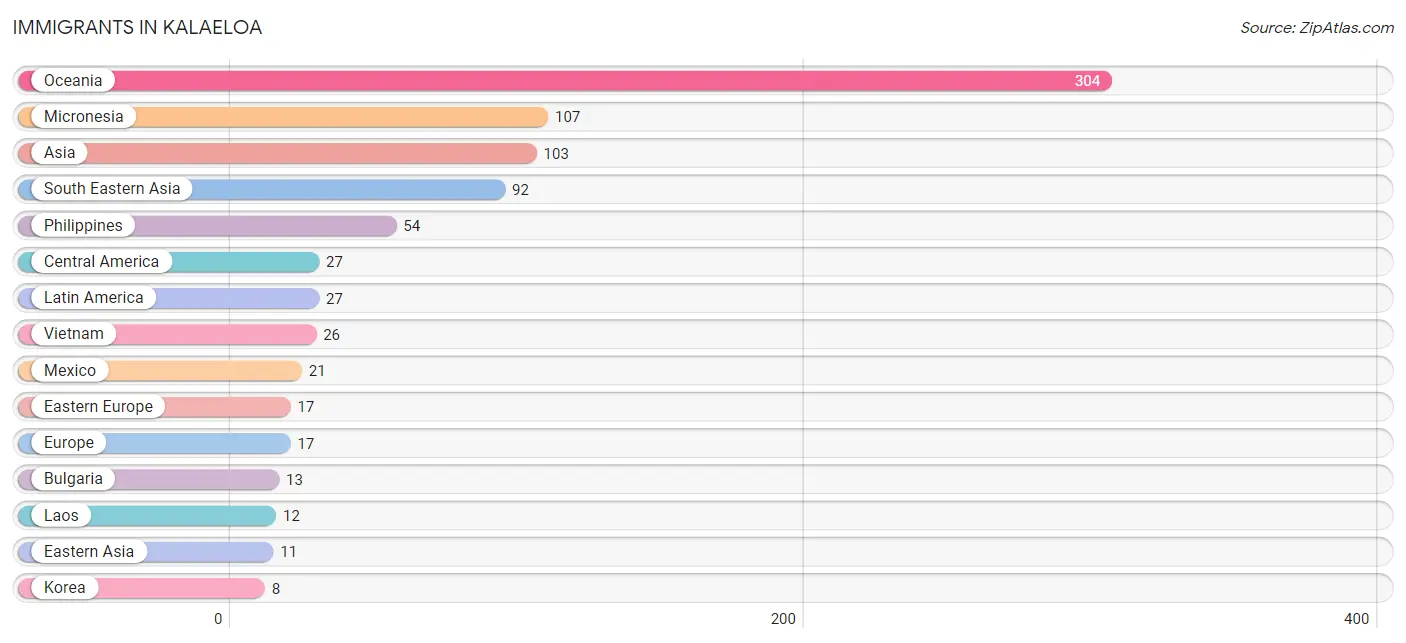
| Immigration Origin | # Population | % Population |
| Asia | 103 | 3.5% |
| Bulgaria | 13 | 0.4% |
| Central America | 27 | 0.9% |
| Costa Rica | 6 | 0.2% |
| Eastern Asia | 11 | 0.4% |
| Eastern Europe | 17 | 0.6% |
| Europe | 17 | 0.6% |
| Japan | 3 | 0.1% |
| Korea | 8 | 0.3% |
| Laos | 12 | 0.4% |
| Latin America | 27 | 0.9% |
| Mexico | 21 | 0.7% |
| Micronesia | 107 | 3.6% |
| Oceania | 304 | 10.2% |
| Philippines | 54 | 1.8% |
| South Eastern Asia | 92 | 3.1% |
| Vietnam | 26 | 0.9% | View All 17 Rows |
Sex and Age in Kalaeloa
Sex and Age in Kalaeloa
The most populous age groups in Kalaeloa are 20 to 24 Years (203 | 12.0%) for men and 30 to 34 Years (160 | 12.4%) for women.
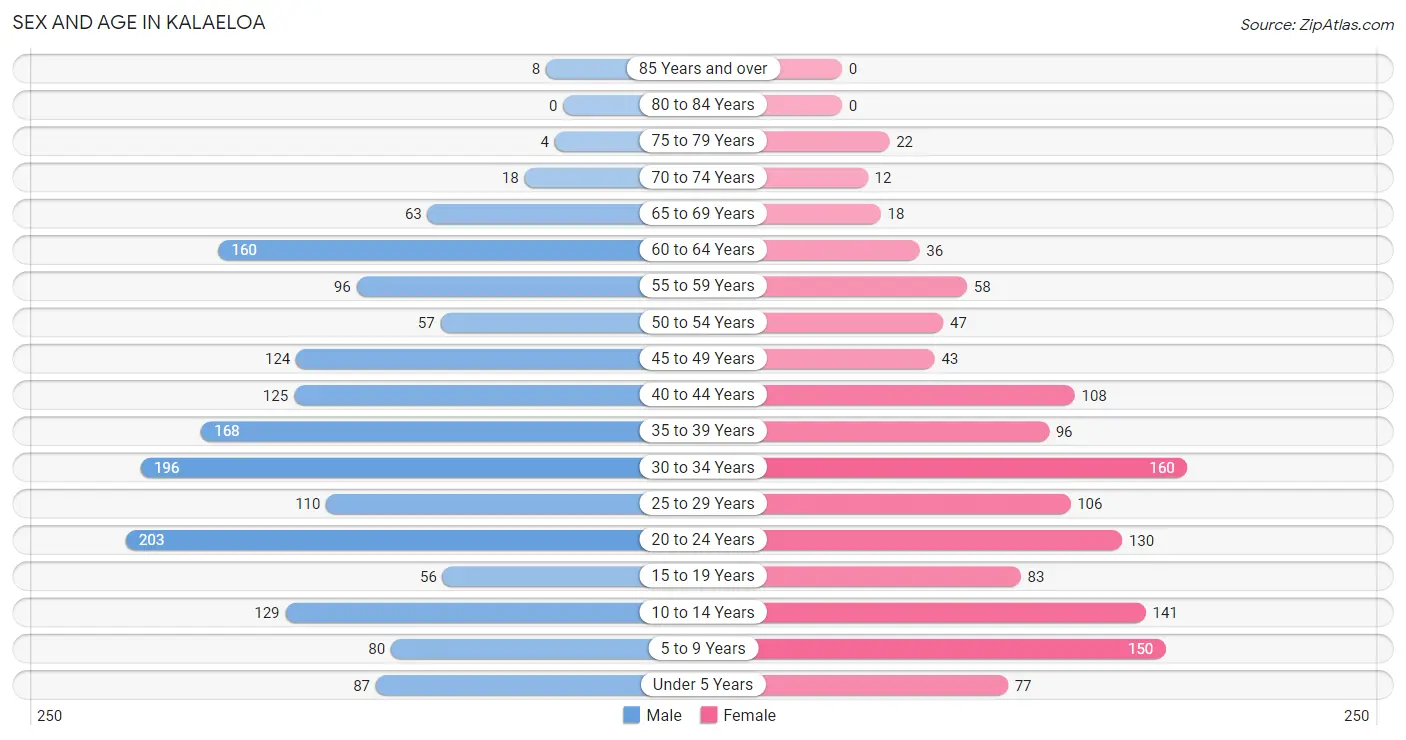
| Age Bracket | Male | Female |
| Under 5 Years | 87 (5.2%) | 77 (6.0%) |
| 5 to 9 Years | 80 (4.8%) | 150 (11.7%) |
| 10 to 14 Years | 129 (7.7%) | 141 (11.0%) |
| 15 to 19 Years | 56 (3.3%) | 83 (6.5%) |
| 20 to 24 Years | 203 (12.0%) | 130 (10.1%) |
| 25 to 29 Years | 110 (6.5%) | 106 (8.2%) |
| 30 to 34 Years | 196 (11.6%) | 160 (12.4%) |
| 35 to 39 Years | 168 (10.0%) | 96 (7.5%) |
| 40 to 44 Years | 125 (7.4%) | 108 (8.4%) |
| 45 to 49 Years | 124 (7.4%) | 43 (3.3%) |
| 50 to 54 Years | 57 (3.4%) | 47 (3.6%) |
| 55 to 59 Years | 96 (5.7%) | 58 (4.5%) |
| 60 to 64 Years | 160 (9.5%) | 36 (2.8%) |
| 65 to 69 Years | 63 (3.7%) | 18 (1.4%) |
| 70 to 74 Years | 18 (1.1%) | 12 (0.9%) |
| 75 to 79 Years | 4 (0.2%) | 22 (1.7%) |
| 80 to 84 Years | 0 (0.0%) | 0 (0.0%) |
| 85 Years and over | 8 (0.5%) | 0 (0.0%) |
| Total | 1,684 (100.0%) | 1,287 (100.0%) |
Families and Households in Kalaeloa
Median Family Size in Kalaeloa
The median family size in Kalaeloa is 3.48 persons per family, with single female/mother families (66 | 14.2%) accounting for the largest median family size of 4.59 persons per family. On the other hand, single male/father families (56 | 12.1%) represent the smallest median family size with 2.71 persons per family.
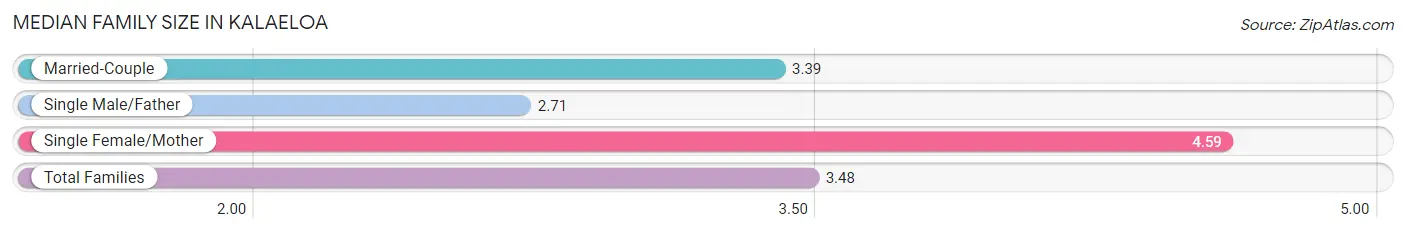
| Family Type | # Families | Family Size |
| Married-Couple | 341 (73.7%) | 3.39 |
| Single Male/Father | 56 (12.1%) | 2.71 |
| Single Female/Mother | 66 (14.2%) | 4.59 |
| Total Families | 463 (100.0%) | 3.48 |
Median Household Size in Kalaeloa
The median household size in Kalaeloa is 2.80 persons per household, with single female/mother households (66 | 8.2%) accounting for the largest median household size of 5.94 persons per household. non-family households (343 | 42.6%) represent the smallest median household size with 1.29 persons per household.
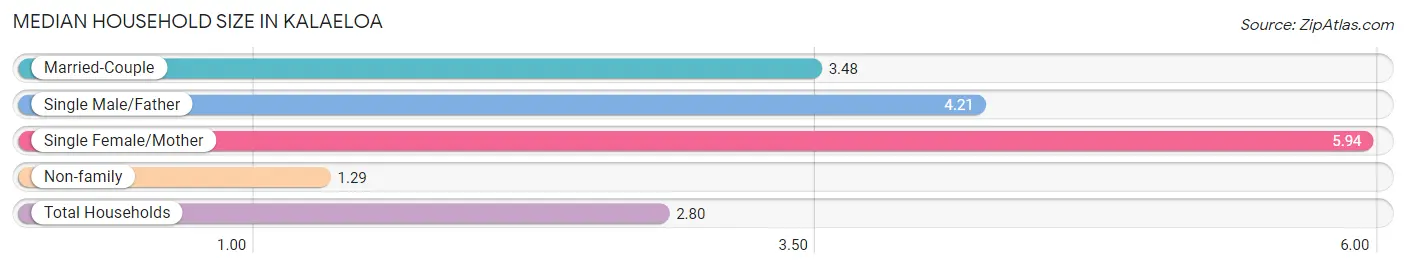
| Household Type | # Households | Household Size |
| Married-Couple | 341 (42.3%) | 3.48 |
| Single Male/Father | 56 (7.0%) | 4.21 |
| Single Female/Mother | 66 (8.2%) | 5.94 |
| Non-family | 343 (42.6%) | 1.29 |
| Total Households | 806 (100.0%) | 2.80 |
Household Size by Marriage Status in Kalaeloa
Out of a total of 806 households in Kalaeloa, 463 (57.4%) are family households, while 343 (42.6%) are nonfamily households. The most numerous type of family households are 2-person households, comprising 136, and the most common type of nonfamily households are 1-person households, comprising 269.
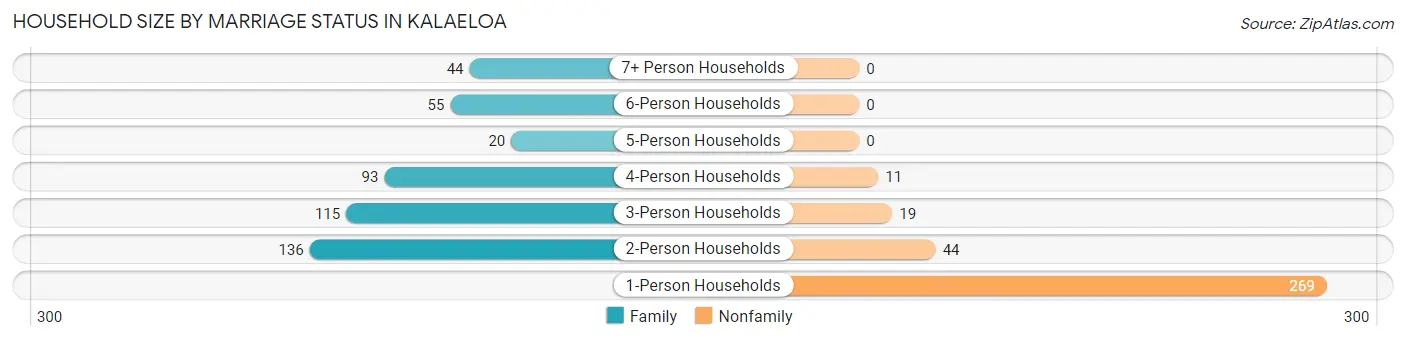
| Household Size | Family Households | Nonfamily Households |
| 1-Person Households | - | 269 (33.4%) |
| 2-Person Households | 136 (16.9%) | 44 (5.5%) |
| 3-Person Households | 115 (14.3%) | 19 (2.4%) |
| 4-Person Households | 93 (11.5%) | 11 (1.4%) |
| 5-Person Households | 20 (2.5%) | 0 (0.0%) |
| 6-Person Households | 55 (6.8%) | 0 (0.0%) |
| 7+ Person Households | 44 (5.5%) | 0 (0.0%) |
| Total | 463 (57.4%) | 343 (42.6%) |
Female Fertility in Kalaeloa
Fertility by Age in Kalaeloa
Average fertility rate in Kalaeloa is 85.0 births per 1,000 women. Women in the age bracket of 20 to 34 years have the highest fertility rate with 111.0 births per 1,000 women. Women in the age bracket of 20 to 34 years acount for 71.0% of all women with births.
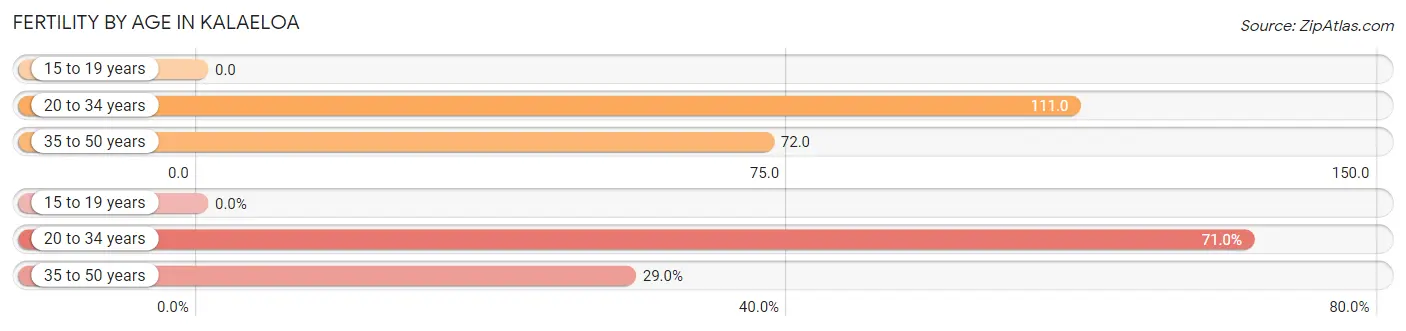
| Age Bracket | Women with Births | Births / 1,000 Women |
| 15 to 19 years | 0 (0.0%) | 0.0 |
| 20 to 34 years | 44 (71.0%) | 111.0 |
| 35 to 50 years | 18 (29.0%) | 72.0 |
| Total | 62 (100.0%) | 85.0 |
Fertility by Age by Marriage Status in Kalaeloa
27.4% of women with births (62) in Kalaeloa are married. The highest percentage of unmarried women with births falls into 20 to 34 years age bracket with 79.5% of them unmarried at the time of birth, while the lowest percentage of unmarried women with births belong to 35 to 50 years age bracket with 55.6% of them unmarried.
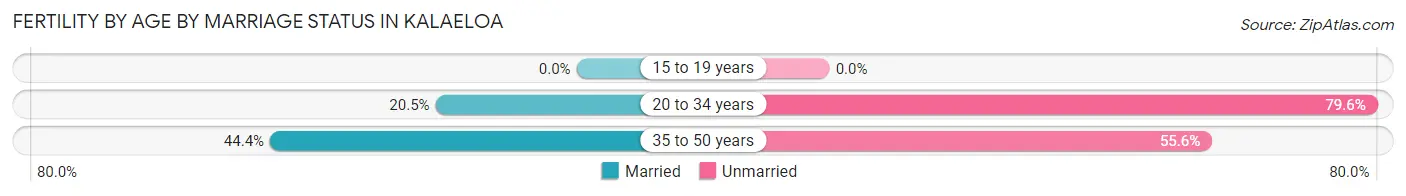
| Age Bracket | Married | Unmarried |
| 15 to 19 years | 0 (0.0%) | 0 (0.0%) |
| 20 to 34 years | 9 (20.4%) | 35 (79.5%) |
| 35 to 50 years | 8 (44.4%) | 10 (55.6%) |
| Total | 17 (27.4%) | 45 (72.6%) |
Fertility by Education in Kalaeloa
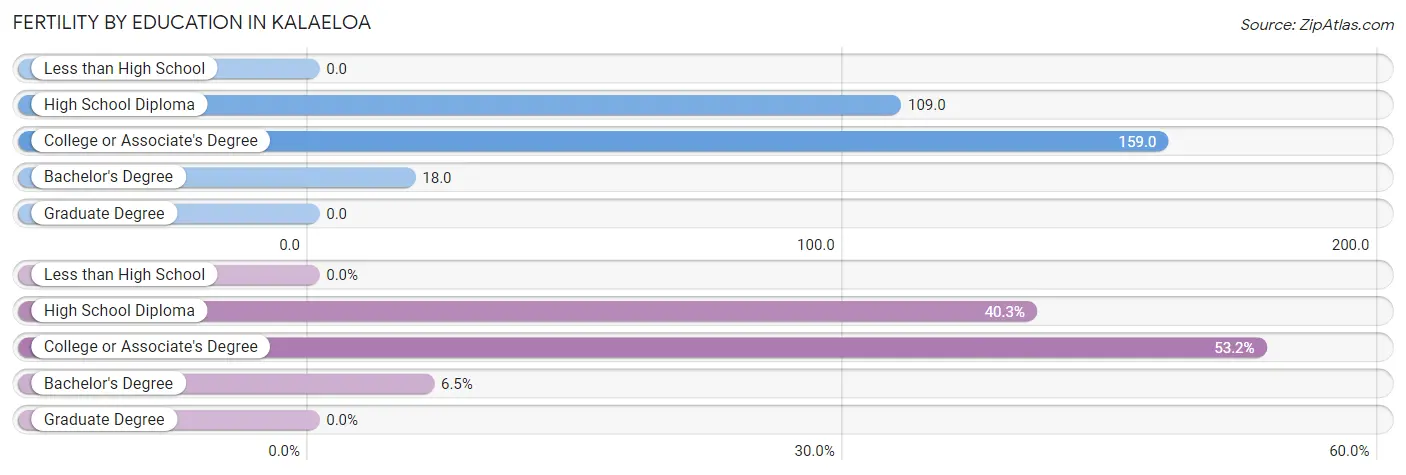
| Educational Attainment | Women with Births | Births / 1,000 Women |
| Less than High School | 0 (0.0%) | 0.0 |
| High School Diploma | 25 (40.3%) | 109.0 |
| College or Associate's Degree | 33 (53.2%) | 159.0 |
| Bachelor's Degree | 4 (6.5%) | 18.0 |
| Graduate Degree | 0 (0.0%) | 0.0 |
| Total | 62 (100.0%) | 85.0 |
Fertility by Education by Marriage Status in Kalaeloa
72.6% of women with births in Kalaeloa are unmarried. Women with the educational attainment of bachelor's degree are most likely to be married with 100.0% of them married at childbirth, while women with the educational attainment of college or associate's degree are least likely to be married with 100.0% of them unmarried at childbirth.
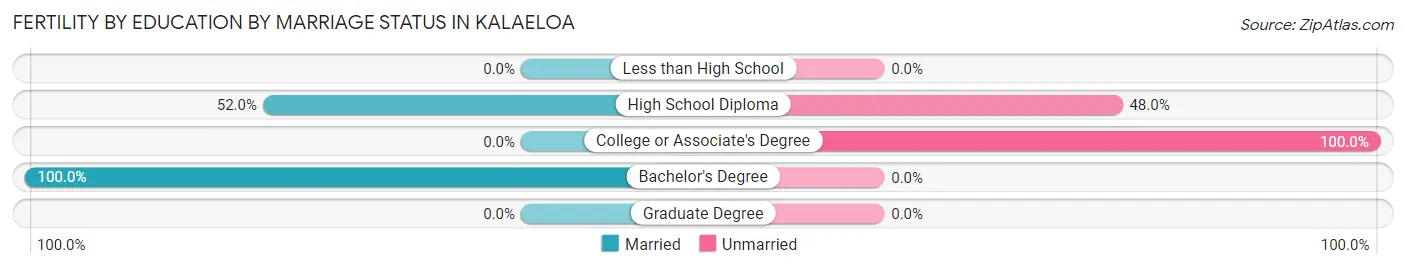
| Educational Attainment | Married | Unmarried |
| Less than High School | 0 (0.0%) | 0 (0.0%) |
| High School Diploma | 13 (52.0%) | 12 (48.0%) |
| College or Associate's Degree | 0 (0.0%) | 33 (100.0%) |
| Bachelor's Degree | 4 (100.0%) | 0 (0.0%) |
| Graduate Degree | 0 (0.0%) | 0 (0.0%) |
| Total | 17 (27.4%) | 45 (72.6%) |
Employment Characteristics in Kalaeloa
Employment by Class of Employer in Kalaeloa
Among the 1,464 employed individuals in Kalaeloa, private company employees (727 | 49.7%), federal government employees (347 | 23.7%), and not-for-profit organizations (107 | 7.3%) make up the most common classes of employment.
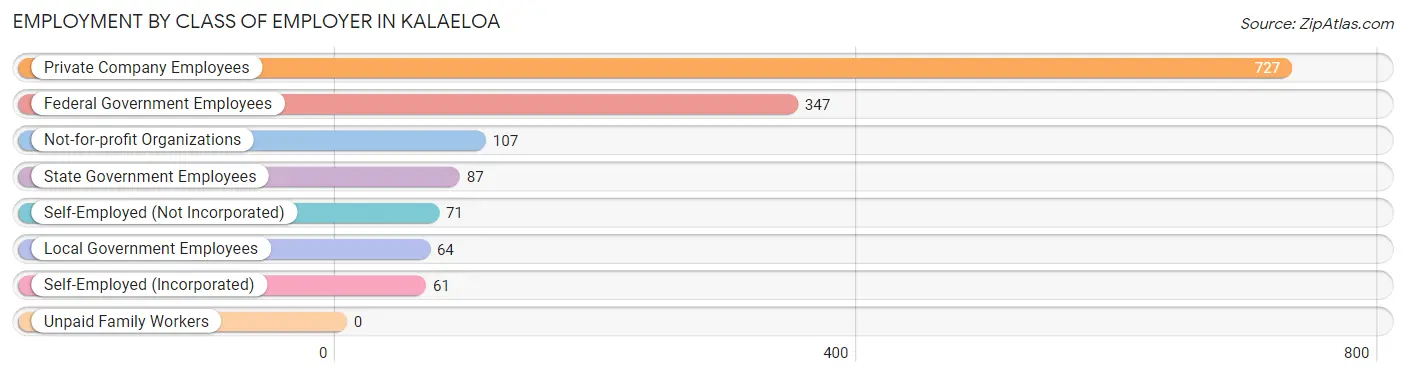
| Employer Class | # Employees | % Employees |
| Private Company Employees | 727 | 49.7% |
| Self-Employed (Incorporated) | 61 | 4.2% |
| Self-Employed (Not Incorporated) | 71 | 4.9% |
| Not-for-profit Organizations | 107 | 7.3% |
| Local Government Employees | 64 | 4.4% |
| State Government Employees | 87 | 5.9% |
| Federal Government Employees | 347 | 23.7% |
| Unpaid Family Workers | 0 | 0.0% |
| Total | 1,464 | 100.0% |
Employment Status by Age in Kalaeloa
According to the labor force statistics for Kalaeloa, out of the total population over 16 years of age (2,265), 70.1% or 1,588 individuals are in the labor force, with 7.6% or 121 of them unemployed. The age group with the highest labor force participation rate is 20 to 24 years, with 91.3% or 304 individuals in the labor force. Within the labor force, the 16 to 19 years age range has the highest percentage of unemployed individuals, with 54.2% or 13 of them being unemployed.
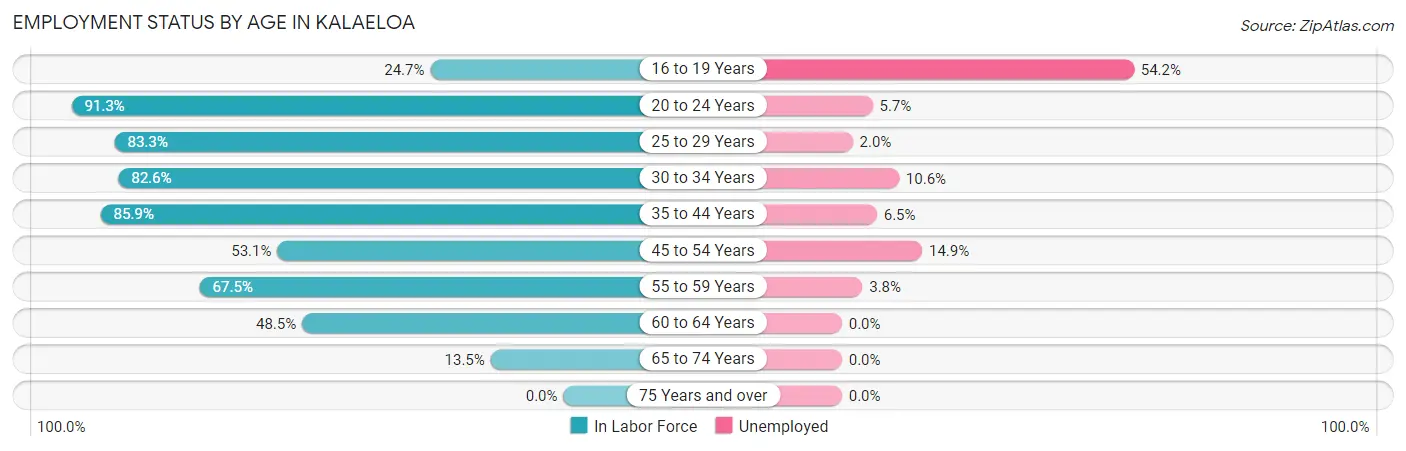
| Age Bracket | In Labor Force | Unemployed |
| 16 to 19 Years | 24 (24.7%) | 13 (54.2%) |
| 20 to 24 Years | 304 (91.3%) | 17 (5.7%) |
| 25 to 29 Years | 180 (83.3%) | 4 (2.0%) |
| 30 to 34 Years | 294 (82.6%) | 31 (10.6%) |
| 35 to 44 Years | 427 (85.9%) | 28 (6.5%) |
| 45 to 54 Years | 144 (53.1%) | 21 (14.9%) |
| 55 to 59 Years | 104 (67.5%) | 4 (3.8%) |
| 60 to 64 Years | 95 (48.5%) | 0 (0.0%) |
| 65 to 74 Years | 15 (13.5%) | 0 (0.0%) |
| 75 Years and over | 0 (0.0%) | 0 (0.0%) |
| Total | 1,588 (70.1%) | 121 (7.6%) |
Employment Status by Educational Attainment in Kalaeloa
According to labor force statistics for Kalaeloa, 73.6% of individuals (1,244) out of the total population between 25 and 64 years of age (1,690) are in the labor force, with 7.1% or 88 of them being unemployed. The group with the highest labor force participation rate are those with the educational attainment of college / associate degree, with 81.0% or 579 individuals in the labor force. Within the labor force, individuals with less than high school education have the highest percentage of unemployment, with 38.5% or 10 of them being unemployed.
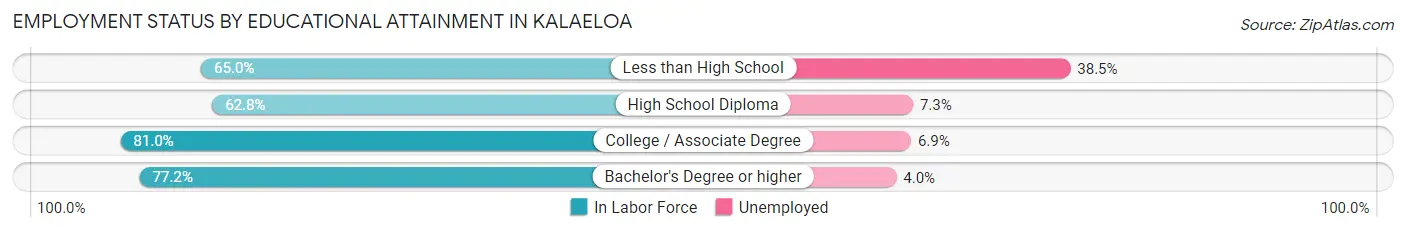
| Educational Attainment | In Labor Force | Unemployed |
| Less than High School | 26 (65.0%) | 15 (38.5%) |
| High School Diploma | 361 (62.8%) | 42 (7.3%) |
| College / Associate Degree | 579 (81.0%) | 49 (6.9%) |
| Bachelor's Degree or higher | 278 (77.2%) | 14 (4.0%) |
| Total | 1,244 (73.6%) | 120 (7.1%) |
Employment Occupations by Sex in Kalaeloa
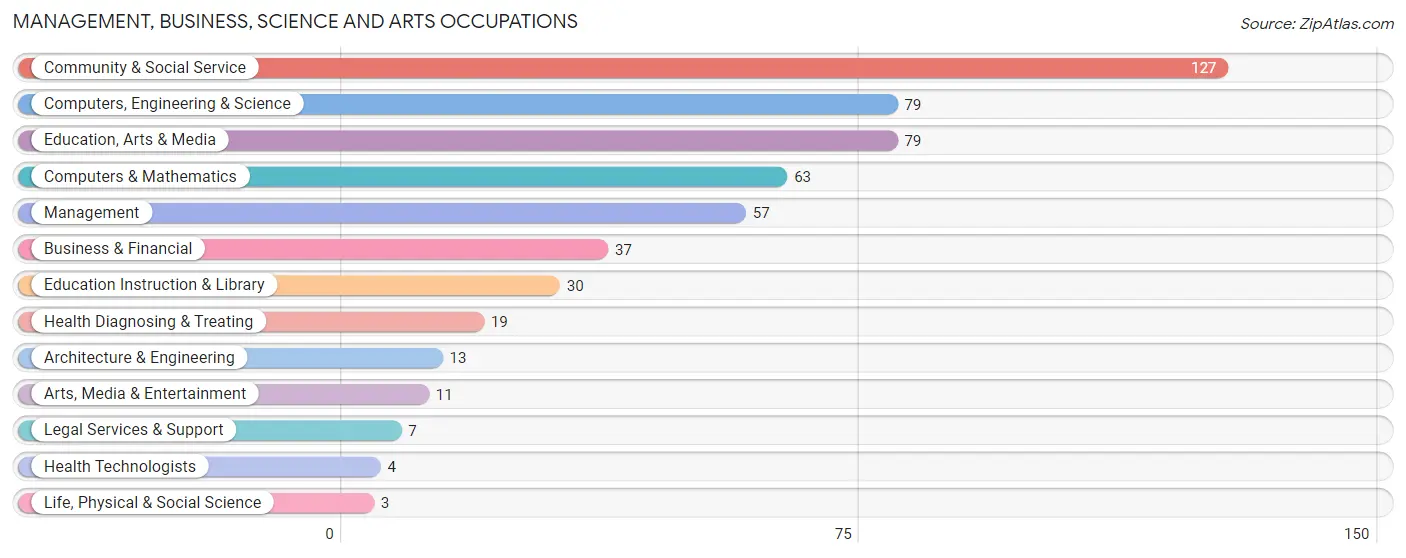
Management, Business, Science and Arts Occupations
The most common Management, Business, Science and Arts occupations in Kalaeloa are Community & Social Service (127 | 10.1%), Computers, Engineering & Science (79 | 6.3%), Education, Arts & Media (79 | 6.3%), Computers & Mathematics (63 | 5.0%), and Management (57 | 4.5%).
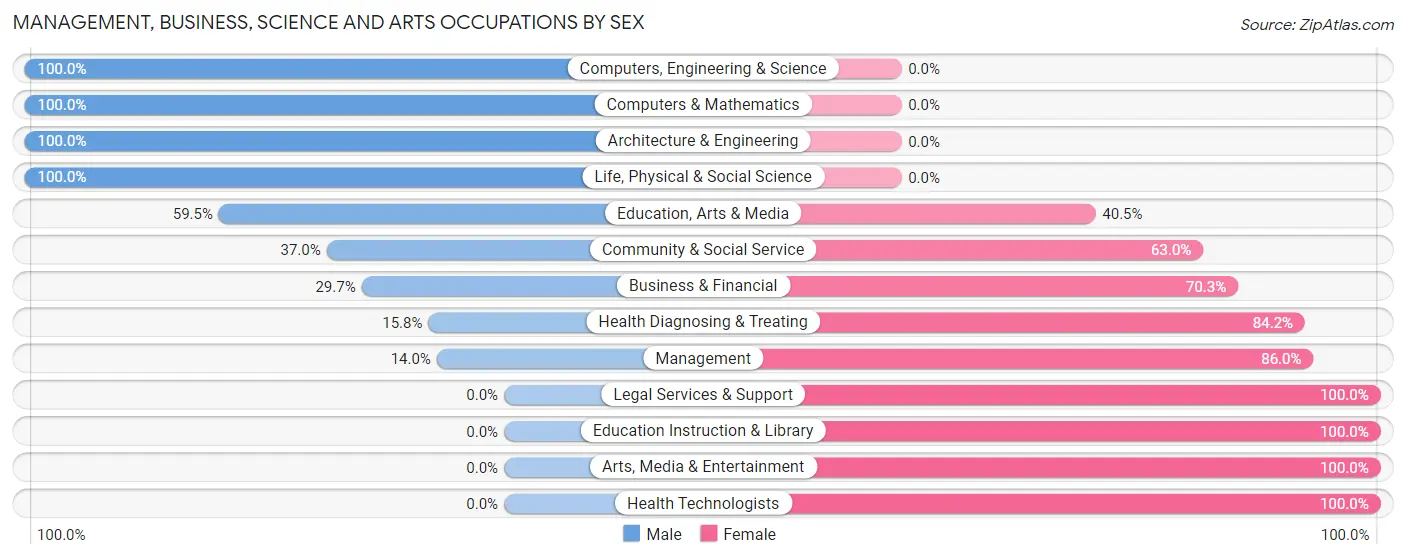
Management, Business, Science and Arts Occupations by Sex
Within the Management, Business, Science and Arts occupations in Kalaeloa, the most male-oriented occupations are Computers, Engineering & Science (100.0%), Computers & Mathematics (100.0%), and Architecture & Engineering (100.0%), while the most female-oriented occupations are Legal Services & Support (100.0%), Education Instruction & Library (100.0%), and Arts, Media & Entertainment (100.0%).
| Occupation | Male | Female |
| Management | 8 (14.0%) | 49 (86.0%) |
| Business & Financial | 11 (29.7%) | 26 (70.3%) |
| Computers, Engineering & Science | 79 (100.0%) | 0 (0.0%) |
| Computers & Mathematics | 63 (100.0%) | 0 (0.0%) |
| Architecture & Engineering | 13 (100.0%) | 0 (0.0%) |
| Life, Physical & Social Science | 3 (100.0%) | 0 (0.0%) |
| Community & Social Service | 47 (37.0%) | 80 (63.0%) |
| Education, Arts & Media | 47 (59.5%) | 32 (40.5%) |
| Legal Services & Support | 0 (0.0%) | 7 (100.0%) |
| Education Instruction & Library | 0 (0.0%) | 30 (100.0%) |
| Arts, Media & Entertainment | 0 (0.0%) | 11 (100.0%) |
| Health Diagnosing & Treating | 3 (15.8%) | 16 (84.2%) |
| Health Technologists | 0 (0.0%) | 4 (100.0%) |
| Total (Category) | 148 (46.4%) | 171 (53.6%) |
| Total (Overall) | 770 (61.0%) | 492 (39.0%) |
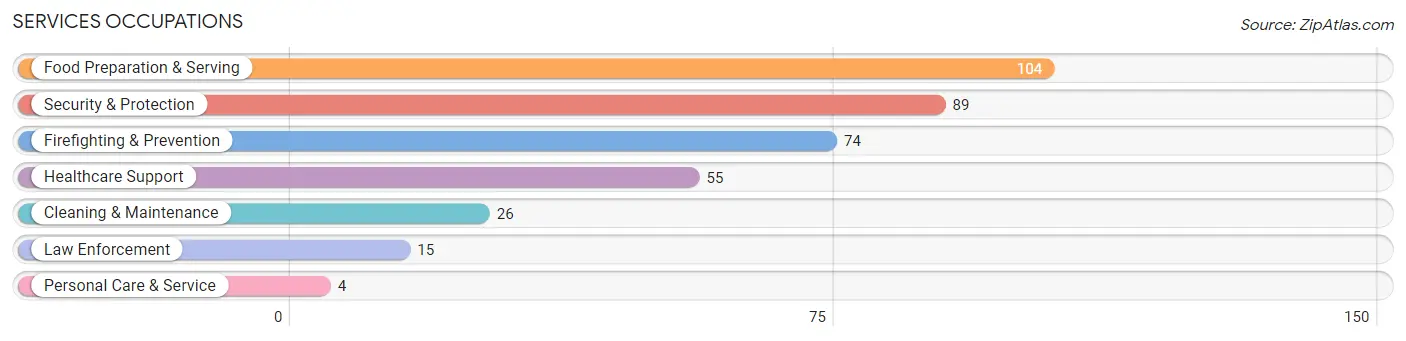
Services Occupations
The most common Services occupations in Kalaeloa are Food Preparation & Serving (104 | 8.2%), Security & Protection (89 | 7.0%), Firefighting & Prevention (74 | 5.9%), Healthcare Support (55 | 4.4%), and Cleaning & Maintenance (26 | 2.1%).
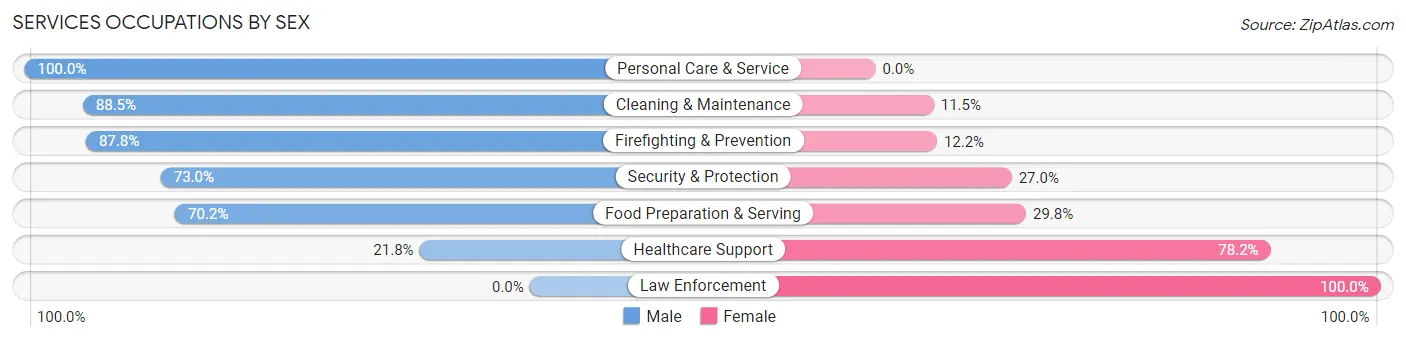
Services Occupations by Sex
Within the Services occupations in Kalaeloa, the most male-oriented occupations are Personal Care & Service (100.0%), Cleaning & Maintenance (88.5%), and Firefighting & Prevention (87.8%), while the most female-oriented occupations are Law Enforcement (100.0%), Healthcare Support (78.2%), and Food Preparation & Serving (29.8%).
| Occupation | Male | Female |
| Healthcare Support | 12 (21.8%) | 43 (78.2%) |
| Security & Protection | 65 (73.0%) | 24 (27.0%) |
| Firefighting & Prevention | 65 (87.8%) | 9 (12.2%) |
| Law Enforcement | 0 (0.0%) | 15 (100.0%) |
| Food Preparation & Serving | 73 (70.2%) | 31 (29.8%) |
| Cleaning & Maintenance | 23 (88.5%) | 3 (11.5%) |
| Personal Care & Service | 4 (100.0%) | 0 (0.0%) |
| Total (Category) | 177 (63.7%) | 101 (36.3%) |
| Total (Overall) | 770 (61.0%) | 492 (39.0%) |
Sales and Office Occupations
The most common Sales and Office occupations in Kalaeloa are Office & Administration (190 | 15.1%), and Sales & Related (70 | 5.6%).
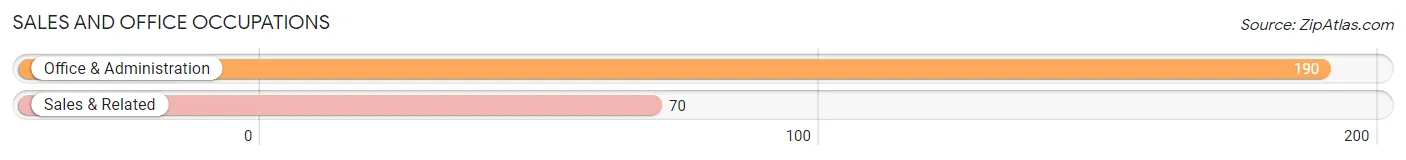
Sales and Office Occupations by Sex
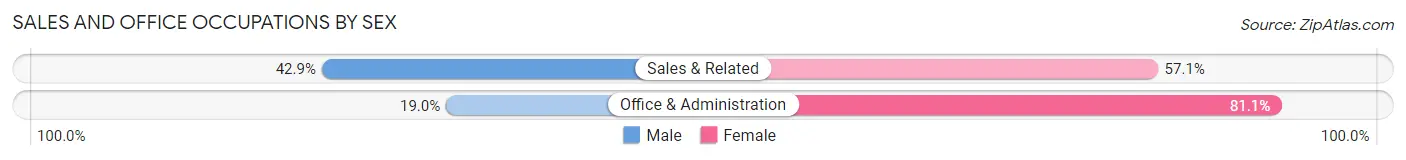
| Occupation | Male | Female |
| Sales & Related | 30 (42.9%) | 40 (57.1%) |
| Office & Administration | 36 (19.0%) | 154 (81.0%) |
| Total (Category) | 66 (25.4%) | 194 (74.6%) |
| Total (Overall) | 770 (61.0%) | 492 (39.0%) |
Natural Resources, Construction and Maintenance Occupations
The most common Natural Resources, Construction and Maintenance occupations in Kalaeloa are Installation, Maintenance & Repair (83 | 6.6%), and Construction & Extraction (47 | 3.7%).
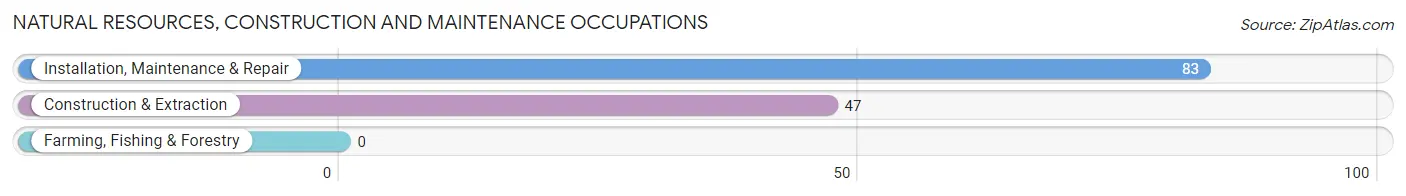
Natural Resources, Construction and Maintenance Occupations by Sex
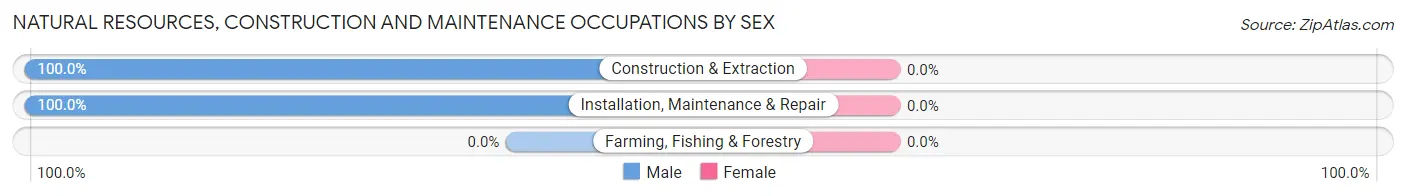
| Occupation | Male | Female |
| Farming, Fishing & Forestry | 0 (0.0%) | 0 (0.0%) |
| Construction & Extraction | 47 (100.0%) | 0 (0.0%) |
| Installation, Maintenance & Repair | 83 (100.0%) | 0 (0.0%) |
| Total (Category) | 130 (100.0%) | 0 (0.0%) |
| Total (Overall) | 770 (61.0%) | 492 (39.0%) |
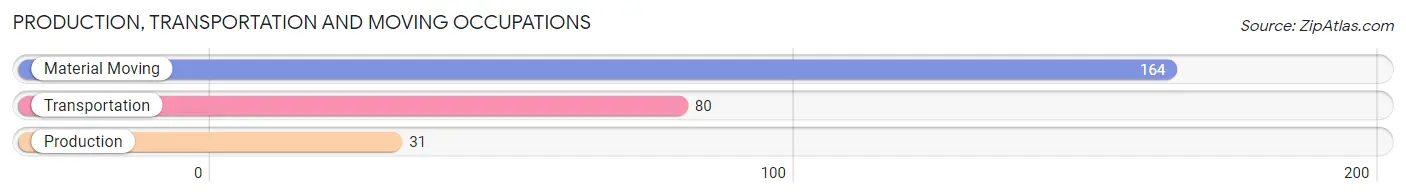
Production, Transportation and Moving Occupations
The most common Production, Transportation and Moving occupations in Kalaeloa are Material Moving (164 | 13.0%), Transportation (80 | 6.3%), and Production (31 | 2.5%).
Production, Transportation and Moving Occupations by Sex
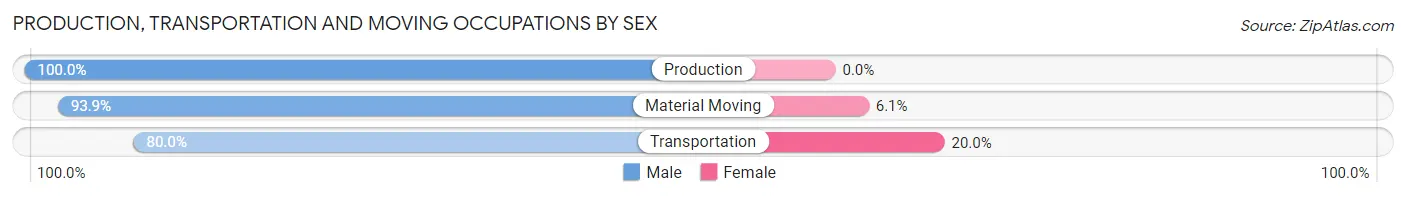
| Occupation | Male | Female |
| Production | 31 (100.0%) | 0 (0.0%) |
| Transportation | 64 (80.0%) | 16 (20.0%) |
| Material Moving | 154 (93.9%) | 10 (6.1%) |
| Total (Category) | 249 (90.5%) | 26 (9.5%) |
| Total (Overall) | 770 (61.0%) | 492 (39.0%) |
Employment Industries by Sex in Kalaeloa
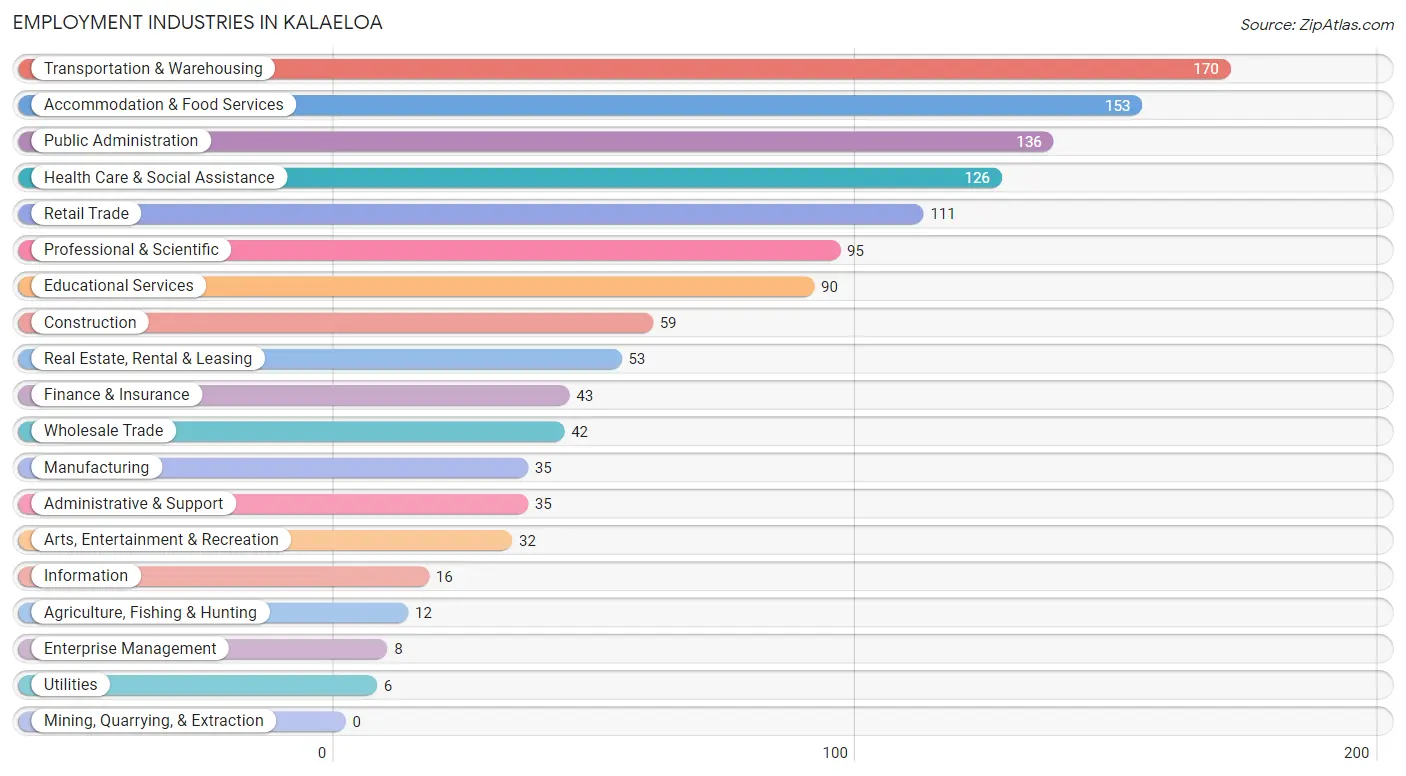
Employment Industries in Kalaeloa
The major employment industries in Kalaeloa include Transportation & Warehousing (170 | 13.5%), Accommodation & Food Services (153 | 12.1%), Public Administration (136 | 10.8%), Health Care & Social Assistance (126 | 10.0%), and Retail Trade (111 | 8.8%).
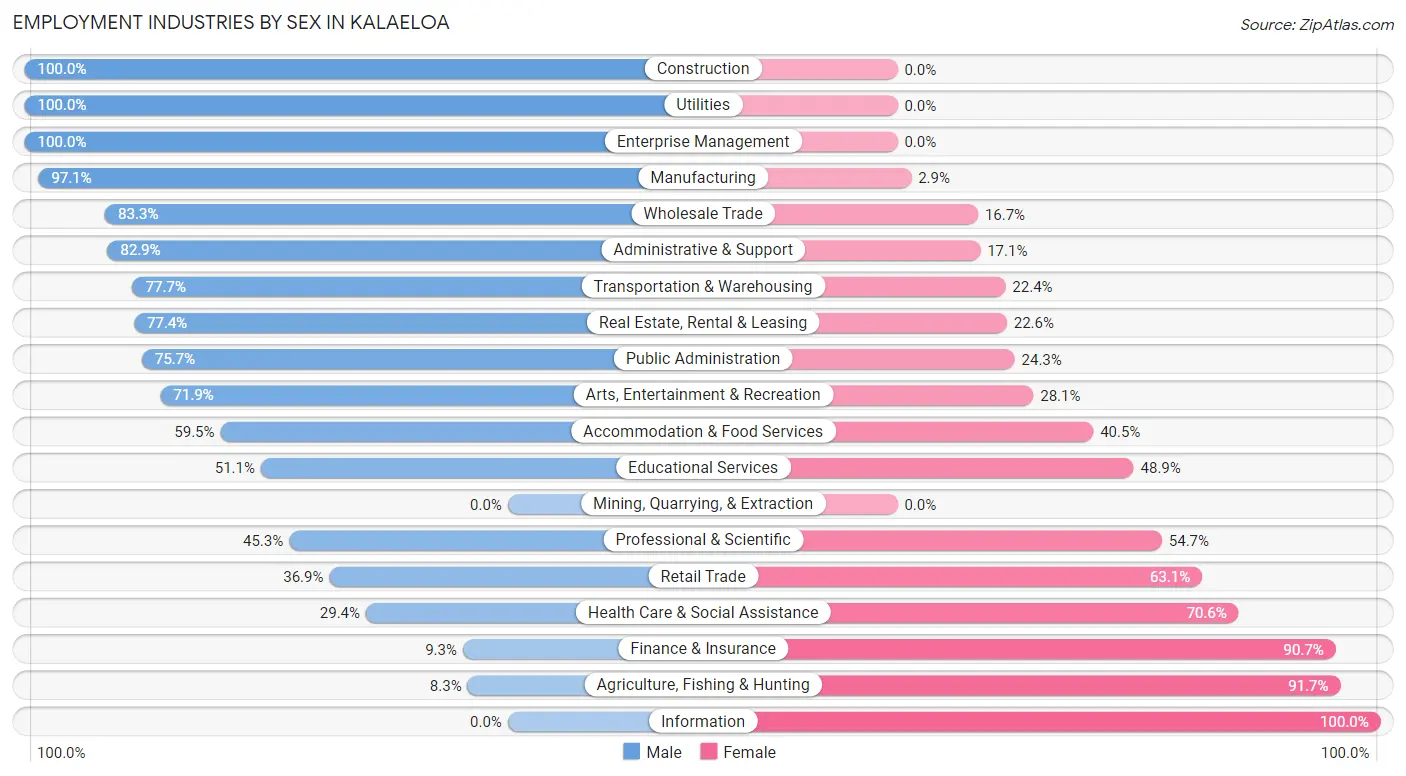
Employment Industries by Sex in Kalaeloa
The Kalaeloa industries that see more men than women are Construction (100.0%), Utilities (100.0%), and Enterprise Management (100.0%), whereas the industries that tend to have a higher number of women are Information (100.0%), Agriculture, Fishing & Hunting (91.7%), and Finance & Insurance (90.7%).
| Industry | Male | Female |
| Agriculture, Fishing & Hunting | 1 (8.3%) | 11 (91.7%) |
| Mining, Quarrying, & Extraction | 0 (0.0%) | 0 (0.0%) |
| Construction | 59 (100.0%) | 0 (0.0%) |
| Manufacturing | 34 (97.1%) | 1 (2.9%) |
| Wholesale Trade | 35 (83.3%) | 7 (16.7%) |
| Retail Trade | 41 (36.9%) | 70 (63.1%) |
| Transportation & Warehousing | 132 (77.6%) | 38 (22.4%) |
| Utilities | 6 (100.0%) | 0 (0.0%) |
| Information | 0 (0.0%) | 16 (100.0%) |
| Finance & Insurance | 4 (9.3%) | 39 (90.7%) |
| Real Estate, Rental & Leasing | 41 (77.4%) | 12 (22.6%) |
| Professional & Scientific | 43 (45.3%) | 52 (54.7%) |
| Enterprise Management | 8 (100.0%) | 0 (0.0%) |
| Administrative & Support | 29 (82.9%) | 6 (17.1%) |
| Educational Services | 46 (51.1%) | 44 (48.9%) |
| Health Care & Social Assistance | 37 (29.4%) | 89 (70.6%) |
| Arts, Entertainment & Recreation | 23 (71.9%) | 9 (28.1%) |
| Accommodation & Food Services | 91 (59.5%) | 62 (40.5%) |
| Public Administration | 103 (75.7%) | 33 (24.3%) |
| Total | 770 (61.0%) | 492 (39.0%) |
Education in Kalaeloa
School Enrollment in Kalaeloa
The most common levels of schooling among the 715 students in Kalaeloa are middle school (209 | 29.2%), college / undergraduate (199 | 27.8%), and elementary school (126 | 17.6%).
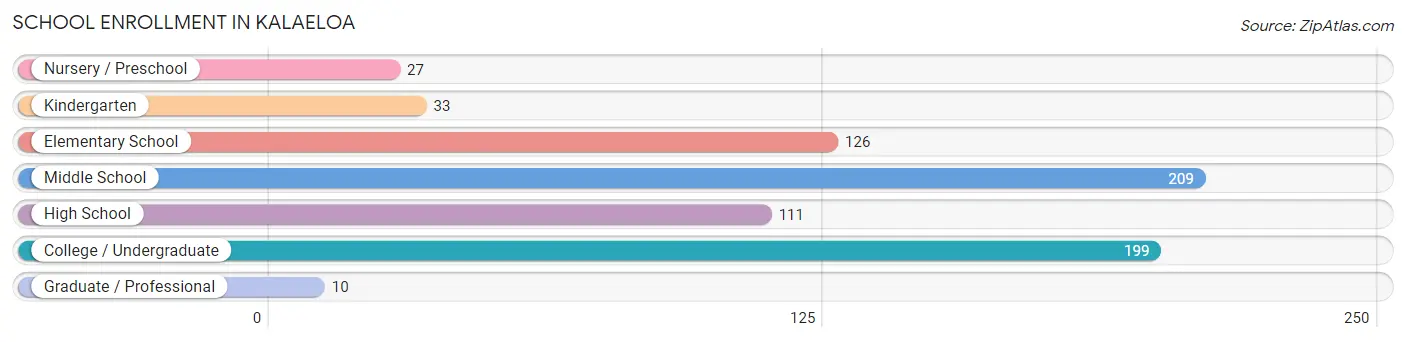
| School Level | # Students | % Students |
| Nursery / Preschool | 27 | 3.8% |
| Kindergarten | 33 | 4.6% |
| Elementary School | 126 | 17.6% |
| Middle School | 209 | 29.2% |
| High School | 111 | 15.5% |
| College / Undergraduate | 199 | 27.8% |
| Graduate / Professional | 10 | 1.4% |
| Total | 715 | 100.0% |
School Enrollment by Age by Funding Source in Kalaeloa
Out of a total of 715 students who are enrolled in schools in Kalaeloa, 140 (19.6%) attend a private institution, while the remaining 575 (80.4%) are enrolled in public schools. The age group of 35 years and over has the highest likelihood of being enrolled in private schools, with 51 (55.4% in the age bracket) enrolled. Conversely, the age group of 3 to 4 year olds has the lowest likelihood of being enrolled in a private school, with 27 (100.0% in the age bracket) attending a public institution.
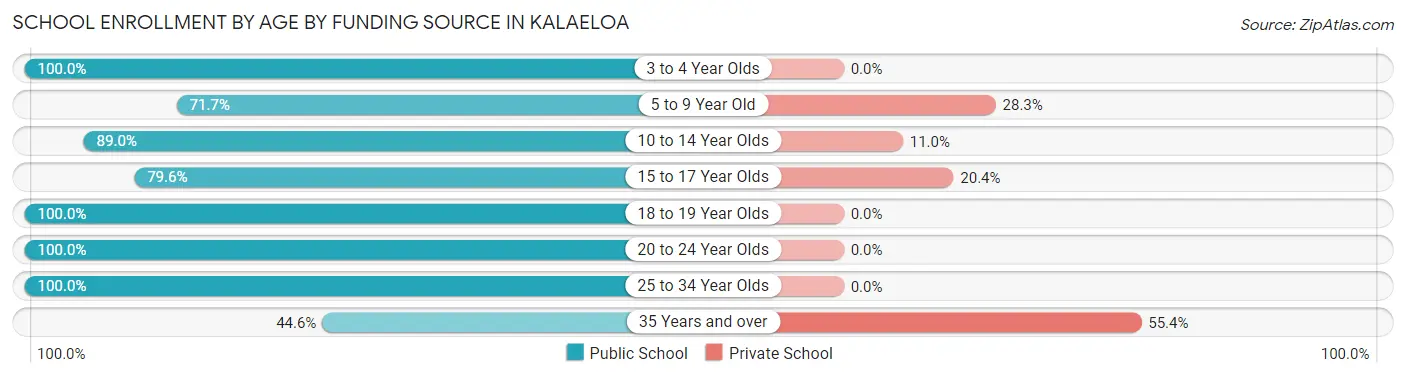
| Age Bracket | Public School | Private School |
| 3 to 4 Year Olds | 27 (100.0%) | 0 (0.0%) |
| 5 to 9 Year Old | 114 (71.7%) | 45 (28.3%) |
| 10 to 14 Year Olds | 202 (89.0%) | 25 (11.0%) |
| 15 to 17 Year Olds | 74 (79.6%) | 19 (20.4%) |
| 18 to 19 Year Olds | 34 (100.0%) | 0 (0.0%) |
| 20 to 24 Year Olds | 57 (100.0%) | 0 (0.0%) |
| 25 to 34 Year Olds | 26 (100.0%) | 0 (0.0%) |
| 35 Years and over | 41 (44.6%) | 51 (55.4%) |
| Total | 575 (80.4%) | 140 (19.6%) |
Educational Attainment by Field of Study in Kalaeloa
Psychology (80 | 18.7%), business (68 | 15.9%), education (63 | 14.7%), visual & performing arts (45 | 10.5%), and arts & humanities (30 | 7.0%) are the most common fields of study among 427 individuals in Kalaeloa who have obtained a bachelor's degree or higher.
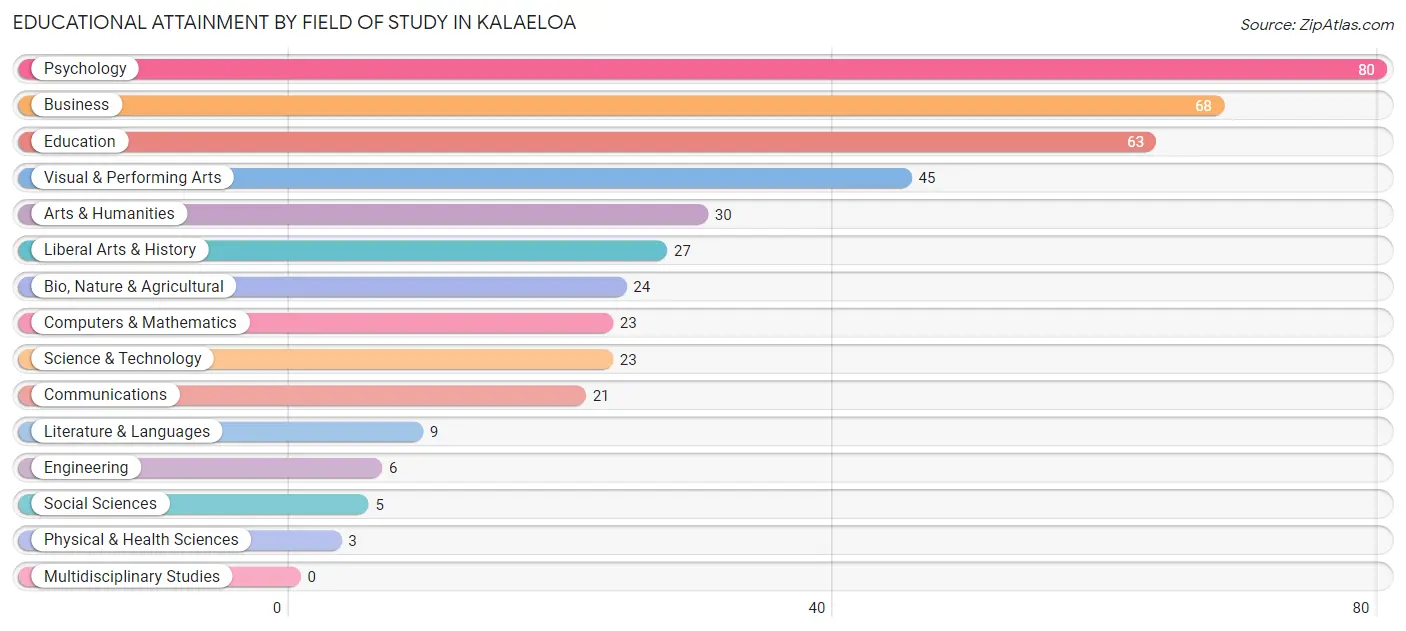
| Field of Study | # Graduates | % Graduates |
| Computers & Mathematics | 23 | 5.4% |
| Bio, Nature & Agricultural | 24 | 5.6% |
| Physical & Health Sciences | 3 | 0.7% |
| Psychology | 80 | 18.7% |
| Social Sciences | 5 | 1.2% |
| Engineering | 6 | 1.4% |
| Multidisciplinary Studies | 0 | 0.0% |
| Science & Technology | 23 | 5.4% |
| Business | 68 | 15.9% |
| Education | 63 | 14.7% |
| Literature & Languages | 9 | 2.1% |
| Liberal Arts & History | 27 | 6.3% |
| Visual & Performing Arts | 45 | 10.5% |
| Communications | 21 | 4.9% |
| Arts & Humanities | 30 | 7.0% |
| Total | 427 | 100.0% |
Transportation & Commute in Kalaeloa
Vehicle Availability by Sex in Kalaeloa
The most prevalent vehicle ownership categories in Kalaeloa are males with 2 vehicles (300, accounting for 38.8%) and females with 2 vehicles (239, making up 62.6%).
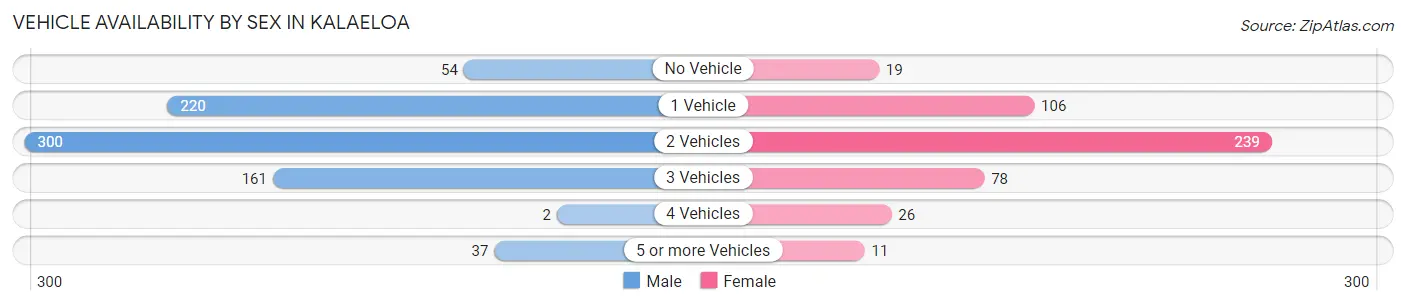
| Vehicles Available | Male | Female |
| No Vehicle | 54 (7.0%) | 19 (4.0%) |
| 1 Vehicle | 220 (28.4%) | 106 (22.1%) |
| 2 Vehicles | 300 (38.8%) | 239 (49.9%) |
| 3 Vehicles | 161 (20.8%) | 78 (16.3%) |
| 4 Vehicles | 2 (0.3%) | 26 (5.4%) |
| 5 or more Vehicles | 37 (4.8%) | 11 (2.3%) |
| Total | 774 (100.0%) | 479 (100.0%) |
Commute Time in Kalaeloa
The most frequently occuring commute durations in Kalaeloa are 60 to 89 minutes (314 commuters, 23.6%), 30 to 34 minutes (198 commuters, 14.9%), and 5 to 9 minutes (126 commuters, 9.5%).
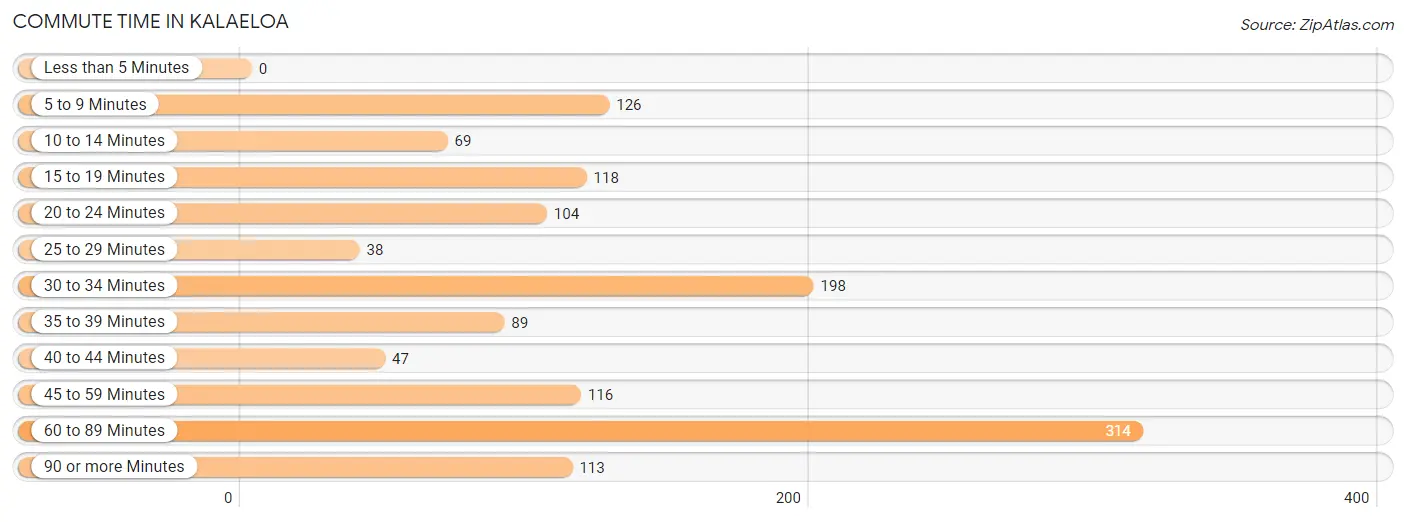
| Commute Time | # Commuters | % Commuters |
| Less than 5 Minutes | 0 | 0.0% |
| 5 to 9 Minutes | 126 | 9.5% |
| 10 to 14 Minutes | 69 | 5.2% |
| 15 to 19 Minutes | 118 | 8.9% |
| 20 to 24 Minutes | 104 | 7.8% |
| 25 to 29 Minutes | 38 | 2.9% |
| 30 to 34 Minutes | 198 | 14.9% |
| 35 to 39 Minutes | 89 | 6.7% |
| 40 to 44 Minutes | 47 | 3.5% |
| 45 to 59 Minutes | 116 | 8.7% |
| 60 to 89 Minutes | 314 | 23.6% |
| 90 or more Minutes | 113 | 8.5% |
Commute Time by Sex in Kalaeloa
The most common commute times in Kalaeloa are 60 to 89 minutes (181 commuters, 20.3%) for males and 60 to 89 minutes (133 commuters, 30.2%) for females.
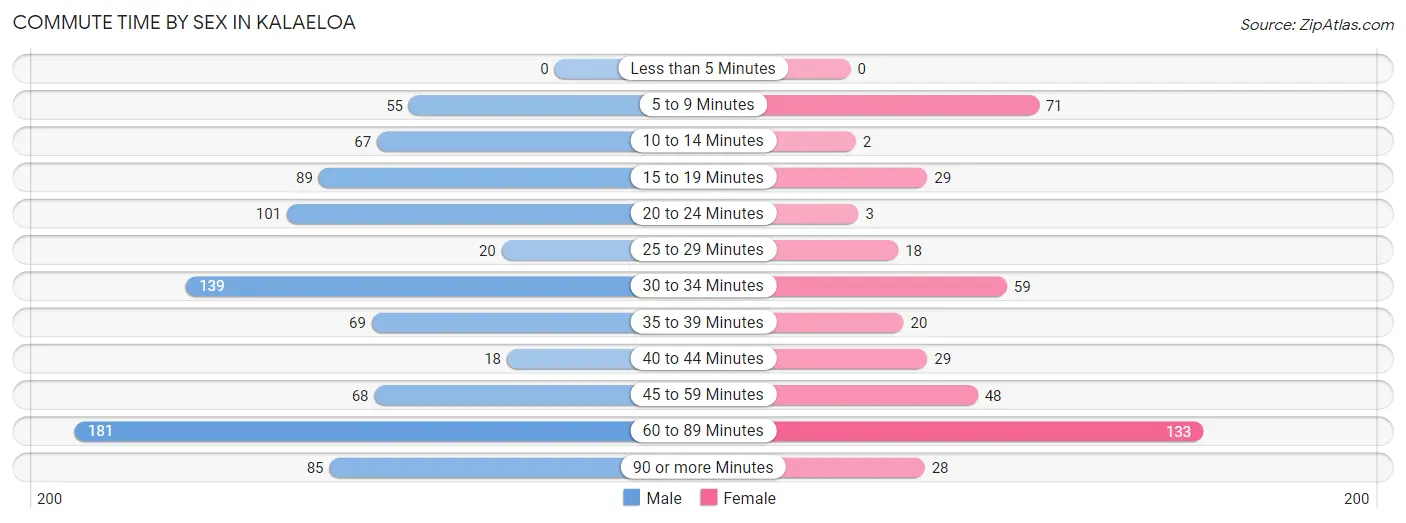
| Commute Time | Male | Female |
| Less than 5 Minutes | 0 (0.0%) | 0 (0.0%) |
| 5 to 9 Minutes | 55 (6.2%) | 71 (16.1%) |
| 10 to 14 Minutes | 67 (7.5%) | 2 (0.4%) |
| 15 to 19 Minutes | 89 (10.0%) | 29 (6.6%) |
| 20 to 24 Minutes | 101 (11.3%) | 3 (0.7%) |
| 25 to 29 Minutes | 20 (2.2%) | 18 (4.1%) |
| 30 to 34 Minutes | 139 (15.6%) | 59 (13.4%) |
| 35 to 39 Minutes | 69 (7.7%) | 20 (4.5%) |
| 40 to 44 Minutes | 18 (2.0%) | 29 (6.6%) |
| 45 to 59 Minutes | 68 (7.6%) | 48 (10.9%) |
| 60 to 89 Minutes | 181 (20.3%) | 133 (30.2%) |
| 90 or more Minutes | 85 (9.5%) | 28 (6.4%) |
Time of Departure to Work by Sex in Kalaeloa
The most frequent times of departure to work in Kalaeloa are 5:30 AM to 5:59 AM (180, 20.2%) for males and 5:30 AM to 5:59 AM (70, 15.9%) for females.
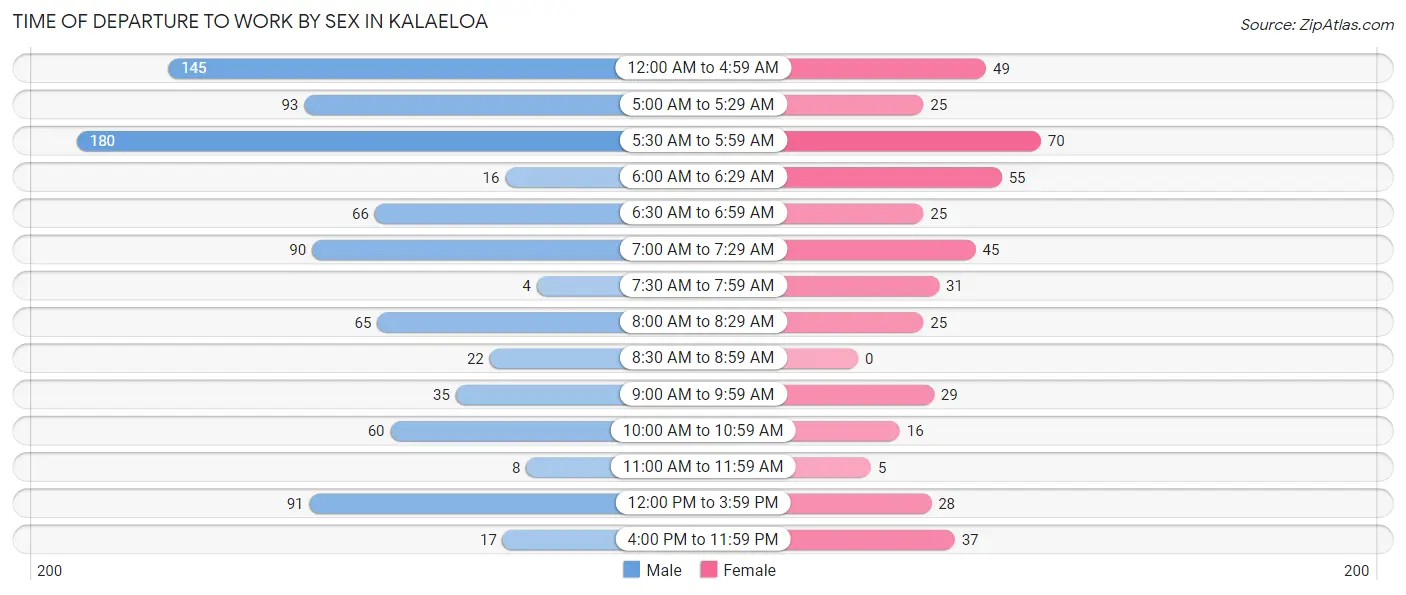
| Time of Departure | Male | Female |
| 12:00 AM to 4:59 AM | 145 (16.3%) | 49 (11.1%) |
| 5:00 AM to 5:29 AM | 93 (10.4%) | 25 (5.7%) |
| 5:30 AM to 5:59 AM | 180 (20.2%) | 70 (15.9%) |
| 6:00 AM to 6:29 AM | 16 (1.8%) | 55 (12.5%) |
| 6:30 AM to 6:59 AM | 66 (7.4%) | 25 (5.7%) |
| 7:00 AM to 7:29 AM | 90 (10.1%) | 45 (10.2%) |
| 7:30 AM to 7:59 AM | 4 (0.4%) | 31 (7.0%) |
| 8:00 AM to 8:29 AM | 65 (7.3%) | 25 (5.7%) |
| 8:30 AM to 8:59 AM | 22 (2.5%) | 0 (0.0%) |
| 9:00 AM to 9:59 AM | 35 (3.9%) | 29 (6.6%) |
| 10:00 AM to 10:59 AM | 60 (6.7%) | 16 (3.6%) |
| 11:00 AM to 11:59 AM | 8 (0.9%) | 5 (1.1%) |
| 12:00 PM to 3:59 PM | 91 (10.2%) | 28 (6.4%) |
| 4:00 PM to 11:59 PM | 17 (1.9%) | 37 (8.4%) |
| Total | 892 (100.0%) | 440 (100.0%) |
Housing Occupancy in Kalaeloa
Occupancy by Ownership in Kalaeloa
Of the total 806 dwellings in Kalaeloa, owner-occupied units account for 0 (0.0%), while renter-occupied units make up 806 (100.0%).
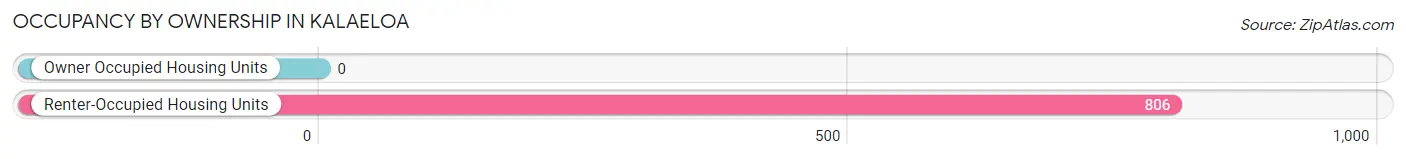
| Occupancy | # Housing Units | % Housing Units |
| Owner Occupied Housing Units | 0 | 0.0% |
| Renter-Occupied Housing Units | 806 | 100.0% |
| Total Occupied Housing Units | 806 | 100.0% |
Occupancy by Household Size in Kalaeloa
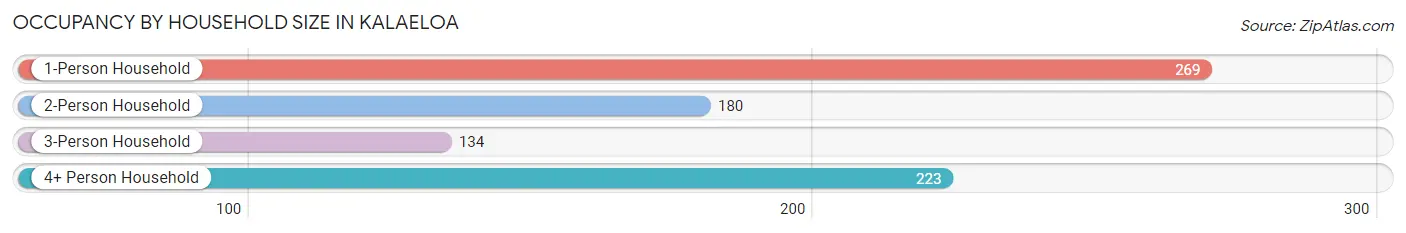
| Household Size | # Housing Units | % Housing Units |
| 1-Person Household | 269 | 33.4% |
| 2-Person Household | 180 | 22.3% |
| 3-Person Household | 134 | 16.6% |
| 4+ Person Household | 223 | 27.7% |
| Total Housing Units | 806 | 100.0% |
Occupancy by Ownership by Household Size in Kalaeloa
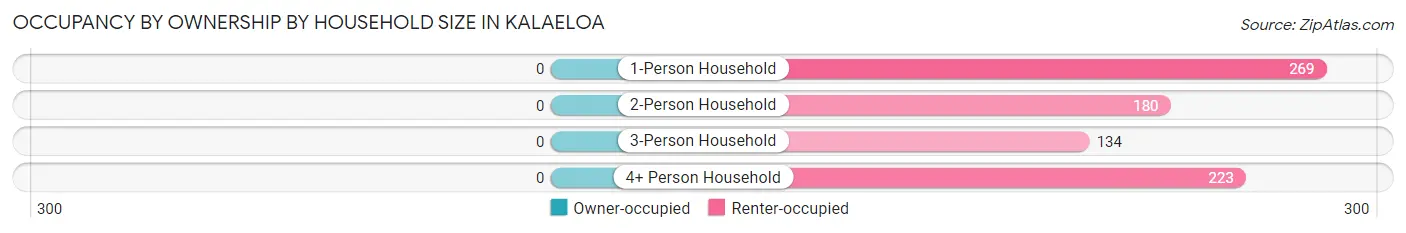
| Household Size | Owner-occupied | Renter-occupied |
| 1-Person Household | 0 (0.0%) | 269 (100.0%) |
| 2-Person Household | 0 (0.0%) | 180 (100.0%) |
| 3-Person Household | 0 (0.0%) | 134 (100.0%) |
| 4+ Person Household | 0 (0.0%) | 223 (100.0%) |
| Total Housing Units | 0 (0.0%) | 806 (100.0%) |
Occupancy by Educational Attainment in Kalaeloa
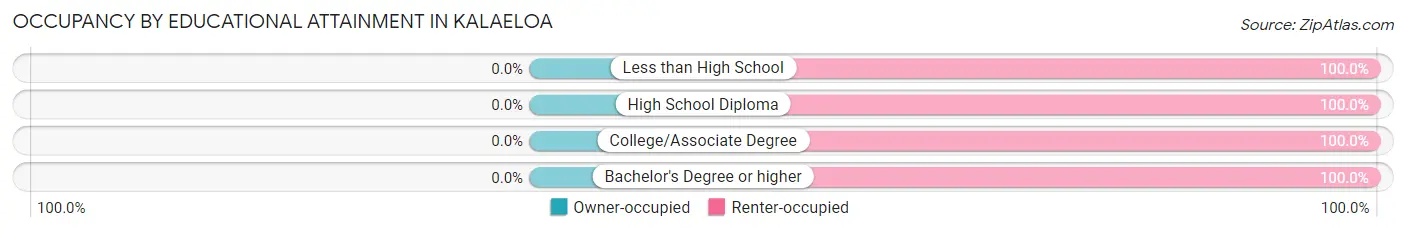
| Household Size | Owner-occupied | Renter-occupied |
| Less than High School | 0 (0.0%) | 13 (100.0%) |
| High School Diploma | 0 (0.0%) | 177 (100.0%) |
| College/Associate Degree | 0 (0.0%) | 418 (100.0%) |
| Bachelor's Degree or higher | 0 (0.0%) | 198 (100.0%) |
Occupancy by Age of Householder in Kalaeloa
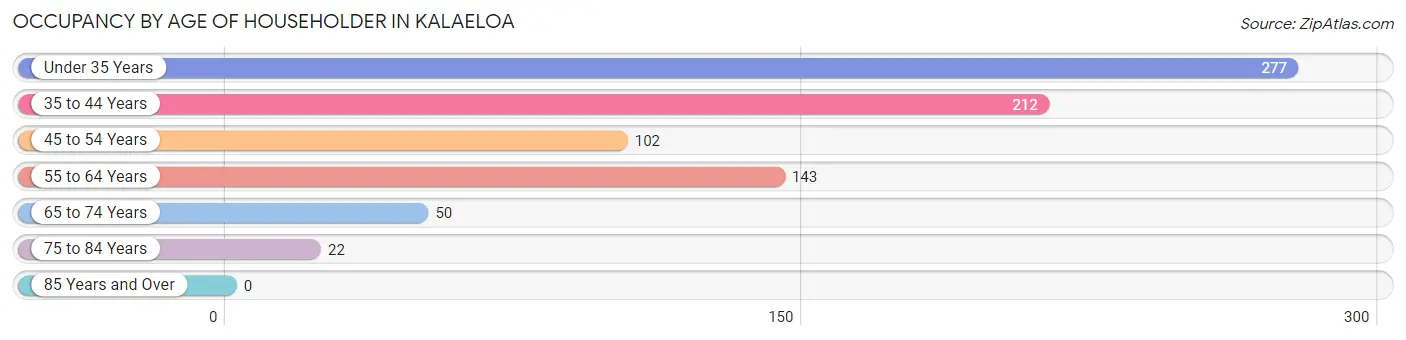
| Age Bracket | # Households | % Households |
| Under 35 Years | 277 | 34.4% |
| 35 to 44 Years | 212 | 26.3% |
| 45 to 54 Years | 102 | 12.7% |
| 55 to 64 Years | 143 | 17.7% |
| 65 to 74 Years | 50 | 6.2% |
| 75 to 84 Years | 22 | 2.7% |
| 85 Years and Over | 0 | 0.0% |
| Total | 806 | 100.0% |
Housing Finances in Kalaeloa
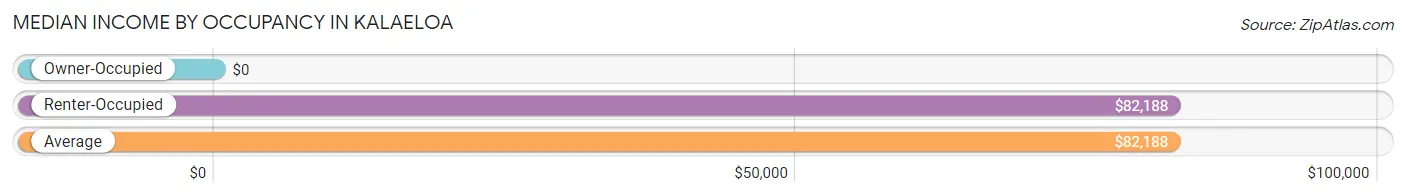
Median Income by Occupancy in Kalaeloa
| Occupancy Type | # Households | Median Income |
| Owner-Occupied | 0 (0.0%) | $0 |
| Renter-Occupied | 806 (100.0%) | $82,188 |
| Average | 806 (100.0%) | $82,188 |
Occupancy by Householder Income Bracket in Kalaeloa
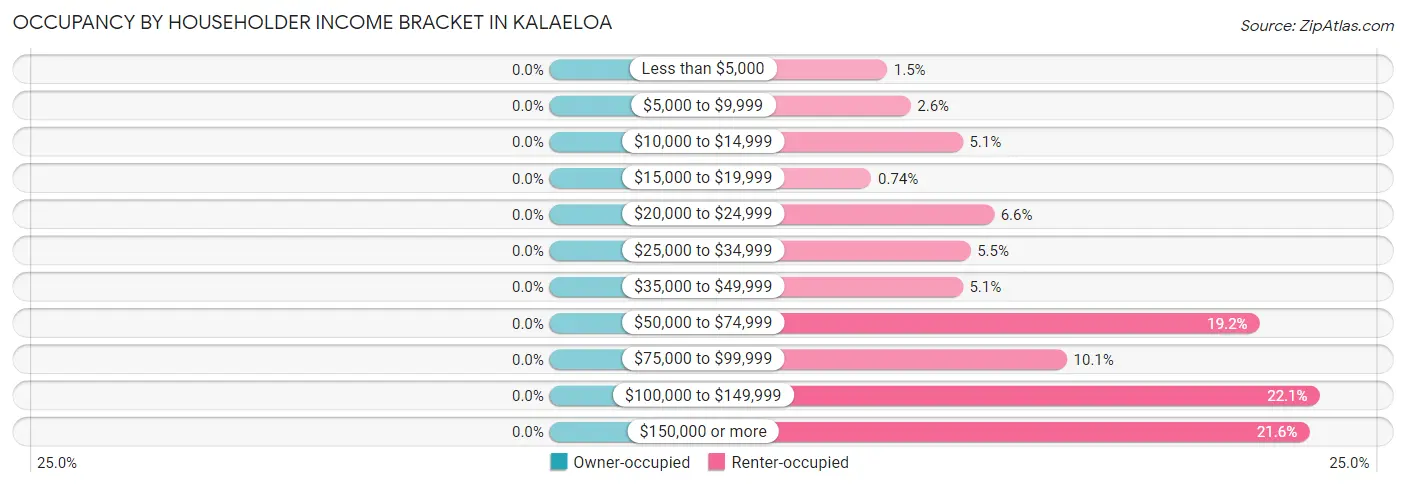
| Income Bracket | Owner-occupied | Renter-occupied |
| Less than $5,000 | 0 (0.0%) | 12 (1.5%) |
| $5,000 to $9,999 | 0 (0.0%) | 21 (2.6%) |
| $10,000 to $14,999 | 0 (0.0%) | 41 (5.1%) |
| $15,000 to $19,999 | 0 (0.0%) | 6 (0.7%) |
| $20,000 to $24,999 | 0 (0.0%) | 53 (6.6%) |
| $25,000 to $34,999 | 0 (0.0%) | 44 (5.5%) |
| $35,000 to $49,999 | 0 (0.0%) | 41 (5.1%) |
| $50,000 to $74,999 | 0 (0.0%) | 155 (19.2%) |
| $75,000 to $99,999 | 0 (0.0%) | 81 (10.1%) |
| $100,000 to $149,999 | 0 (0.0%) | 178 (22.1%) |
| $150,000 or more | 0 (0.0%) | 174 (21.6%) |
| Total | 0 (0.0%) | 806 (100.0%) |
Monthly Housing Cost Tiers in Kalaeloa
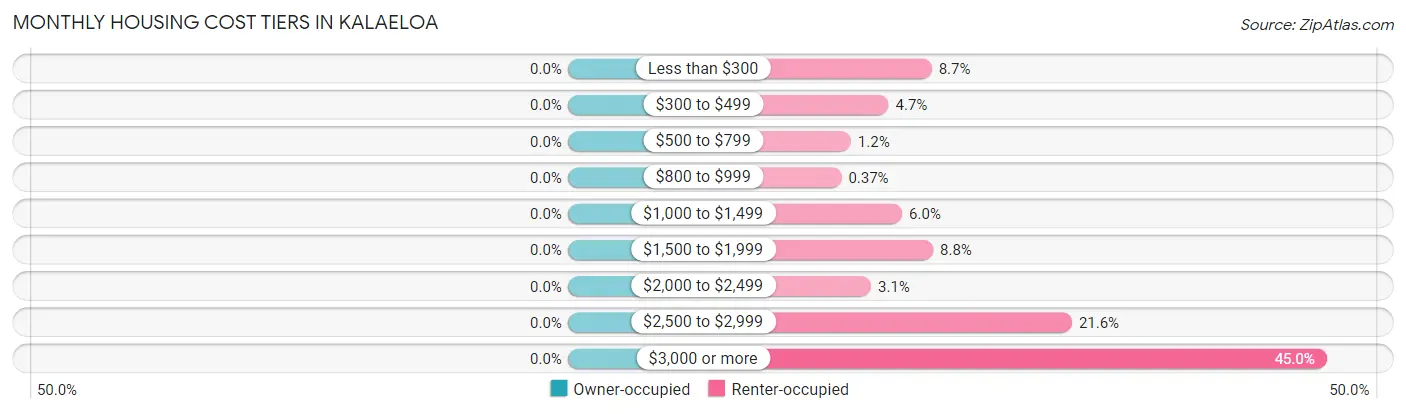
| Monthly Cost | Owner-occupied | Renter-occupied |
| Less than $300 | 0 (0.0%) | 70 (8.7%) |
| $300 to $499 | 0 (0.0%) | 38 (4.7%) |
| $500 to $799 | 0 (0.0%) | 10 (1.2%) |
| $800 to $999 | 0 (0.0%) | 3 (0.4%) |
| $1,000 to $1,499 | 0 (0.0%) | 48 (6.0%) |
| $1,500 to $1,999 | 0 (0.0%) | 71 (8.8%) |
| $2,000 to $2,499 | 0 (0.0%) | 25 (3.1%) |
| $2,500 to $2,999 | 0 (0.0%) | 174 (21.6%) |
| $3,000 or more | 0 (0.0%) | 363 (45.0%) |
| Total | 0 (0.0%) | 806 (100.0%) |
Physical Housing Characteristics in Kalaeloa
Housing Structures in Kalaeloa
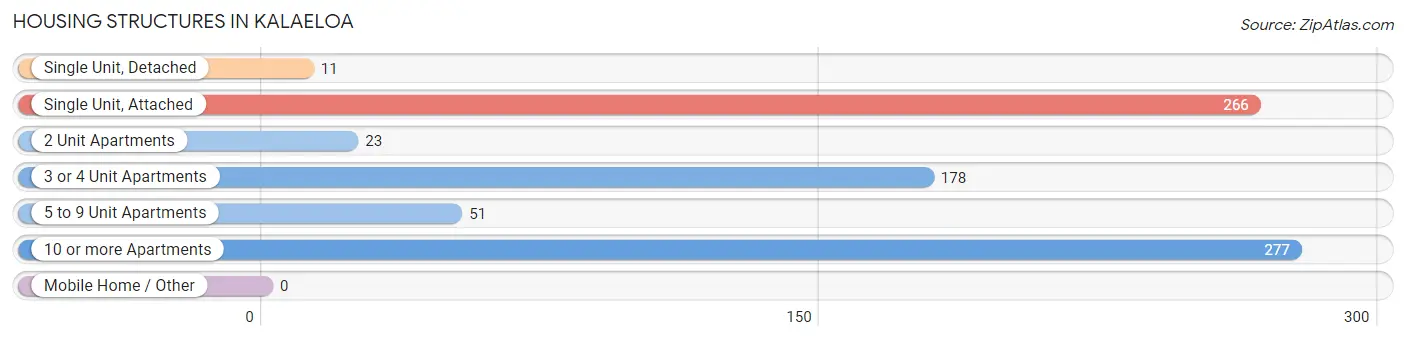
| Structure Type | # Housing Units | % Housing Units |
| Single Unit, Detached | 11 | 1.4% |
| Single Unit, Attached | 266 | 33.0% |
| 2 Unit Apartments | 23 | 2.9% |
| 3 or 4 Unit Apartments | 178 | 22.1% |
| 5 to 9 Unit Apartments | 51 | 6.3% |
| 10 or more Apartments | 277 | 34.4% |
| Mobile Home / Other | 0 | 0.0% |
| Total | 806 | 100.0% |
Housing Structures by Occupancy in Kalaeloa
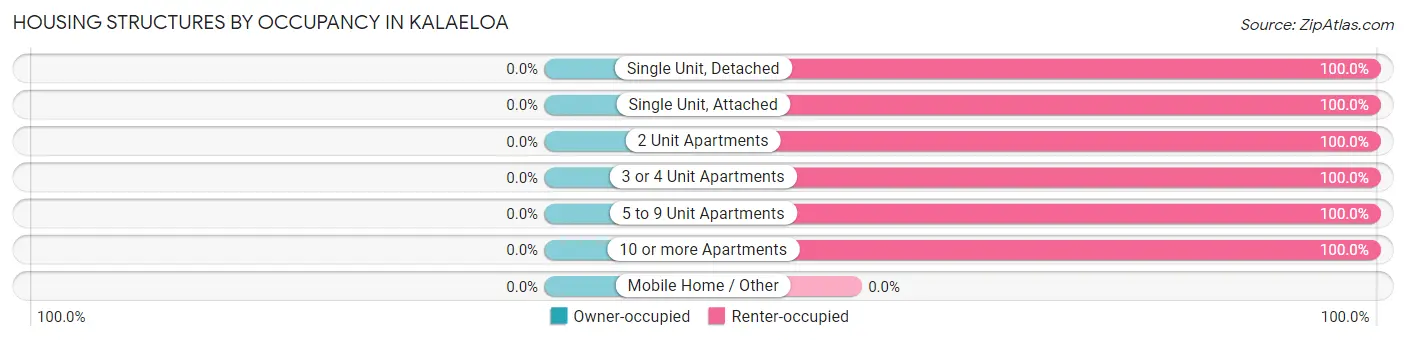
| Structure Type | Owner-occupied | Renter-occupied |
| Single Unit, Detached | 0 (0.0%) | 11 (100.0%) |
| Single Unit, Attached | 0 (0.0%) | 266 (100.0%) |
| 2 Unit Apartments | 0 (0.0%) | 23 (100.0%) |
| 3 or 4 Unit Apartments | 0 (0.0%) | 178 (100.0%) |
| 5 to 9 Unit Apartments | 0 (0.0%) | 51 (100.0%) |
| 10 or more Apartments | 0 (0.0%) | 277 (100.0%) |
| Mobile Home / Other | 0 (0.0%) | 0 (0.0%) |
| Total | 0 (0.0%) | 806 (100.0%) |
Housing Structures by Number of Rooms in Kalaeloa
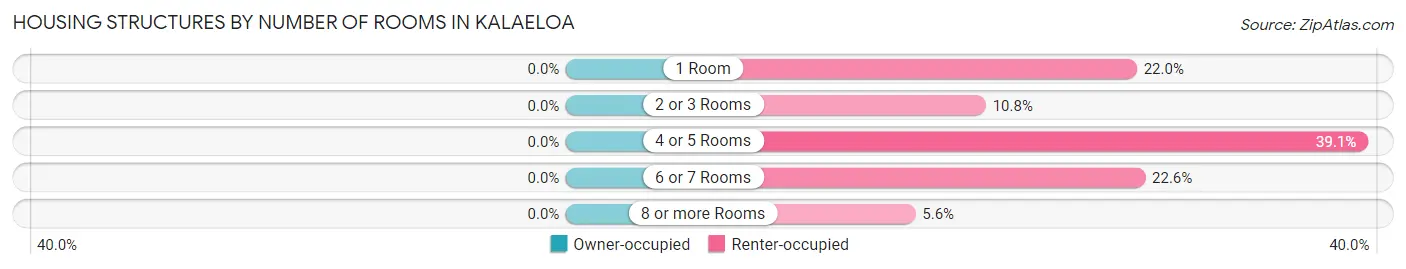
| Number of Rooms | Owner-occupied | Renter-occupied |
| 1 Room | 0 (0.0%) | 177 (22.0%) |
| 2 or 3 Rooms | 0 (0.0%) | 87 (10.8%) |
| 4 or 5 Rooms | 0 (0.0%) | 315 (39.1%) |
| 6 or 7 Rooms | 0 (0.0%) | 182 (22.6%) |
| 8 or more Rooms | 0 (0.0%) | 45 (5.6%) |
| Total | 0 (0.0%) | 806 (100.0%) |
Housing Structure by Heating Type in Kalaeloa
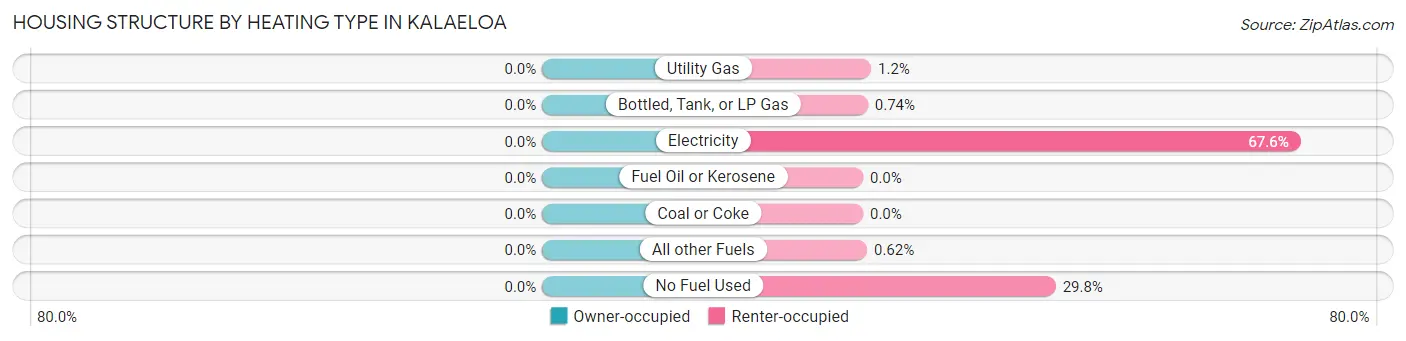
| Heating Type | Owner-occupied | Renter-occupied |
| Utility Gas | 0 (0.0%) | 10 (1.2%) |
| Bottled, Tank, or LP Gas | 0 (0.0%) | 6 (0.7%) |
| Electricity | 0 (0.0%) | 545 (67.6%) |
| Fuel Oil or Kerosene | 0 (0.0%) | 0 (0.0%) |
| Coal or Coke | 0 (0.0%) | 0 (0.0%) |
| All other Fuels | 0 (0.0%) | 5 (0.6%) |
| No Fuel Used | 0 (0.0%) | 240 (29.8%) |
| Total | 0 (0.0%) | 806 (100.0%) |
Household Vehicle Usage in Kalaeloa
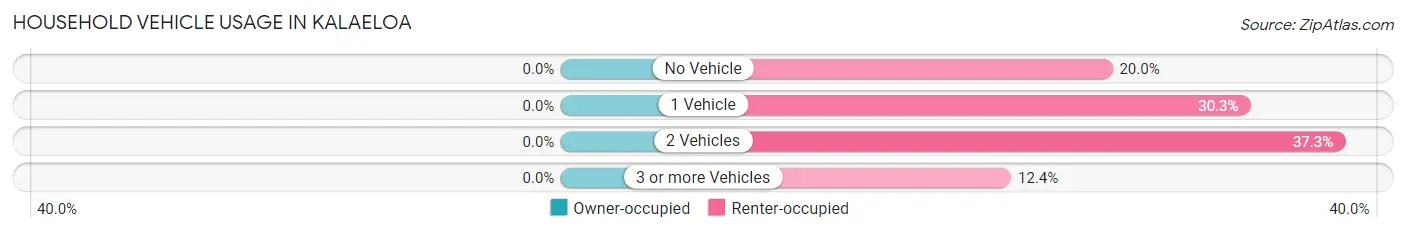
| Vehicles per Household | Owner-occupied | Renter-occupied |
| No Vehicle | 0 (0.0%) | 161 (20.0%) |
| 1 Vehicle | 0 (0.0%) | 244 (30.3%) |
| 2 Vehicles | 0 (0.0%) | 301 (37.3%) |
| 3 or more Vehicles | 0 (0.0%) | 100 (12.4%) |
| Total | 0 (0.0%) | 806 (100.0%) |
Real Estate & Mortgages in Kalaeloa
Real Estate and Mortgage Overview in Kalaeloa
| Characteristic | Without Mortgage | With Mortgage |
| Housing Units | 0 | 0 |
| Median Property Value | - | - |
| Median Household Income | - | - |
| Monthly Housing Costs | - | - |
| Real Estate Taxes | - | - |
Property Value by Mortgage Status in Kalaeloa
| Property Value | Without Mortgage | With Mortgage |
| Less than $50,000 | 0 (0.0%) | 0 (0.0%) |
| $50,000 to $99,999 | 0 (0.0%) | 0 (0.0%) |
| $100,000 to $299,999 | 0 (0.0%) | 0 (0.0%) |
| $300,000 to $499,999 | 0 (0.0%) | 0 (0.0%) |
| $500,000 to $749,999 | 0 (0.0%) | 0 (0.0%) |
| $750,000 to $999,999 | 0 (0.0%) | 0 (0.0%) |
| $1,000,000 or more | 0 (0.0%) | 0 (0.0%) |
| Total | 0 (0.0%) | 0 (0.0%) |
Household Income by Mortgage Status in Kalaeloa
| Household Income | Without Mortgage | With Mortgage |
| Less than $10,000 | 0 (0.0%) | 0 (0.0%) |
| $10,000 to $24,999 | 0 (0.0%) | 0 (0.0%) |
| $25,000 to $34,999 | 0 (0.0%) | 0 (0.0%) |
| $35,000 to $49,999 | 0 (0.0%) | 0 (0.0%) |
| $50,000 to $74,999 | 0 (0.0%) | 0 (0.0%) |
| $75,000 to $99,999 | 0 (0.0%) | 0 (0.0%) |
| $100,000 to $149,999 | 0 (0.0%) | 0 (0.0%) |
| $150,000 or more | 0 (0.0%) | 0 (0.0%) |
| Total | 0 (0.0%) | 0 (0.0%) |
Property Value to Household Income Ratio in Kalaeloa
| Value-to-Income Ratio | Without Mortgage | With Mortgage |
| Less than 2.0x | 0 (0.0%) | 0 (0.0%) |
| 2.0x to 2.9x | 0 (0.0%) | 0 (0.0%) |
| 3.0x to 3.9x | 0 (0.0%) | 0 (0.0%) |
| 4.0x or more | 0 (0.0%) | 0 (0.0%) |
| Total | 0 (0.0%) | 0 (0.0%) |
Real Estate Taxes by Mortgage Status in Kalaeloa
| Property Taxes | Without Mortgage | With Mortgage |
| Less than $800 | 0 (0.0%) | 0 (0.0%) |
| $800 to $1,499 | 0 (0.0%) | 0 (0.0%) |
| $800 to $1,499 | 0 (0.0%) | 0 (0.0%) |
| Total | 0 (0.0%) | 0 (0.0%) |
Health & Disability in Kalaeloa
Health Insurance Coverage by Age in Kalaeloa
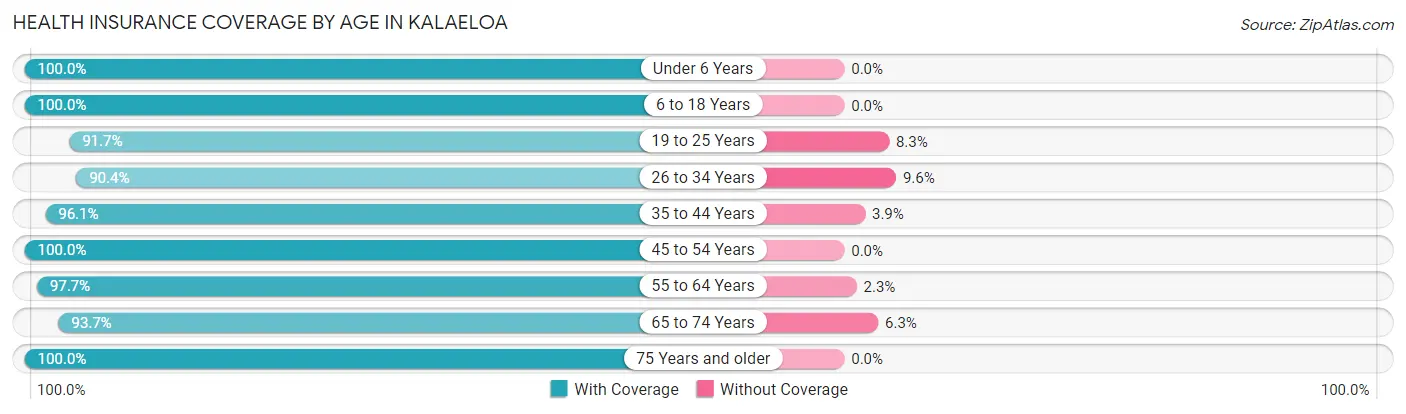
| Age Bracket | With Coverage | Without Coverage |
| Under 6 Years | 235 (100.0%) | 0 (0.0%) |
| 6 to 18 Years | 532 (100.0%) | 0 (0.0%) |
| 19 to 25 Years | 264 (91.7%) | 24 (8.3%) |
| 26 to 34 Years | 441 (90.4%) | 47 (9.6%) |
| 35 to 44 Years | 422 (96.1%) | 17 (3.9%) |
| 45 to 54 Years | 261 (100.0%) | 0 (0.0%) |
| 55 to 64 Years | 342 (97.7%) | 8 (2.3%) |
| 65 to 74 Years | 104 (93.7%) | 7 (6.3%) |
| 75 Years and older | 34 (100.0%) | 0 (0.0%) |
| Total | 2,635 (96.2%) | 103 (3.8%) |
Health Insurance Coverage by Citizenship Status in Kalaeloa
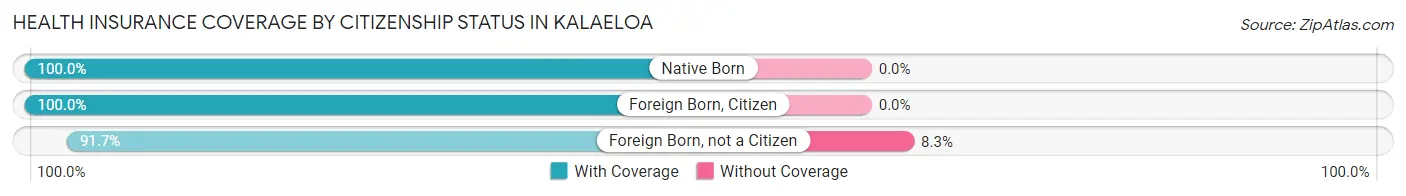
| Citizenship Status | With Coverage | Without Coverage |
| Native Born | 235 (100.0%) | 0 (0.0%) |
| Foreign Born, Citizen | 532 (100.0%) | 0 (0.0%) |
| Foreign Born, not a Citizen | 264 (91.7%) | 24 (8.3%) |
Health Insurance Coverage by Household Income in Kalaeloa
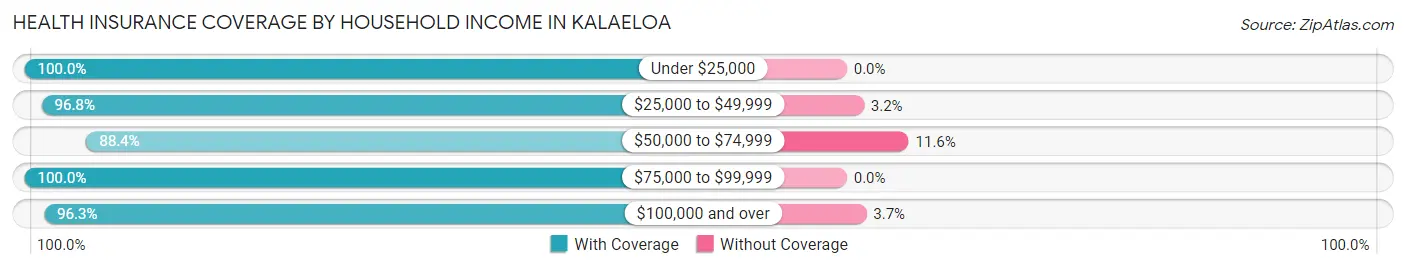
| Household Income | With Coverage | Without Coverage |
| Under $25,000 | 133 (100.0%) | 0 (0.0%) |
| $25,000 to $49,999 | 182 (96.8%) | 6 (3.2%) |
| $50,000 to $74,999 | 229 (88.4%) | 30 (11.6%) |
| $75,000 to $99,999 | 200 (100.0%) | 0 (0.0%) |
| $100,000 and over | 1,210 (96.3%) | 46 (3.7%) |
Public vs Private Health Insurance Coverage by Age in Kalaeloa
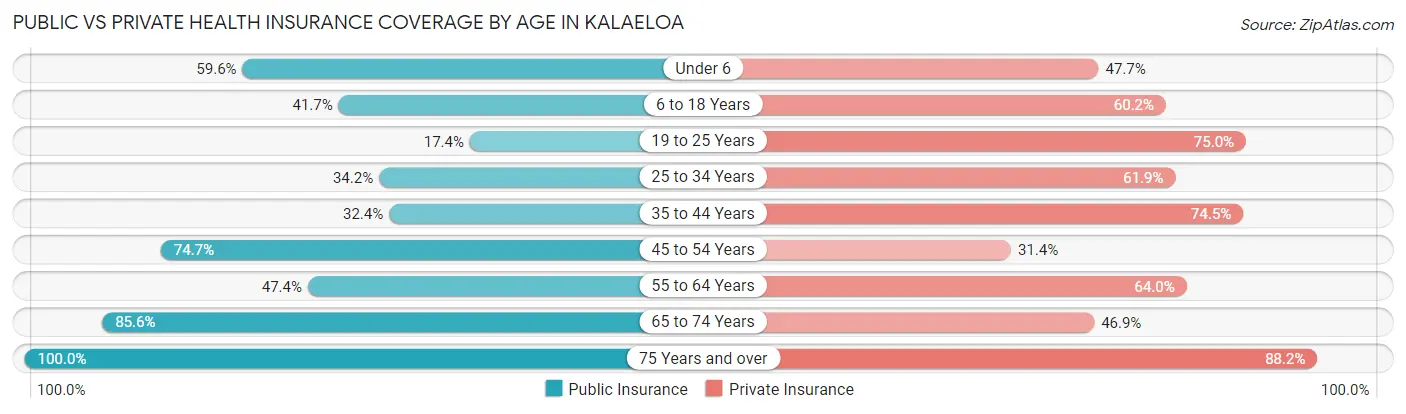
| Age Bracket | Public Insurance | Private Insurance |
| Under 6 | 140 (59.6%) | 112 (47.7%) |
| 6 to 18 Years | 222 (41.7%) | 320 (60.2%) |
| 19 to 25 Years | 50 (17.4%) | 216 (75.0%) |
| 25 to 34 Years | 167 (34.2%) | 302 (61.9%) |
| 35 to 44 Years | 142 (32.4%) | 327 (74.5%) |
| 45 to 54 Years | 195 (74.7%) | 82 (31.4%) |
| 55 to 64 Years | 166 (47.4%) | 224 (64.0%) |
| 65 to 74 Years | 95 (85.6%) | 52 (46.9%) |
| 75 Years and over | 34 (100.0%) | 30 (88.2%) |
| Total | 1,211 (44.2%) | 1,665 (60.8%) |
Disability Status by Sex by Age in Kalaeloa
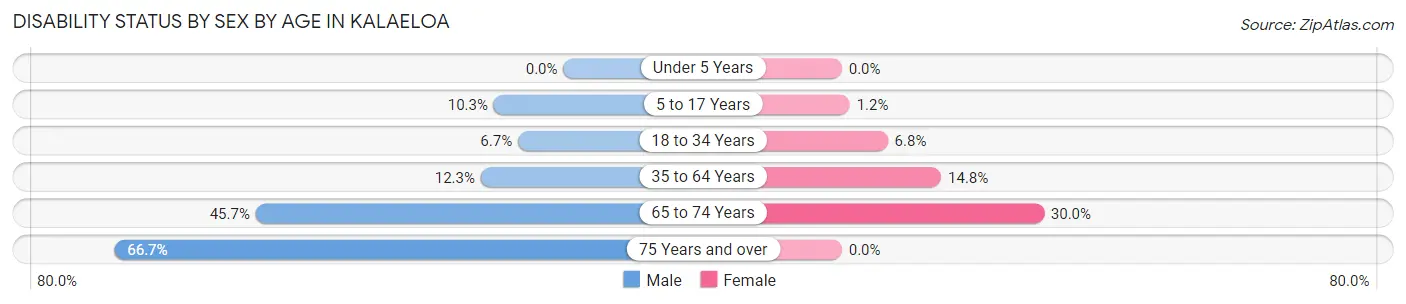
| Age Bracket | Male | Female |
| Under 5 Years | 0 (0.0%) | 0 (0.0%) |
| 5 to 17 Years | 25 (10.3%) | 4 (1.2%) |
| 18 to 34 Years | 26 (6.7%) | 28 (6.8%) |
| 35 to 64 Years | 83 (12.3%) | 55 (14.7%) |
| 65 to 74 Years | 37 (45.7%) | 9 (30.0%) |
| 75 Years and over | 8 (66.7%) | 0 (0.0%) |
Disability Class by Sex by Age in Kalaeloa
Disability Class: Hearing Difficulty
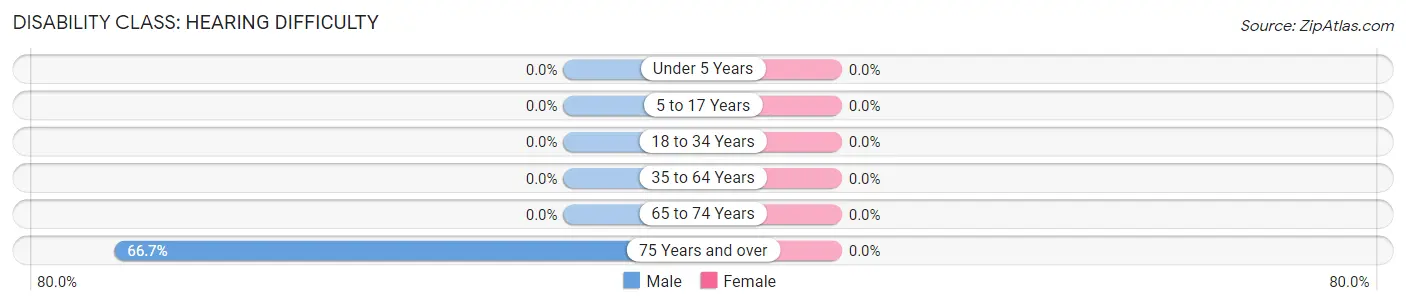
| Age Bracket | Male | Female |
| Under 5 Years | 0 (0.0%) | 0 (0.0%) |
| 5 to 17 Years | 0 (0.0%) | 0 (0.0%) |
| 18 to 34 Years | 0 (0.0%) | 0 (0.0%) |
| 35 to 64 Years | 0 (0.0%) | 0 (0.0%) |
| 65 to 74 Years | 0 (0.0%) | 0 (0.0%) |
| 75 Years and over | 8 (66.7%) | 0 (0.0%) |
Disability Class: Vision Difficulty
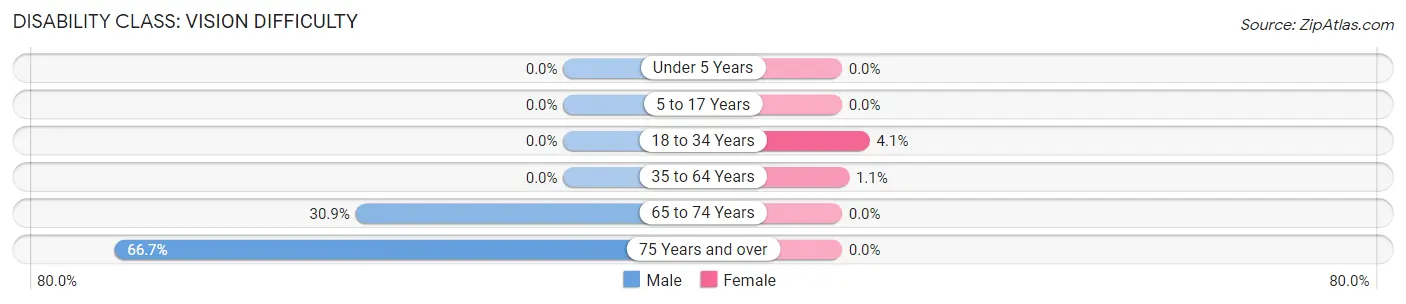
| Age Bracket | Male | Female |
| Under 5 Years | 0 (0.0%) | 0 (0.0%) |
| 5 to 17 Years | 0 (0.0%) | 0 (0.0%) |
| 18 to 34 Years | 0 (0.0%) | 17 (4.1%) |
| 35 to 64 Years | 0 (0.0%) | 4 (1.1%) |
| 65 to 74 Years | 25 (30.9%) | 0 (0.0%) |
| 75 Years and over | 8 (66.7%) | 0 (0.0%) |
Disability Class: Cognitive Difficulty
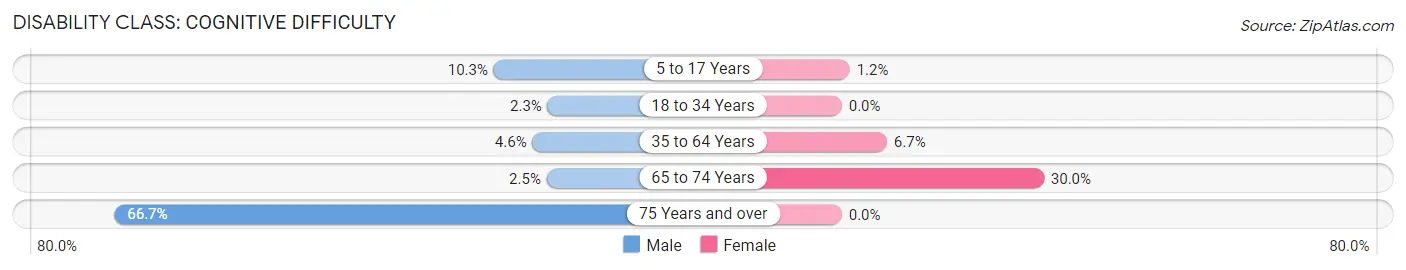
| Age Bracket | Male | Female |
| 5 to 17 Years | 25 (10.3%) | 4 (1.2%) |
| 18 to 34 Years | 9 (2.3%) | 0 (0.0%) |
| 35 to 64 Years | 31 (4.6%) | 25 (6.7%) |
| 65 to 74 Years | 2 (2.5%) | 9 (30.0%) |
| 75 Years and over | 8 (66.7%) | 0 (0.0%) |
Disability Class: Ambulatory Difficulty
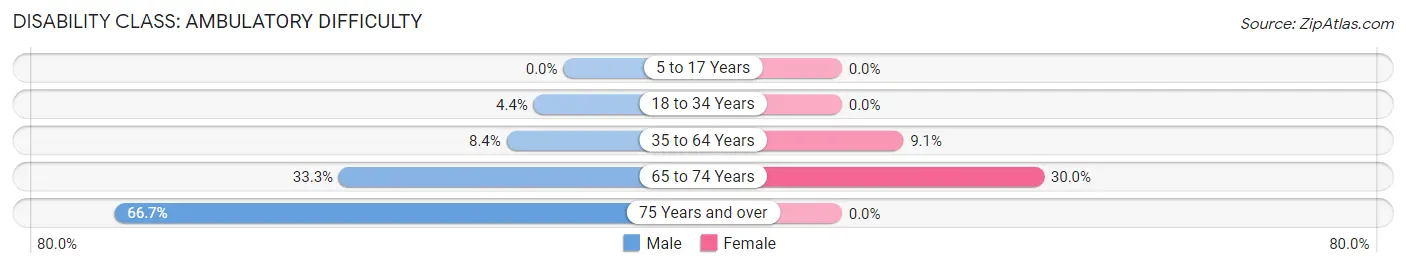
| Age Bracket | Male | Female |
| 5 to 17 Years | 0 (0.0%) | 0 (0.0%) |
| 18 to 34 Years | 17 (4.4%) | 0 (0.0%) |
| 35 to 64 Years | 57 (8.4%) | 34 (9.1%) |
| 65 to 74 Years | 27 (33.3%) | 9 (30.0%) |
| 75 Years and over | 8 (66.7%) | 0 (0.0%) |
Disability Class: Self-Care Difficulty
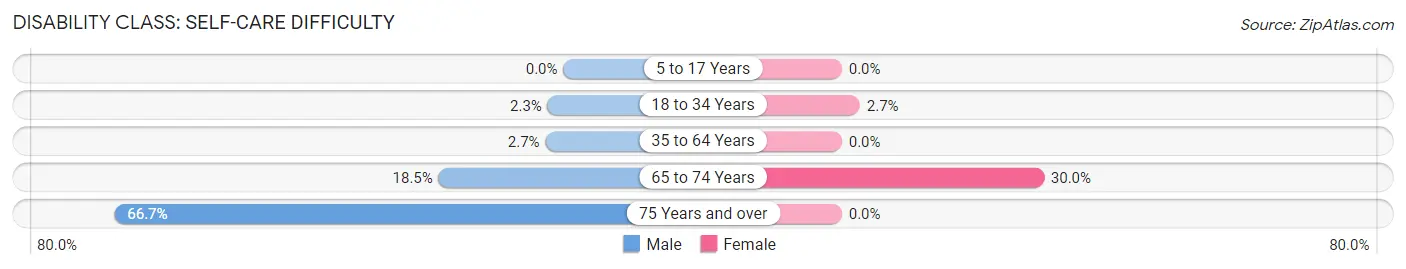
| Age Bracket | Male | Female |
| 5 to 17 Years | 0 (0.0%) | 0 (0.0%) |
| 18 to 34 Years | 9 (2.3%) | 11 (2.7%) |
| 35 to 64 Years | 18 (2.7%) | 0 (0.0%) |
| 65 to 74 Years | 15 (18.5%) | 9 (30.0%) |
| 75 Years and over | 8 (66.7%) | 0 (0.0%) |
Technology Access in Kalaeloa
Computing Device Access in Kalaeloa
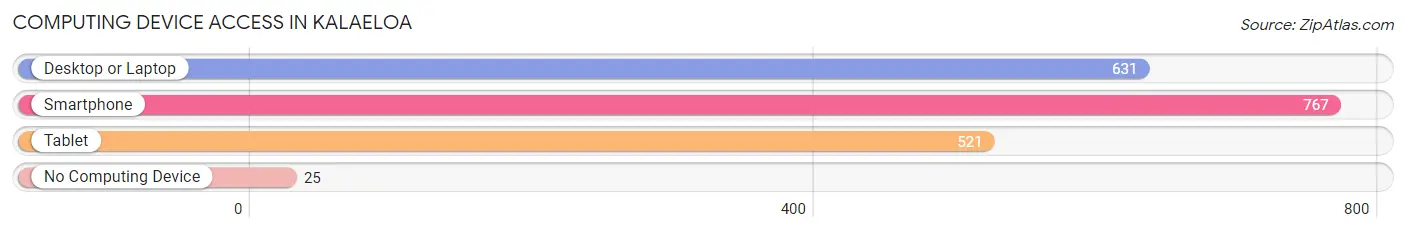
| Device Type | # Households | % Households |
| Desktop or Laptop | 631 | 78.3% |
| Smartphone | 767 | 95.2% |
| Tablet | 521 | 64.6% |
| No Computing Device | 25 | 3.1% |
| Total | 806 | 100.0% |
Internet Access in Kalaeloa
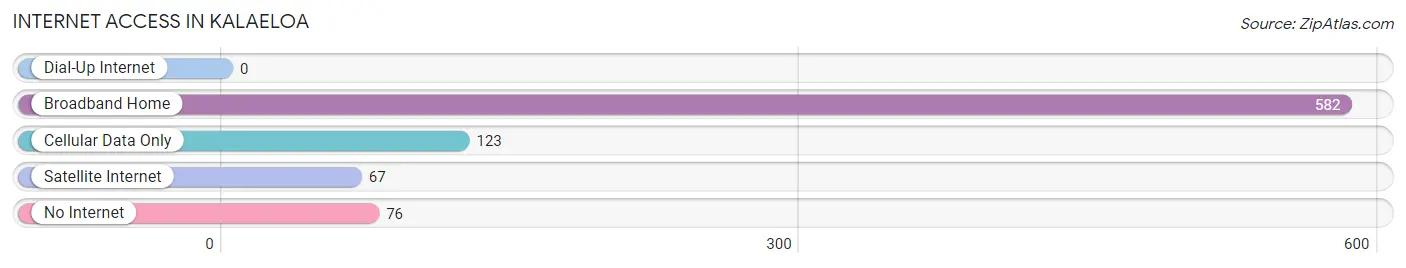
| Internet Type | # Households | % Households |
| Dial-Up Internet | 0 | 0.0% |
| Broadband Home | 582 | 72.2% |
| Cellular Data Only | 123 | 15.3% |
| Satellite Internet | 67 | 8.3% |
| No Internet | 76 | 9.4% |
| Total | 806 | 100.0% |
Kalaeloa Summary
Kalaeloa is a census-designated place (CDP) located in the Ewa District of Honolulu County, Hawaii, United States. The population was 1,845 at the 2010 census. Kalaeloa is located on the western side of the island of Oahu, and is part of the City and County of Honolulu.
History
Kalaeloa was originally known as Barbers Point, named after Captain Henry Barber, a British sailor who was the first to map the area in 1794. The area was used as a military base by the United States Navy from 1903 to 1999. During World War II, the area was used as a naval air station and was the site of the first Japanese attack on Oahu. After the war, the area was used as a naval air station and was the site of the first Japanese attack on Oahu.
In 1999, the Navy closed the base and the area was redeveloped as a commercial and residential area. The area was renamed Kalaeloa, which means “the good harbor” in Hawaiian.
Geography
Kalaeloa is located at 21°19′45″N 158°2′45″W (21.329167, -158.045278). According to the United States Census Bureau, the CDP has a total area of 1.3 square miles (3.4 km2), all of it land.
Economy
Kalaeloa is home to several businesses, including a shopping center, a movie theater, a golf course, and a marina. The area is also home to the Kalaeloa Airport, which is used for general aviation and military operations.
Demographics
As of the census of 2000, there were 1,845 people, 602 households, and 463 families residing in the CDP. The population density was 1,420.3 people per square mile (548.7/km2). There were 645 housing units at an average density of 495.3 per square mile (191.2/km2). The racial makeup of the CDP was 33.2% White, 0.9% African American, 0.2% Native American, 24.2% Asian, 8.2% Pacific Islander, 0.7% from other races, and 32.8% from two or more races. Hispanic or Latino of any race were 8.2% of the population.
There were 602 households, out of which 37.2% had children under the age of 18 living with them, 56.3% were married couples living together, 11.3% had a female householder with no husband present, and 26.2% were non-families. 19.3% of all households were made up of individuals, and 4.3% had someone living alone who was 65 years of age or older. The average household size was 3.06 and the average family size was 3.50.
In the CDP, the population was spread out, with 28.2% under the age of 18, 8.2% from 18 to 24, 32.2% from 25 to 44, 22.7% from 45 to 64, and 8.7% who were 65 years of age or older. The median age was 34 years. For every 100 females, there were 103.2 males. For every 100 females age 18 and over, there were 103.2 males.
The median income for a household in the CDP was $50,000, and the median income for a family was $51,250. Males had a median income of $31,250 versus $25,000 for females. The per capita income for the CDP was $19,845. About 8.2% of families and 10.2% of the population were below the poverty line, including 11.3% of those under age 18 and none of those age 65 or over.
Common Questions
What is Per Capita Income in Kalaeloa?
Per Capita income in Kalaeloa is $28,571.
What is the Median Family Income in Kalaeloa?
Median Family Income in Kalaeloa is $99,191.
What is the Median Household income in Kalaeloa?
Median Household Income in Kalaeloa is $82,188.
What is Income or Wage Gap in Kalaeloa?
Income or Wage Gap in Kalaeloa is 22.6%.
Women in Kalaeloa earn 77.4 cents for every dollar earned by a man.
What is Inequality or Gini Index in Kalaeloa?
Inequality or Gini Index in Kalaeloa is 0.39.
What is the Total Population of Kalaeloa?
Total Population of Kalaeloa is 2,971.
What is the Total Male Population of Kalaeloa?
Total Male Population of Kalaeloa is 1,684.
What is the Total Female Population of Kalaeloa?
Total Female Population of Kalaeloa is 1,287.
What is the Ratio of Males per 100 Females in Kalaeloa?
There are 130.85 Males per 100 Females in Kalaeloa.
What is the Ratio of Females per 100 Males in Kalaeloa?
There are 76.43 Females per 100 Males in Kalaeloa.
What is the Median Population Age in Kalaeloa?
Median Population Age in Kalaeloa is 32.2 Years.
What is the Average Family Size in Kalaeloa
Average Family Size in Kalaeloa is 3.5 People.
What is the Average Household Size in Kalaeloa
Average Household Size in Kalaeloa is 2.8 People.
How Large is the Labor Force in Kalaeloa?
There are 1,588 People in the Labor Forcein in Kalaeloa.
What is the Percentage of People in the Labor Force in Kalaeloa?
70.1% of People are in the Labor Force in Kalaeloa.
What is the Unemployment Rate in Kalaeloa?
Unemployment Rate in Kalaeloa is 7.6%.