Zip Codes with the Lowest Poverty Level Among Children Under the Age of 5 in West Virginia
RELATED REPORTS & OPTIONS
Lowest Poverty | Child 0-5
West Virginia
Compare Zip Codes
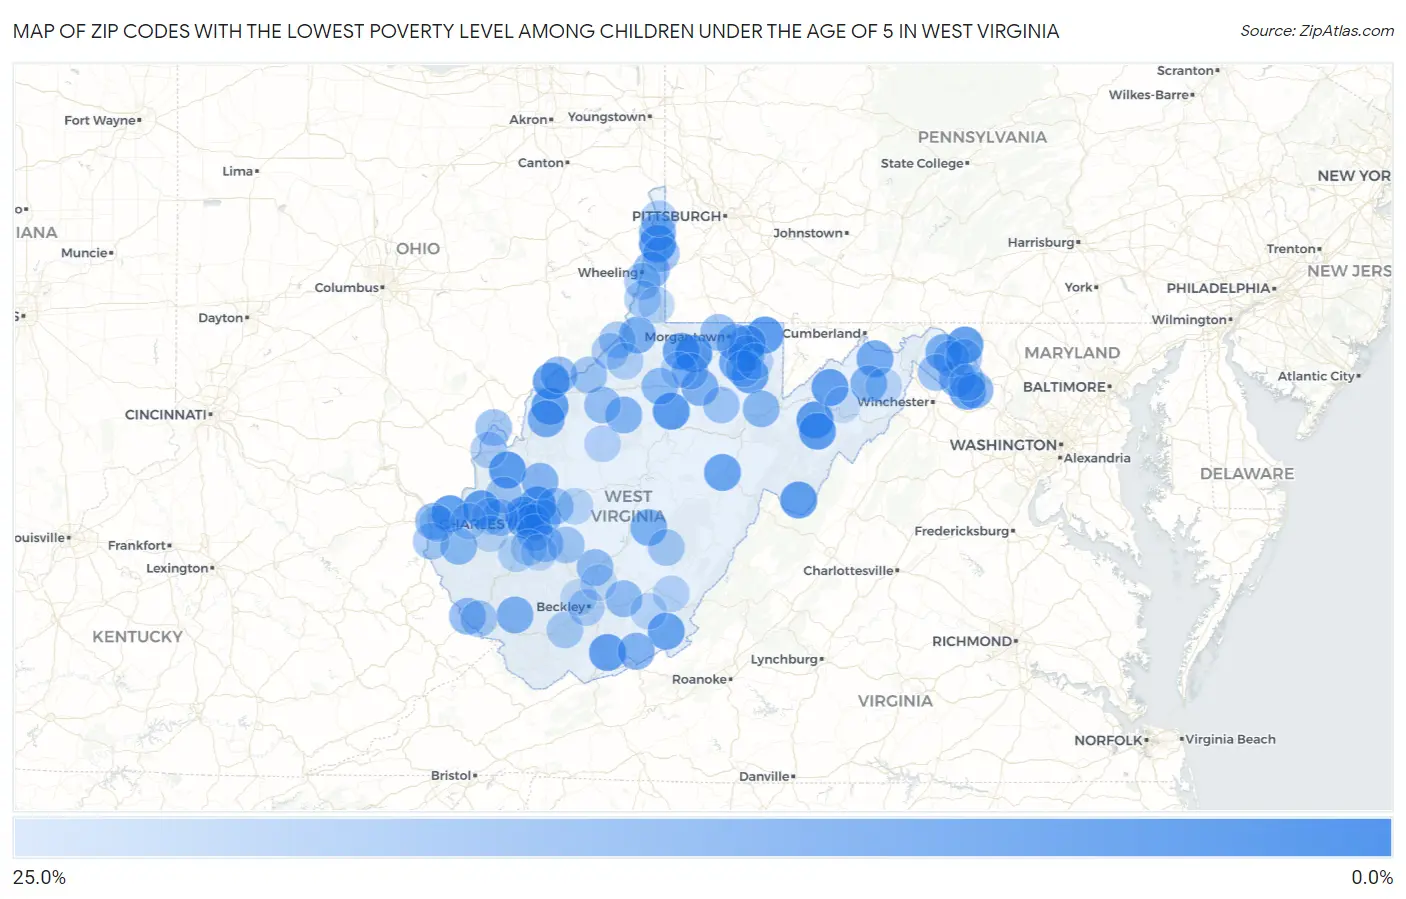
Map of Zip Codes with the Lowest Poverty Level Among Children Under the Age of 5 in West Virginia
25.0%
0.0%
Zip Codes with the Lowest Poverty Level Among Children Under the Age of 5 in West Virginia
| Zip Code | Child Poverty | vs State | vs National | |
| 1. | 26571 | 1.5% | 25.5%(-24.0)#1 | 18.1%(-16.5)#541 |
| 2. | 26070 | 1.8% | 25.5%(-23.7)#2 | 18.1%(-16.3)#679 |
| 3. | 25312 | 2.6% | 25.5%(-22.9)#3 | 18.1%(-15.5)#1,198 |
| 4. | 25703 | 2.6% | 25.5%(-22.9)#4 | 18.1%(-15.5)#1,216 |
| 5. | 26378 | 2.7% | 25.5%(-22.8)#5 | 18.1%(-15.4)#1,269 |
| 6. | 25123 | 2.9% | 25.5%(-22.6)#6 | 18.1%(-15.2)#1,436 |
| 7. | 26833 | 3.0% | 25.5%(-22.5)#7 | 18.1%(-15.1)#1,495 |
| 8. | 25541 | 3.1% | 25.5%(-22.4)#8 | 18.1%(-15.0)#1,561 |
| 9. | 26525 | 3.2% | 25.5%(-22.2)#9 | 18.1%(-14.8)#1,668 |
| 10. | 26847 | 3.4% | 25.5%(-22.1)#10 | 18.1%(-14.6)#1,785 |
| 11. | 26150 | 3.6% | 25.5%(-21.9)#11 | 18.1%(-14.4)#1,895 |
| 12. | 26815 | 3.8% | 25.5%(-21.7)#12 | 18.1%(-14.3)#2,020 |
| 13. | 25419 | 4.0% | 25.5%(-21.5)#13 | 18.1%(-14.1)#2,163 |
| 14. | 24712 | 4.2% | 25.5%(-21.3)#14 | 18.1%(-13.8)#2,361 |
| 15. | 26743 | 4.3% | 25.5%(-21.2)#15 | 18.1%(-13.8)#2,376 |
| 16. | 26105 | 4.9% | 25.5%(-20.6)#16 | 18.1%(-13.1)#2,857 |
| 17. | 26444 | 5.0% | 25.5%(-20.5)#17 | 18.1%(-13.1)#2,901 |
| 18. | 25064 | 5.5% | 25.5%(-20.0)#18 | 18.1%(-12.6)#3,203 |
| 19. | 25414 | 5.5% | 25.5%(-20.0)#19 | 18.1%(-12.5)#3,259 |
| 20. | 24983 | 5.9% | 25.5%(-19.6)#20 | 18.1%(-12.2)#3,506 |
| 21. | 26280 | 6.0% | 25.5%(-19.5)#21 | 18.1%(-12.1)#3,575 |
| 22. | 26542 | 6.2% | 25.5%(-19.3)#22 | 18.1%(-11.9)#3,702 |
| 23. | 26582 | 6.2% | 25.5%(-19.2)#23 | 18.1%(-11.8)#3,768 |
| 24. | 25313 | 6.4% | 25.5%(-19.1)#24 | 18.1%(-11.6)#3,890 |
| 25. | 26374 | 7.1% | 25.5%(-18.3)#25 | 18.1%(-10.9)#4,368 |
| 26. | 26763 | 7.8% | 25.5%(-17.6)#26 | 18.1%(-10.2)#4,821 |
| 27. | 26169 | 8.6% | 25.5%(-16.9)#27 | 18.1%(-9.46)#5,333 |
| 28. | 25427 | 9.7% | 25.5%(-15.8)#28 | 18.1%(-8.40)#6,056 |
| 29. | 26205 | 9.9% | 25.5%(-15.6)#29 | 18.1%(-8.15)#6,188 |
| 30. | 26155 | 10.0% | 25.5%(-15.5)#30 | 18.1%(-8.09)#6,232 |
| 31. | 25635 | 10.1% | 25.5%(-15.4)#31 | 18.1%(-7.94)#6,343 |
| 32. | 25302 | 10.5% | 25.5%(-14.9)#32 | 18.1%(-7.51)#6,587 |
| 33. | 26330 | 10.6% | 25.5%(-14.9)#33 | 18.1%(-7.47)#6,605 |
| 34. | 24963 | 10.8% | 25.5%(-14.7)#34 | 18.1%(-7.27)#6,718 |
| 35. | 26508 | 11.0% | 25.5%(-14.5)#35 | 18.1%(-7.05)#6,848 |
| 36. | 26757 | 11.2% | 25.5%(-14.3)#36 | 18.1%(-6.86)#6,981 |
| 37. | 26037 | 11.4% | 25.5%(-14.1)#37 | 18.1%(-6.66)#7,089 |
| 38. | 26325 | 11.5% | 25.5%(-13.9)#38 | 18.1%(-6.52)#7,175 |
| 39. | 25430 | 11.6% | 25.5%(-13.9)#39 | 18.1%(-6.51)#7,181 |
| 40. | 25425 | 12.1% | 25.5%(-13.4)#40 | 18.1%(-5.94)#7,531 |
| 41. | 25530 | 12.1% | 25.5%(-13.3)#41 | 18.1%(-5.92)#7,542 |
| 42. | 25248 | 12.3% | 25.5%(-13.2)#42 | 18.1%(-5.76)#7,633 |
| 43. | 26287 | 12.4% | 25.5%(-13.1)#43 | 18.1%(-5.68)#7,696 |
| 44. | 25512 | 12.6% | 25.5%(-12.9)#44 | 18.1%(-5.45)#7,825 |
| 45. | 26426 | 13.1% | 25.5%(-12.3)#45 | 18.1%(-4.91)#8,128 |
| 46. | 25303 | 13.1% | 25.5%(-12.3)#46 | 18.1%(-4.91)#8,129 |
| 47. | 26003 | 13.2% | 25.5%(-12.3)#47 | 18.1%(-4.89)#8,139 |
| 48. | 26547 | 13.3% | 25.5%(-12.2)#48 | 18.1%(-4.77)#8,205 |
| 49. | 26187 | 13.6% | 25.5%(-11.9)#49 | 18.1%(-4.50)#8,381 |
| 50. | 25661 | 14.1% | 25.5%(-11.4)#50 | 18.1%(-3.94)#8,701 |
| 51. | 25840 | 14.4% | 25.5%(-11.1)#51 | 18.1%(-3.71)#8,869 |
| 52. | 25976 | 14.5% | 25.5%(-11.0)#52 | 18.1%(-3.57)#8,939 |
| 53. | 25403 | 14.6% | 25.5%(-10.8)#53 | 18.1%(-3.42)#9,014 |
| 54. | 26431 | 15.0% | 25.5%(-10.5)#54 | 18.1%(-3.08)#9,196 |
| 55. | 25315 | 15.3% | 25.5%(-10.2)#55 | 18.1%(-2.81)#9,352 |
| 56. | 26541 | 15.3% | 25.5%(-10.2)#56 | 18.1%(-2.76)#9,380 |
| 57. | 26362 | 15.6% | 25.5%(-9.93)#57 | 18.1%(-2.51)#9,521 |
| 58. | 25314 | 15.6% | 25.5%(-9.86)#58 | 18.1%(-2.44)#9,554 |
| 59. | 26032 | 15.6% | 25.5%(-9.86)#59 | 18.1%(-2.44)#9,558 |
| 60. | 25526 | 15.9% | 25.5%(-9.58)#60 | 18.1%(-2.15)#9,706 |
| 61. | 25260 | 15.9% | 25.5%(-9.54)#61 | 18.1%(-2.12)#9,730 |
| 62. | 25420 | 16.0% | 25.5%(-9.50)#62 | 18.1%(-2.08)#9,746 |
| 63. | 25071 | 16.4% | 25.5%(-9.07)#63 | 18.1%(-1.65)#9,985 |
| 64. | 26170 | 16.6% | 25.5%(-8.90)#64 | 18.1%(-1.48)#10,072 |
| 65. | 26416 | 16.7% | 25.5%(-8.82)#65 | 18.1%(-1.40)#10,096 |
| 66. | 25070 | 16.7% | 25.5%(-8.82)#66 | 18.1%(-1.40)#10,111 |
| 67. | 26410 | 16.7% | 25.5%(-8.82)#67 | 18.1%(-1.40)#10,125 |
| 68. | 25162 | 17.2% | 25.5%(-8.24)#68 | 18.1%(-0.821)#10,370 |
| 69. | 25690 | 17.6% | 25.5%(-7.84)#69 | 18.1%(-0.416)#10,541 |
| 70. | 25404 | 17.8% | 25.5%(-7.67)#70 | 18.1%(-0.243)#10,626 |
| 71. | 26159 | 17.8% | 25.5%(-7.64)#71 | 18.1%(-0.220)#10,634 |
| 72. | 25555 | 18.1% | 25.5%(-7.36)#72 | 18.1%(+0.064)#10,770 |
| 73. | 26261 | 18.2% | 25.5%(-7.30)#73 | 18.1%(+0.119)#10,792 |
| 74. | 26175 | 18.8% | 25.5%(-6.74)#74 | 18.1%(+0.687)#11,056 |
| 75. | 26031 | 18.8% | 25.5%(-6.66)#75 | 18.1%(+0.761)#11,092 |
| 76. | 25882 | 19.0% | 25.5%(-6.44)#76 | 18.1%(+0.985)#11,182 |
| 77. | 25550 | 19.4% | 25.5%(-6.09)#77 | 18.1%(+1.34)#11,361 |
| 78. | 25871 | 19.8% | 25.5%(-5.73)#78 | 18.1%(+1.69)#11,514 |
| 79. | 26041 | 19.9% | 25.5%(-5.60)#79 | 18.1%(+1.83)#11,567 |
| 80. | 26062 | 20.1% | 25.5%(-5.38)#80 | 18.1%(+2.05)#11,701 |
| 81. | 25529 | 20.9% | 25.5%(-4.56)#81 | 18.1%(+2.87)#12,047 |
| 82. | 25438 | 21.0% | 25.5%(-4.44)#82 | 18.1%(+2.98)#12,089 |
| 83. | 26149 | 21.1% | 25.5%(-4.43)#83 | 18.1%(+2.99)#12,096 |
| 84. | 24901 | 21.5% | 25.5%(-4.02)#84 | 18.1%(+3.40)#12,272 |
| 85. | 26147 | 21.6% | 25.5%(-3.93)#85 | 18.1%(+3.49)#12,310 |
| 86. | 25045 | 21.7% | 25.5%(-3.75)#86 | 18.1%(+3.68)#12,374 |
| 87. | 24910 | 21.8% | 25.5%(-3.73)#87 | 18.1%(+3.69)#12,390 |
| 88. | 25510 | 21.8% | 25.5%(-3.71)#88 | 18.1%(+3.71)#12,397 |
| 89. | 25009 | 21.8% | 25.5%(-3.67)#89 | 18.1%(+3.76)#12,413 |
| 90. | 26704 | 22.1% | 25.5%(-3.41)#90 | 18.1%(+4.02)#12,510 |
| 91. | 25704 | 22.2% | 25.5%(-3.26)#91 | 18.1%(+4.16)#12,563 |
| 92. | 26033 | 22.2% | 25.5%(-3.26)#92 | 18.1%(+4.16)#12,573 |
| 93. | 26537 | 22.4% | 25.5%(-3.04)#93 | 18.1%(+4.38)#12,682 |
| 94. | 25523 | 22.5% | 25.5%(-3.03)#94 | 18.1%(+4.39)#12,688 |
| 95. | 26386 | 22.6% | 25.5%(-2.84)#95 | 18.1%(+4.58)#12,770 |
| 96. | 25024 | 23.1% | 25.5%(-2.41)#96 | 18.1%(+5.01)#12,941 |
| 97. | 25801 | 23.6% | 25.5%(-1.92)#97 | 18.1%(+5.50)#13,127 |
| 98. | 25504 | 23.8% | 25.5%(-1.69)#98 | 18.1%(+5.74)#13,224 |
| 99. | 26845 | 24.5% | 25.5%(-0.976)#99 | 18.1%(+6.45)#13,500 |
| 100. | 25901 | 24.6% | 25.5%(-0.876)#100 | 18.1%(+6.55)#13,531 |
Common Questions
What are the Top 10 Zip Codes with the Lowest Poverty Level Among Children Under the Age of 5 in West Virginia?
Top 10 Zip Codes with the Lowest Poverty Level Among Children Under the Age of 5 in West Virginia are:
What zip code has the Lowest Poverty Level Among Children Under the Age of 5 in West Virginia?
26571 has the Lowest Poverty Level Among Children Under the Age of 5 in West Virginia with 1.5%.
What is the Poverty Level Among Children Under the Age of 5 in the State of West Virginia?
Poverty Level Among Children Under the Age of 5 in West Virginia is 25.5%.
What is the Poverty Level Among Children Under the Age of 5 in the United States?
Poverty Level Among Children Under the Age of 5 in the United States is 18.1%.