Handley, WV Map & Demographics
Handley Map
Handley Overview
$20,887
PER CAPITA INCOME
$63,611
AVG HOUSEHOLD INCOME
9.8%
WAGE / INCOME GAP [ % ]
90.2¢/ $1
WAGE / INCOME GAP [ $ ]
0.25
INEQUALITY / GINI INDEX
412
TOTAL POPULATION
269
MALE POPULATION
143
FEMALE POPULATION
188.11
MALES / 100 FEMALES
53.16
FEMALES / 100 MALES
38.0
MEDIAN AGE
3.4
AVG FAMILY SIZE
3.4
AVG HOUSEHOLD SIZE
162
LABOR FORCE [ PEOPLE ]
52.4%
PERCENT IN LABOR FORCE
Handley Zip Codes
Handley Area Codes
Income in Handley
Income Overview in Handley
| Characteristic | Number | Measure |
| Per Capita Income | 412 | $20,887 |
| Median Family Income | 111 | $0 |
| Mean Family Income | 111 | $66,457 |
| Median Household Income | 122 | $63,611 |
| Mean Household Income | 122 | $71,940 |
| Income Deficit | 111 | $0 |
| Wage / Income Gap (%) | 412 | 9.81% |
| Wage / Income Gap ($) | 412 | 90.19¢ per $1 |
| Gini / Inequality Index | 412 | 0.25 |
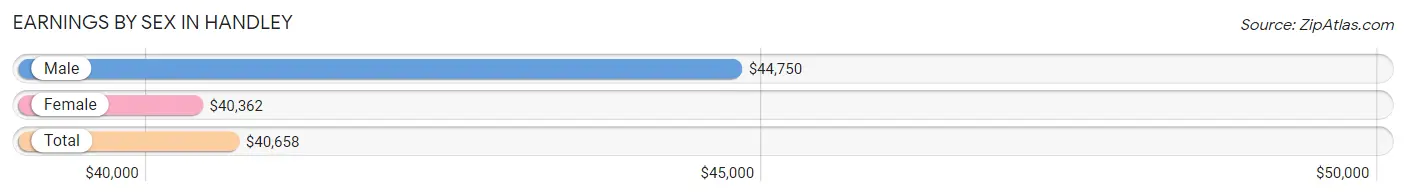
Earnings by Sex in Handley
Average Earnings in Handley are $40,658, $44,750 for men and $40,362 for women, a difference of 9.8%.
| Sex | Number | Average Earnings |
| Male | 97 (59.9%) | $44,750 |
| Female | 65 (40.1%) | $40,362 |
| Total | 162 (100.0%) | $40,658 |
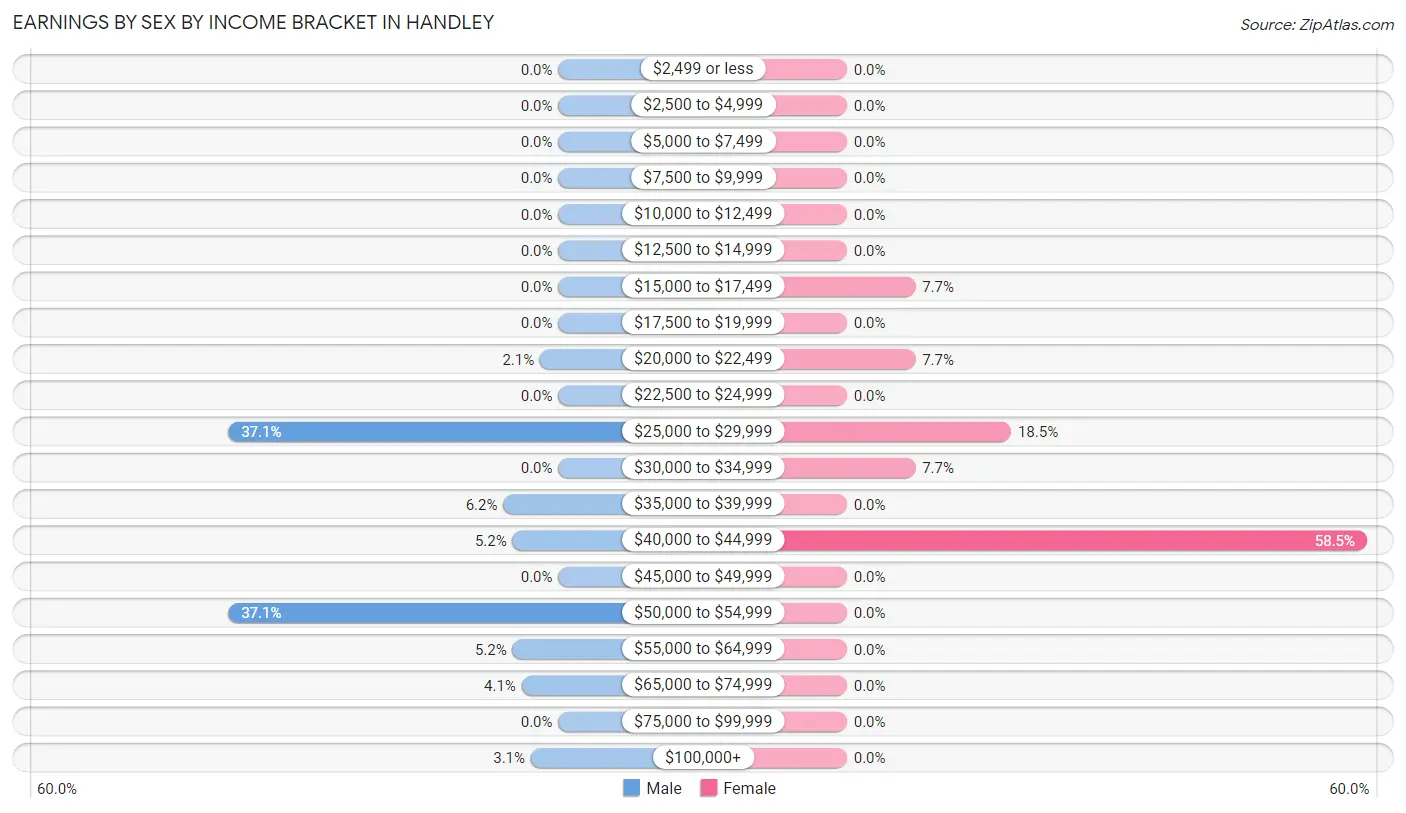
Earnings by Sex by Income Bracket in Handley
The most common earnings brackets in Handley are $25,000 to $29,999 for men (36 | 37.1%) and $40,000 to $44,999 for women (38 | 58.5%).
| Income | Male | Female |
| $2,499 or less | 0 (0.0%) | 0 (0.0%) |
| $2,500 to $4,999 | 0 (0.0%) | 0 (0.0%) |
| $5,000 to $7,499 | 0 (0.0%) | 0 (0.0%) |
| $7,500 to $9,999 | 0 (0.0%) | 0 (0.0%) |
| $10,000 to $12,499 | 0 (0.0%) | 0 (0.0%) |
| $12,500 to $14,999 | 0 (0.0%) | 0 (0.0%) |
| $15,000 to $17,499 | 0 (0.0%) | 5 (7.7%) |
| $17,500 to $19,999 | 0 (0.0%) | 0 (0.0%) |
| $20,000 to $22,499 | 2 (2.1%) | 5 (7.7%) |
| $22,500 to $24,999 | 0 (0.0%) | 0 (0.0%) |
| $25,000 to $29,999 | 36 (37.1%) | 12 (18.5%) |
| $30,000 to $34,999 | 0 (0.0%) | 5 (7.7%) |
| $35,000 to $39,999 | 6 (6.2%) | 0 (0.0%) |
| $40,000 to $44,999 | 5 (5.1%) | 38 (58.5%) |
| $45,000 to $49,999 | 0 (0.0%) | 0 (0.0%) |
| $50,000 to $54,999 | 36 (37.1%) | 0 (0.0%) |
| $55,000 to $64,999 | 5 (5.1%) | 0 (0.0%) |
| $65,000 to $74,999 | 4 (4.1%) | 0 (0.0%) |
| $75,000 to $99,999 | 0 (0.0%) | 0 (0.0%) |
| $100,000+ | 3 (3.1%) | 0 (0.0%) |
| Total | 97 (100.0%) | 65 (100.0%) |
Earnings by Sex by Educational Attainment in Handley
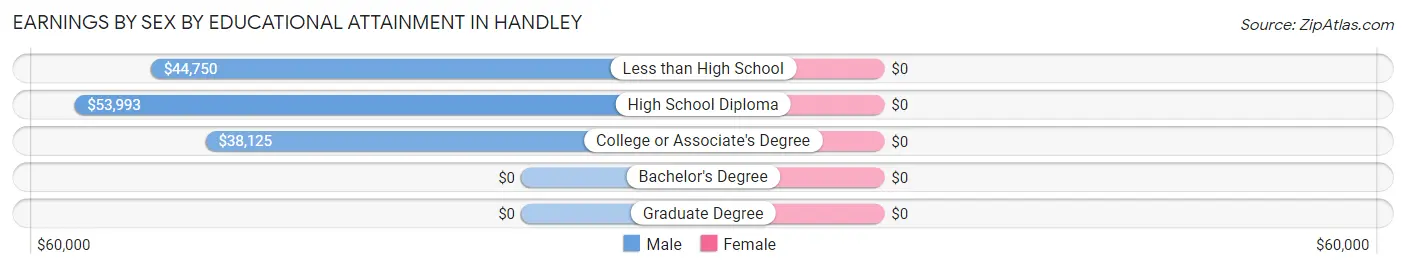
| Educational Attainment | Male Income | Female Income |
| Less than High School | $44,750 | $0 |
| High School Diploma | $53,993 | $0 |
| College or Associate's Degree | $38,125 | $0 |
| Bachelor's Degree | - | - |
| Graduate Degree | - | - |
| Total | $53,646 | $40,757 |
Family Income in Handley
Family Income Brackets in Handley
According to the Handley family income data, there are 42 families falling into the $75,000 to $99,999 income range, which is the most common income bracket and makes up 37.8% of all families.
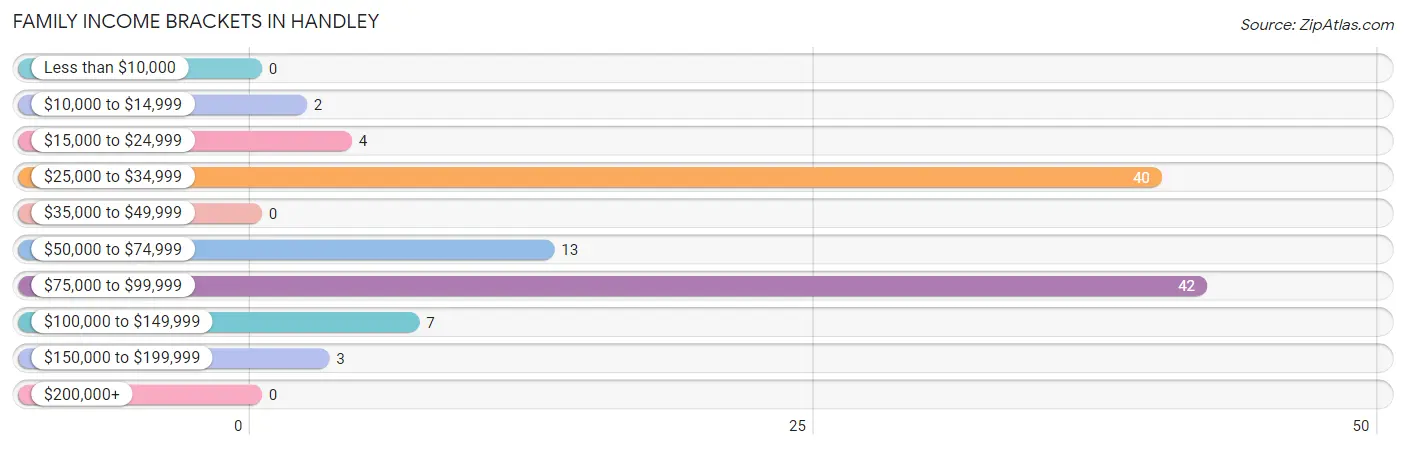
| Income Bracket | # Families | % Families |
| Less than $10,000 | 0 | 0.0% |
| $10,000 to $14,999 | 2 | 1.8% |
| $15,000 to $24,999 | 4 | 3.6% |
| $25,000 to $34,999 | 40 | 36.0% |
| $35,000 to $49,999 | 0 | 0.0% |
| $50,000 to $74,999 | 13 | 11.7% |
| $75,000 to $99,999 | 42 | 37.8% |
| $100,000 to $149,999 | 7 | 6.3% |
| $150,000 to $199,999 | 3 | 2.7% |
| $200,000+ | 0 | 0.0% |
Family Income by Famaliy Size in Handley
2-person families (22 | 19.8%) account for the highest median family income in Handley with $64,167 per family, while 2-person families (22 | 19.8%) have the highest median income of $32,084 per family member.
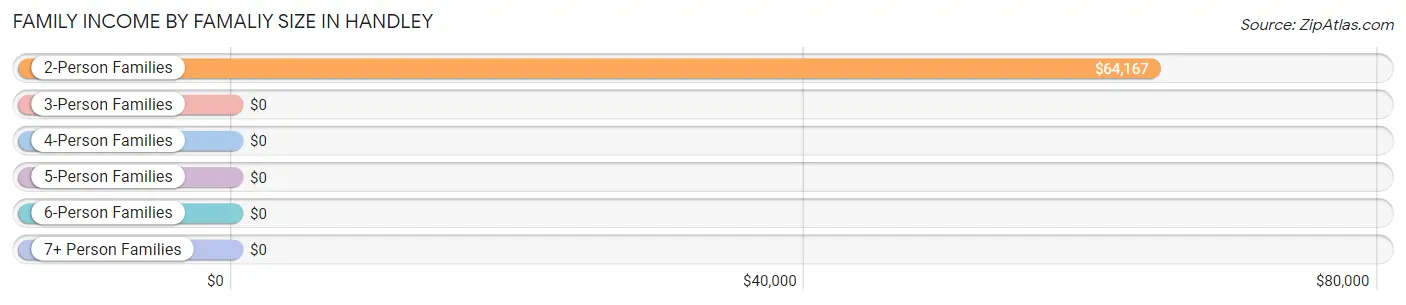
| Income Bracket | # Families | Median Income |
| 2-Person Families | 22 (19.8%) | $64,167 |
| 3-Person Families | 76 (68.5%) | $0 |
| 4-Person Families | 8 (7.2%) | $0 |
| 5-Person Families | 5 (4.5%) | $0 |
| 6-Person Families | 0 (0.0%) | $0 |
| 7+ Person Families | 0 (0.0%) | $0 |
| Total | 111 (100.0%) | $0 |
Family Income by Number of Earners in Handley
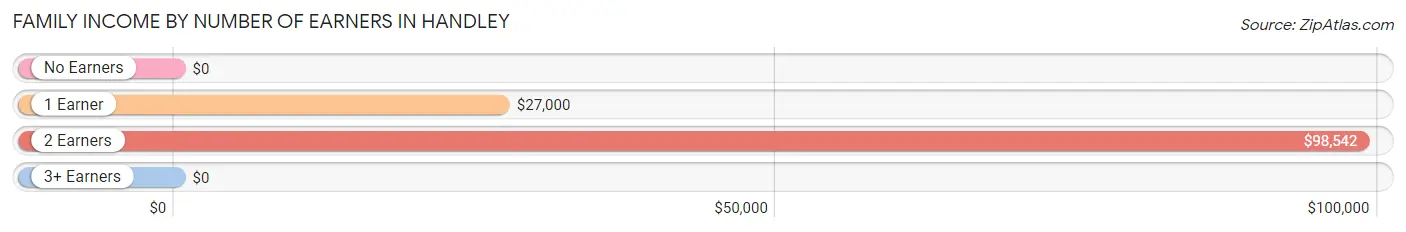
| Number of Earners | # Families | Median Income |
| No Earners | 13 (11.7%) | $0 |
| 1 Earner | 56 (50.4%) | $27,000 |
| 2 Earners | 42 (37.8%) | $98,542 |
| 3+ Earners | 0 (0.0%) | $0 |
| Total | 111 (100.0%) | $0 |
Household Income in Handley
Household Income Brackets in Handley
With 47 households falling in the category, the $50,000 to $74,999 income range is the most frequent in Handley, accounting for 38.5% of all households.
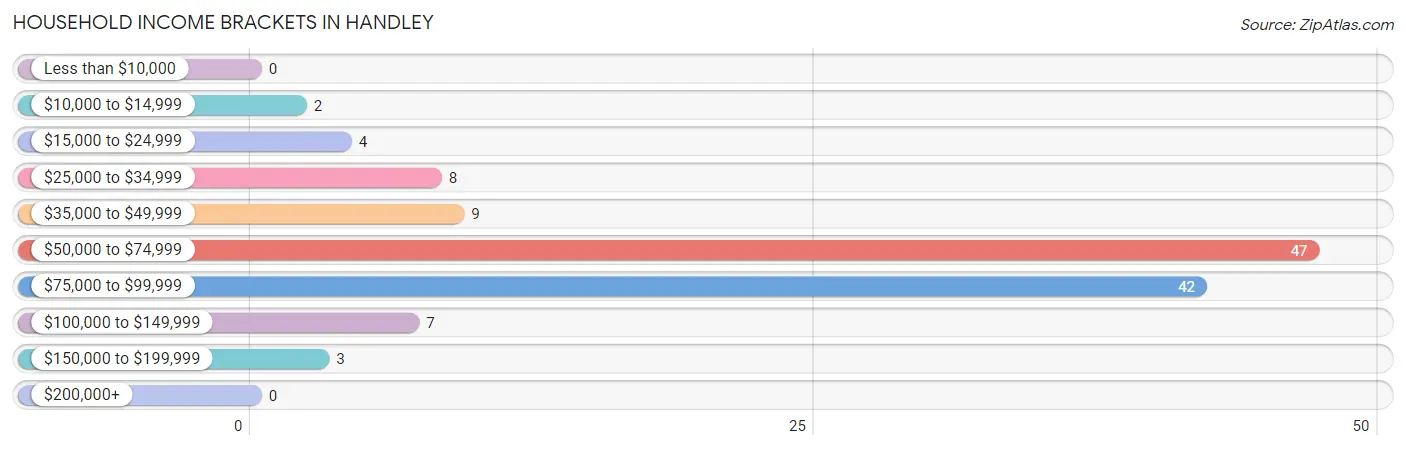
| Income Bracket | # Households | % Households |
| Less than $10,000 | 0 | 0.0% |
| $10,000 to $14,999 | 2 | 1.6% |
| $15,000 to $24,999 | 4 | 3.3% |
| $25,000 to $34,999 | 8 | 6.6% |
| $35,000 to $49,999 | 9 | 7.4% |
| $50,000 to $74,999 | 47 | 38.5% |
| $75,000 to $99,999 | 42 | 34.4% |
| $100,000 to $149,999 | 7 | 5.7% |
| $150,000 to $199,999 | 3 | 2.5% |
| $200,000+ | 0 | 0.0% |
Household Income by Householder Age in Handley
The median household income in Handley is $63,611, with the highest median household income of $98,472 found in the 65+ years age bracket for the primary householder. A total of 64 households (52.5%) fall into this category. Meanwhile, the 15 to 24 years age bracket for the primary householder has the lowest median household income of $0, with 34 households (27.9%) in this group.
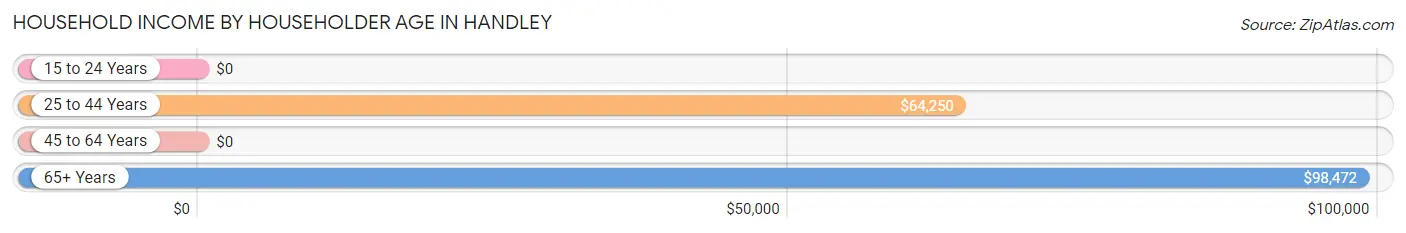
| Income Bracket | # Households | Median Income |
| 15 to 24 Years | 34 (27.9%) | $0 |
| 25 to 44 Years | 21 (17.2%) | $64,250 |
| 45 to 64 Years | 3 (2.5%) | $0 |
| 65+ Years | 64 (52.5%) | $98,472 |
| Total | 122 (100.0%) | $63,611 |
Poverty in Handley
Income Below Poverty by Sex and Age in Handley
With 8.6% poverty level for males and 16.8% for females among the residents of Handley, 12 to 14 year old males and 45 to 54 year old females are the most vulnerable to poverty, with 5 males (45.5%) and 6 females (100.0%) in their respective age groups living below the poverty level.
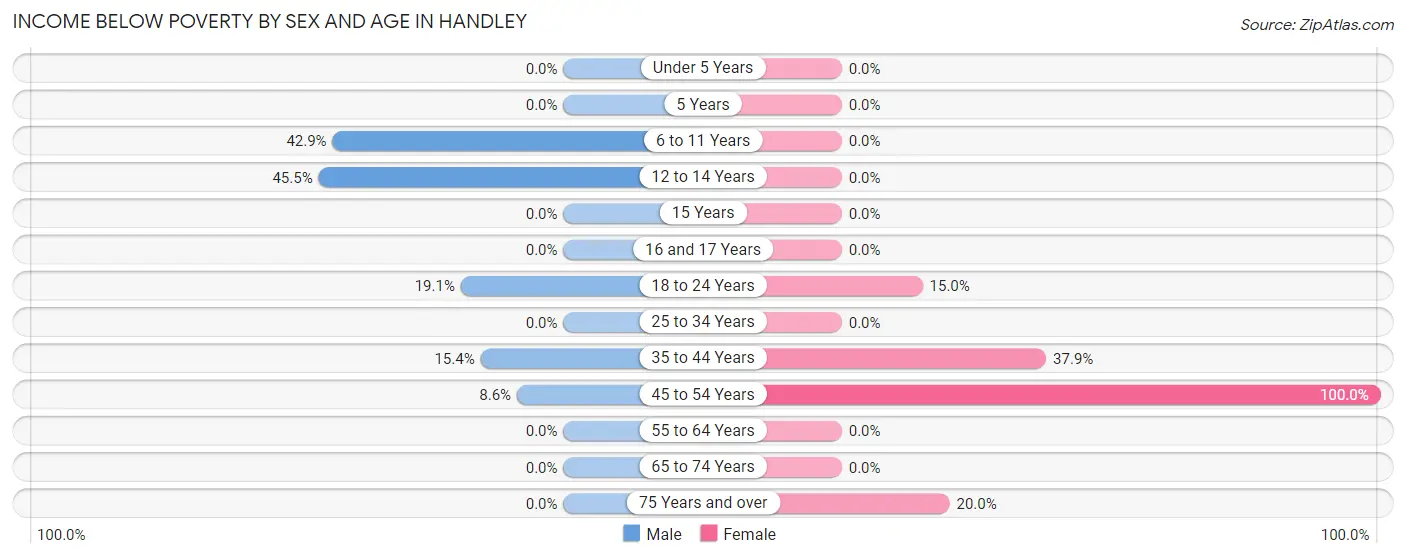
| Age Bracket | Male | Female |
| Under 5 Years | 0 (0.0%) | 0 (0.0%) |
| 5 Years | 0 (0.0%) | 0 (0.0%) |
| 6 to 11 Years | 3 (42.9%) | 0 (0.0%) |
| 12 to 14 Years | 5 (45.5%) | 0 (0.0%) |
| 15 Years | 0 (0.0%) | 0 (0.0%) |
| 16 and 17 Years | 0 (0.0%) | 0 (0.0%) |
| 18 to 24 Years | 8 (19.1%) | 3 (15.0%) |
| 25 to 34 Years | 0 (0.0%) | 0 (0.0%) |
| 35 to 44 Years | 2 (15.4%) | 11 (37.9%) |
| 45 to 54 Years | 5 (8.6%) | 6 (100.0%) |
| 55 to 64 Years | 0 (0.0%) | 0 (0.0%) |
| 65 to 74 Years | 0 (0.0%) | 0 (0.0%) |
| 75 Years and over | 0 (0.0%) | 4 (20.0%) |
| Total | 23 (8.6%) | 24 (16.8%) |
Income Above Poverty by Sex and Age in Handley
According to the poverty statistics in Handley, males aged under 5 years and females aged 25 to 34 years are the age groups that are most secure financially, with 100.0% of males and 100.0% of females in these age groups living above the poverty line.
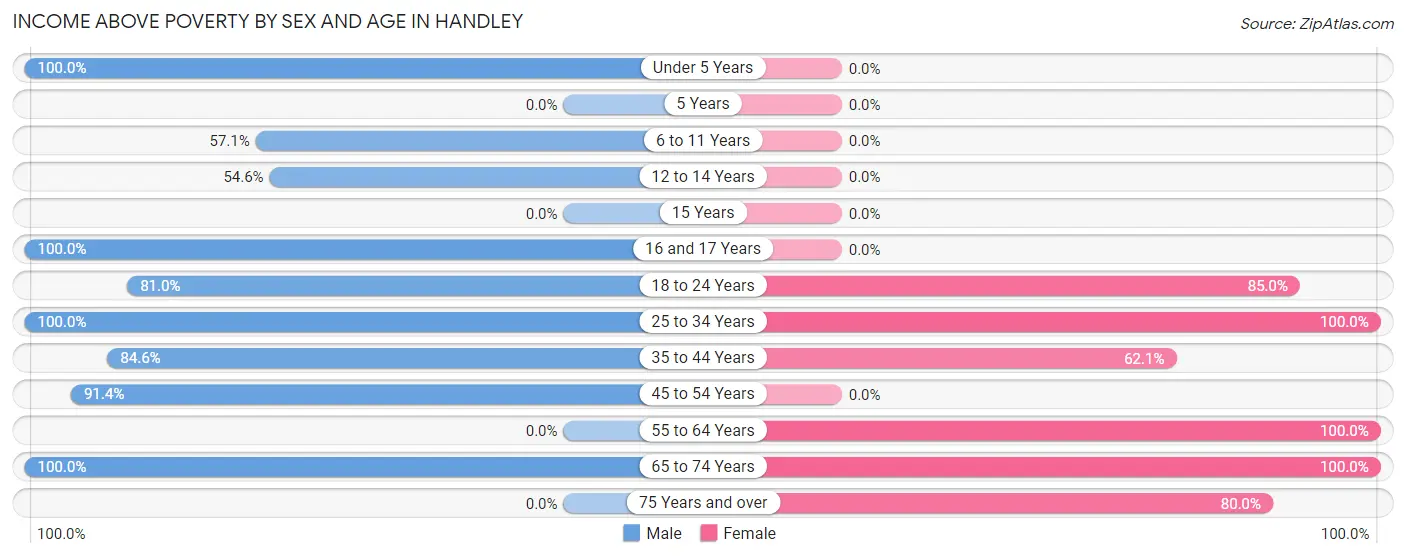
| Age Bracket | Male | Female |
| Under 5 Years | 85 (100.0%) | 0 (0.0%) |
| 5 Years | 0 (0.0%) | 0 (0.0%) |
| 6 to 11 Years | 4 (57.1%) | 0 (0.0%) |
| 12 to 14 Years | 6 (54.5%) | 0 (0.0%) |
| 15 Years | 0 (0.0%) | 0 (0.0%) |
| 16 and 17 Years | 2 (100.0%) | 0 (0.0%) |
| 18 to 24 Years | 34 (80.9%) | 17 (85.0%) |
| 25 to 34 Years | 11 (100.0%) | 5 (100.0%) |
| 35 to 44 Years | 11 (84.6%) | 18 (62.1%) |
| 45 to 54 Years | 53 (91.4%) | 0 (0.0%) |
| 55 to 64 Years | 0 (0.0%) | 47 (100.0%) |
| 65 to 74 Years | 40 (100.0%) | 16 (100.0%) |
| 75 Years and over | 0 (0.0%) | 16 (80.0%) |
| Total | 246 (91.4%) | 119 (83.2%) |
Income Below Poverty Among Married-Couple Families in Handley
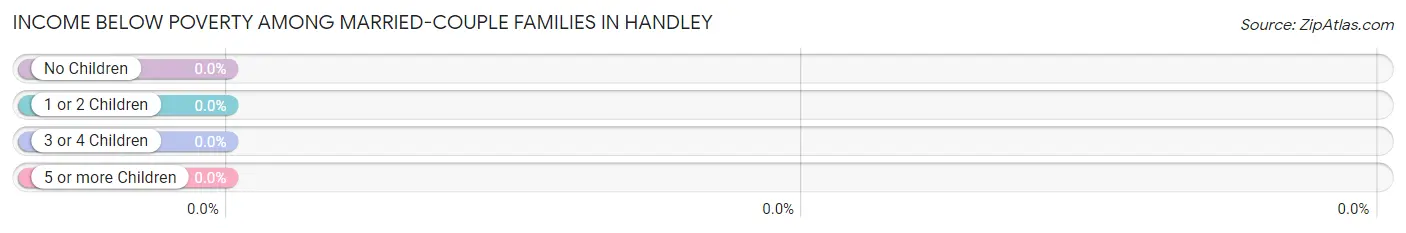
| Children | Above Poverty | Below Poverty |
| No Children | 44 (100.0%) | 0 (0.0%) |
| 1 or 2 Children | 9 (100.0%) | 0 (0.0%) |
| 3 or 4 Children | 0 (0.0%) | 0 (0.0%) |
| 5 or more Children | 0 (0.0%) | 0 (0.0%) |
| Total | 53 (100.0%) | 0 (0.0%) |
Income Below Poverty Among Single-Parent Households in Handley
According to the poverty data in Handley, 5.3% or 2 single-father households and 45.0% or 9 single-mother households are living below the poverty line. Among single-father households, those with 1 or 2 children have the highest poverty rate, with 2 households (5.4%) experiencing poverty. Likewise, among single-mother households, those with 1 or 2 children have the highest poverty rate, with 5 households (100.0%) falling below the poverty line.
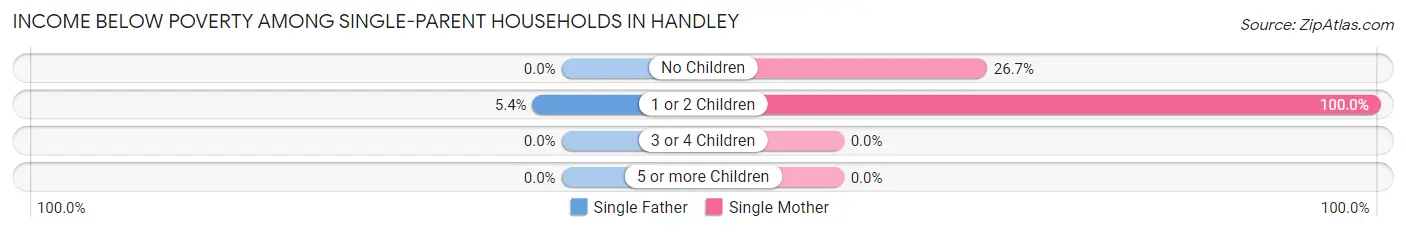
| Children | Single Father | Single Mother |
| No Children | 0 (0.0%) | 4 (26.7%) |
| 1 or 2 Children | 2 (5.4%) | 5 (100.0%) |
| 3 or 4 Children | 0 (0.0%) | 0 (0.0%) |
| 5 or more Children | 0 (0.0%) | 0 (0.0%) |
| Total | 2 (5.3%) | 9 (45.0%) |
Income Below Poverty Among Married-Couple vs Single-Parent Households in Handley
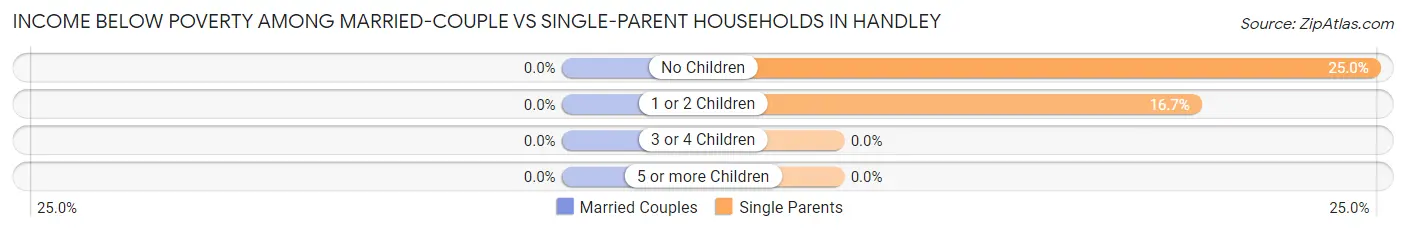
| Children | Married-Couple Families | Single-Parent Households |
| No Children | 0 (0.0%) | 4 (25.0%) |
| 1 or 2 Children | 0 (0.0%) | 7 (16.7%) |
| 3 or 4 Children | 0 (0.0%) | 0 (0.0%) |
| 5 or more Children | 0 (0.0%) | 0 (0.0%) |
| Total | 0 (0.0%) | 11 (19.0%) |
Race in Handley
The most populous races in Handley are White / Caucasian (407 | 98.8%), and Black / African American (5 | 1.2%).
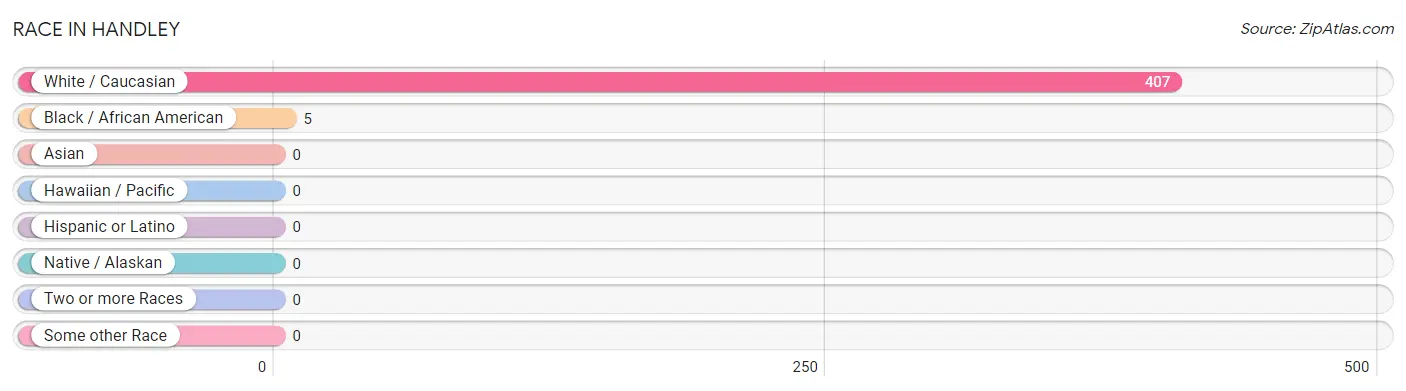
| Race | # Population | % Population |
| Asian | 0 | 0.0% |
| Black / African American | 5 | 1.2% |
| Hawaiian / Pacific | 0 | 0.0% |
| Hispanic or Latino | 0 | 0.0% |
| Native / Alaskan | 0 | 0.0% |
| White / Caucasian | 407 | 98.8% |
| Two or more Races | 0 | 0.0% |
| Some other Race | 0 | 0.0% |
| Total | 412 | 100.0% |
Ancestry in Handley
The most populous ancestries reported in Handley are American (78 | 18.9%), English (55 | 13.4%), Italian (22 | 5.3%), German (12 | 2.9%), and Irish (10 | 2.4%), together accounting for 43.0% of all Handley residents.
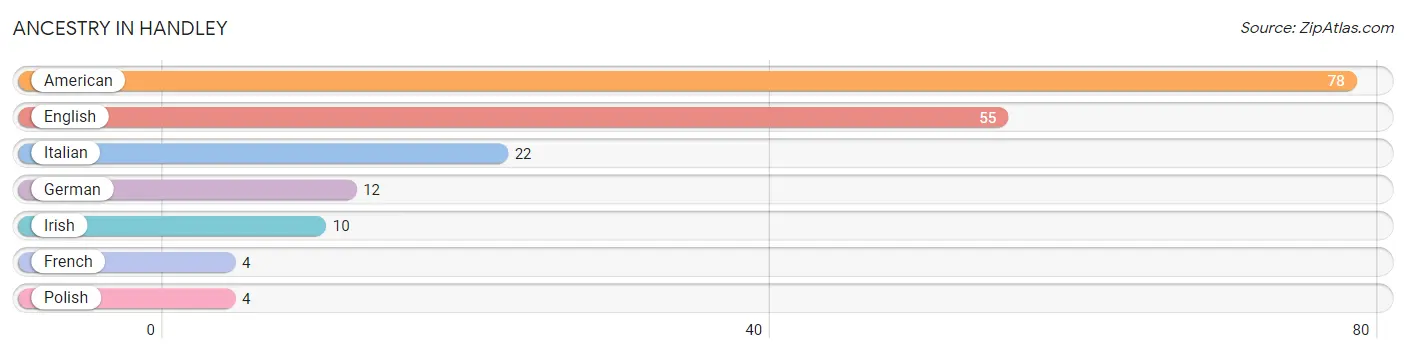
| Ancestry | # Population | % Population |
| American | 78 | 18.9% |
| English | 55 | 13.4% |
| French | 4 | 1.0% |
| German | 12 | 2.9% |
| Irish | 10 | 2.4% |
| Italian | 22 | 5.3% |
| Polish | 4 | 1.0% | View All 7 Rows |
Immigrants in Handley

| Immigration Origin | # Population | % Population | View All 0 Rows |
Sex and Age in Handley
Sex and Age in Handley
The most populous age groups in Handley are Under 5 Years (85 | 31.6%) for men and 60 to 64 Years (38 | 26.6%) for women.
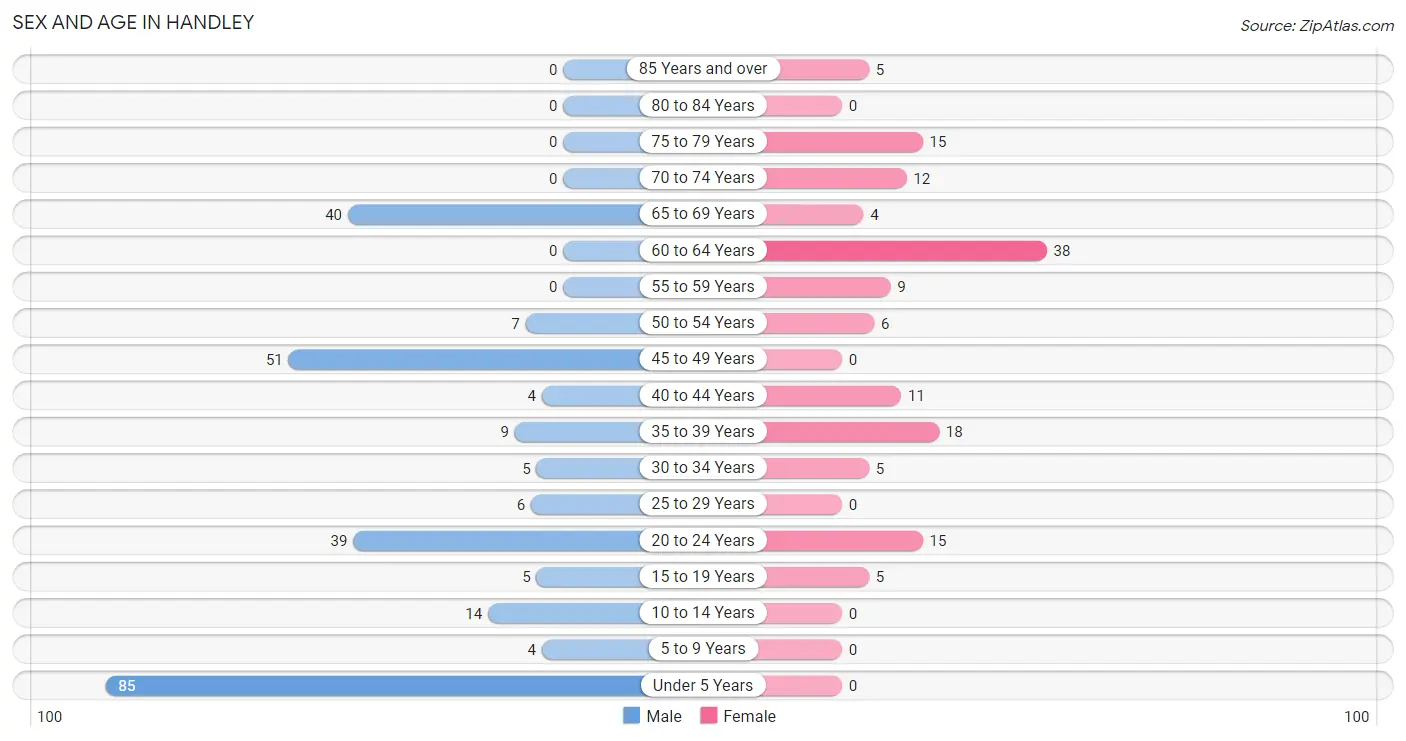
| Age Bracket | Male | Female |
| Under 5 Years | 85 (31.6%) | 0 (0.0%) |
| 5 to 9 Years | 4 (1.5%) | 0 (0.0%) |
| 10 to 14 Years | 14 (5.2%) | 0 (0.0%) |
| 15 to 19 Years | 5 (1.9%) | 5 (3.5%) |
| 20 to 24 Years | 39 (14.5%) | 15 (10.5%) |
| 25 to 29 Years | 6 (2.2%) | 0 (0.0%) |
| 30 to 34 Years | 5 (1.9%) | 5 (3.5%) |
| 35 to 39 Years | 9 (3.4%) | 18 (12.6%) |
| 40 to 44 Years | 4 (1.5%) | 11 (7.7%) |
| 45 to 49 Years | 51 (19.0%) | 0 (0.0%) |
| 50 to 54 Years | 7 (2.6%) | 6 (4.2%) |
| 55 to 59 Years | 0 (0.0%) | 9 (6.3%) |
| 60 to 64 Years | 0 (0.0%) | 38 (26.6%) |
| 65 to 69 Years | 40 (14.9%) | 4 (2.8%) |
| 70 to 74 Years | 0 (0.0%) | 12 (8.4%) |
| 75 to 79 Years | 0 (0.0%) | 15 (10.5%) |
| 80 to 84 Years | 0 (0.0%) | 0 (0.0%) |
| 85 Years and over | 0 (0.0%) | 5 (3.5%) |
| Total | 269 (100.0%) | 143 (100.0%) |
Families and Households in Handley
Median Family Size in Handley
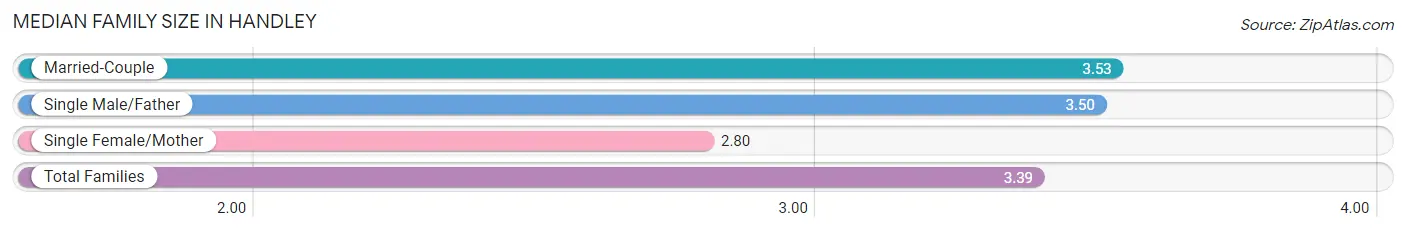
The median family size in Handley is 3.39 persons per family, with married-couple families (53 | 47.7%) accounting for the largest median family size of 3.53 persons per family. On the other hand, single female/mother families (20 | 18.0%) represent the smallest median family size with 2.80 persons per family.
| Family Type | # Families | Family Size |
| Married-Couple | 53 (47.7%) | 3.53 |
| Single Male/Father | 38 (34.2%) | 3.50 |
| Single Female/Mother | 20 (18.0%) | 2.80 |
| Total Families | 111 (100.0%) | 3.39 |
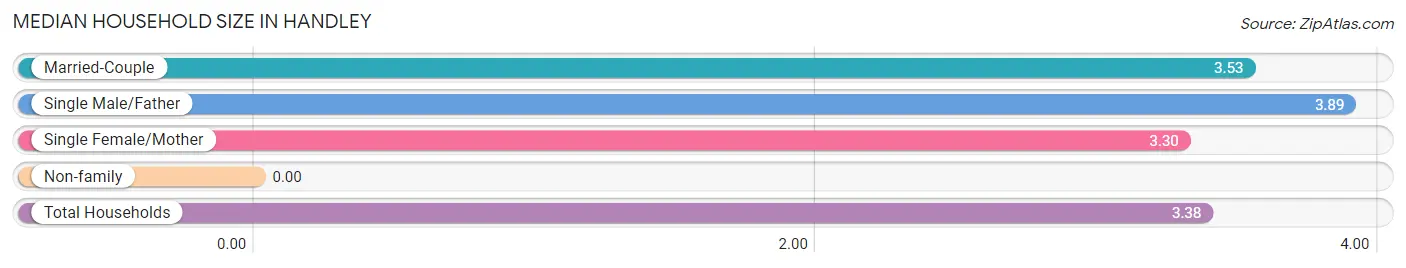
Median Household Size in Handley
| Household Type | # Households | Household Size |
| Married-Couple | 53 (43.4%) | 3.53 |
| Single Male/Father | 38 (31.1%) | 3.89 |
| Single Female/Mother | 20 (16.4%) | 3.30 |
| Non-family | 11 (9.0%) | - |
| Total Households | 122 (100.0%) | 3.38 |
Household Size by Marriage Status in Handley
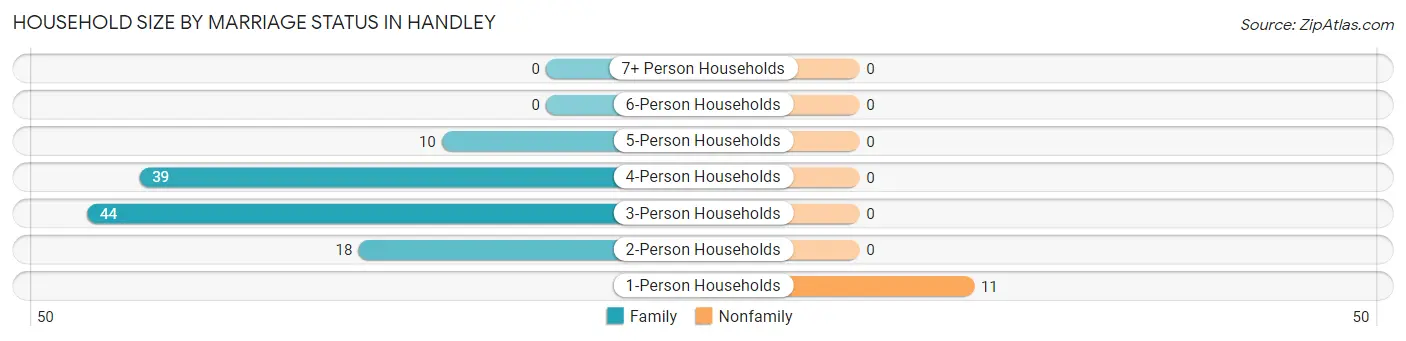
Out of a total of 122 households in Handley, 111 (91.0%) are family households, while 11 (9.0%) are nonfamily households. The most numerous type of family households are 3-person households, comprising 44, and the most common type of nonfamily households are 1-person households, comprising 11.
| Household Size | Family Households | Nonfamily Households |
| 1-Person Households | - | 11 (9.0%) |
| 2-Person Households | 18 (14.7%) | 0 (0.0%) |
| 3-Person Households | 44 (36.1%) | 0 (0.0%) |
| 4-Person Households | 39 (32.0%) | 0 (0.0%) |
| 5-Person Households | 10 (8.2%) | 0 (0.0%) |
| 6-Person Households | 0 (0.0%) | 0 (0.0%) |
| 7+ Person Households | 0 (0.0%) | 0 (0.0%) |
| Total | 111 (91.0%) | 11 (9.0%) |
Female Fertility in Handley
Fertility by Age in Handley
| Age Bracket | Women with Births | Births / 1,000 Women |
| 15 to 19 years | 0 (0.0%) | 0.0 |
| 20 to 34 years | 0 (0.0%) | 0.0 |
| 35 to 50 years | 0 (0.0%) | 0.0 |
| Total | 0 (0.0%) | 0.0 |
Fertility by Age by Marriage Status in Handley
| Age Bracket | Married | Unmarried |
| 15 to 19 years | 0 (0.0%) | 0 (0.0%) |
| 20 to 34 years | 0 (0.0%) | 0 (0.0%) |
| 35 to 50 years | 0 (0.0%) | 0 (0.0%) |
| Total | 0 (0.0%) | 0 (0.0%) |
Fertility by Education in Handley
| Educational Attainment | Women with Births | Births / 1,000 Women |
| Less than High School | 0 (0.0%) | 0.0 |
| High School Diploma | 0 (0.0%) | 0.0 |
| College or Associate's Degree | 0 (0.0%) | 0.0 |
| Bachelor's Degree | 0 (0.0%) | 0.0 |
| Graduate Degree | 0 (0.0%) | 0.0 |
| Total | 0 (0.0%) | 0.0 |
Fertility by Education by Marriage Status in Handley
| Educational Attainment | Married | Unmarried |
| Less than High School | 0 (0.0%) | 0 (0.0%) |
| High School Diploma | 0 (0.0%) | 0 (0.0%) |
| College or Associate's Degree | 0 (0.0%) | 0 (0.0%) |
| Bachelor's Degree | 0 (0.0%) | 0 (0.0%) |
| Graduate Degree | 0 (0.0%) | 0 (0.0%) |
| Total | 0 (0.0%) | 0 (0.0%) |
Employment Characteristics in Handley
Employment by Class of Employer in Handley
Among the 162 employed individuals in Handley, private company employees (121 | 74.7%), local government employees (36 | 22.2%), and self-employed (incorporated) (4 | 2.5%) make up the most common classes of employment.
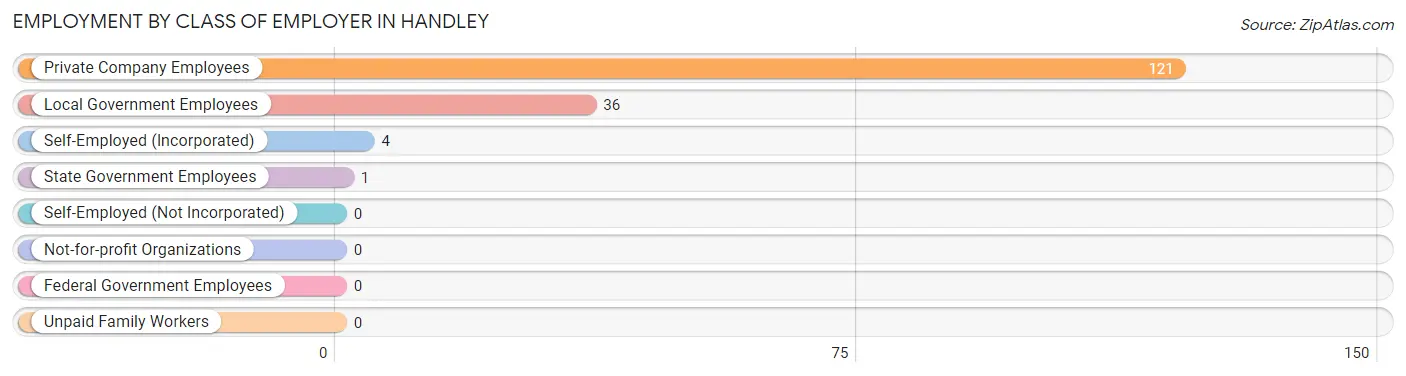
| Employer Class | # Employees | % Employees |
| Private Company Employees | 121 | 74.7% |
| Self-Employed (Incorporated) | 4 | 2.5% |
| Self-Employed (Not Incorporated) | 0 | 0.0% |
| Not-for-profit Organizations | 0 | 0.0% |
| Local Government Employees | 36 | 22.2% |
| State Government Employees | 1 | 0.6% |
| Federal Government Employees | 0 | 0.0% |
| Unpaid Family Workers | 0 | 0.0% |
| Total | 162 | 100.0% |
Employment Status by Age in Handley
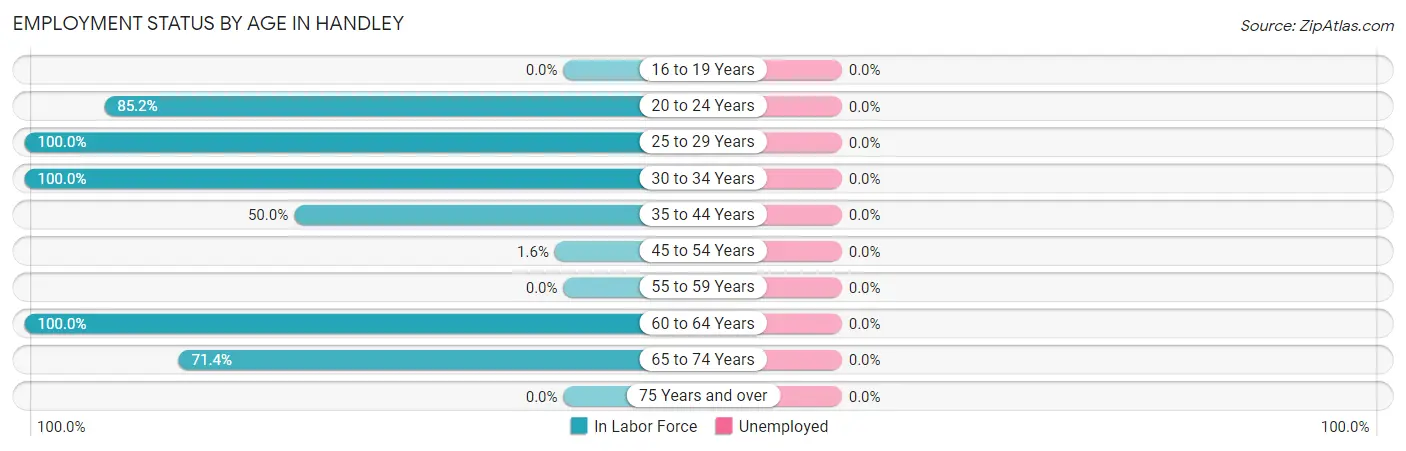
| Age Bracket | In Labor Force | Unemployed |
| 16 to 19 Years | 0 (0.0%) | 0 (0.0%) |
| 20 to 24 Years | 46 (85.2%) | 0 (0.0%) |
| 25 to 29 Years | 6 (100.0%) | 0 (0.0%) |
| 30 to 34 Years | 10 (100.0%) | 0 (0.0%) |
| 35 to 44 Years | 21 (50.0%) | 0 (0.0%) |
| 45 to 54 Years | 1 (1.6%) | 0 (0.0%) |
| 55 to 59 Years | 0 (0.0%) | 0 (0.0%) |
| 60 to 64 Years | 38 (100.0%) | 0 (0.0%) |
| 65 to 74 Years | 40 (71.4%) | 0 (0.0%) |
| 75 Years and over | 0 (0.0%) | 0 (0.0%) |
| Total | 162 (52.4%) | 0 (0.0%) |
Employment Status by Educational Attainment in Handley
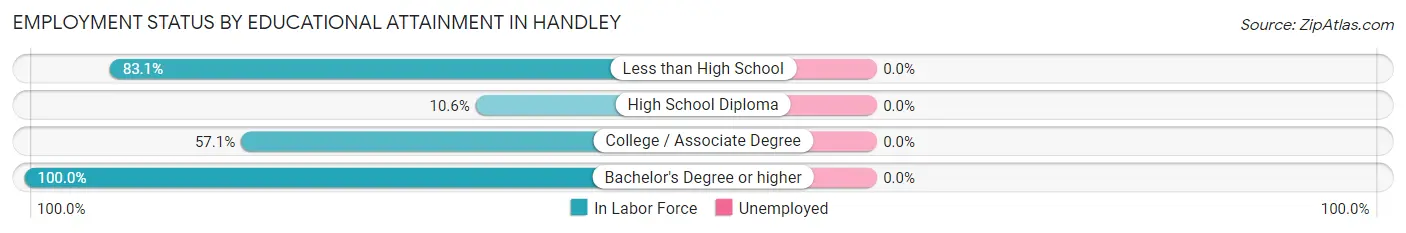
| Educational Attainment | In Labor Force | Unemployed |
| Less than High School | 54 (83.1%) | 0 (0.0%) |
| High School Diploma | 9 (10.6%) | 0 (0.0%) |
| College / Associate Degree | 8 (57.1%) | 0 (0.0%) |
| Bachelor's Degree or higher | 5 (100.0%) | 0 (0.0%) |
| Total | 76 (45.0%) | 0 (0.0%) |
Employment Occupations by Sex in Handley
Management, Business, Science and Arts Occupations
The most common Management, Business, Science and Arts occupations in Handley are , and Management (7 | 4.3%).
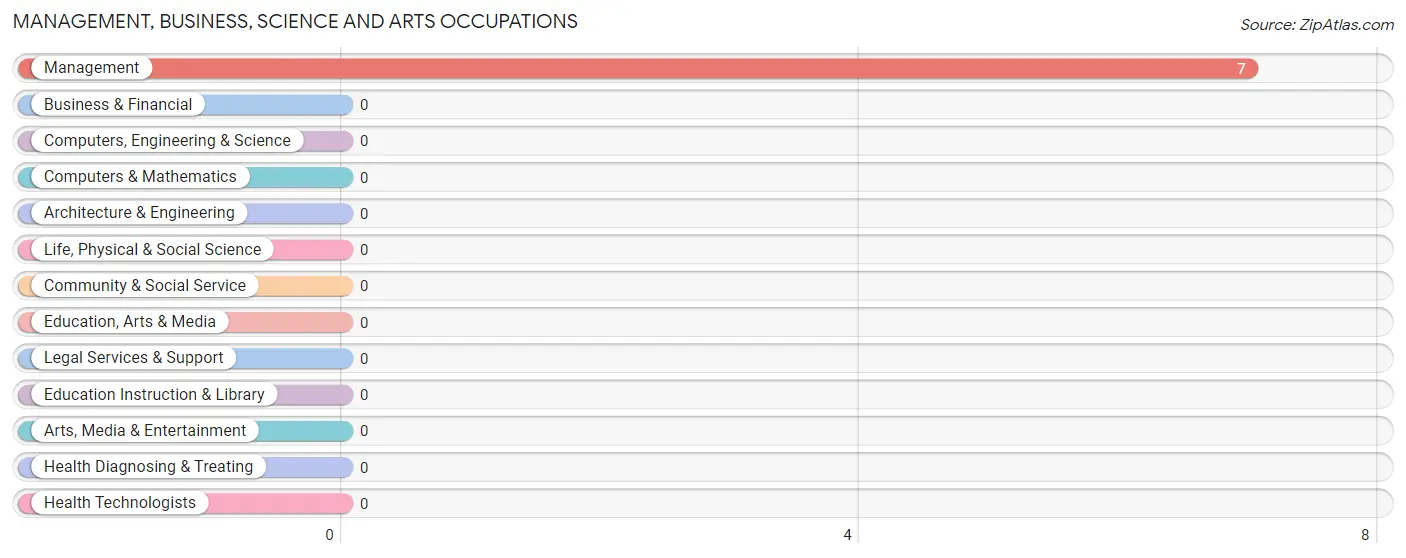
Management, Business, Science and Arts Occupations by Sex
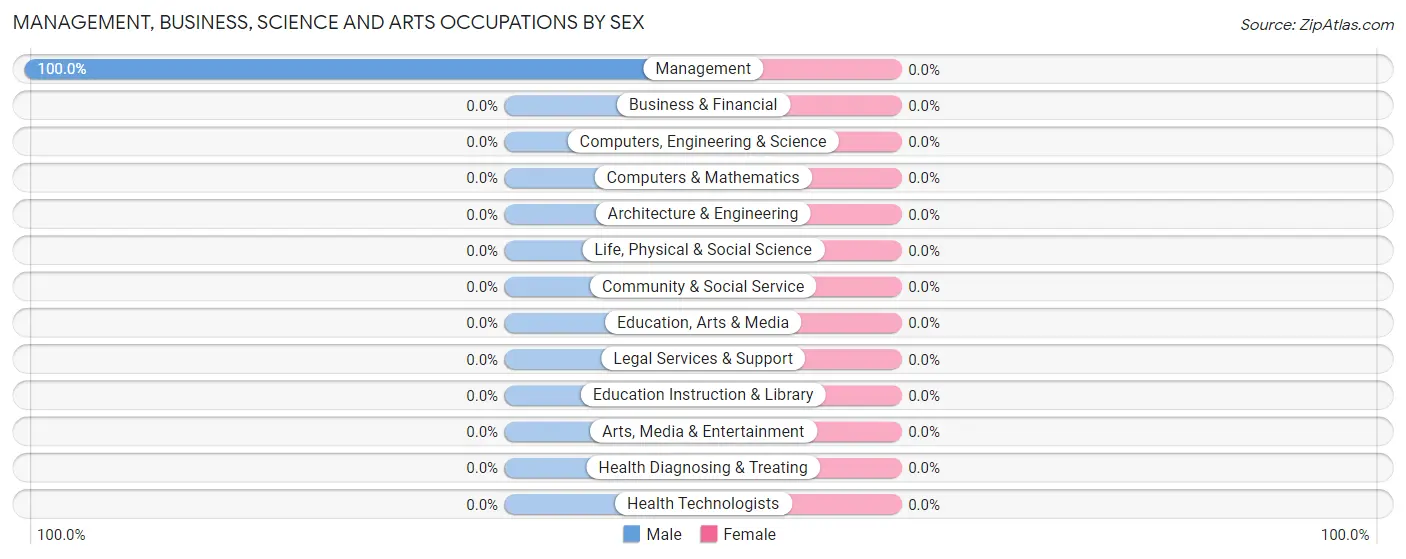
| Occupation | Male | Female |
| Management | 7 (100.0%) | 0 (0.0%) |
| Business & Financial | 0 (0.0%) | 0 (0.0%) |
| Computers, Engineering & Science | 0 (0.0%) | 0 (0.0%) |
| Computers & Mathematics | 0 (0.0%) | 0 (0.0%) |
| Architecture & Engineering | 0 (0.0%) | 0 (0.0%) |
| Life, Physical & Social Science | 0 (0.0%) | 0 (0.0%) |
| Community & Social Service | 0 (0.0%) | 0 (0.0%) |
| Education, Arts & Media | 0 (0.0%) | 0 (0.0%) |
| Legal Services & Support | 0 (0.0%) | 0 (0.0%) |
| Education Instruction & Library | 0 (0.0%) | 0 (0.0%) |
| Arts, Media & Entertainment | 0 (0.0%) | 0 (0.0%) |
| Health Diagnosing & Treating | 0 (0.0%) | 0 (0.0%) |
| Health Technologists | 0 (0.0%) | 0 (0.0%) |
| Total (Category) | 7 (100.0%) | 0 (0.0%) |
| Total (Overall) | 97 (59.9%) | 65 (40.1%) |
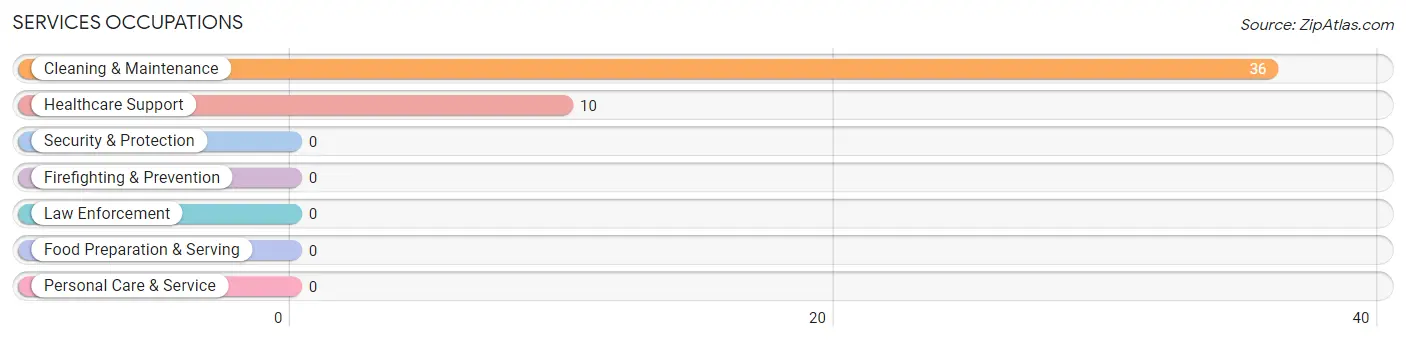
Services Occupations
The most common Services occupations in Handley are Cleaning & Maintenance (36 | 22.2%), and Healthcare Support (10 | 6.2%).
Services Occupations by Sex
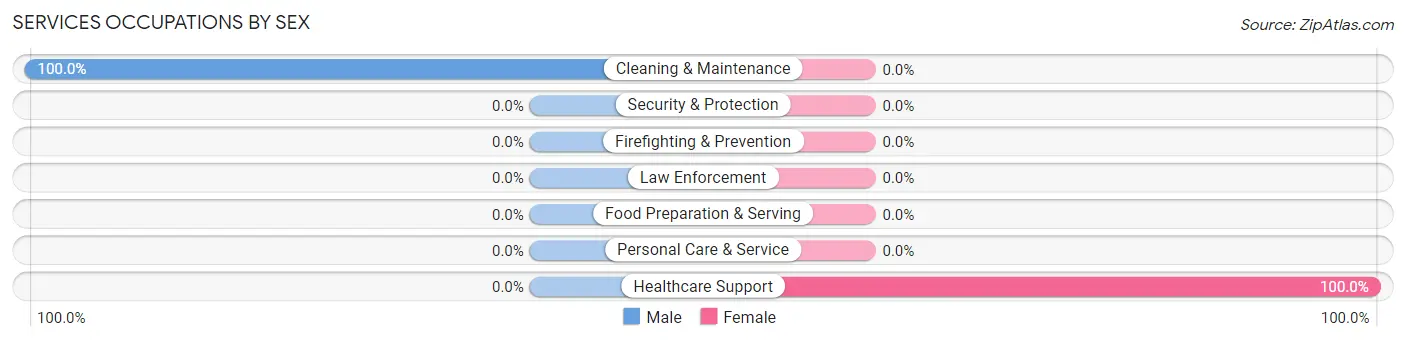
| Occupation | Male | Female |
| Healthcare Support | 0 (0.0%) | 10 (100.0%) |
| Security & Protection | 0 (0.0%) | 0 (0.0%) |
| Firefighting & Prevention | 0 (0.0%) | 0 (0.0%) |
| Law Enforcement | 0 (0.0%) | 0 (0.0%) |
| Food Preparation & Serving | 0 (0.0%) | 0 (0.0%) |
| Cleaning & Maintenance | 36 (100.0%) | 0 (0.0%) |
| Personal Care & Service | 0 (0.0%) | 0 (0.0%) |
| Total (Category) | 36 (78.3%) | 10 (21.7%) |
| Total (Overall) | 97 (59.9%) | 65 (40.1%) |
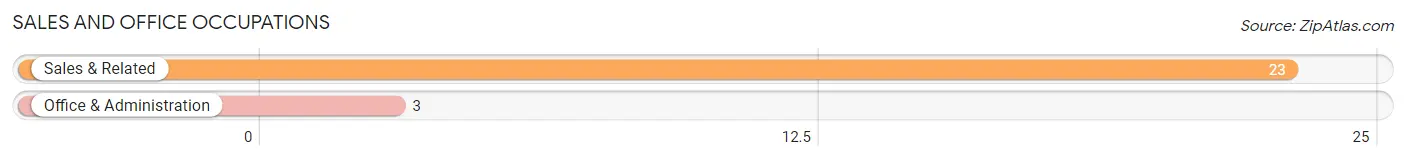
Sales and Office Occupations
The most common Sales and Office occupations in Handley are Sales & Related (23 | 14.2%), and Office & Administration (3 | 1.8%).
Sales and Office Occupations by Sex

| Occupation | Male | Female |
| Sales & Related | 6 (26.1%) | 17 (73.9%) |
| Office & Administration | 3 (100.0%) | 0 (0.0%) |
| Total (Category) | 9 (34.6%) | 17 (65.4%) |
| Total (Overall) | 97 (59.9%) | 65 (40.1%) |
Natural Resources, Construction and Maintenance Occupations
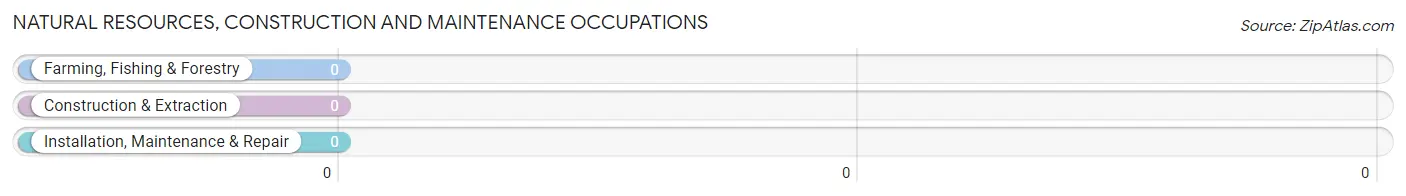
Natural Resources, Construction and Maintenance Occupations by Sex
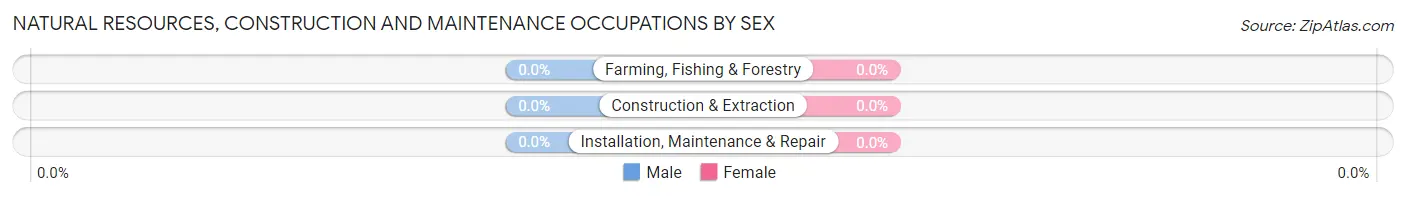
| Occupation | Male | Female |
| Farming, Fishing & Forestry | 0 (0.0%) | 0 (0.0%) |
| Construction & Extraction | 0 (0.0%) | 0 (0.0%) |
| Installation, Maintenance & Repair | 0 (0.0%) | 0 (0.0%) |
| Total (Category) | 0 (0.0%) | 0 (0.0%) |
| Total (Overall) | 97 (59.9%) | 65 (40.1%) |
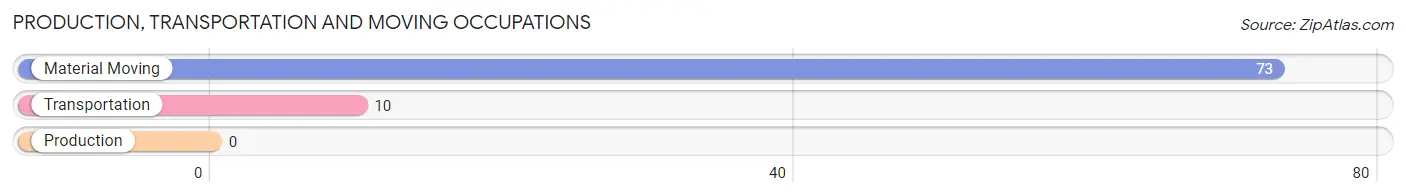
Production, Transportation and Moving Occupations
The most common Production, Transportation and Moving occupations in Handley are Material Moving (73 | 45.1%), and Transportation (10 | 6.2%).
Production, Transportation and Moving Occupations by Sex
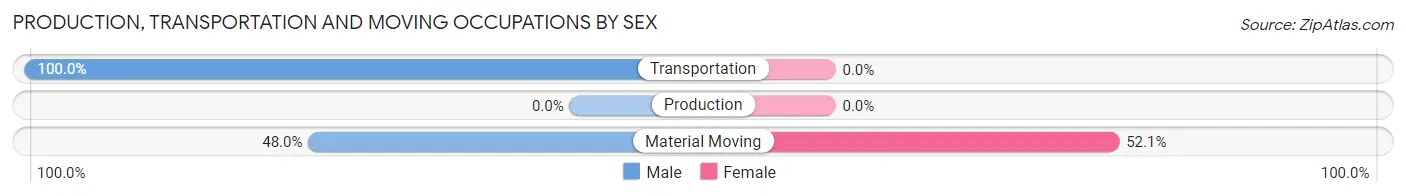
| Occupation | Male | Female |
| Production | 0 (0.0%) | 0 (0.0%) |
| Transportation | 10 (100.0%) | 0 (0.0%) |
| Material Moving | 35 (47.9%) | 38 (52.0%) |
| Total (Category) | 45 (54.2%) | 38 (45.8%) |
| Total (Overall) | 97 (59.9%) | 65 (40.1%) |
Employment Industries by Sex in Handley
Employment Industries in Handley
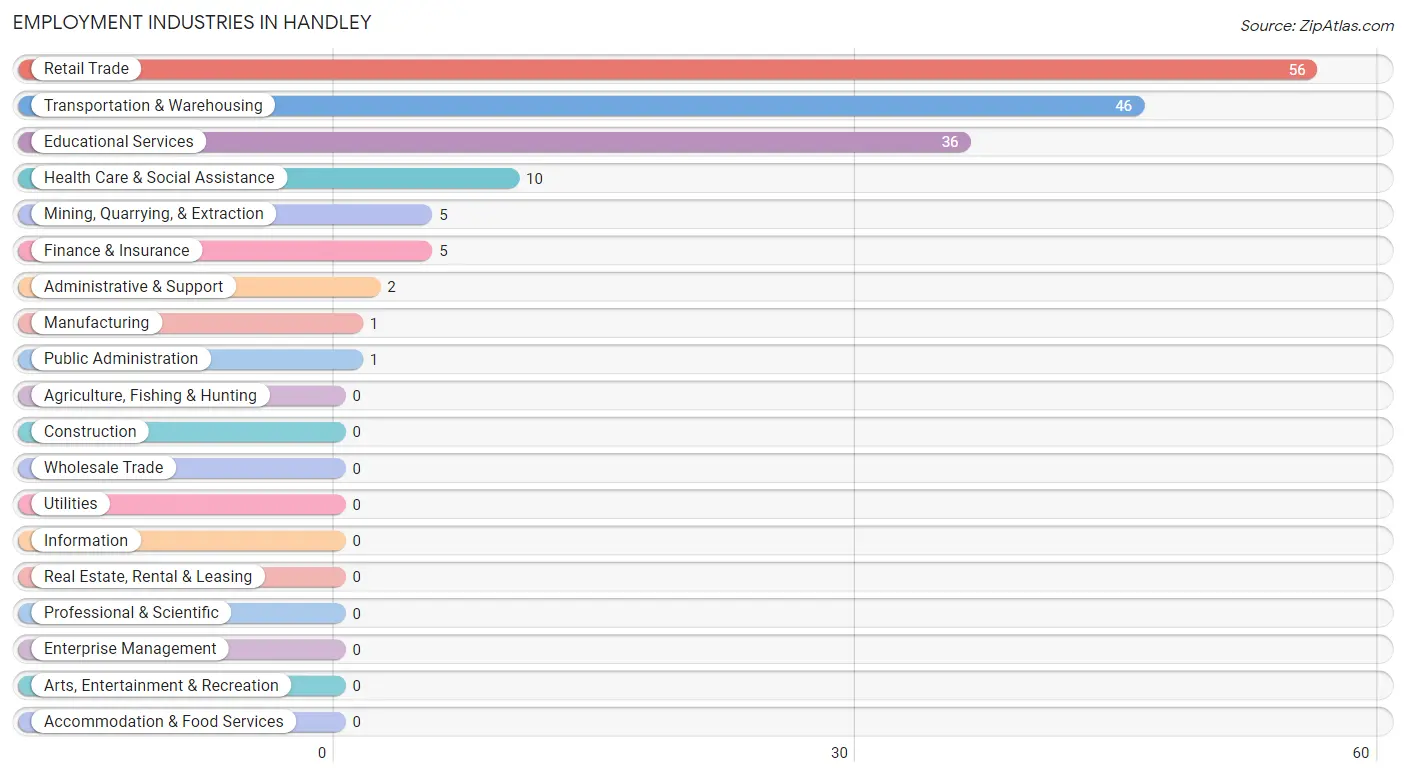
The major employment industries in Handley include Retail Trade (56 | 34.6%), Transportation & Warehousing (46 | 28.4%), Educational Services (36 | 22.2%), Health Care & Social Assistance (10 | 6.2%), and Mining, Quarrying, & Extraction (5 | 3.1%).
Employment Industries by Sex in Handley
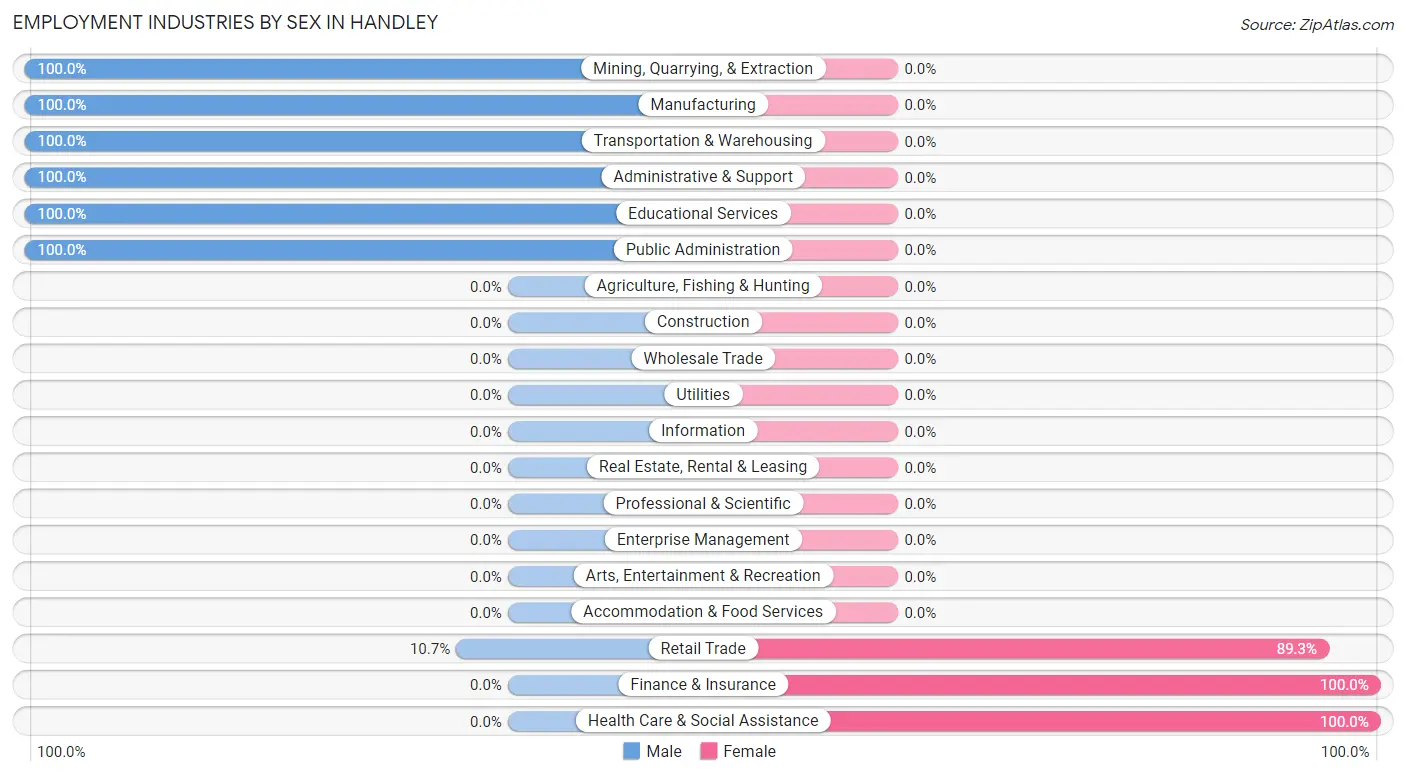
The Handley industries that see more men than women are Mining, Quarrying, & Extraction (100.0%), Manufacturing (100.0%), and Transportation & Warehousing (100.0%), whereas the industries that tend to have a higher number of women are Finance & Insurance (100.0%), Health Care & Social Assistance (100.0%), and Retail Trade (89.3%).
| Industry | Male | Female |
| Agriculture, Fishing & Hunting | 0 (0.0%) | 0 (0.0%) |
| Mining, Quarrying, & Extraction | 5 (100.0%) | 0 (0.0%) |
| Construction | 0 (0.0%) | 0 (0.0%) |
| Manufacturing | 1 (100.0%) | 0 (0.0%) |
| Wholesale Trade | 0 (0.0%) | 0 (0.0%) |
| Retail Trade | 6 (10.7%) | 50 (89.3%) |
| Transportation & Warehousing | 46 (100.0%) | 0 (0.0%) |
| Utilities | 0 (0.0%) | 0 (0.0%) |
| Information | 0 (0.0%) | 0 (0.0%) |
| Finance & Insurance | 0 (0.0%) | 5 (100.0%) |
| Real Estate, Rental & Leasing | 0 (0.0%) | 0 (0.0%) |
| Professional & Scientific | 0 (0.0%) | 0 (0.0%) |
| Enterprise Management | 0 (0.0%) | 0 (0.0%) |
| Administrative & Support | 2 (100.0%) | 0 (0.0%) |
| Educational Services | 36 (100.0%) | 0 (0.0%) |
| Health Care & Social Assistance | 0 (0.0%) | 10 (100.0%) |
| Arts, Entertainment & Recreation | 0 (0.0%) | 0 (0.0%) |
| Accommodation & Food Services | 0 (0.0%) | 0 (0.0%) |
| Public Administration | 1 (100.0%) | 0 (0.0%) |
| Total | 97 (59.9%) | 65 (40.1%) |
Education in Handley
School Enrollment in Handley
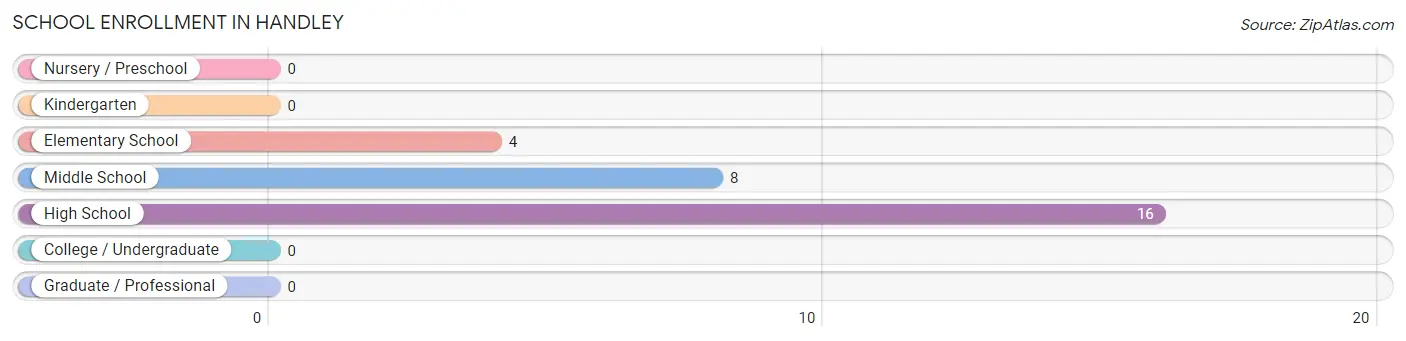
The most common levels of schooling among the 28 students in Handley are high school (16 | 57.1%), middle school (8 | 28.6%), and elementary school (4 | 14.3%).
| School Level | # Students | % Students |
| Nursery / Preschool | 0 | 0.0% |
| Kindergarten | 0 | 0.0% |
| Elementary School | 4 | 14.3% |
| Middle School | 8 | 28.6% |
| High School | 16 | 57.1% |
| College / Undergraduate | 0 | 0.0% |
| Graduate / Professional | 0 | 0.0% |
| Total | 28 | 100.0% |
School Enrollment by Age by Funding Source in Handley
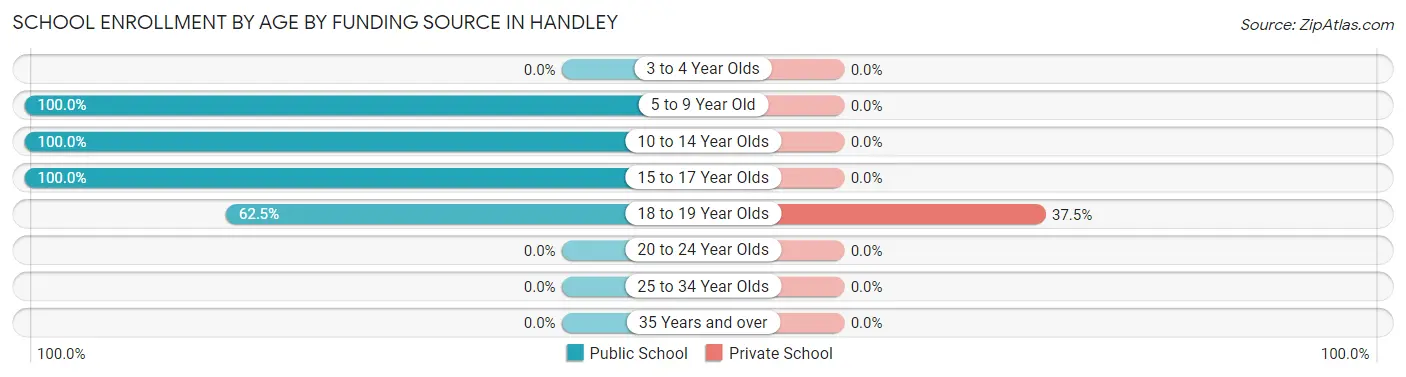
Out of a total of 28 students who are enrolled in schools in Handley, 3 (10.7%) attend a private institution, while the remaining 25 (89.3%) are enrolled in public schools. The age group of 18 to 19 year olds has the highest likelihood of being enrolled in private schools, with 3 (37.5% in the age bracket) enrolled. Conversely, the age group of 5 to 9 year old has the lowest likelihood of being enrolled in a private school, with 4 (100.0% in the age bracket) attending a public institution.
| Age Bracket | Public School | Private School |
| 3 to 4 Year Olds | 0 (0.0%) | 0 (0.0%) |
| 5 to 9 Year Old | 4 (100.0%) | 0 (0.0%) |
| 10 to 14 Year Olds | 14 (100.0%) | 0 (0.0%) |
| 15 to 17 Year Olds | 2 (100.0%) | 0 (0.0%) |
| 18 to 19 Year Olds | 5 (62.5%) | 3 (37.5%) |
| 20 to 24 Year Olds | 0 (0.0%) | 0 (0.0%) |
| 25 to 34 Year Olds | 0 (0.0%) | 0 (0.0%) |
| 35 Years and over | 0 (0.0%) | 0 (0.0%) |
| Total | 25 (89.3%) | 3 (10.7%) |
Educational Attainment by Field of Study in Handley
Social sciences (5 | 55.6%), and education (4 | 44.4%) are the most common fields of study among 9 individuals in Handley who have obtained a bachelor's degree or higher.
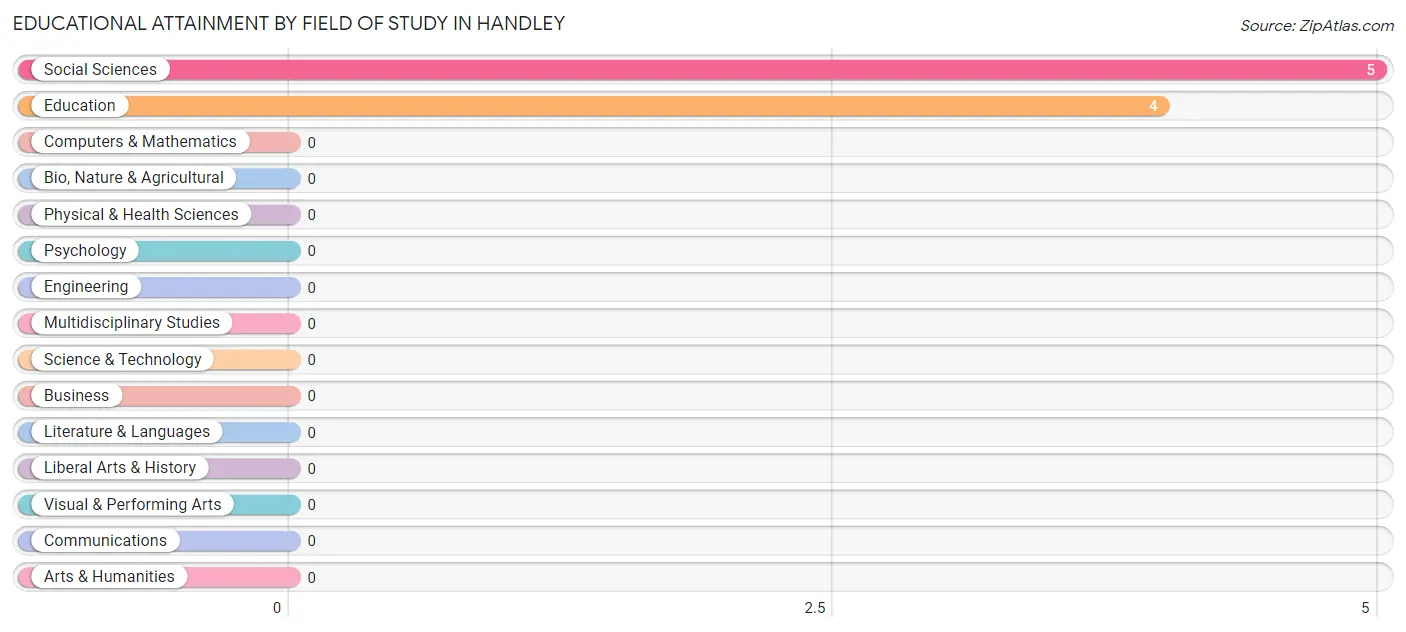
| Field of Study | # Graduates | % Graduates |
| Computers & Mathematics | 0 | 0.0% |
| Bio, Nature & Agricultural | 0 | 0.0% |
| Physical & Health Sciences | 0 | 0.0% |
| Psychology | 0 | 0.0% |
| Social Sciences | 5 | 55.6% |
| Engineering | 0 | 0.0% |
| Multidisciplinary Studies | 0 | 0.0% |
| Science & Technology | 0 | 0.0% |
| Business | 0 | 0.0% |
| Education | 4 | 44.4% |
| Literature & Languages | 0 | 0.0% |
| Liberal Arts & History | 0 | 0.0% |
| Visual & Performing Arts | 0 | 0.0% |
| Communications | 0 | 0.0% |
| Arts & Humanities | 0 | 0.0% |
| Total | 9 | 100.0% |
Transportation & Commute in Handley
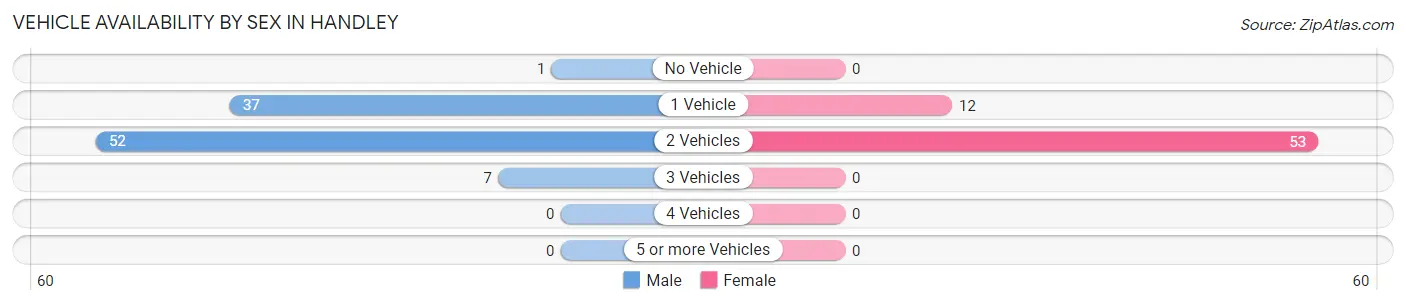
Vehicle Availability by Sex in Handley
The most prevalent vehicle ownership categories in Handley are males with 2 vehicles (52, accounting for 53.6%) and females with 2 vehicles (53, making up 80.0%).
| Vehicles Available | Male | Female |
| No Vehicle | 1 (1.0%) | 0 (0.0%) |
| 1 Vehicle | 37 (38.1%) | 12 (18.5%) |
| 2 Vehicles | 52 (53.6%) | 53 (81.5%) |
| 3 Vehicles | 7 (7.2%) | 0 (0.0%) |
| 4 Vehicles | 0 (0.0%) | 0 (0.0%) |
| 5 or more Vehicles | 0 (0.0%) | 0 (0.0%) |
| Total | 97 (100.0%) | 65 (100.0%) |
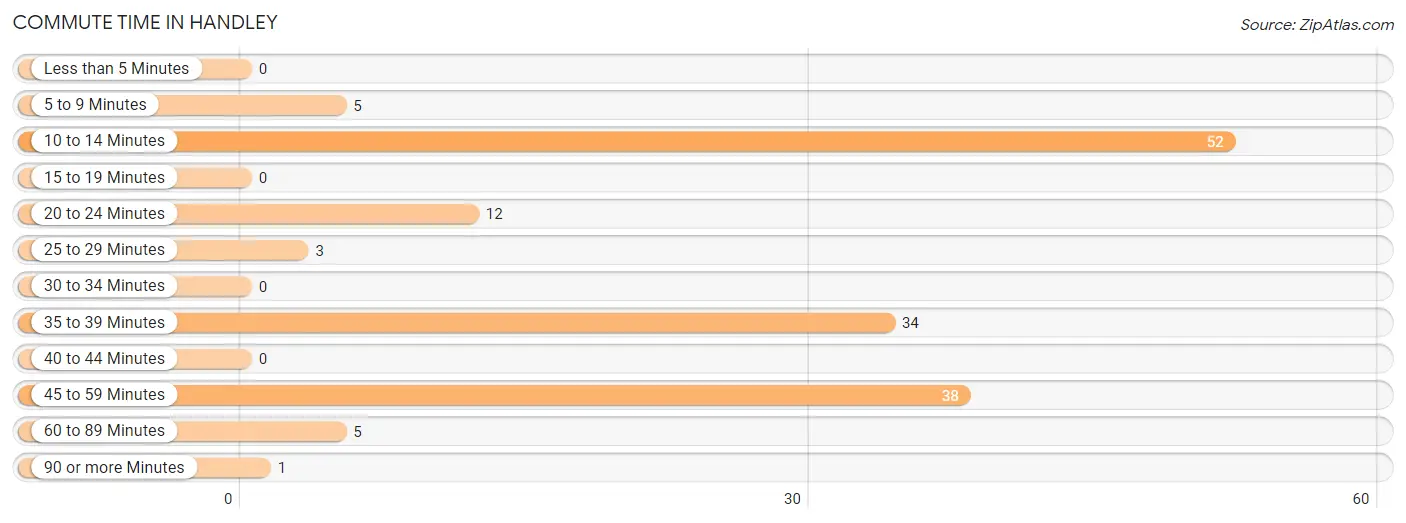
Commute Time in Handley
The most frequently occuring commute durations in Handley are 10 to 14 minutes (52 commuters, 34.7%), 45 to 59 minutes (38 commuters, 25.3%), and 35 to 39 minutes (34 commuters, 22.7%).
| Commute Time | # Commuters | % Commuters |
| Less than 5 Minutes | 0 | 0.0% |
| 5 to 9 Minutes | 5 | 3.3% |
| 10 to 14 Minutes | 52 | 34.7% |
| 15 to 19 Minutes | 0 | 0.0% |
| 20 to 24 Minutes | 12 | 8.0% |
| 25 to 29 Minutes | 3 | 2.0% |
| 30 to 34 Minutes | 0 | 0.0% |
| 35 to 39 Minutes | 34 | 22.7% |
| 40 to 44 Minutes | 0 | 0.0% |
| 45 to 59 Minutes | 38 | 25.3% |
| 60 to 89 Minutes | 5 | 3.3% |
| 90 or more Minutes | 1 | 0.7% |
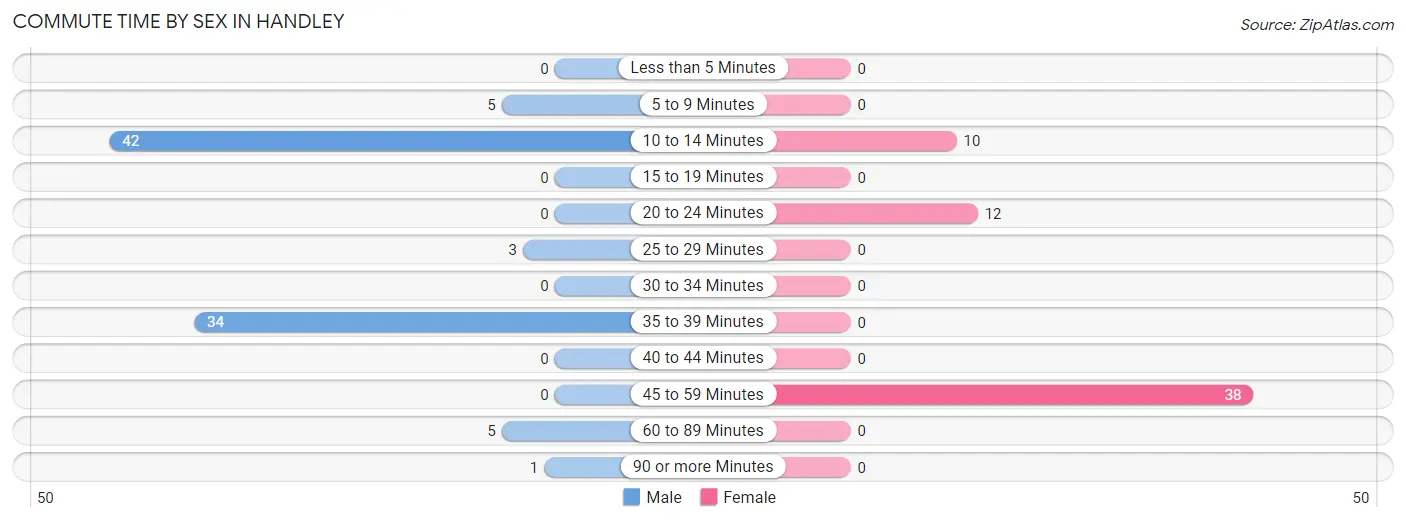
Commute Time by Sex in Handley
The most common commute times in Handley are 10 to 14 minutes (42 commuters, 46.7%) for males and 45 to 59 minutes (38 commuters, 63.3%) for females.
| Commute Time | Male | Female |
| Less than 5 Minutes | 0 (0.0%) | 0 (0.0%) |
| 5 to 9 Minutes | 5 (5.6%) | 0 (0.0%) |
| 10 to 14 Minutes | 42 (46.7%) | 10 (16.7%) |
| 15 to 19 Minutes | 0 (0.0%) | 0 (0.0%) |
| 20 to 24 Minutes | 0 (0.0%) | 12 (20.0%) |
| 25 to 29 Minutes | 3 (3.3%) | 0 (0.0%) |
| 30 to 34 Minutes | 0 (0.0%) | 0 (0.0%) |
| 35 to 39 Minutes | 34 (37.8%) | 0 (0.0%) |
| 40 to 44 Minutes | 0 (0.0%) | 0 (0.0%) |
| 45 to 59 Minutes | 0 (0.0%) | 38 (63.3%) |
| 60 to 89 Minutes | 5 (5.6%) | 0 (0.0%) |
| 90 or more Minutes | 1 (1.1%) | 0 (0.0%) |
Time of Departure to Work by Sex in Handley
The most frequent times of departure to work in Handley are 12:00 AM to 4:59 AM (75, 83.3%) for males and 8:00 AM to 8:29 AM (38, 63.3%) for females.
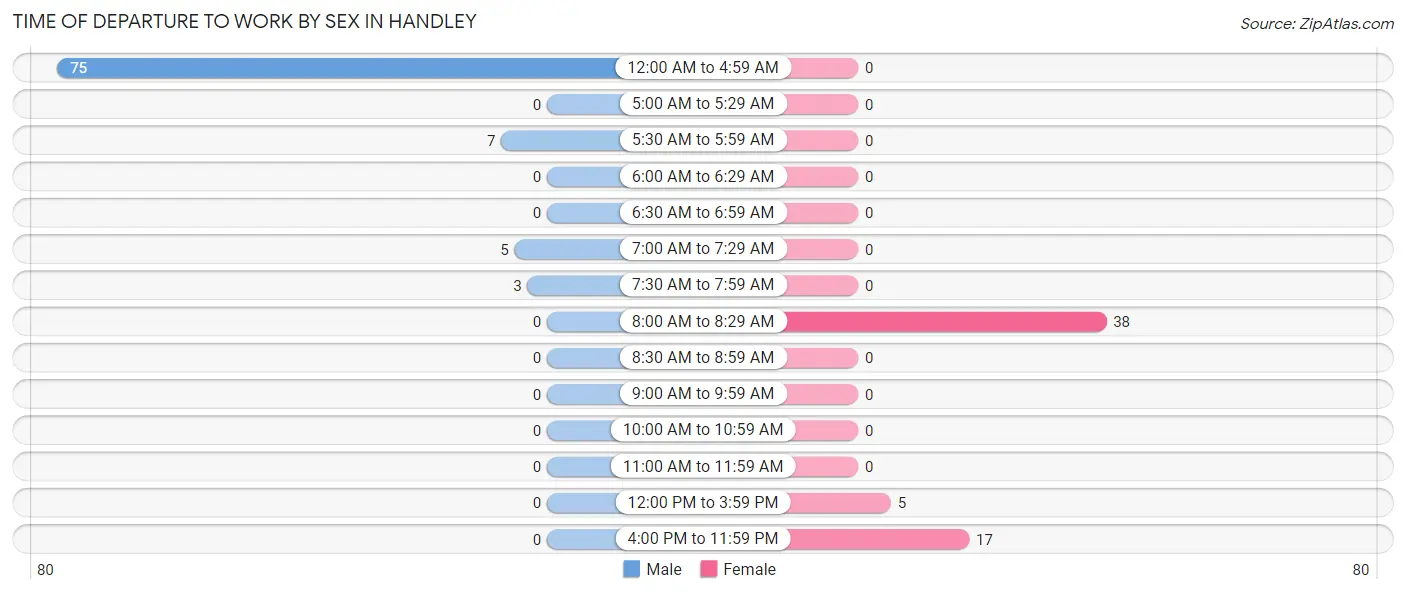
| Time of Departure | Male | Female |
| 12:00 AM to 4:59 AM | 75 (83.3%) | 0 (0.0%) |
| 5:00 AM to 5:29 AM | 0 (0.0%) | 0 (0.0%) |
| 5:30 AM to 5:59 AM | 7 (7.8%) | 0 (0.0%) |
| 6:00 AM to 6:29 AM | 0 (0.0%) | 0 (0.0%) |
| 6:30 AM to 6:59 AM | 0 (0.0%) | 0 (0.0%) |
| 7:00 AM to 7:29 AM | 5 (5.6%) | 0 (0.0%) |
| 7:30 AM to 7:59 AM | 3 (3.3%) | 0 (0.0%) |
| 8:00 AM to 8:29 AM | 0 (0.0%) | 38 (63.3%) |
| 8:30 AM to 8:59 AM | 0 (0.0%) | 0 (0.0%) |
| 9:00 AM to 9:59 AM | 0 (0.0%) | 0 (0.0%) |
| 10:00 AM to 10:59 AM | 0 (0.0%) | 0 (0.0%) |
| 11:00 AM to 11:59 AM | 0 (0.0%) | 0 (0.0%) |
| 12:00 PM to 3:59 PM | 0 (0.0%) | 5 (8.3%) |
| 4:00 PM to 11:59 PM | 0 (0.0%) | 17 (28.3%) |
| Total | 90 (100.0%) | 60 (100.0%) |
Housing Occupancy in Handley
Occupancy by Ownership in Handley
Of the total 122 dwellings in Handley, owner-occupied units account for 120 (98.4%), while renter-occupied units make up 2 (1.6%).
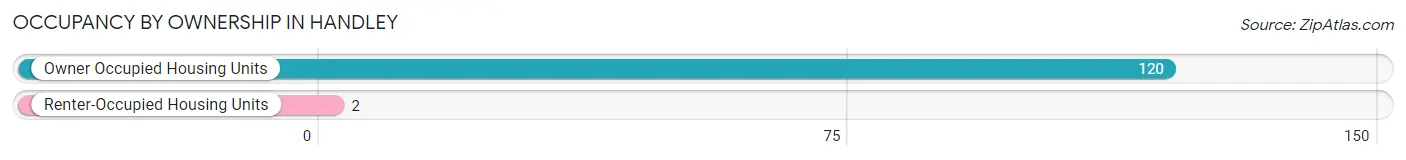
| Occupancy | # Housing Units | % Housing Units |
| Owner Occupied Housing Units | 120 | 98.4% |
| Renter-Occupied Housing Units | 2 | 1.6% |
| Total Occupied Housing Units | 122 | 100.0% |
Occupancy by Household Size in Handley
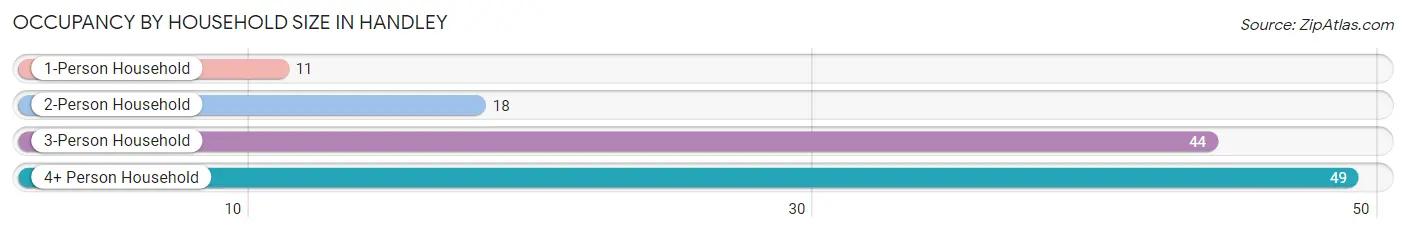
| Household Size | # Housing Units | % Housing Units |
| 1-Person Household | 11 | 9.0% |
| 2-Person Household | 18 | 14.7% |
| 3-Person Household | 44 | 36.1% |
| 4+ Person Household | 49 | 40.2% |
| Total Housing Units | 122 | 100.0% |
Occupancy by Ownership by Household Size in Handley
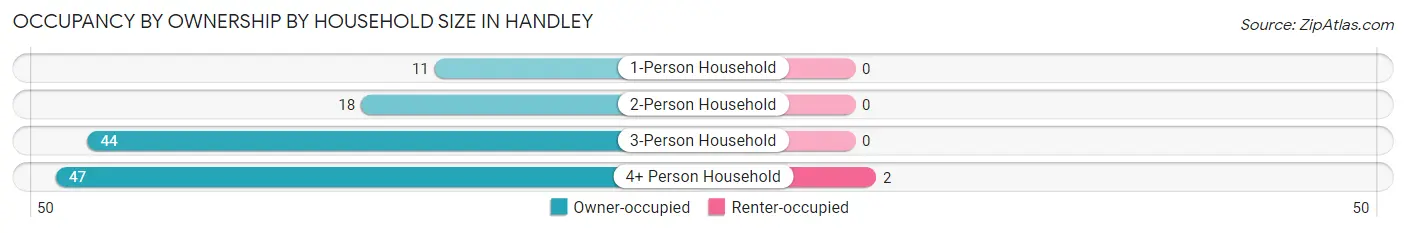
| Household Size | Owner-occupied | Renter-occupied |
| 1-Person Household | 11 (100.0%) | 0 (0.0%) |
| 2-Person Household | 18 (100.0%) | 0 (0.0%) |
| 3-Person Household | 44 (100.0%) | 0 (0.0%) |
| 4+ Person Household | 47 (95.9%) | 2 (4.1%) |
| Total Housing Units | 120 (98.4%) | 2 (1.6%) |
Occupancy by Educational Attainment in Handley
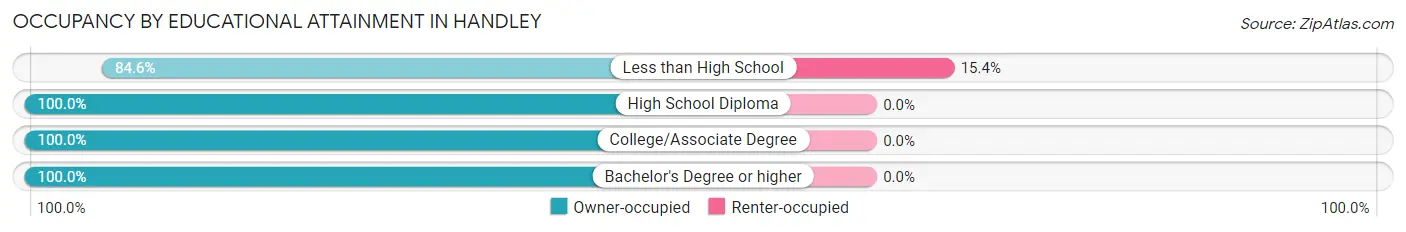
| Household Size | Owner-occupied | Renter-occupied |
| Less than High School | 11 (84.6%) | 2 (15.4%) |
| High School Diploma | 97 (100.0%) | 0 (0.0%) |
| College/Associate Degree | 8 (100.0%) | 0 (0.0%) |
| Bachelor's Degree or higher | 4 (100.0%) | 0 (0.0%) |
Occupancy by Age of Householder in Handley
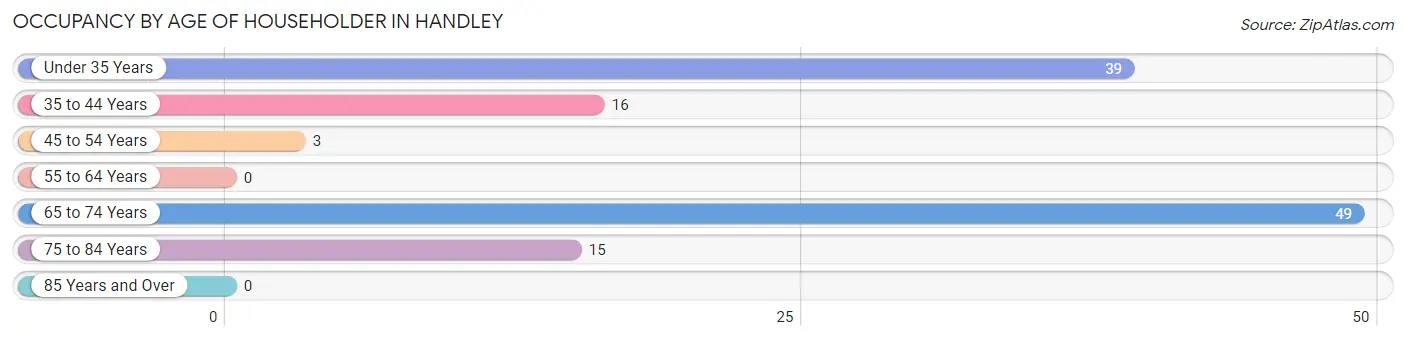
| Age Bracket | # Households | % Households |
| Under 35 Years | 39 | 32.0% |
| 35 to 44 Years | 16 | 13.1% |
| 45 to 54 Years | 3 | 2.5% |
| 55 to 64 Years | 0 | 0.0% |
| 65 to 74 Years | 49 | 40.2% |
| 75 to 84 Years | 15 | 12.3% |
| 85 Years and Over | 0 | 0.0% |
| Total | 122 | 100.0% |
Housing Finances in Handley
Median Income by Occupancy in Handley
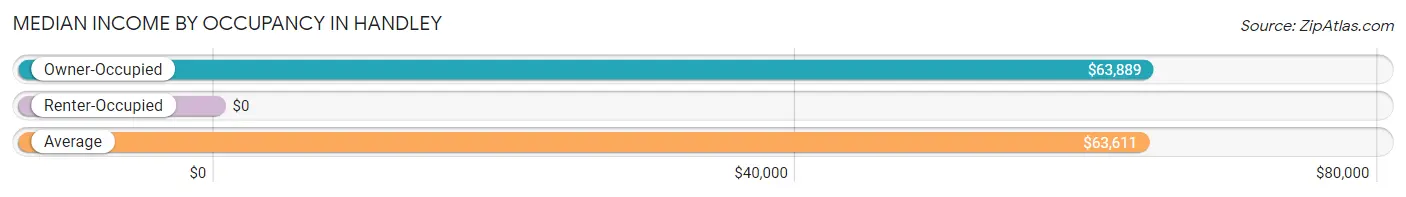
| Occupancy Type | # Households | Median Income |
| Owner-Occupied | 120 (98.4%) | $63,889 |
| Renter-Occupied | 2 (1.6%) | $0 |
| Average | 122 (100.0%) | $63,611 |
Occupancy by Householder Income Bracket in Handley
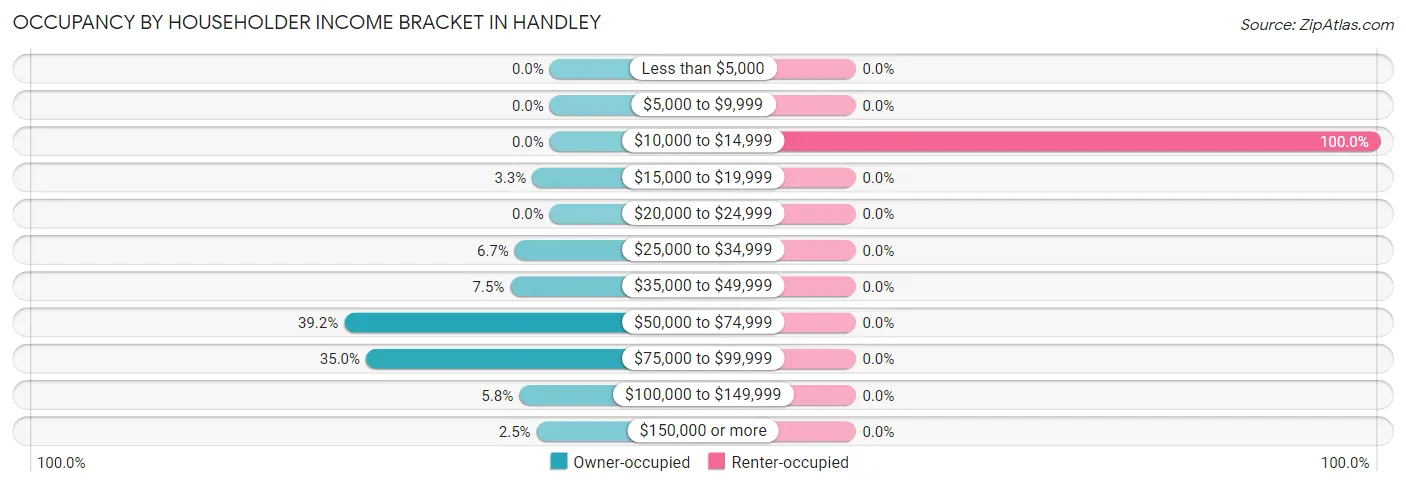
| Income Bracket | Owner-occupied | Renter-occupied |
| Less than $5,000 | 0 (0.0%) | 0 (0.0%) |
| $5,000 to $9,999 | 0 (0.0%) | 0 (0.0%) |
| $10,000 to $14,999 | 0 (0.0%) | 2 (100.0%) |
| $15,000 to $19,999 | 4 (3.3%) | 0 (0.0%) |
| $20,000 to $24,999 | 0 (0.0%) | 0 (0.0%) |
| $25,000 to $34,999 | 8 (6.7%) | 0 (0.0%) |
| $35,000 to $49,999 | 9 (7.5%) | 0 (0.0%) |
| $50,000 to $74,999 | 47 (39.2%) | 0 (0.0%) |
| $75,000 to $99,999 | 42 (35.0%) | 0 (0.0%) |
| $100,000 to $149,999 | 7 (5.8%) | 0 (0.0%) |
| $150,000 or more | 3 (2.5%) | 0 (0.0%) |
| Total | 120 (100.0%) | 2 (100.0%) |
Monthly Housing Cost Tiers in Handley
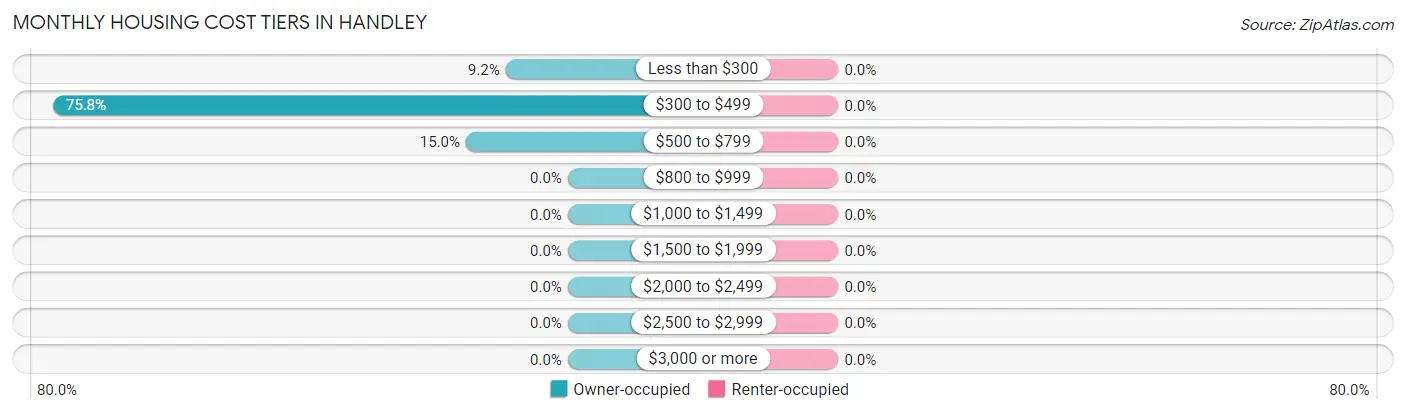
| Monthly Cost | Owner-occupied | Renter-occupied |
| Less than $300 | 11 (9.2%) | 0 (0.0%) |
| $300 to $499 | 91 (75.8%) | 0 (0.0%) |
| $500 to $799 | 18 (15.0%) | 0 (0.0%) |
| $800 to $999 | 0 (0.0%) | 0 (0.0%) |
| $1,000 to $1,499 | 0 (0.0%) | 0 (0.0%) |
| $1,500 to $1,999 | 0 (0.0%) | 0 (0.0%) |
| $2,000 to $2,499 | 0 (0.0%) | 0 (0.0%) |
| $2,500 to $2,999 | 0 (0.0%) | 0 (0.0%) |
| $3,000 or more | 0 (0.0%) | 0 (0.0%) |
| Total | 120 (100.0%) | 2 (100.0%) |
Physical Housing Characteristics in Handley
Housing Structures in Handley
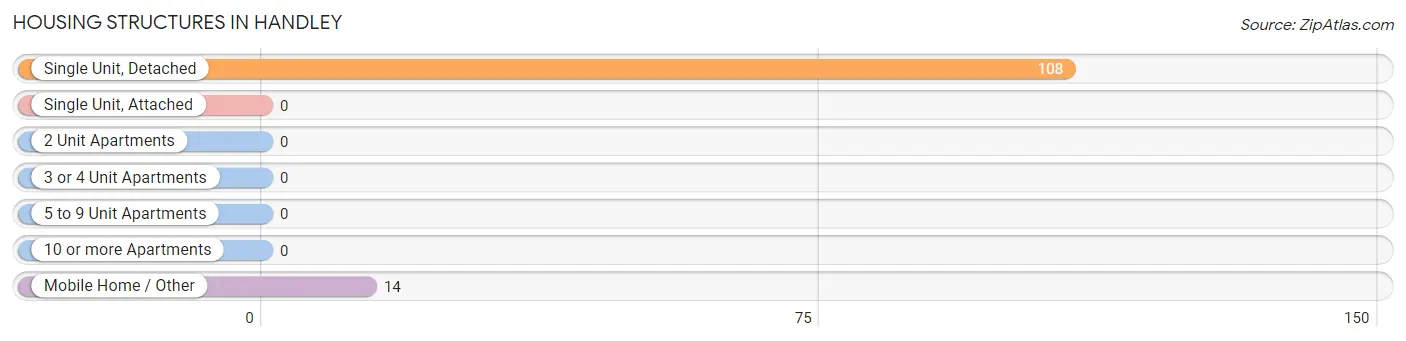
| Structure Type | # Housing Units | % Housing Units |
| Single Unit, Detached | 108 | 88.5% |
| Single Unit, Attached | 0 | 0.0% |
| 2 Unit Apartments | 0 | 0.0% |
| 3 or 4 Unit Apartments | 0 | 0.0% |
| 5 to 9 Unit Apartments | 0 | 0.0% |
| 10 or more Apartments | 0 | 0.0% |
| Mobile Home / Other | 14 | 11.5% |
| Total | 122 | 100.0% |
Housing Structures by Occupancy in Handley
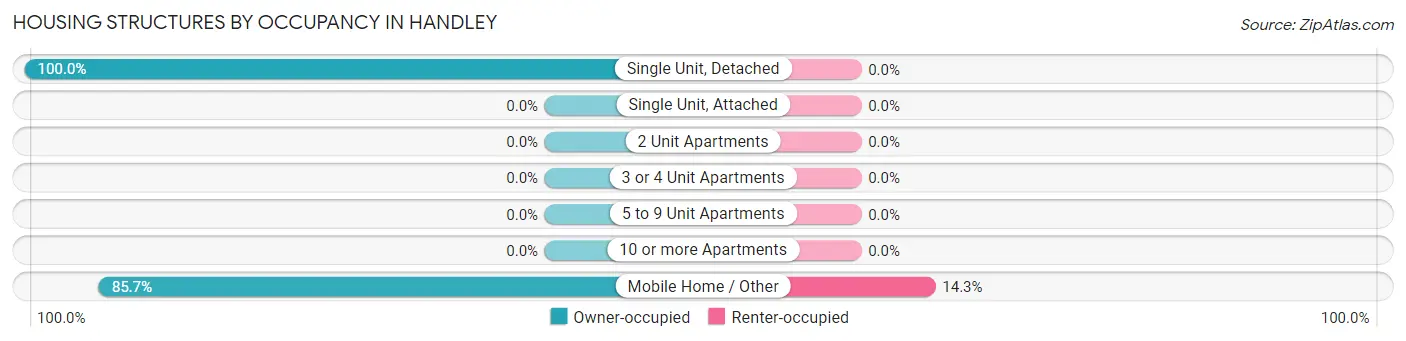
| Structure Type | Owner-occupied | Renter-occupied |
| Single Unit, Detached | 108 (100.0%) | 0 (0.0%) |
| Single Unit, Attached | 0 (0.0%) | 0 (0.0%) |
| 2 Unit Apartments | 0 (0.0%) | 0 (0.0%) |
| 3 or 4 Unit Apartments | 0 (0.0%) | 0 (0.0%) |
| 5 to 9 Unit Apartments | 0 (0.0%) | 0 (0.0%) |
| 10 or more Apartments | 0 (0.0%) | 0 (0.0%) |
| Mobile Home / Other | 12 (85.7%) | 2 (14.3%) |
| Total | 120 (98.4%) | 2 (1.6%) |
Housing Structures by Number of Rooms in Handley
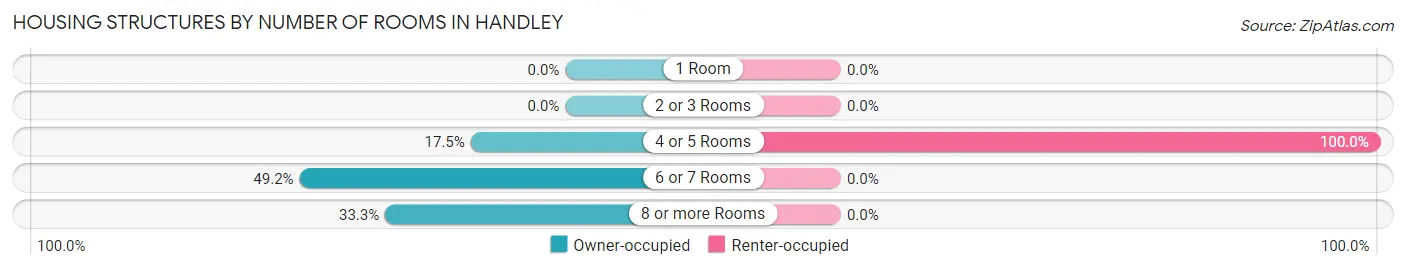
| Number of Rooms | Owner-occupied | Renter-occupied |
| 1 Room | 0 (0.0%) | 0 (0.0%) |
| 2 or 3 Rooms | 0 (0.0%) | 0 (0.0%) |
| 4 or 5 Rooms | 21 (17.5%) | 2 (100.0%) |
| 6 or 7 Rooms | 59 (49.2%) | 0 (0.0%) |
| 8 or more Rooms | 40 (33.3%) | 0 (0.0%) |
| Total | 120 (100.0%) | 2 (100.0%) |
Housing Structure by Heating Type in Handley
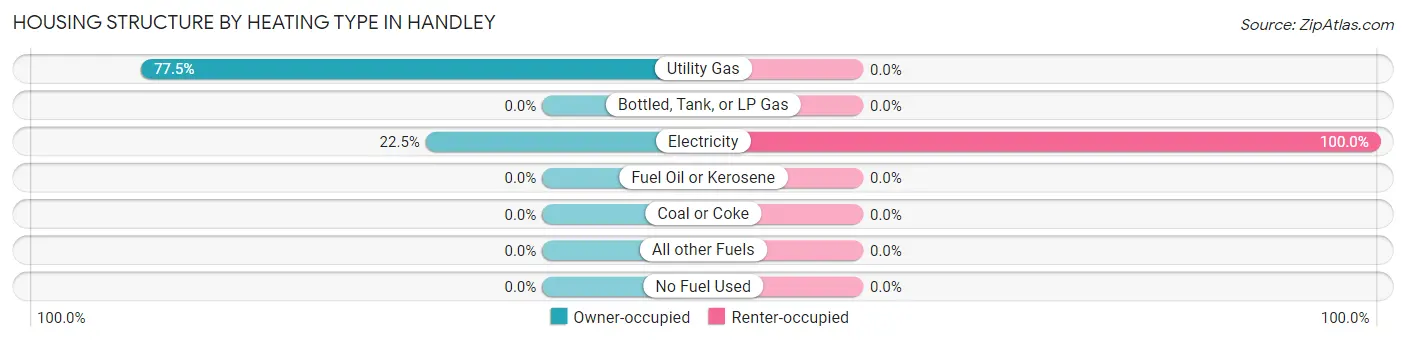
| Heating Type | Owner-occupied | Renter-occupied |
| Utility Gas | 93 (77.5%) | 0 (0.0%) |
| Bottled, Tank, or LP Gas | 0 (0.0%) | 0 (0.0%) |
| Electricity | 27 (22.5%) | 2 (100.0%) |
| Fuel Oil or Kerosene | 0 (0.0%) | 0 (0.0%) |
| Coal or Coke | 0 (0.0%) | 0 (0.0%) |
| All other Fuels | 0 (0.0%) | 0 (0.0%) |
| No Fuel Used | 0 (0.0%) | 0 (0.0%) |
| Total | 120 (100.0%) | 2 (100.0%) |
Household Vehicle Usage in Handley
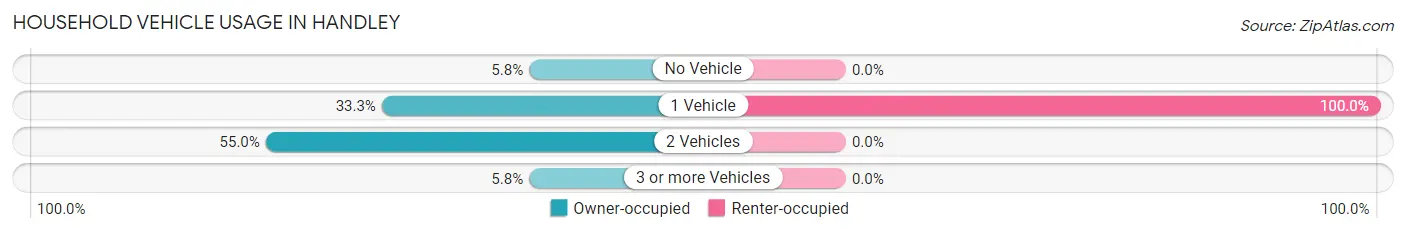
| Vehicles per Household | Owner-occupied | Renter-occupied |
| No Vehicle | 7 (5.8%) | 0 (0.0%) |
| 1 Vehicle | 40 (33.3%) | 2 (100.0%) |
| 2 Vehicles | 66 (55.0%) | 0 (0.0%) |
| 3 or more Vehicles | 7 (5.8%) | 0 (0.0%) |
| Total | 120 (100.0%) | 2 (100.0%) |
Real Estate & Mortgages in Handley
Real Estate and Mortgage Overview in Handley
| Characteristic | Without Mortgage | With Mortgage |
| Housing Units | 111 | 9 |
| Median Property Value | - | - |
| Median Household Income | $64,028 | $0 |
| Monthly Housing Costs | $374 | $0 |
| Real Estate Taxes | $384 | $0 |
Property Value by Mortgage Status in Handley
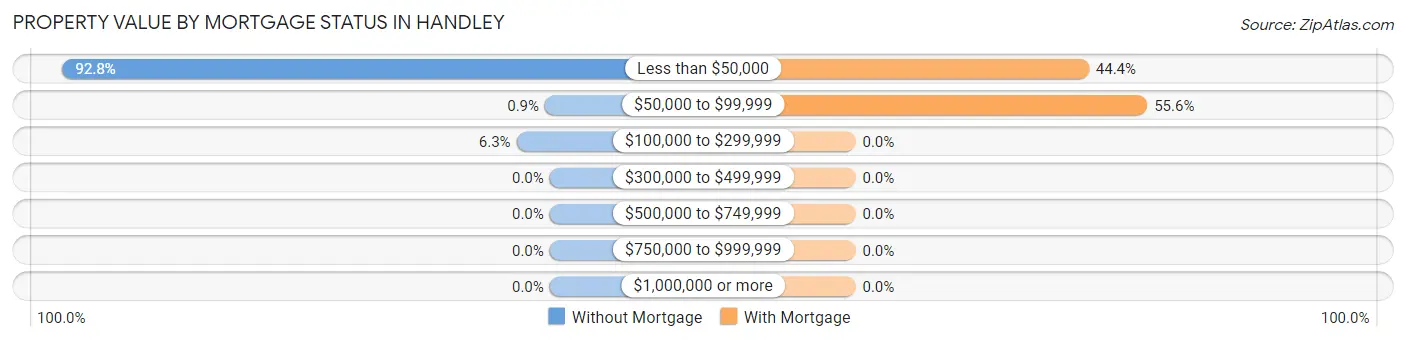
| Property Value | Without Mortgage | With Mortgage |
| Less than $50,000 | 103 (92.8%) | 4 (44.4%) |
| $50,000 to $99,999 | 1 (0.9%) | 5 (55.6%) |
| $100,000 to $299,999 | 7 (6.3%) | 0 (0.0%) |
| $300,000 to $499,999 | 0 (0.0%) | 0 (0.0%) |
| $500,000 to $749,999 | 0 (0.0%) | 0 (0.0%) |
| $750,000 to $999,999 | 0 (0.0%) | 0 (0.0%) |
| $1,000,000 or more | 0 (0.0%) | 0 (0.0%) |
| Total | 111 (100.0%) | 9 (100.0%) |
Household Income by Mortgage Status in Handley
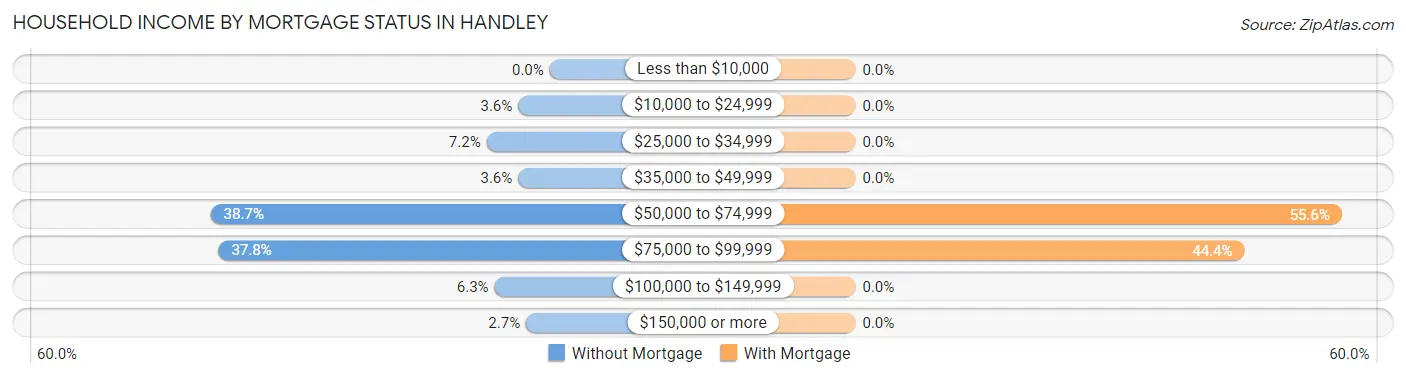
| Household Income | Without Mortgage | With Mortgage |
| Less than $10,000 | 0 (0.0%) | 0 (0.0%) |
| $10,000 to $24,999 | 4 (3.6%) | 0 (0.0%) |
| $25,000 to $34,999 | 8 (7.2%) | 0 (0.0%) |
| $35,000 to $49,999 | 4 (3.6%) | 0 (0.0%) |
| $50,000 to $74,999 | 43 (38.7%) | 5 (55.6%) |
| $75,000 to $99,999 | 42 (37.8%) | 4 (44.4%) |
| $100,000 to $149,999 | 7 (6.3%) | 0 (0.0%) |
| $150,000 or more | 3 (2.7%) | 0 (0.0%) |
| Total | 111 (100.0%) | 9 (100.0%) |
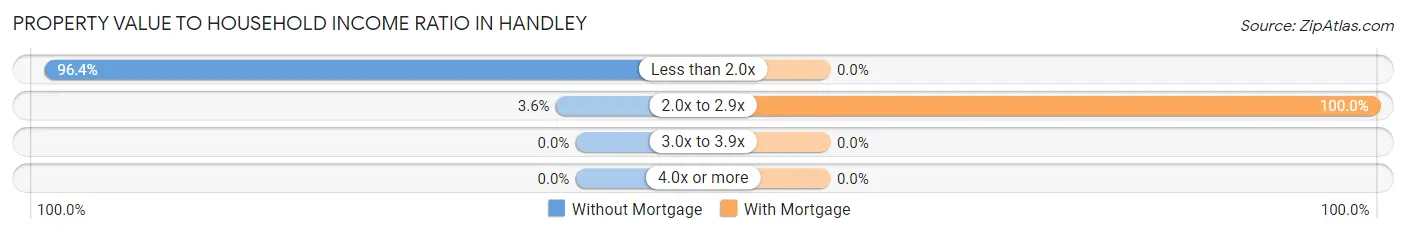
Property Value to Household Income Ratio in Handley
| Value-to-Income Ratio | Without Mortgage | With Mortgage |
| Less than 2.0x | 107 (96.4%) | 0 (0.0%) |
| 2.0x to 2.9x | 4 (3.6%) | 9 (100.0%) |
| 3.0x to 3.9x | 0 (0.0%) | 0 (0.0%) |
| 4.0x or more | 0 (0.0%) | 0 (0.0%) |
| Total | 111 (100.0%) | 9 (100.0%) |
Real Estate Taxes by Mortgage Status in Handley
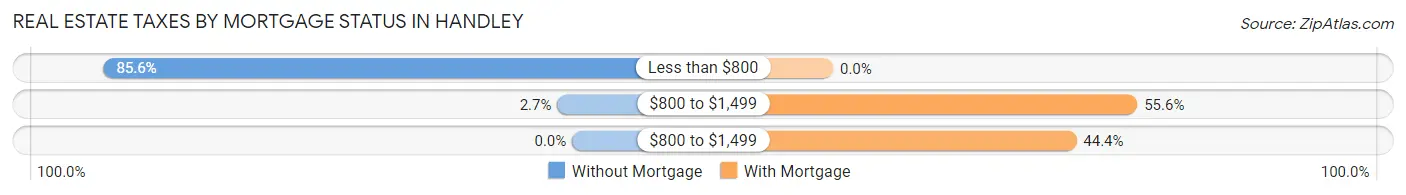
| Property Taxes | Without Mortgage | With Mortgage |
| Less than $800 | 95 (85.6%) | 0 (0.0%) |
| $800 to $1,499 | 3 (2.7%) | 5 (55.6%) |
| $800 to $1,499 | 0 (0.0%) | 4 (44.4%) |
| Total | 111 (100.0%) | 9 (100.0%) |
Health & Disability in Handley
Health Insurance Coverage by Age in Handley
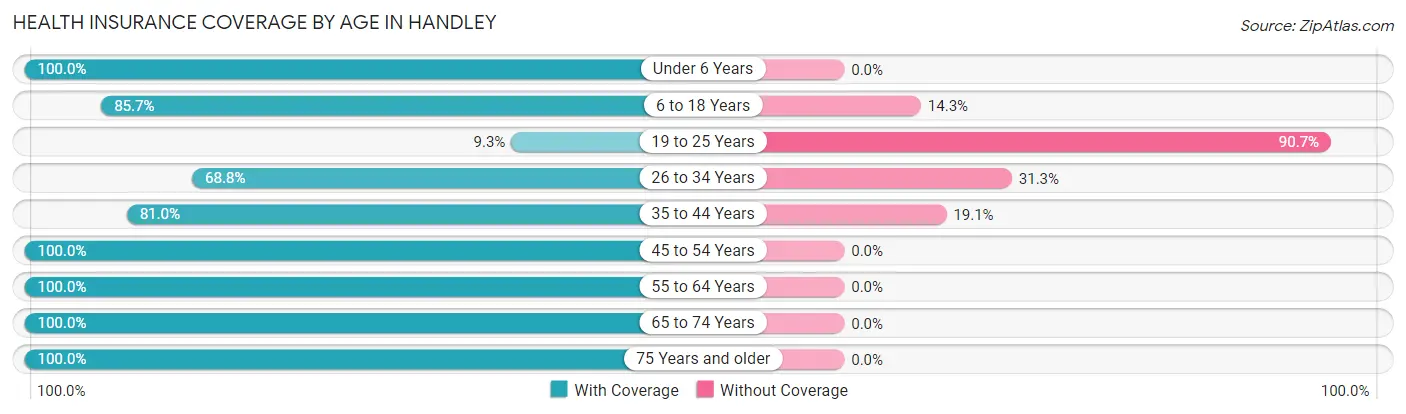
| Age Bracket | With Coverage | Without Coverage |
| Under 6 Years | 85 (100.0%) | 0 (0.0%) |
| 6 to 18 Years | 24 (85.7%) | 4 (14.3%) |
| 19 to 25 Years | 5 (9.3%) | 49 (90.7%) |
| 26 to 34 Years | 11 (68.8%) | 5 (31.2%) |
| 35 to 44 Years | 34 (80.9%) | 8 (19.1%) |
| 45 to 54 Years | 64 (100.0%) | 0 (0.0%) |
| 55 to 64 Years | 47 (100.0%) | 0 (0.0%) |
| 65 to 74 Years | 56 (100.0%) | 0 (0.0%) |
| 75 Years and older | 20 (100.0%) | 0 (0.0%) |
| Total | 346 (84.0%) | 66 (16.0%) |
Health Insurance Coverage by Citizenship Status in Handley
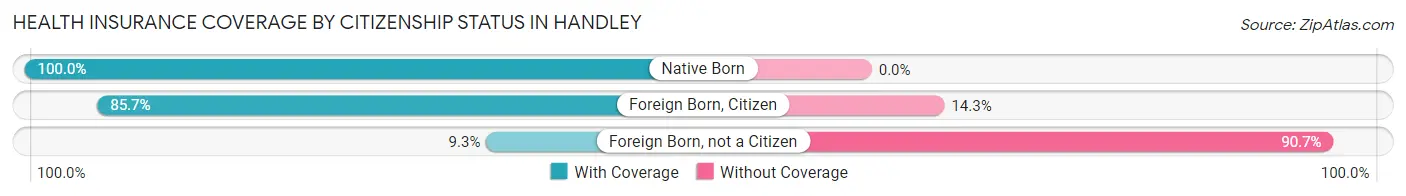
| Citizenship Status | With Coverage | Without Coverage |
| Native Born | 85 (100.0%) | 0 (0.0%) |
| Foreign Born, Citizen | 24 (85.7%) | 4 (14.3%) |
| Foreign Born, not a Citizen | 5 (9.3%) | 49 (90.7%) |
Health Insurance Coverage by Household Income in Handley
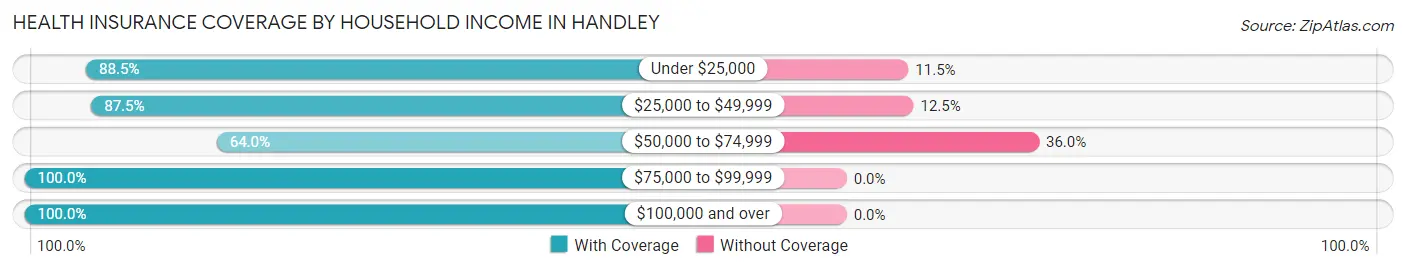
| Household Income | With Coverage | Without Coverage |
| Under $25,000 | 23 (88.5%) | 3 (11.5%) |
| $25,000 to $49,999 | 35 (87.5%) | 5 (12.5%) |
| $50,000 to $74,999 | 103 (64.0%) | 58 (36.0%) |
| $75,000 to $99,999 | 154 (100.0%) | 0 (0.0%) |
| $100,000 and over | 31 (100.0%) | 0 (0.0%) |
Public vs Private Health Insurance Coverage by Age in Handley
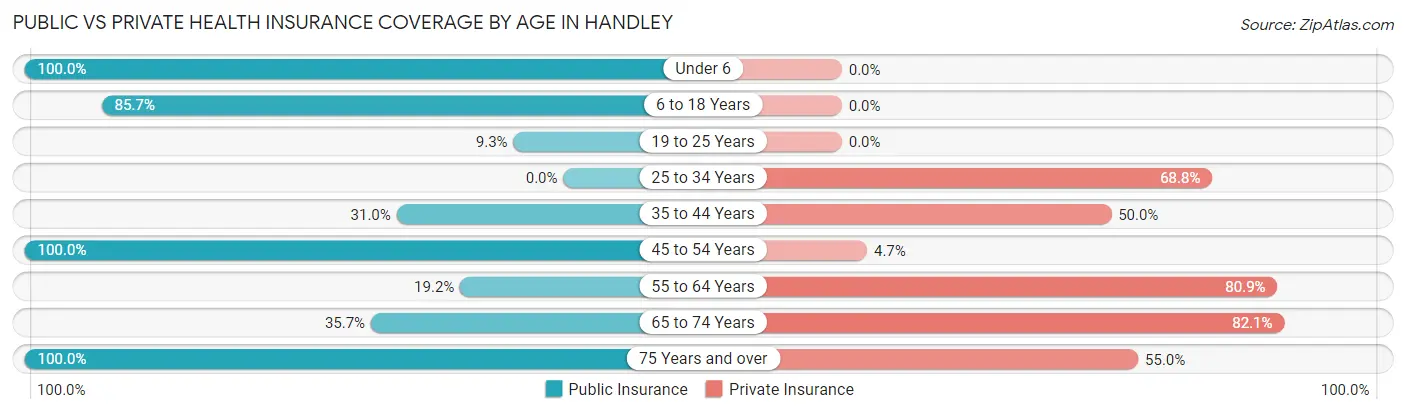
| Age Bracket | Public Insurance | Private Insurance |
| Under 6 | 85 (100.0%) | 0 (0.0%) |
| 6 to 18 Years | 24 (85.7%) | 0 (0.0%) |
| 19 to 25 Years | 5 (9.3%) | 0 (0.0%) |
| 25 to 34 Years | 0 (0.0%) | 11 (68.8%) |
| 35 to 44 Years | 13 (30.9%) | 21 (50.0%) |
| 45 to 54 Years | 64 (100.0%) | 3 (4.7%) |
| 55 to 64 Years | 9 (19.2%) | 38 (80.8%) |
| 65 to 74 Years | 20 (35.7%) | 46 (82.1%) |
| 75 Years and over | 20 (100.0%) | 11 (55.0%) |
| Total | 240 (58.3%) | 130 (31.6%) |
Disability Status by Sex by Age in Handley
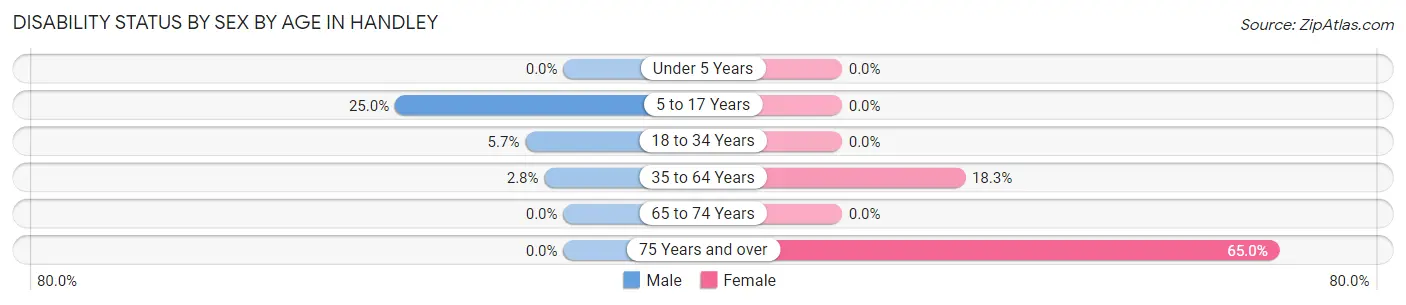
| Age Bracket | Male | Female |
| Under 5 Years | 0 (0.0%) | 0 (0.0%) |
| 5 to 17 Years | 5 (25.0%) | 0 (0.0%) |
| 18 to 34 Years | 3 (5.7%) | 0 (0.0%) |
| 35 to 64 Years | 2 (2.8%) | 15 (18.3%) |
| 65 to 74 Years | 0 (0.0%) | 0 (0.0%) |
| 75 Years and over | 0 (0.0%) | 13 (65.0%) |
Disability Class by Sex by Age in Handley
Disability Class: Hearing Difficulty
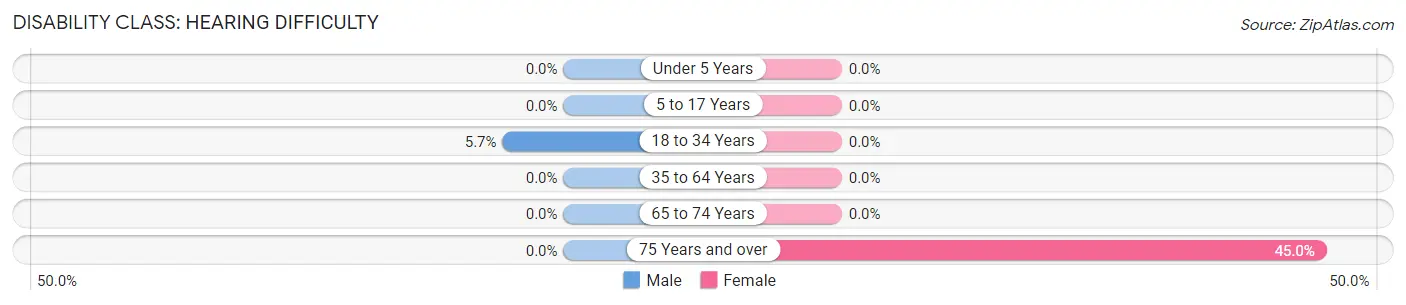
| Age Bracket | Male | Female |
| Under 5 Years | 0 (0.0%) | 0 (0.0%) |
| 5 to 17 Years | 0 (0.0%) | 0 (0.0%) |
| 18 to 34 Years | 3 (5.7%) | 0 (0.0%) |
| 35 to 64 Years | 0 (0.0%) | 0 (0.0%) |
| 65 to 74 Years | 0 (0.0%) | 0 (0.0%) |
| 75 Years and over | 0 (0.0%) | 9 (45.0%) |
Disability Class: Vision Difficulty
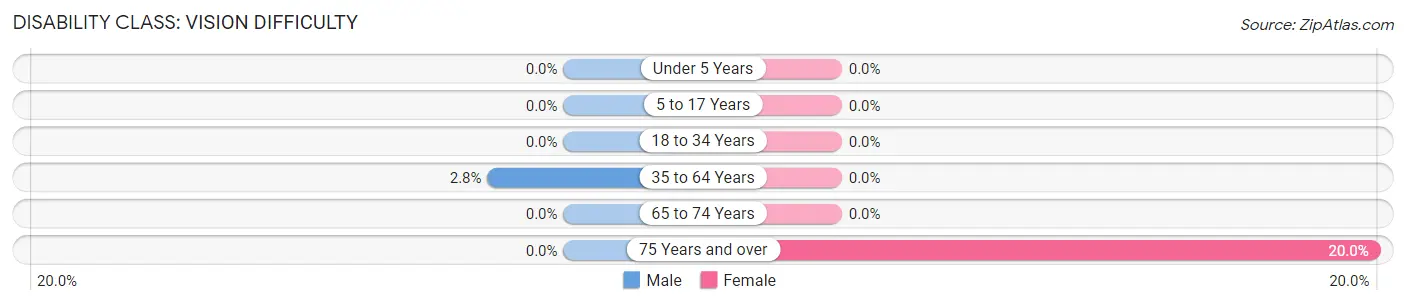
| Age Bracket | Male | Female |
| Under 5 Years | 0 (0.0%) | 0 (0.0%) |
| 5 to 17 Years | 0 (0.0%) | 0 (0.0%) |
| 18 to 34 Years | 0 (0.0%) | 0 (0.0%) |
| 35 to 64 Years | 2 (2.8%) | 0 (0.0%) |
| 65 to 74 Years | 0 (0.0%) | 0 (0.0%) |
| 75 Years and over | 0 (0.0%) | 4 (20.0%) |
Disability Class: Cognitive Difficulty
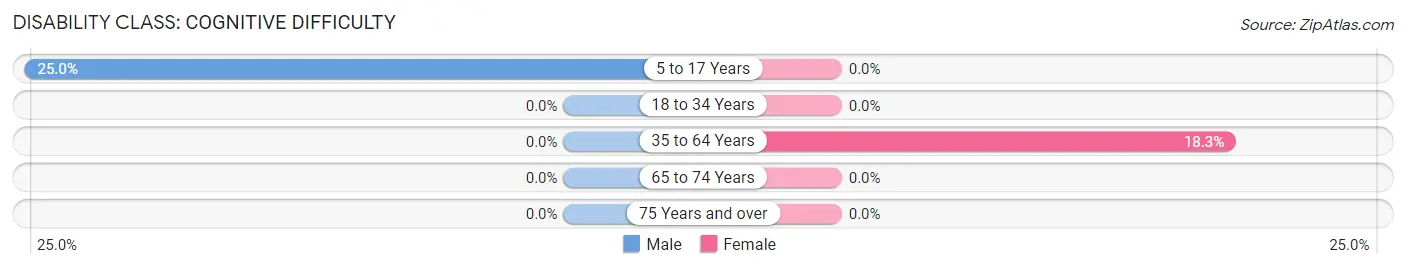
| Age Bracket | Male | Female |
| 5 to 17 Years | 5 (25.0%) | 0 (0.0%) |
| 18 to 34 Years | 0 (0.0%) | 0 (0.0%) |
| 35 to 64 Years | 0 (0.0%) | 15 (18.3%) |
| 65 to 74 Years | 0 (0.0%) | 0 (0.0%) |
| 75 Years and over | 0 (0.0%) | 0 (0.0%) |
Disability Class: Ambulatory Difficulty
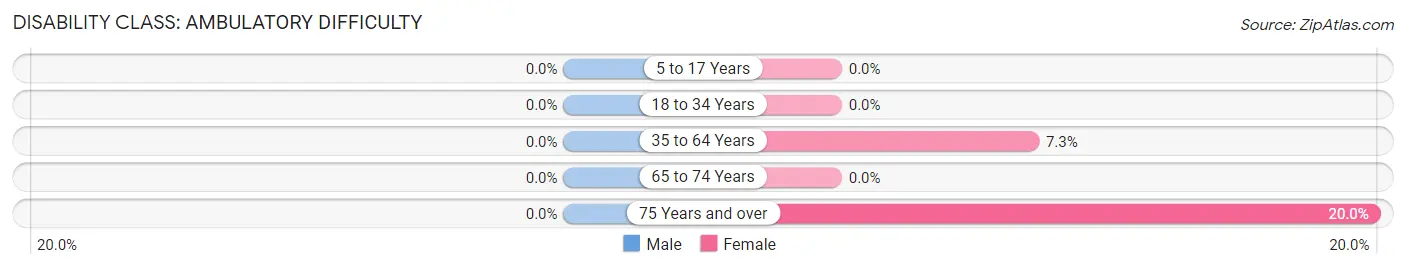
| Age Bracket | Male | Female |
| 5 to 17 Years | 0 (0.0%) | 0 (0.0%) |
| 18 to 34 Years | 0 (0.0%) | 0 (0.0%) |
| 35 to 64 Years | 0 (0.0%) | 6 (7.3%) |
| 65 to 74 Years | 0 (0.0%) | 0 (0.0%) |
| 75 Years and over | 0 (0.0%) | 4 (20.0%) |
Disability Class: Self-Care Difficulty
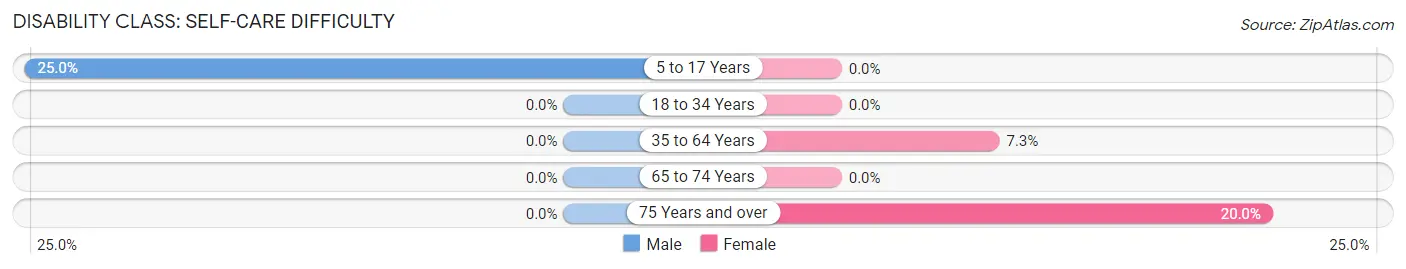
| Age Bracket | Male | Female |
| 5 to 17 Years | 5 (25.0%) | 0 (0.0%) |
| 18 to 34 Years | 0 (0.0%) | 0 (0.0%) |
| 35 to 64 Years | 0 (0.0%) | 6 (7.3%) |
| 65 to 74 Years | 0 (0.0%) | 0 (0.0%) |
| 75 Years and over | 0 (0.0%) | 4 (20.0%) |
Technology Access in Handley
Computing Device Access in Handley
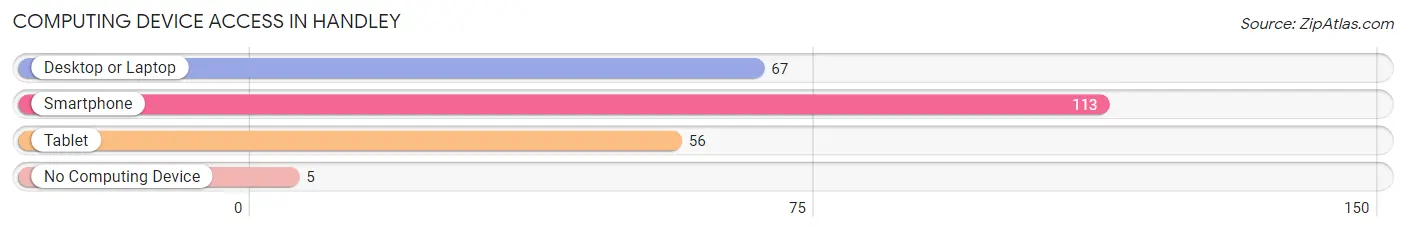
| Device Type | # Households | % Households |
| Desktop or Laptop | 67 | 54.9% |
| Smartphone | 113 | 92.6% |
| Tablet | 56 | 45.9% |
| No Computing Device | 5 | 4.1% |
| Total | 122 | 100.0% |
Internet Access in Handley
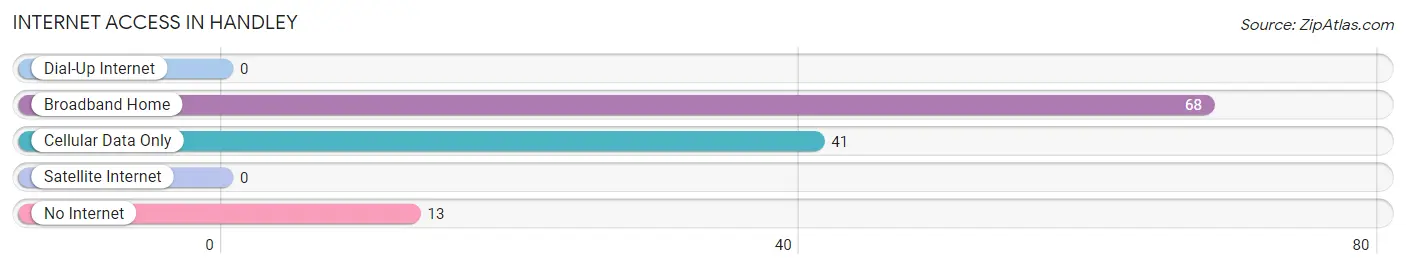
| Internet Type | # Households | % Households |
| Dial-Up Internet | 0 | 0.0% |
| Broadband Home | 68 | 55.7% |
| Cellular Data Only | 41 | 33.6% |
| Satellite Internet | 0 | 0.0% |
| No Internet | 13 | 10.7% |
| Total | 122 | 100.0% |
Handley Summary
Handley is a small unincorporated community located in the eastern panhandle of West Virginia, in Berkeley County. It is situated along the Potomac River, just south of the Maryland border. The community was established in the late 19th century and has a population of approximately 500 people.
History
Handley was founded in 1887 by William Handley, a local farmer and businessman. He purchased a large tract of land along the Potomac River and began to develop the area. He built a general store, a post office, and a school. The community grew slowly but steadily over the years, and by the early 20th century, it had become a thriving rural community.
The community was largely agricultural, with many of the residents working in the fields and orchards. The area was also known for its fishing and hunting, and the Potomac River was a popular destination for recreational activities.
In the mid-20th century, the area began to experience a decline in population as people moved away in search of better economic opportunities. The decline continued until the late 1990s, when the population began to stabilize.
Geography
Handley is located in the eastern panhandle of West Virginia, in Berkeley County. It is situated along the Potomac River, just south of the Maryland border. The community is surrounded by rolling hills and farmland, and is located approximately 25 miles from the state capital of Charleston.
The climate in Handley is temperate, with hot summers and cold winters. The average annual temperature is around 50 degrees Fahrenheit, and the average annual precipitation is around 40 inches.
Economy
The economy of Handley is largely based on agriculture and tourism. The area is known for its orchards and farms, and many of the residents are employed in the agricultural industry. The area is also popular with tourists, who come to enjoy the scenic beauty of the Potomac River and the surrounding countryside.
In addition to agriculture and tourism, Handley is home to several small businesses, including a general store, a post office, and a few restaurants. The community also has a small manufacturing sector, which produces a variety of products, including furniture and clothing.
Demographics
As of the 2010 census, the population of Handley was 498. The racial makeup of the community was 97.2% White, 0.6% African American, 0.2% Native American, 0.2% Asian, 0.2% from other races, and 1.8% from two or more races. The median household income was $41,250, and the median family income was $45,625.
The population of Handley is largely rural, with most of the residents living in single-family homes. The community is served by a single school, Handley Elementary School, which serves students in grades K-8. The community also has a small library and a few churches.
Common Questions
What is Per Capita Income in Handley?
Per Capita income in Handley is $20,887.
What is the Median Household income in Handley?
Median Household Income in Handley is $63,611.
What is Income or Wage Gap in Handley?
Income or Wage Gap in Handley is 9.8%.
Women in Handley earn 90.2 cents for every dollar earned by a man.
What is Inequality or Gini Index in Handley?
Inequality or Gini Index in Handley is 0.25.
What is the Total Population of Handley?
Total Population of Handley is 412.
What is the Total Male Population of Handley?
Total Male Population of Handley is 269.
What is the Total Female Population of Handley?
Total Female Population of Handley is 143.
What is the Ratio of Males per 100 Females in Handley?
There are 188.11 Males per 100 Females in Handley.
What is the Ratio of Females per 100 Males in Handley?
There are 53.16 Females per 100 Males in Handley.
What is the Median Population Age in Handley?
Median Population Age in Handley is 38.0 Years.
What is the Average Family Size in Handley
Average Family Size in Handley is 3.4 People.
What is the Average Household Size in Handley
Average Household Size in Handley is 3.4 People.
How Large is the Labor Force in Handley?
There are 162 People in the Labor Forcein in Handley.
What is the Percentage of People in the Labor Force in Handley?
52.4% of People are in the Labor Force in Handley.