Zip Codes with the Highest Poverty Level Among Children Under the Age of 5 in West Virginia
RELATED REPORTS & OPTIONS
Highest Poverty | Child 0-5
West Virginia
Compare Zip Codes
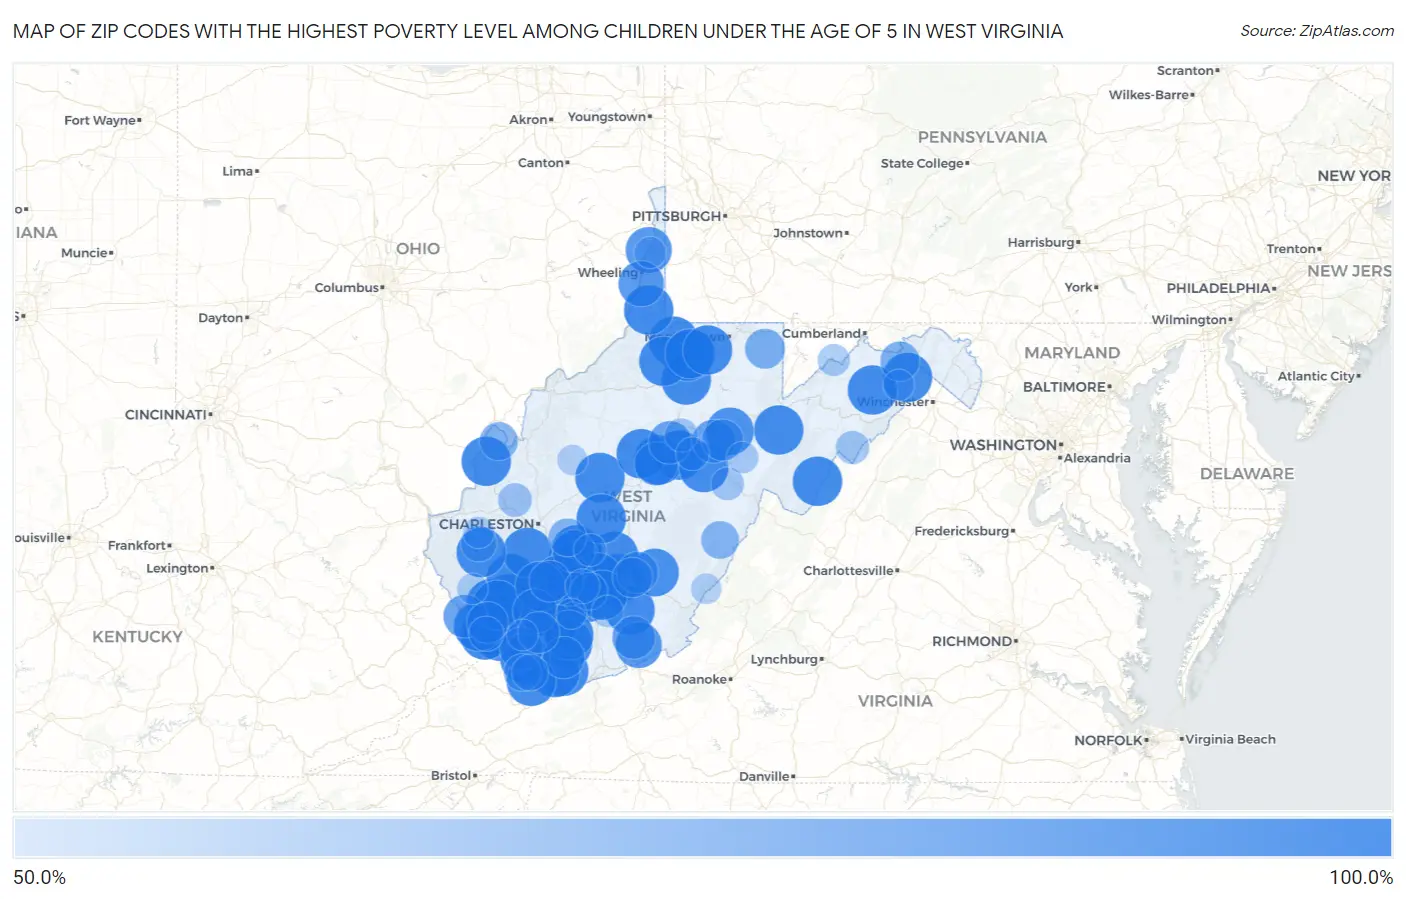
Map of Zip Codes with the Highest Poverty Level Among Children Under the Age of 5 in West Virginia
50.0%
100.0%
Zip Codes with the Highest Poverty Level Among Children Under the Age of 5 in West Virginia
| Zip Code | Child Poverty | vs State | vs National | |
| 1. | 25235 | 100.0% | 25.5%(+74.5)#1 | 18.1%(+81.9)#50 |
| 2. | 25692 | 100.0% | 25.5%(+74.5)#2 | 18.1%(+81.9)#54 |
| 3. | 25917 | 100.0% | 25.5%(+74.5)#3 | 18.1%(+81.9)#57 |
| 4. | 25831 | 100.0% | 25.5%(+74.5)#4 | 18.1%(+81.9)#62 |
| 5. | 25652 | 100.0% | 25.5%(+74.5)#5 | 18.1%(+81.9)#64 |
| 6. | 25646 | 100.0% | 25.5%(+74.5)#6 | 18.1%(+81.9)#66 |
| 7. | 26817 | 100.0% | 25.5%(+74.5)#7 | 18.1%(+81.9)#85 |
| 8. | 24854 | 100.0% | 25.5%(+74.5)#8 | 18.1%(+81.9)#91 |
| 9. | 25854 | 100.0% | 25.5%(+74.5)#9 | 18.1%(+81.9)#95 |
| 10. | 25186 | 100.0% | 25.5%(+74.5)#10 | 18.1%(+81.9)#104 |
| 11. | 25909 | 100.0% | 25.5%(+74.5)#11 | 18.1%(+81.9)#108 |
| 12. | 26802 | 100.0% | 25.5%(+74.5)#12 | 18.1%(+81.9)#109 |
| 13. | 25844 | 100.0% | 25.5%(+74.5)#13 | 18.1%(+81.9)#141 |
| 14. | 26585 | 100.0% | 25.5%(+74.5)#14 | 18.1%(+81.9)#143 |
| 15. | 25651 | 100.0% | 25.5%(+74.5)#15 | 18.1%(+81.9)#176 |
| 16. | 26761 | 100.0% | 25.5%(+74.5)#16 | 18.1%(+81.9)#178 |
| 17. | 25031 | 100.0% | 25.5%(+74.5)#17 | 18.1%(+81.9)#186 |
| 18. | 24808 | 100.0% | 25.5%(+74.5)#18 | 18.1%(+81.9)#188 |
| 19. | 25644 | 100.0% | 25.5%(+74.5)#19 | 18.1%(+81.9)#193 |
| 20. | 25108 | 100.0% | 25.5%(+74.5)#20 | 18.1%(+81.9)#196 |
| 21. | 24880 | 100.0% | 25.5%(+74.5)#21 | 18.1%(+81.9)#202 |
| 22. | 26369 | 100.0% | 25.5%(+74.5)#22 | 18.1%(+81.9)#204 |
| 23. | 25118 | 100.0% | 25.5%(+74.5)#23 | 18.1%(+81.9)#214 |
| 24. | 24726 | 100.0% | 25.5%(+74.5)#24 | 18.1%(+81.9)#216 |
| 25. | 26572 | 100.0% | 25.5%(+74.5)#25 | 18.1%(+81.9)#217 |
| 26. | 24871 | 100.0% | 25.5%(+74.5)#26 | 18.1%(+81.9)#226 |
| 27. | 25985 | 100.0% | 25.5%(+74.5)#27 | 18.1%(+81.9)#236 |
| 28. | 25019 | 100.0% | 25.5%(+74.5)#28 | 18.1%(+81.9)#238 |
| 29. | 24811 | 100.0% | 25.5%(+74.5)#29 | 18.1%(+81.9)#242 |
| 30. | 25106 | 100.0% | 25.5%(+74.5)#30 | 18.1%(+81.9)#268 |
| 31. | 25142 | 100.0% | 25.5%(+74.5)#31 | 18.1%(+81.9)#281 |
| 32. | 25161 | 100.0% | 25.5%(+74.5)#32 | 18.1%(+81.9)#284 |
| 33. | 25672 | 100.0% | 25.5%(+74.5)#33 | 18.1%(+81.9)#287 |
| 34. | 25540 | 100.0% | 25.5%(+74.5)#34 | 18.1%(+81.9)#293 |
| 35. | 26343 | 100.0% | 25.5%(+74.5)#35 | 18.1%(+81.9)#295 |
| 36. | 26039 | 100.0% | 25.5%(+74.5)#36 | 18.1%(+81.9)#297 |
| 37. | 26348 | 100.0% | 25.5%(+74.5)#37 | 18.1%(+81.9)#317 |
| 38. | 25826 | 100.0% | 25.5%(+74.5)#38 | 18.1%(+81.9)#332 |
| 39. | 26587 | 100.0% | 25.5%(+74.5)#39 | 18.1%(+81.9)#359 |
| 40. | 24894 | 100.0% | 25.5%(+74.5)#40 | 18.1%(+81.9)#366 |
| 41. | 25879 | 100.0% | 25.5%(+74.5)#41 | 18.1%(+81.9)#374 |
| 42. | 25688 | 100.0% | 25.5%(+74.5)#42 | 18.1%(+81.9)#381 |
| 43. | 25008 | 100.0% | 25.5%(+74.5)#43 | 18.1%(+81.9)#390 |
| 44. | 25647 | 100.0% | 25.5%(+74.5)#44 | 18.1%(+81.9)#400 |
| 45. | 25907 | 100.0% | 25.5%(+74.5)#45 | 18.1%(+81.9)#402 |
| 46. | 26631 | 100.0% | 25.5%(+74.5)#46 | 18.1%(+81.9)#424 |
| 47. | 25048 | 100.0% | 25.5%(+74.5)#47 | 18.1%(+81.9)#429 |
| 48. | 26224 | 100.0% | 25.5%(+74.5)#48 | 18.1%(+81.9)#447 |
| 49. | 26560 | 100.0% | 25.5%(+74.5)#49 | 18.1%(+81.9)#462 |
| 50. | 26615 | 100.0% | 25.5%(+74.5)#50 | 18.1%(+81.9)#502 |
| 51. | 25204 | 100.0% | 25.5%(+74.5)#51 | 18.1%(+81.9)#515 |
| 52. | 26289 | 100.0% | 25.5%(+74.5)#52 | 18.1%(+81.9)#559 |
| 53. | 25984 | 96.0% | 25.5%(+70.5)#53 | 18.1%(+77.9)#572 |
| 54. | 26275 | 95.5% | 25.5%(+70.0)#54 | 18.1%(+77.4)#576 |
| 55. | 24918 | 91.8% | 25.5%(+66.3)#55 | 18.1%(+73.7)#618 |
| 56. | 26030 | 91.7% | 25.5%(+66.2)#56 | 18.1%(+73.6)#620 |
| 57. | 26040 | 90.2% | 25.5%(+64.8)#57 | 18.1%(+72.2)#637 |
| 58. | 24827 | 87.5% | 25.5%(+62.0)#58 | 18.1%(+69.4)#663 |
| 59. | 26627 | 85.2% | 25.5%(+59.8)#59 | 18.1%(+67.2)#703 |
| 60. | 26267 | 84.3% | 25.5%(+58.8)#60 | 18.1%(+66.2)#725 |
| 61. | 25667 | 84.3% | 25.5%(+58.8)#61 | 18.1%(+66.2)#727 |
| 62. | 24844 | 84.0% | 25.5%(+58.5)#62 | 18.1%(+65.9)#731 |
| 63. | 26447 | 83.7% | 25.5%(+58.2)#63 | 18.1%(+65.7)#733 |
| 64. | 24935 | 83.5% | 25.5%(+58.0)#64 | 18.1%(+65.4)#736 |
| 65. | 25136 | 82.2% | 25.5%(+56.7)#65 | 18.1%(+64.1)#766 |
| 66. | 24868 | 81.4% | 25.5%(+55.9)#66 | 18.1%(+63.3)#782 |
| 67. | 25958 | 80.1% | 25.5%(+54.6)#67 | 18.1%(+62.0)#804 |
| 68. | 24818 | 80.0% | 25.5%(+54.5)#68 | 18.1%(+61.9)#808 |
| 69. | 26257 | 80.0% | 25.5%(+54.5)#69 | 18.1%(+61.9)#811 |
| 70. | 25209 | 80.0% | 25.5%(+54.5)#70 | 18.1%(+61.9)#817 |
| 71. | 25696 | 79.8% | 25.5%(+54.3)#71 | 18.1%(+61.8)#828 |
| 72. | 25962 | 76.4% | 25.5%(+50.9)#72 | 18.1%(+58.3)#915 |
| 73. | 26519 | 76.1% | 25.5%(+50.6)#73 | 18.1%(+58.0)#925 |
| 74. | 25434 | 75.2% | 25.5%(+49.7)#74 | 18.1%(+57.1)#949 |
| 75. | 25039 | 72.0% | 25.5%(+46.5)#75 | 18.1%(+53.9)#1,083 |
| 76. | 25253 | 71.9% | 25.5%(+46.4)#76 | 18.1%(+53.9)#1,092 |
| 77. | 24954 | 71.2% | 25.5%(+45.7)#77 | 18.1%(+53.1)#1,109 |
| 78. | 25880 | 70.2% | 25.5%(+44.7)#78 | 18.1%(+52.2)#1,137 |
| 79. | 24879 | 69.8% | 25.5%(+44.4)#79 | 18.1%(+51.8)#1,155 |
| 80. | 24892 | 67.7% | 25.5%(+42.3)#80 | 18.1%(+49.7)#1,240 |
| 81. | 25506 | 65.8% | 25.5%(+40.3)#81 | 18.1%(+47.7)#1,352 |
| 82. | 25678 | 63.8% | 25.5%(+38.3)#82 | 18.1%(+45.7)#1,463 |
| 83. | 25904 | 62.5% | 25.5%(+37.0)#83 | 18.1%(+44.4)#1,529 |
| 84. | 25011 | 61.5% | 25.5%(+36.1)#84 | 18.1%(+43.5)#1,593 |
| 85. | 26812 | 60.1% | 25.5%(+34.7)#85 | 18.1%(+42.1)#1,663 |
| 86. | 26372 | 60.0% | 25.5%(+34.5)#86 | 18.1%(+41.9)#1,687 |
| 87. | 26218 | 59.8% | 25.5%(+34.4)#87 | 18.1%(+41.8)#1,712 |
| 88. | 26273 | 59.2% | 25.5%(+33.7)#88 | 18.1%(+41.2)#1,751 |
| 89. | 25085 | 57.7% | 25.5%(+32.2)#89 | 18.1%(+39.6)#1,850 |
| 90. | 26750 | 57.1% | 25.5%(+31.7)#90 | 18.1%(+39.1)#1,887 |
| 91. | 25918 | 56.4% | 25.5%(+30.9)#91 | 18.1%(+38.3)#1,955 |
| 92. | 26253 | 56.4% | 25.5%(+30.9)#92 | 18.1%(+38.3)#1,956 |
| 93. | 26075 | 55.7% | 25.5%(+30.2)#93 | 18.1%(+37.6)#2,012 |
| 94. | 25571 | 55.6% | 25.5%(+30.1)#94 | 18.1%(+37.5)#2,024 |
| 95. | 26711 | 54.9% | 25.5%(+29.4)#95 | 18.1%(+36.9)#2,076 |
| 96. | 24839 | 54.8% | 25.5%(+29.4)#96 | 18.1%(+36.8)#2,078 |
| 97. | 25671 | 54.3% | 25.5%(+28.8)#97 | 18.1%(+36.2)#2,120 |
| 98. | 24986 | 53.5% | 25.5%(+28.1)#98 | 18.1%(+35.5)#2,187 |
| 99. | 25276 | 53.3% | 25.5%(+27.8)#99 | 18.1%(+35.3)#2,211 |
| 100. | 25865 | 53.3% | 25.5%(+27.8)#100 | 18.1%(+35.3)#2,217 |
Common Questions
What are the Top 10 Zip Codes with the Highest Poverty Level Among Children Under the Age of 5 in West Virginia?
Top 10 Zip Codes with the Highest Poverty Level Among Children Under the Age of 5 in West Virginia are:
What zip code has the Highest Poverty Level Among Children Under the Age of 5 in West Virginia?
25235 has the Highest Poverty Level Among Children Under the Age of 5 in West Virginia with 100.0%.
What is the Poverty Level Among Children Under the Age of 5 in the State of West Virginia?
Poverty Level Among Children Under the Age of 5 in West Virginia is 25.5%.
What is the Poverty Level Among Children Under the Age of 5 in the United States?
Poverty Level Among Children Under the Age of 5 in the United States is 18.1%.