Potawatomi Self-Care Disability
COMPARE
Potawatomi
Select to Compare
Self-Care Disability
Potawatomi Self-Care Disability
2.6%
SELF-CARE DISABILITY
0.3/ 100
METRIC RATING
257th/ 347
METRIC RANK
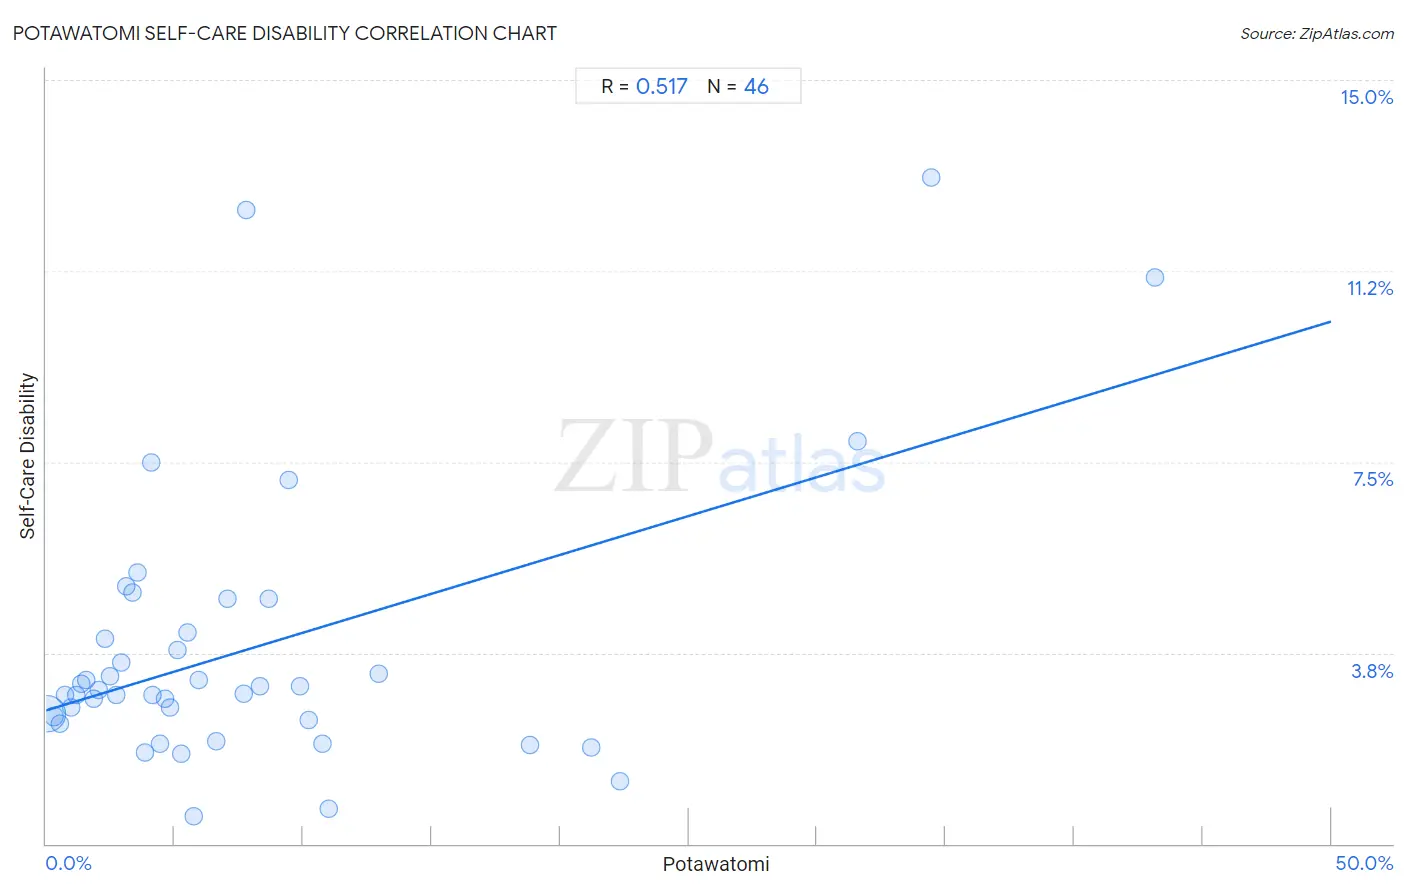
Potawatomi Self-Care Disability Correlation Chart
The statistical analysis conducted on geographies consisting of 117,741,431 people shows a substantial positive correlation between the proportion of Potawatomi and percentage of population with self-care disability in the United States with a correlation coefficient (R) of 0.517 and weighted average of 2.6%. On average, for every 1% (one percent) increase in Potawatomi within a typical geography, there is an increase of 0.15% in percentage of population with self-care disability.
It is essential to understand that the correlation between the percentage of Potawatomi and percentage of population with self-care disability does not imply a direct cause-and-effect relationship. It remains uncertain whether the presence of Potawatomi influences an upward or downward trend in the level of percentage of population with self-care disability within an area, or if Potawatomi simply ended up residing in those areas with higher or lower levels of percentage of population with self-care disability due to other factors.
Demographics Similar to Potawatomi by Self-Care Disability
In terms of self-care disability, the demographic groups most similar to Potawatomi are Nonimmigrants (2.6%, a difference of 0.070%), Immigrants from Belarus (2.6%, a difference of 0.14%), Chippewa (2.6%, a difference of 0.18%), Immigrants from Central America (2.6%, a difference of 0.20%), and Arapaho (2.6%, a difference of 0.20%).
| Demographics | Rating | Rank | Self-Care Disability |
| Portuguese | 0.4 /100 | #250 | Tragic 2.6% |
| Immigrants from Liberia | 0.4 /100 | #251 | Tragic 2.6% |
| Immigrants from Bangladesh | 0.4 /100 | #252 | Tragic 2.6% |
| Immigrants from Haiti | 0.3 /100 | #253 | Tragic 2.6% |
| Haitians | 0.3 /100 | #254 | Tragic 2.6% |
| Tsimshian | 0.3 /100 | #255 | Tragic 2.6% |
| Immigrants from Central America | 0.3 /100 | #256 | Tragic 2.6% |
| Potawatomi | 0.3 /100 | #257 | Tragic 2.6% |
| Nonimmigrants | 0.3 /100 | #258 | Tragic 2.6% |
| Immigrants from Belarus | 0.2 /100 | #259 | Tragic 2.6% |
| Chippewa | 0.2 /100 | #260 | Tragic 2.6% |
| Arapaho | 0.2 /100 | #261 | Tragic 2.6% |
| Shoshone | 0.2 /100 | #262 | Tragic 2.7% |
| Immigrants from Latin America | 0.2 /100 | #263 | Tragic 2.7% |
| Immigrants from Iran | 0.2 /100 | #264 | Tragic 2.7% |
Potawatomi Self-Care Disability Correlation Summary
| Measurement | Potawatomi Data | Self-Care Disability Data |
| Minimum | 0.027% | 0.54% |
| Maximum | 43.2% | 13.1% |
| Range | 43.1% | 12.5% |
| Mean | 8.0% | 3.8% |
| Median | 5.0% | 3.0% |
| Interquartile 25% (IQ1) | 2.5% | 2.4% |
| Interquartile 75% (IQ3) | 9.4% | 4.2% |
| Interquartile Range (IQR) | 7.0% | 1.7% |
| Standard Deviation (Sample) | 9.2% | 2.7% |
| Standard Deviation (Population) | 9.1% | 2.7% |
Correlation Details
| Potawatomi Percentile | Sample Size | Self-Care Disability |
[ 0.0% - 0.5% ] 0.027% | 110,244,312 | 2.5% |
[ 0.0% - 0.5% ] 0.29% | 5,310,739 | 2.5% |
[ 0.5% - 1.0% ] 0.53% | 1,024,461 | 2.4% |
[ 0.5% - 1.0% ] 0.73% | 399,028 | 2.9% |
[ 0.5% - 1.0% ] 0.95% | 314,092 | 2.7% |
[ 1.0% - 1.5% ] 1.17% | 92,346 | 2.9% |
[ 1.0% - 1.5% ] 1.37% | 63,695 | 3.1% |
[ 1.5% - 2.0% ] 1.57% | 64,221 | 3.2% |
[ 1.5% - 2.0% ] 1.86% | 30,104 | 2.9% |
[ 2.0% - 2.5% ] 2.04% | 50,335 | 3.0% |
[ 2.0% - 2.5% ] 2.26% | 26,288 | 4.0% |
[ 2.0% - 2.5% ] 2.47% | 47,216 | 3.3% |
[ 2.5% - 3.0% ] 2.71% | 8,483 | 2.9% |
[ 2.5% - 3.0% ] 2.94% | 7,007 | 3.6% |
[ 3.0% - 3.5% ] 3.13% | 4,861 | 5.1% |
[ 3.0% - 3.5% ] 3.37% | 4,515 | 4.9% |
[ 3.5% - 4.0% ] 3.55% | 2,957 | 5.3% |
[ 3.5% - 4.0% ] 3.84% | 1,665 | 1.8% |
[ 4.0% - 4.5% ] 4.08% | 147 | 7.5% |
[ 4.0% - 4.5% ] 4.15% | 3,494 | 2.9% |
[ 4.0% - 4.5% ] 4.40% | 1,998 | 2.0% |
[ 4.5% - 5.0% ] 4.62% | 8,745 | 2.9% |
[ 4.5% - 5.0% ] 4.83% | 5,757 | 2.7% |
[ 5.0% - 5.5% ] 5.08% | 118 | 3.8% |
[ 5.0% - 5.5% ] 5.24% | 2,081 | 1.8% |
[ 5.0% - 5.5% ] 5.50% | 4,948 | 4.2% |
[ 5.5% - 6.0% ] 5.74% | 802 | 0.54% |
[ 5.5% - 6.0% ] 5.95% | 4,436 | 3.2% |
[ 6.5% - 7.0% ] 6.61% | 772 | 2.0% |
[ 7.0% - 7.5% ] 7.06% | 2,607 | 4.8% |
[ 7.5% - 8.0% ] 7.69% | 221 | 3.0% |
[ 7.5% - 8.0% ] 7.79% | 308 | 12.5% |
[ 8.0% - 8.5% ] 8.33% | 240 | 3.1% |
[ 8.5% - 9.0% ] 8.67% | 773 | 4.8% |
[ 9.0% - 9.5% ] 9.43% | 244 | 7.1% |
[ 9.5% - 10.0% ] 9.86% | 487 | 3.1% |
[ 10.0% - 10.5% ] 10.20% | 49 | 2.4% |
[ 10.5% - 11.0% ] 10.73% | 382 | 2.0% |
[ 10.5% - 11.0% ] 10.99% | 182 | 0.68% |
[ 12.5% - 13.0% ] 12.93% | 495 | 3.3% |
[ 18.5% - 19.0% ] 18.85% | 2,462 | 1.9% |
[ 21.0% - 21.5% ] 21.23% | 1,404 | 1.9% |
[ 22.0% - 22.5% ] 22.33% | 1,702 | 1.2% |
[ 31.5% - 32.0% ] 31.58% | 38 | 7.9% |
[ 34.0% - 34.5% ] 34.45% | 119 | 13.1% |
[ 43.0% - 43.5% ] 43.16% | 95 | 11.1% |