Potawatomi vs Immigrants from Scotland 3 or more Vehicles in Household
COMPARE
Potawatomi
Immigrants from Scotland
3 or more Vehicles in Household
3 or more Vehicles in Household Comparison
Potawatomi
Immigrants from Scotland
21.9%
3 OR MORE VEHICLES IN HOUSEHOLD
99.8/ 100
METRIC RATING
71st/ 347
METRIC RANK
20.8%
3 OR MORE VEHICLES IN HOUSEHOLD
97.1/ 100
METRIC RATING
108th/ 347
METRIC RANK
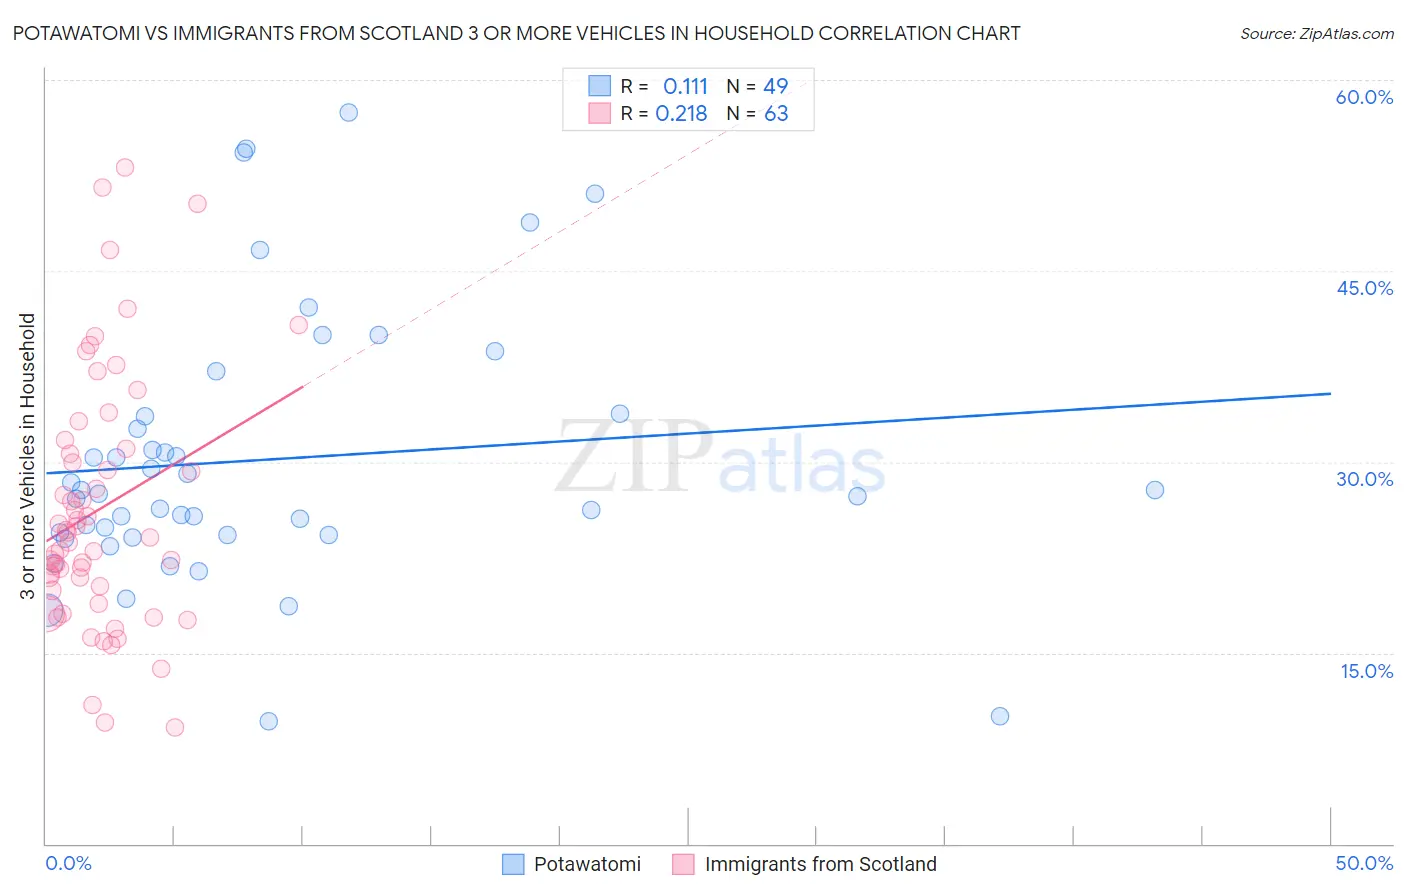
Potawatomi vs Immigrants from Scotland 3 or more Vehicles in Household Correlation Chart
The statistical analysis conducted on geographies consisting of 117,753,482 people shows a poor positive correlation between the proportion of Potawatomi and percentage of households with 3 or more vehicles available in the United States with a correlation coefficient (R) of 0.111 and weighted average of 21.9%. Similarly, the statistical analysis conducted on geographies consisting of 196,362,918 people shows a weak positive correlation between the proportion of Immigrants from Scotland and percentage of households with 3 or more vehicles available in the United States with a correlation coefficient (R) of 0.218 and weighted average of 20.8%, a difference of 5.1%.
3 or more Vehicles in Household Correlation Summary
| Measurement | Potawatomi | Immigrants from Scotland |
| Minimum | 9.7% | 9.1% |
| Maximum | 57.4% | 53.1% |
| Range | 47.8% | 44.0% |
| Mean | 30.2% | 26.2% |
| Median | 27.5% | 24.0% |
| Interquartile 25% (IQ1) | 24.2% | 19.9% |
| Interquartile 75% (IQ3) | 33.7% | 31.0% |
| Interquartile Range (IQR) | 9.4% | 11.1% |
| Standard Deviation (Sample) | 10.5% | 9.9% |
| Standard Deviation (Population) | 10.4% | 9.8% |
Similar Demographics by 3 or more Vehicles in Household
Demographics Similar to Potawatomi by 3 or more Vehicles in Household
In terms of 3 or more vehicles in household, the demographic groups most similar to Potawatomi are Bangladeshi (21.9%, a difference of 0.010%), Portuguese (21.8%, a difference of 0.18%), Creek (21.9%, a difference of 0.20%), British (21.9%, a difference of 0.23%), and Salvadoran (21.8%, a difference of 0.27%).
| Demographics | Rating | Rank | 3 or more Vehicles in Household |
| Immigrants | Taiwan | 99.9 /100 | #64 | Exceptional 22.1% |
| Pima | 99.9 /100 | #65 | Exceptional 22.0% |
| Northern Europeans | 99.9 /100 | #66 | Exceptional 22.0% |
| Alaskan Athabascans | 99.9 /100 | #67 | Exceptional 21.9% |
| British | 99.9 /100 | #68 | Exceptional 21.9% |
| Creek | 99.9 /100 | #69 | Exceptional 21.9% |
| Bangladeshis | 99.8 /100 | #70 | Exceptional 21.9% |
| Potawatomi | 99.8 /100 | #71 | Exceptional 21.9% |
| Portuguese | 99.8 /100 | #72 | Exceptional 21.8% |
| Salvadorans | 99.8 /100 | #73 | Exceptional 21.8% |
| Immigrants | Oceania | 99.8 /100 | #74 | Exceptional 21.8% |
| Japanese | 99.8 /100 | #75 | Exceptional 21.8% |
| Immigrants | Nonimmigrants | 99.8 /100 | #76 | Exceptional 21.8% |
| Irish | 99.8 /100 | #77 | Exceptional 21.8% |
| Czechoslovakians | 99.8 /100 | #78 | Exceptional 21.7% |
Demographics Similar to Immigrants from Scotland by 3 or more Vehicles in Household
In terms of 3 or more vehicles in household, the demographic groups most similar to Immigrants from Scotland are Filipino (20.8%, a difference of 0.060%), Immigrants from Germany (20.8%, a difference of 0.15%), Bolivian (20.8%, a difference of 0.19%), Asian (20.8%, a difference of 0.20%), and Immigrants from Micronesia (20.7%, a difference of 0.23%).
| Demographics | Rating | Rank | 3 or more Vehicles in Household |
| Blackfeet | 97.9 /100 | #101 | Exceptional 20.9% |
| Seminole | 97.8 /100 | #102 | Exceptional 20.9% |
| Dutch West Indians | 97.8 /100 | #103 | Exceptional 20.9% |
| Luxembourgers | 97.7 /100 | #104 | Exceptional 20.9% |
| Austrians | 97.5 /100 | #105 | Exceptional 20.9% |
| Bolivians | 97.4 /100 | #106 | Exceptional 20.8% |
| Immigrants | Germany | 97.4 /100 | #107 | Exceptional 20.8% |
| Immigrants | Scotland | 97.1 /100 | #108 | Exceptional 20.8% |
| Filipinos | 97.0 /100 | #109 | Exceptional 20.8% |
| Asians | 96.8 /100 | #110 | Exceptional 20.8% |
| Immigrants | Micronesia | 96.7 /100 | #111 | Exceptional 20.7% |
| Nicaraguans | 96.2 /100 | #112 | Exceptional 20.7% |
| Immigrants | England | 96.2 /100 | #113 | Exceptional 20.7% |
| Burmese | 95.8 /100 | #114 | Exceptional 20.6% |
| French Canadians | 95.0 /100 | #115 | Exceptional 20.6% |