Potawatomi vs Pima 3 or more Vehicles in Household
COMPARE
Potawatomi
Pima
3 or more Vehicles in Household
3 or more Vehicles in Household Comparison
Potawatomi
Pima
21.9%
3 OR MORE VEHICLES IN HOUSEHOLD
99.8/ 100
METRIC RATING
71st/ 347
METRIC RANK
22.0%
3 OR MORE VEHICLES IN HOUSEHOLD
99.9/ 100
METRIC RATING
65th/ 347
METRIC RANK
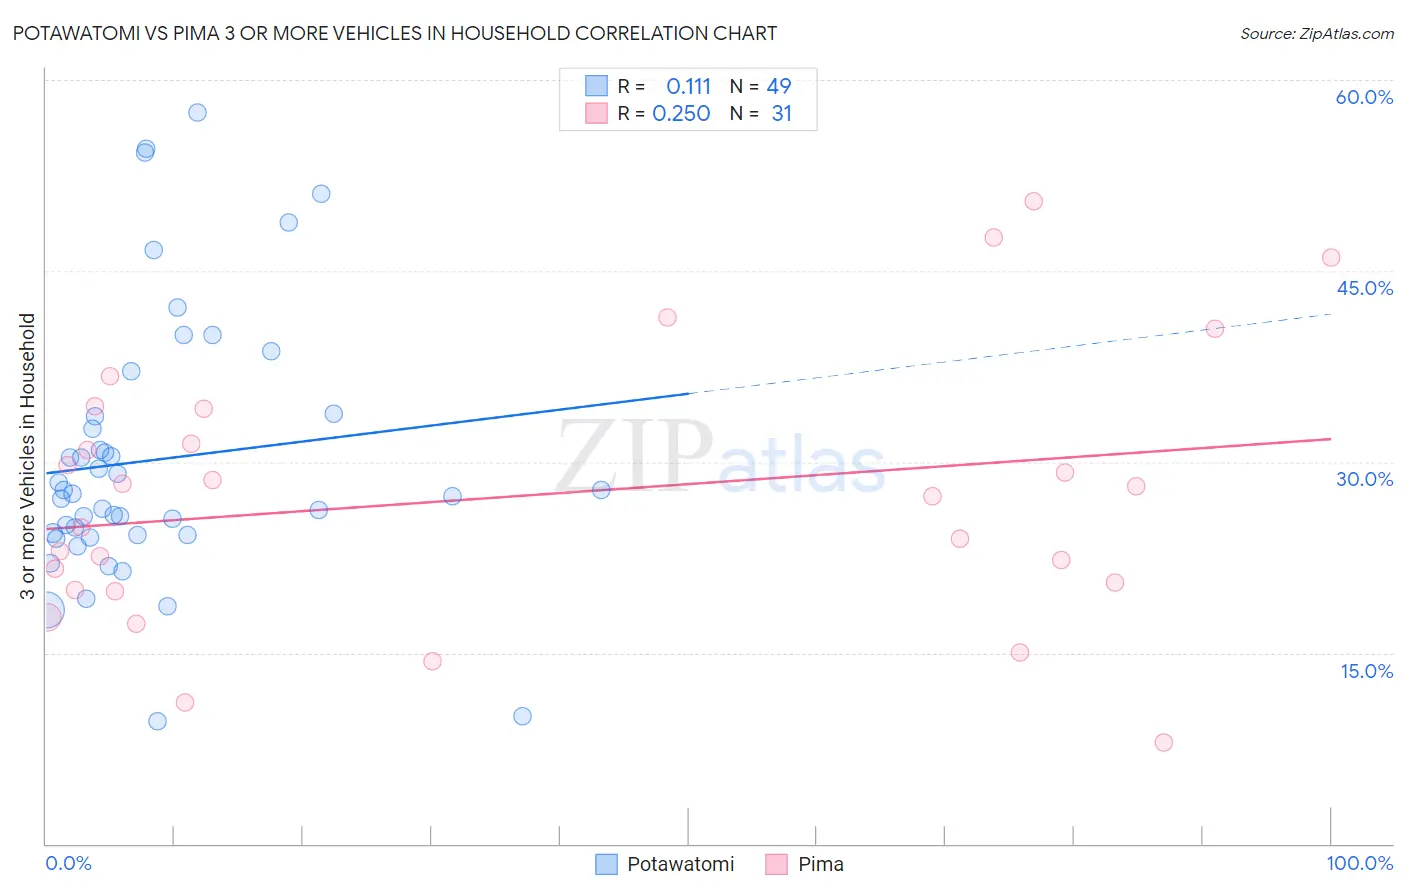
Potawatomi vs Pima 3 or more Vehicles in Household Correlation Chart
The statistical analysis conducted on geographies consisting of 117,753,482 people shows a poor positive correlation between the proportion of Potawatomi and percentage of households with 3 or more vehicles available in the United States with a correlation coefficient (R) of 0.111 and weighted average of 21.9%. Similarly, the statistical analysis conducted on geographies consisting of 61,538,722 people shows a weak positive correlation between the proportion of Pima and percentage of households with 3 or more vehicles available in the United States with a correlation coefficient (R) of 0.250 and weighted average of 22.0%, a difference of 0.78%.
3 or more Vehicles in Household Correlation Summary
| Measurement | Potawatomi | Pima |
| Minimum | 9.7% | 8.0% |
| Maximum | 57.4% | 50.5% |
| Range | 47.8% | 42.6% |
| Mean | 30.2% | 27.3% |
| Median | 27.5% | 27.3% |
| Interquartile 25% (IQ1) | 24.2% | 20.0% |
| Interquartile 75% (IQ3) | 33.7% | 34.1% |
| Interquartile Range (IQR) | 9.4% | 14.2% |
| Standard Deviation (Sample) | 10.5% | 10.5% |
| Standard Deviation (Population) | 10.4% | 10.3% |
Demographics Similar to Potawatomi and Pima by 3 or more Vehicles in Household
In terms of 3 or more vehicles in household, the demographic groups most similar to Potawatomi are Bangladeshi (21.9%, a difference of 0.010%), Portuguese (21.8%, a difference of 0.18%), Creek (21.9%, a difference of 0.20%), British (21.9%, a difference of 0.23%), and Salvadoran (21.8%, a difference of 0.27%). Similarly, the demographic groups most similar to Pima are Northern European (22.0%, a difference of 0.14%), Alaskan Athabascan (21.9%, a difference of 0.40%), Immigrants from Taiwan (22.1%, a difference of 0.42%), British (21.9%, a difference of 0.55%), and Creek (21.9%, a difference of 0.58%).
| Demographics | Rating | Rank | 3 or more Vehicles in Household |
| Spaniards | 100.0 /100 | #58 | Exceptional 22.3% |
| Navajo | 100.0 /100 | #59 | Exceptional 22.3% |
| Finns | 99.9 /100 | #60 | Exceptional 22.3% |
| Bhutanese | 99.9 /100 | #61 | Exceptional 22.2% |
| Fijians | 99.9 /100 | #62 | Exceptional 22.2% |
| Chickasaw | 99.9 /100 | #63 | Exceptional 22.2% |
| Immigrants | Taiwan | 99.9 /100 | #64 | Exceptional 22.1% |
| Pima | 99.9 /100 | #65 | Exceptional 22.0% |
| Northern Europeans | 99.9 /100 | #66 | Exceptional 22.0% |
| Alaskan Athabascans | 99.9 /100 | #67 | Exceptional 21.9% |
| British | 99.9 /100 | #68 | Exceptional 21.9% |
| Creek | 99.9 /100 | #69 | Exceptional 21.9% |
| Bangladeshis | 99.8 /100 | #70 | Exceptional 21.9% |
| Potawatomi | 99.8 /100 | #71 | Exceptional 21.9% |
| Portuguese | 99.8 /100 | #72 | Exceptional 21.8% |
| Salvadorans | 99.8 /100 | #73 | Exceptional 21.8% |
| Immigrants | Oceania | 99.8 /100 | #74 | Exceptional 21.8% |
| Japanese | 99.8 /100 | #75 | Exceptional 21.8% |
| Immigrants | Nonimmigrants | 99.8 /100 | #76 | Exceptional 21.8% |
| Irish | 99.8 /100 | #77 | Exceptional 21.8% |
| Czechoslovakians | 99.8 /100 | #78 | Exceptional 21.7% |