Potawatomi College, Under 1 year

COMPARE

Potawatomi
Race
Ancestry
AfghanAfricanAlaska NativeAlaskan AthabascanAlbanianAleutAlsatianAmericanApacheArabArapahoArgentineanArmenianAssyrian/Chaldean/SyriacAustralianAustrianBahamianBangladeshiBarbadianBasqueBelgianBelizeanBermudanBhutaneseBlackfeetBolivianBrazilianBritishBritish West IndianBulgarianBurmeseCajunCambodianCanadianCape VerdeanCarpatho RusynCelticCentral AmericanCentral American IndianCherokeeCheyenneChickasawChileanChineseChippewaChoctawColombianColvilleComancheCosta RicanCreeCreekCroatianCrowCubanCypriotCzechCzechoslovakianDanishDelawareDominicanDutchDutch West IndianEastern EuropeanEcuadorianEgyptianEnglishEstonianEthiopianEuropeanFijianFilipinoFinnishFrenchFrench American IndianFrench CanadianGermanGerman RussianGhanaianGreekGuamanian/ChamorroGuatemalanGuyaneseHaitianHmongHonduranHopiHoumaHungarianIcelanderIndian (Asian)IndonesianInupiatIranianIraqiIrishIroquoisIsraeliItalianJamaicanJapaneseJordanianKenyanKiowaKoreanLaotianLatvianLebaneseLiberianLithuanianLumbeeLuxembourgerMacedonianMalaysianMalteseMarshalleseMenomineeMexicanMexican American IndianMongolianMoroccanNative HawaiianNavajoNepaleseNew ZealanderNicaraguanNigerianNorthern EuropeanNorwegianOkinawanOsageOttawaPaiutePakistaniPalestinianPanamanianParaguayanPennsylvania GermanPeruvianPimaPolishPortuguesePotawatomiPuebloPuerto RicanPuget Sound SalishRomanianRussianSalvadoranSamoanScandinavianScotch-IrishScottishSeminoleSenegaleseSerbianShoshoneSierra LeoneanSiouxSlavicSlovakSloveneSomaliSouth AfricanSouth AmericanSouth American IndianSoviet UnionSpaniardSpanishSpanish AmericanSpanish American IndianSri LankanSubsaharan AfricanSudaneseSwedishSwissSyrianTaiwaneseThaiTlingit-HaidaTohono O'OdhamTonganTrinidadian and TobagonianTsimshianTurkishU.S. Virgin IslanderUgandanUkrainianUruguayanUteVenezuelanVietnameseWelshWest IndianYakamaYaquiYugoslavianYumanYup'ikZimbabwean
Immigration
NonimmigrantsImmigrantsAfghanistanAfricaAlbaniaArgentinaArmeniaAsiaAustraliaAustriaBahamasBangladeshBarbadosBelarusBelgiumBelizeBoliviaBosnia and HerzegovinaBrazilBulgariaBurma/MyanmarCabo VerdeCambodiaCameroonCanadaCaribbeanCentral AmericaChileChinaColombiaCongoCosta RicaCroatiaCubaCzechoslovakiaDenmarkDominicaDominican RepublicEastern AfricaEastern AsiaEastern EuropeEcuadorEgyptEl SalvadorEnglandEritreaEthiopiaEuropeFijiFranceGermanyGhanaGreeceGrenadaGuatemalaGuyanaHaitiHondurasHong KongHungaryIndiaIndonesiaIranIraqIrelandIsraelItalyJamaicaJapanJordanKazakhstanKenyaKoreaKuwaitLaosLatin AmericaLatviaLebanonLiberiaLithuaniaMalaysiaMexicoMicronesiaMiddle AfricaMoldovaMoroccoNepalNetherlandsNicaraguaNigeriaNorth AmericaNorth MacedoniaNorthern AfricaNorthern EuropeNorwayOceaniaPakistanPanamaPeruPhilippinesPolandPortugalRomaniaRussiaSaudi ArabiaScotlandSenegalSerbiaSierra LeoneSingaporeSomaliaSouth AfricaSouth AmericaSouth Central AsiaSouth Eastern AsiaSouthern EuropeSpainSri LankaSt. Vincent and the GrenadinesSudanSwedenSwitzerlandSyriaTaiwanThailandTrinidad and TobagoTurkeyUgandaUkraineUruguayUzbekistanVenezuelaVietnamWest IndiesWestern AfricaWestern AsiaWestern EuropeYemenZaireZimbabweAzores
Select to Compare
Race
Ancestry
AfghanAfricanAlaska NativeAlaskan AthabascanAlbanianAleutAlsatianAmericanApacheArabArapahoArgentineanArmenianAssyrian/Chaldean/SyriacAustralianAustrianBahamianBangladeshiBarbadianBasqueBelgianBelizeanBermudanBhutaneseBlackfeetBolivianBrazilianBritishBritish West IndianBulgarianBurmeseCajunCambodianCanadianCape VerdeanCarpatho RusynCelticCentral AmericanCentral American IndianCherokeeCheyenneChickasawChileanChineseChippewaChoctawColombianColvilleComancheCosta RicanCreeCreekCroatianCrowCubanCypriotCzechCzechoslovakianDanishDelawareDominicanDutchDutch West IndianEastern EuropeanEcuadorianEgyptianEnglishEstonianEthiopianEuropeanFijianFilipinoFinnishFrenchFrench American IndianFrench CanadianGermanGerman RussianGhanaianGreekGuamanian/ChamorroGuatemalanGuyaneseHaitianHmongHonduranHopiHoumaHungarianIcelanderIndian (Asian)IndonesianInupiatIranianIraqiIrishIroquoisIsraeliItalianJamaicanJapaneseJordanianKenyanKiowaKoreanLaotianLatvianLebaneseLiberianLithuanianLumbeeLuxembourgerMacedonianMalaysianMalteseMarshalleseMenomineeMexicanMexican American IndianMongolianMoroccanNative HawaiianNavajoNepaleseNew ZealanderNicaraguanNigerianNorthern EuropeanNorwegianOkinawanOsageOttawaPaiutePakistaniPalestinianPanamanianParaguayanPennsylvania GermanPeruvianPimaPolishPortuguesePuebloPuerto RicanPuget Sound SalishRomanianRussianSalvadoranSamoanScandinavianScotch-IrishScottishSeminoleSenegaleseSerbianShoshoneSierra LeoneanSiouxSlavicSlovakSloveneSomaliSouth AfricanSouth AmericanSouth American IndianSoviet UnionSpaniardSpanishSpanish AmericanSpanish American IndianSri LankanSubsaharan AfricanSudaneseSwedishSwissSyrianTaiwaneseThaiTlingit-HaidaTohono O'OdhamTonganTrinidadian and TobagonianTsimshianTurkishU.S. Virgin IslanderUgandanUkrainianUruguayanUteVenezuelanVietnameseWelshWest IndianYakamaYaquiYugoslavianYumanYup'ikZimbabwean
Immigration
NonimmigrantsImmigrantsAfghanistanAfricaAlbaniaArgentinaArmeniaAsiaAustraliaAustriaBahamasBangladeshBarbadosBelarusBelgiumBelizeBoliviaBosnia and HerzegovinaBrazilBulgariaBurma/MyanmarCabo VerdeCambodiaCameroonCanadaCaribbeanCentral AmericaChileChinaColombiaCongoCosta RicaCroatiaCubaCzechoslovakiaDenmarkDominicaDominican RepublicEastern AfricaEastern AsiaEastern EuropeEcuadorEgyptEl SalvadorEnglandEritreaEthiopiaEuropeFijiFranceGermanyGhanaGreeceGrenadaGuatemalaGuyanaHaitiHondurasHong KongHungaryIndiaIndonesiaIranIraqIrelandIsraelItalyJamaicaJapanJordanKazakhstanKenyaKoreaKuwaitLaosLatin AmericaLatviaLebanonLiberiaLithuaniaMalaysiaMexicoMicronesiaMiddle AfricaMoldovaMoroccoNepalNetherlandsNicaraguaNigeriaNorth AmericaNorth MacedoniaNorthern AfricaNorthern EuropeNorwayOceaniaPakistanPanamaPeruPhilippinesPolandPortugalRomaniaRussiaSaudi ArabiaScotlandSenegalSerbiaSierra LeoneSingaporeSomaliaSouth AfricaSouth AmericaSouth Central AsiaSouth Eastern AsiaSouthern EuropeSpainSri LankaSt. Vincent and the GrenadinesSudanSwedenSwitzerlandSyriaTaiwanThailandTrinidad and TobagoTurkeyUgandaUkraineUruguayUzbekistanVenezuelaVietnamWest IndiesWestern AfricaWestern AsiaWestern EuropeYemenZaireZimbabweAzores
College, Under 1 year
Income
Poverty
Unemployment
Labor Participation
Family Structure
Vehicle Availability
Education Level
Disability

Potawatomi College, Under 1 year
Tragic

61.8%
COLLEGE, UNDER 1 YEAR
0.6/ 100
METRIC RATING
248th/ 347
METRIC RANK

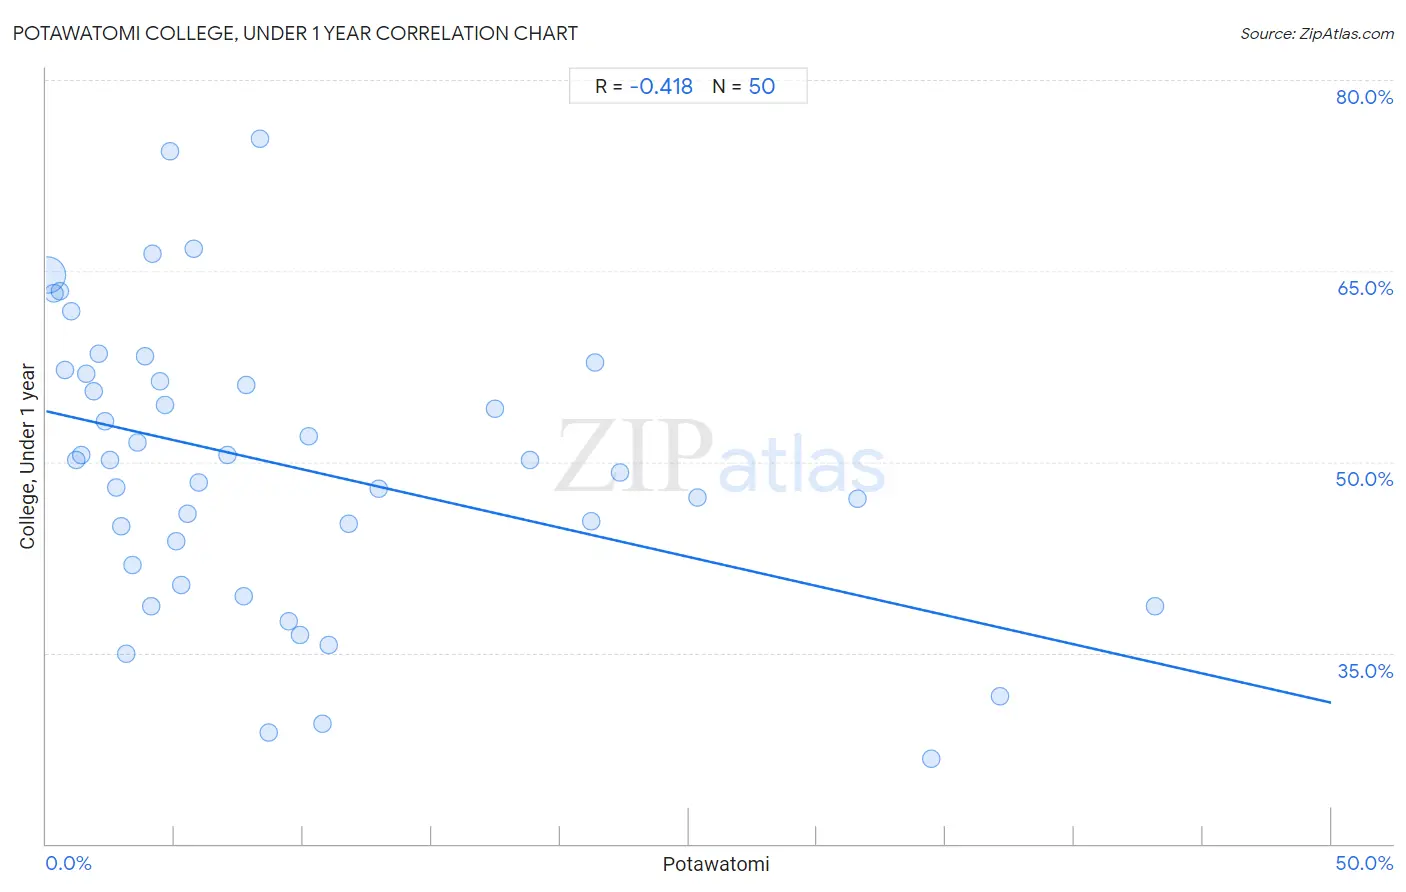
Potawatomi College, Under 1 year Correlation Chart

The statistical analysis conducted on geographies consisting of 117,773,444 people shows a moderate negative correlation between the proportion of Potawatomi and percentage of population with at least college, under 1 year education in the United States with a correlation coefficient (R) of -0.418 and weighted average of 61.8%. On average, for every 1% (one percent) increase in Potawatomi within a typical geography, there is a decrease of 0.46% in percentage of population with at least college, under 1 year education.
Potawatomi College, Under 1 year
It is essential to understand that the correlation between the percentage of Potawatomi and percentage of population with at least college, under 1 year education does not imply a direct cause-and-effect relationship. It remains uncertain whether the presence of Potawatomi influences an upward or downward trend in the level of percentage of population with at least college, under 1 year education within an area, or if Potawatomi simply ended up residing in those areas with higher or lower levels of percentage of population with at least college, under 1 year education due to other factors.

Demographics Similar to Potawatomi by College, Under 1 year

In terms of college, under 1 year, the demographic groups most similar to Potawatomi are Vietnamese (61.7%, a difference of 0.16%), Immigrants from Congo (61.7%, a difference of 0.16%), Immigrants from Liberia (61.9%, a difference of 0.23%), Marshallese (61.9%, a difference of 0.26%), and Immigrants from Micronesia (61.5%, a difference of 0.35%).
DemographicsRating | RankCollege, Under 1 year
Ottawa
1.1
/100
|
#241
Tragic
62.2%
Malaysians
1.1
/100
|
#242
Tragic
62.2%
Hawaiians
1.1
/100
|
#243
Tragic
62.1%
Colville
1.0
/100
|
#244
Tragic
62.1%
Delaware
0.9
/100
|
#245
Tragic
62.1%
Marshallese
0.8
/100
|
#246
Tragic
61.9%
Immigrants from Liberia
0.8
/100
|
#247
Tragic
61.9%
Potawatomi
0.6
/100
|
#248
Tragic
61.8%
Vietnamese
0.5
/100
|
#249
Tragic
61.7%
Immigrants from Congo
0.5
/100
|
#250
Tragic
61.7%
Immigrants from Micronesia
0.5
/100
|
#251
Tragic
61.5%
West Indians
0.4
/100
|
#252
Tragic
61.5%
Japanese
0.4
/100
|
#253
Tragic
61.5%
Immigrants from Cambodia
0.4
/100
|
#254
Tragic
61.5%
Comanche
0.4
/100
|
#255
Tragic
61.4%

Potawatomi College, Under 1 year Correlation Summary

MeasurementPotawatomi DataCollege, Under 1 year Data
Minimum0.027%26.7%
Maximum43.2%75.4%
Range43.1%48.7%
Mean9.5%49.6%
Median5.4%50.1%
Interquartile 25% (IQ1)2.7%41.9%
Interquartile 75% (IQ3)11.0%56.9%
Interquartile Range (IQR)8.3%15.0%
Standard Deviation (Sample)10.3%11.2%
Standard Deviation (Population)10.1%11.1%

Correlation Details

Potawatomi PercentileSample SizeCollege, Under 1 year
[
0.0%
-
0.5%
]
0.027%
110,261,08964.6%
[
0.0%
-
0.5%
]
0.29%
5,317,39663.2%
[
0.5%
-
1.0%
]
0.53%
1,024,89363.4%
[
0.5%
-
1.0%
]
0.73%
402,43357.2%
[
0.5%
-
1.0%
]
0.95%
316,24061.8%
[
1.0%
-
1.5%
]
1.17%
92,34650.1%
[
1.0%
-
1.5%
]
1.37%
64,28950.5%
[
1.5%
-
2.0%
]
1.57%
64,39556.9%
[
1.5%
-
2.0%
]
1.86%
30,27655.5%
[
2.0%
-
2.5%
]
2.04%
51,11058.5%
[
2.0%
-
2.5%
]
2.26%
26,28853.2%
[
2.0%
-
2.5%
]
2.47%
47,21650.1%
[
2.5%
-
3.0%
]
2.71%
8,62648.0%
[
2.5%
-
3.0%
]
2.94%
7,00745.0%
[
3.0%
-
3.5%
]
3.13%
5,02035.0%
[
3.0%
-
3.5%
]
3.37%
4,68941.9%
[
3.5%
-
4.0%
]
3.55%
2,95751.5%
[
3.5%
-
4.0%
]
3.84%
1,69258.3%
[
4.0%
-
4.5%
]
4.08%
14738.7%
[
4.0%
-
4.5%
]
4.15%
3,49466.4%
[
4.0%
-
4.5%
]
4.41%
2,13256.3%
[
4.5%
-
5.0%
]
4.62%
8,74554.5%
[
4.5%
-
5.0%
]
4.83%
5,75774.4%
[
5.0%
-
5.5%
]
5.06%
15843.7%
[
5.0%
-
5.5%
]
5.24%
2,08140.4%
[
5.0%
-
5.5%
]
5.50%
4,94845.9%
[
5.5%
-
6.0%
]
5.73%
99466.7%
[
5.5%
-
6.0%
]
5.95%
4,57248.4%
[
7.0%
-
7.5%
]
7.06%
2,60750.6%
[
7.5%
-
8.0%
]
7.69%
22139.4%
[
7.5%
-
8.0%
]
7.80%
34656.0%
[
8.0%
-
8.5%
]
8.33%
24075.4%
[
8.5%
-
9.0%
]
8.67%
77328.8%
[
9.0%
-
9.5%
]
9.43%
24437.5%
[
9.5%
-
10.0%
]
9.86%
48736.4%
[
10.0%
-
10.5%
]
10.20%
4952.0%
[
10.5%
-
11.0%
]
10.73%
38229.4%
[
10.5%
-
11.0%
]
10.99%
18235.6%
[
11.5%
-
12.0%
]
11.76%
13645.1%
[
12.5%
-
13.0%
]
12.93%
49547.9%
[
17.0%
-
17.5%
]
17.48%
14354.1%
[
18.5%
-
19.0%
]
18.85%
2,46250.1%
[
21.0%
-
21.5%
]
21.23%
1,40445.4%
[
21.0%
-
21.5%
]
21.37%
11757.8%
[
22.0%
-
22.5%
]
22.33%
1,70249.2%
[
25.0%
-
25.5%
]
25.33%
15047.2%
[
31.5%
-
32.0%
]
31.58%
3847.1%
[
34.0%
-
34.5%
]
34.45%
11926.7%
[
37.0%
-
37.5%
]
37.10%
6231.6%
[
43.0%
-
43.5%
]
43.16%
9538.6%