Potawatomi Unemployment Among Women with Children Ages 6 to 17 years

COMPARE

Potawatomi
Race
Ancestry
AfghanAfricanAlaska NativeAlaskan AthabascanAlbanianAleutAlsatianAmericanApacheArabArapahoArgentineanArmenianAssyrian/Chaldean/SyriacAustralianAustrianBahamianBangladeshiBarbadianBasqueBelgianBelizeanBermudanBhutaneseBlackfeetBolivianBrazilianBritishBritish West IndianBulgarianBurmeseCajunCambodianCanadianCape VerdeanCarpatho RusynCelticCentral AmericanCentral American IndianCherokeeCheyenneChickasawChileanChineseChippewaChoctawColombianColvilleComancheCosta RicanCreeCreekCroatianCrowCubanCypriotCzechCzechoslovakianDanishDelawareDominicanDutchDutch West IndianEastern EuropeanEcuadorianEgyptianEnglishEstonianEthiopianEuropeanFijianFilipinoFinnishFrenchFrench American IndianFrench CanadianGermanGerman RussianGhanaianGreekGuamanian/ChamorroGuatemalanGuyaneseHaitianHmongHonduranHopiHoumaHungarianIcelanderIndian (Asian)IndonesianInupiatIranianIraqiIrishIroquoisIsraeliItalianJamaicanJapaneseJordanianKenyanKiowaKoreanLaotianLatvianLebaneseLiberianLithuanianLumbeeLuxembourgerMacedonianMalaysianMalteseMarshalleseMenomineeMexicanMexican American IndianMongolianMoroccanNative HawaiianNavajoNepaleseNew ZealanderNicaraguanNigerianNorthern EuropeanNorwegianOkinawanOsageOttawaPaiutePakistaniPalestinianPanamanianParaguayanPennsylvania GermanPeruvianPimaPolishPortuguesePotawatomiPuebloPuerto RicanPuget Sound SalishRomanianRussianSalvadoranSamoanScandinavianScotch-IrishScottishSeminoleSenegaleseSerbianShoshoneSierra LeoneanSiouxSlavicSlovakSloveneSomaliSouth AfricanSouth AmericanSouth American IndianSoviet UnionSpaniardSpanishSpanish AmericanSpanish American IndianSri LankanSubsaharan AfricanSudaneseSwedishSwissSyrianTaiwaneseThaiTlingit-HaidaTohono O'OdhamTonganTrinidadian and TobagonianTsimshianTurkishU.S. Virgin IslanderUgandanUkrainianUruguayanUteVenezuelanVietnameseWelshWest IndianYakamaYaquiYugoslavianYumanYup'ikZimbabwean
Immigration
NonimmigrantsImmigrantsAfghanistanAfricaAlbaniaArgentinaArmeniaAsiaAustraliaAustriaBahamasBangladeshBarbadosBelarusBelgiumBelizeBoliviaBosnia and HerzegovinaBrazilBulgariaBurma/MyanmarCabo VerdeCambodiaCameroonCanadaCaribbeanCentral AmericaChileChinaColombiaCongoCosta RicaCroatiaCubaCzechoslovakiaDenmarkDominicaDominican RepublicEastern AfricaEastern AsiaEastern EuropeEcuadorEgyptEl SalvadorEnglandEritreaEthiopiaEuropeFijiFranceGermanyGhanaGreeceGrenadaGuatemalaGuyanaHaitiHondurasHong KongHungaryIndiaIndonesiaIranIraqIrelandIsraelItalyJamaicaJapanJordanKazakhstanKenyaKoreaKuwaitLaosLatin AmericaLatviaLebanonLiberiaLithuaniaMalaysiaMexicoMicronesiaMiddle AfricaMoldovaMoroccoNepalNetherlandsNicaraguaNigeriaNorth AmericaNorth MacedoniaNorthern AfricaNorthern EuropeNorwayOceaniaPakistanPanamaPeruPhilippinesPolandPortugalRomaniaRussiaSaudi ArabiaScotlandSenegalSerbiaSierra LeoneSingaporeSomaliaSouth AfricaSouth AmericaSouth Central AsiaSouth Eastern AsiaSouthern EuropeSpainSri LankaSt. Vincent and the GrenadinesSudanSwedenSwitzerlandSyriaTaiwanThailandTrinidad and TobagoTurkeyUgandaUkraineUruguayUzbekistanVenezuelaVietnamWest IndiesWestern AfricaWestern AsiaWestern EuropeYemenZaireZimbabweAzores
Select to Compare
Race
Ancestry
AfghanAfricanAlaska NativeAlaskan AthabascanAlbanianAleutAlsatianAmericanApacheArabArapahoArgentineanArmenianAssyrian/Chaldean/SyriacAustralianAustrianBahamianBangladeshiBarbadianBasqueBelgianBelizeanBermudanBhutaneseBlackfeetBolivianBrazilianBritishBritish West IndianBulgarianBurmeseCajunCambodianCanadianCape VerdeanCarpatho RusynCelticCentral AmericanCentral American IndianCherokeeCheyenneChickasawChileanChineseChippewaChoctawColombianColvilleComancheCosta RicanCreeCreekCroatianCrowCubanCypriotCzechCzechoslovakianDanishDelawareDominicanDutchDutch West IndianEastern EuropeanEcuadorianEgyptianEnglishEstonianEthiopianEuropeanFijianFilipinoFinnishFrenchFrench American IndianFrench CanadianGermanGerman RussianGhanaianGreekGuamanian/ChamorroGuatemalanGuyaneseHaitianHmongHonduranHopiHoumaHungarianIcelanderIndian (Asian)IndonesianInupiatIranianIraqiIrishIroquoisIsraeliItalianJamaicanJapaneseJordanianKenyanKiowaKoreanLaotianLatvianLebaneseLiberianLithuanianLumbeeLuxembourgerMacedonianMalaysianMalteseMarshalleseMenomineeMexicanMexican American IndianMongolianMoroccanNative HawaiianNavajoNepaleseNew ZealanderNicaraguanNigerianNorthern EuropeanNorwegianOkinawanOsageOttawaPaiutePakistaniPalestinianPanamanianParaguayanPennsylvania GermanPeruvianPimaPolishPortuguesePuebloPuerto RicanPuget Sound SalishRomanianRussianSalvadoranSamoanScandinavianScotch-IrishScottishSeminoleSenegaleseSerbianShoshoneSierra LeoneanSiouxSlavicSlovakSloveneSomaliSouth AfricanSouth AmericanSouth American IndianSoviet UnionSpaniardSpanishSpanish AmericanSpanish American IndianSri LankanSubsaharan AfricanSudaneseSwedishSwissSyrianTaiwaneseThaiTlingit-HaidaTohono O'OdhamTonganTrinidadian and TobagonianTsimshianTurkishU.S. Virgin IslanderUgandanUkrainianUruguayanUteVenezuelanVietnameseWelshWest IndianYakamaYaquiYugoslavianYumanYup'ikZimbabwean
Immigration
NonimmigrantsImmigrantsAfghanistanAfricaAlbaniaArgentinaArmeniaAsiaAustraliaAustriaBahamasBangladeshBarbadosBelarusBelgiumBelizeBoliviaBosnia and HerzegovinaBrazilBulgariaBurma/MyanmarCabo VerdeCambodiaCameroonCanadaCaribbeanCentral AmericaChileChinaColombiaCongoCosta RicaCroatiaCubaCzechoslovakiaDenmarkDominicaDominican RepublicEastern AfricaEastern AsiaEastern EuropeEcuadorEgyptEl SalvadorEnglandEritreaEthiopiaEuropeFijiFranceGermanyGhanaGreeceGrenadaGuatemalaGuyanaHaitiHondurasHong KongHungaryIndiaIndonesiaIranIraqIrelandIsraelItalyJamaicaJapanJordanKazakhstanKenyaKoreaKuwaitLaosLatin AmericaLatviaLebanonLiberiaLithuaniaMalaysiaMexicoMicronesiaMiddle AfricaMoldovaMoroccoNepalNetherlandsNicaraguaNigeriaNorth AmericaNorth MacedoniaNorthern AfricaNorthern EuropeNorwayOceaniaPakistanPanamaPeruPhilippinesPolandPortugalRomaniaRussiaSaudi ArabiaScotlandSenegalSerbiaSierra LeoneSingaporeSomaliaSouth AfricaSouth AmericaSouth Central AsiaSouth Eastern AsiaSouthern EuropeSpainSri LankaSt. Vincent and the GrenadinesSudanSwedenSwitzerlandSyriaTaiwanThailandTrinidad and TobagoTurkeyUgandaUkraineUruguayUzbekistanVenezuelaVietnamWest IndiesWestern AfricaWestern AsiaWestern EuropeYemenZaireZimbabweAzores
Unemployment Among Women with Children Ages 6 to 17 years
Income
Poverty
Unemployment
Labor Participation
Family Structure
Vehicle Availability
Education Level
Disability

Potawatomi Unemployment Among Women with Children Ages 6 to 17 years
Exceptional

8.5%
UNEMPLOYMENT | WOMEN W/ CHILDREN 6 TO 17
99.0/ 100
METRIC RATING
92nd/ 347
METRIC RANK

Potawatomi Unemployment Among Women with Children Ages 6 to 17 years Correlation Chart

The statistical analysis conducted on geographies consisting of 100,614,314 people shows a slight positive correlation between the proportion of Potawatomi and unemployment rate among women with children between the ages 6 and 17 in the United States with a correlation coefficient (R) of 0.088 and weighted average of 8.5%. On average, for every 1% (one percent) increase in Potawatomi within a typical geography, there is an increase of 0.41% in unemployment rate among women with children between the ages 6 and 17.
Potawatomi Unemployment Among Women with Children Ages 6 to 17 years
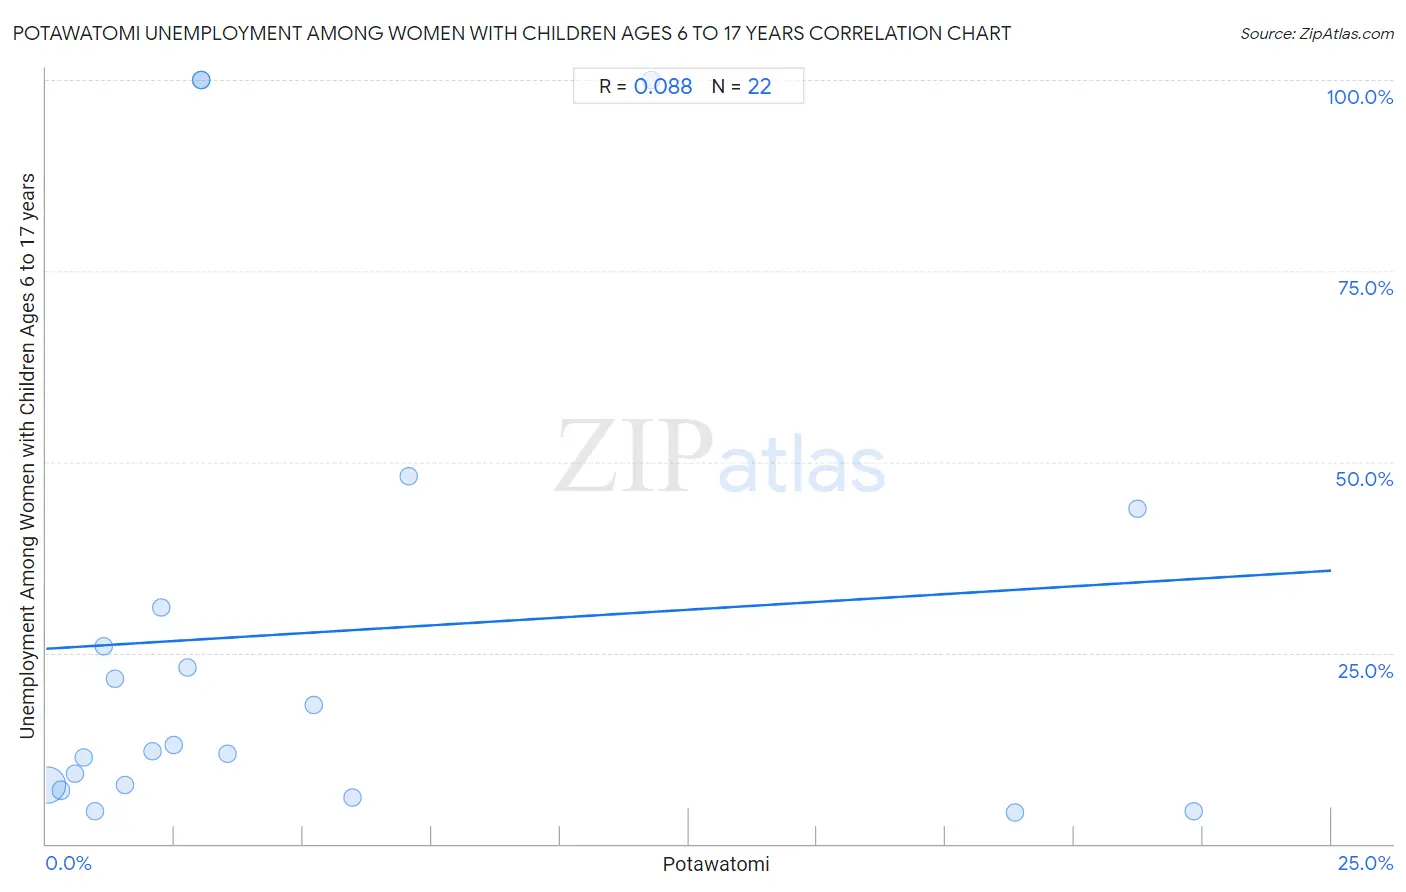
It is essential to understand that the correlation between the percentage of Potawatomi and unemployment rate among women with children between the ages 6 and 17 does not imply a direct cause-and-effect relationship. It remains uncertain whether the presence of Potawatomi influences an upward or downward trend in the level of unemployment rate among women with children between the ages 6 and 17 within an area, or if Potawatomi simply ended up residing in those areas with higher or lower levels of unemployment rate among women with children between the ages 6 and 17 due to other factors.

Demographics Similar to Potawatomi by Unemployment Among Women with Children Ages 6 to 17 years

In terms of unemployment among women with children ages 6 to 17 years, the demographic groups most similar to Potawatomi are Immigrants from Eastern Europe (8.5%, a difference of 0.030%), Yugoslavian (8.5%, a difference of 0.090%), Australian (8.5%, a difference of 0.12%), Paiute (8.5%, a difference of 0.13%), and Immigrants from Vietnam (8.5%, a difference of 0.21%).
DemographicsRating | RankUnemployment Among Women with Children Ages 6 to 17 years
Immigrants from North Macedonia
99.4
/100
|
#85
Exceptional
8.5%
Alaskan Athabascans
99.4
/100
|
#86
Exceptional
8.5%
Immigrants from Israel
99.1
/100
|
#87
Exceptional
8.5%
Immigrants from Vietnam
99.1
/100
|
#88
Exceptional
8.5%
Paiute
99.1
/100
|
#89
Exceptional
8.5%
Yugoslavians
99.0
/100
|
#90
Exceptional
8.5%
Immigrants from Eastern Europe
99.0
/100
|
#91
Exceptional
8.5%
Potawatomi
99.0
/100
|
#92
Exceptional
8.5%
Australians
98.9
/100
|
#93
Exceptional
8.5%
Immigrants from Barbados
98.8
/100
|
#94
Exceptional
8.5%
Sri Lankans
98.7
/100
|
#95
Exceptional
8.5%
German Russians
98.6
/100
|
#96
Exceptional
8.5%
Bolivians
98.5
/100
|
#97
Exceptional
8.5%
Malaysians
98.5
/100
|
#98
Exceptional
8.6%
Immigrants from Lithuania
98.4
/100
|
#99
Exceptional
8.6%

Potawatomi Unemployment Among Women with Children Ages 6 to 17 years Correlation Summary

MeasurementPotawatomi DataUnemployment Among Women with Children Ages 6 to 17 years Data
Minimum0.023%4.1%
Maximum22.3%100.0%
Range22.3%95.9%
Mean5.4%27.7%
Median2.6%12.5%
Interquartile 25% (IQ1)1.1%7.7%
Interquartile 75% (IQ3)6.0%31.0%
Interquartile Range (IQR)4.8%23.3%
Standard Deviation (Sample)6.8%31.8%
Standard Deviation (Population)6.7%31.0%

Correlation Details

Potawatomi PercentileSample SizeUnemployment Among Women with Children Ages 6 to 17 years
[
0.0%
-
0.5%
]
0.023%
96,506,9897.8%
[
0.0%
-
0.5%
]
0.29%
3,344,5107.0%
[
0.5%
-
1.0%
]
0.55%
397,9229.2%
[
0.5%
-
1.0%
]
0.73%
171,01111.4%
[
0.5%
-
1.0%
]
0.94%
68,7904.3%
[
1.0%
-
1.5%
]
1.13%
18,09825.9%
[
1.0%
-
1.5%
]
1.34%
11,20621.6%
[
1.5%
-
2.0%
]
1.54%
43,6887.7%
[
2.0%
-
2.5%
]
2.06%
4,86012.0%
[
2.0%
-
2.5%
]
2.23%
1,30131.0%
[
2.0%
-
2.5%
]
2.48%
24,22712.9%
[
2.5%
-
3.0%
]
2.74%
5,99223.1%
[
3.0%
-
3.5%
]
3.02%
298100.0%
[
3.0%
-
3.5%
]
3.02%
364100.0%
[
3.5%
-
4.0%
]
3.52%
1,53411.8%
[
5.0%
-
5.5%
]
5.21%
1,32418.2%
[
5.5%
-
6.0%
]
5.97%
3,8896.1%
[
7.0%
-
7.5%
]
7.06%
2,60748.1%
[
11.5%
-
12.0%
]
11.76%
136100.0%
[
18.5%
-
19.0%
]
18.85%
2,4624.1%
[
21.0%
-
21.5%
]
21.23%
1,40443.8%
[
22.0%
-
22.5%
]
22.33%
1,7024.3%