Latvian vs Comanche 3 or more Vehicles in Household
COMPARE
Latvian
Comanche
3 or more Vehicles in Household
3 or more Vehicles in Household Comparison
Latvians
Comanche
19.3%
3 OR MORE VEHICLES IN HOUSEHOLD
35.7/ 100
METRIC RATING
184th/ 347
METRIC RANK
21.0%
3 OR MORE VEHICLES IN HOUSEHOLD
98.2/ 100
METRIC RATING
100th/ 347
METRIC RANK
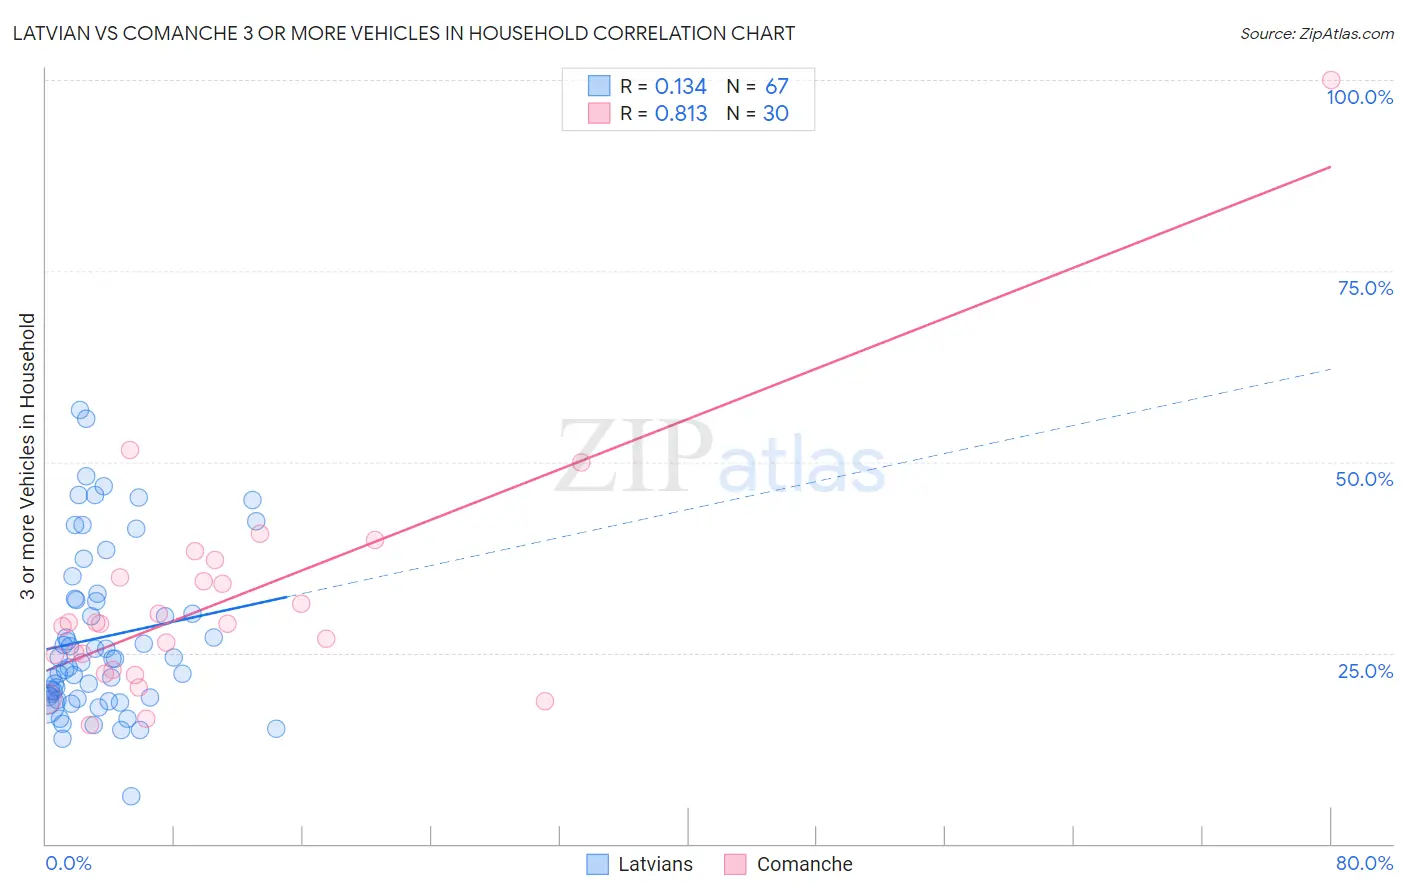
Latvian vs Comanche 3 or more Vehicles in Household Correlation Chart
The statistical analysis conducted on geographies consisting of 220,591,398 people shows a poor positive correlation between the proportion of Latvians and percentage of households with 3 or more vehicles available in the United States with a correlation coefficient (R) of 0.134 and weighted average of 19.3%. Similarly, the statistical analysis conducted on geographies consisting of 109,768,043 people shows a very strong positive correlation between the proportion of Comanche and percentage of households with 3 or more vehicles available in the United States with a correlation coefficient (R) of 0.813 and weighted average of 21.0%, a difference of 8.8%.
3 or more Vehicles in Household Correlation Summary
| Measurement | Latvian | Comanche |
| Minimum | 6.2% | 15.6% |
| Maximum | 56.8% | 100.0% |
| Range | 50.6% | 84.4% |
| Mean | 27.0% | 31.7% |
| Median | 24.2% | 28.8% |
| Interquartile 25% (IQ1) | 19.0% | 22.8% |
| Interquartile 75% (IQ3) | 32.0% | 34.9% |
| Interquartile Range (IQR) | 13.0% | 12.1% |
| Standard Deviation (Sample) | 10.9% | 15.6% |
| Standard Deviation (Population) | 10.9% | 15.4% |
Similar Demographics by 3 or more Vehicles in Household
Demographics Similar to Latvians by 3 or more Vehicles in Household
In terms of 3 or more vehicles in household, the demographic groups most similar to Latvians are Cajun (19.3%, a difference of 0.020%), Cuban (19.3%, a difference of 0.070%), Romanian (19.3%, a difference of 0.11%), South African (19.3%, a difference of 0.15%), and Immigrants from South Central Asia (19.3%, a difference of 0.26%).
| Demographics | Rating | Rank | 3 or more Vehicles in Household |
| Immigrants | Peru | 41.1 /100 | #177 | Average 19.4% |
| Immigrants | Syria | 40.3 /100 | #178 | Average 19.4% |
| Immigrants | South Central Asia | 38.9 /100 | #179 | Fair 19.3% |
| South Africans | 37.5 /100 | #180 | Fair 19.3% |
| Romanians | 37.1 /100 | #181 | Fair 19.3% |
| Cubans | 36.6 /100 | #182 | Fair 19.3% |
| Cajuns | 36.0 /100 | #183 | Fair 19.3% |
| Latvians | 35.7 /100 | #184 | Fair 19.3% |
| Immigrants | Sri Lanka | 30.7 /100 | #185 | Fair 19.2% |
| Immigrants | Sweden | 29.0 /100 | #186 | Fair 19.2% |
| Immigrants | Hong Kong | 28.3 /100 | #187 | Fair 19.2% |
| Immigrants | Kuwait | 26.1 /100 | #188 | Fair 19.1% |
| Indians (Asian) | 26.0 /100 | #189 | Fair 19.1% |
| Immigrants | Zimbabwe | 25.5 /100 | #190 | Fair 19.1% |
| South American Indians | 25.4 /100 | #191 | Fair 19.1% |
Demographics Similar to Comanche by 3 or more Vehicles in Household
In terms of 3 or more vehicles in household, the demographic groups most similar to Comanche are Hmong (21.0%, a difference of 0.040%), Alaska Native (21.0%, a difference of 0.040%), Canadian (21.0%, a difference of 0.10%), Cree (21.0%, a difference of 0.21%), and Pakistani (21.0%, a difference of 0.30%).
| Demographics | Rating | Rank | 3 or more Vehicles in Household |
| Immigrants | Indonesia | 98.8 /100 | #93 | Exceptional 21.1% |
| Immigrants | Cambodia | 98.6 /100 | #94 | Exceptional 21.1% |
| Pakistanis | 98.5 /100 | #95 | Exceptional 21.0% |
| Cree | 98.4 /100 | #96 | Exceptional 21.0% |
| Canadians | 98.3 /100 | #97 | Exceptional 21.0% |
| Hmong | 98.2 /100 | #98 | Exceptional 21.0% |
| Alaska Natives | 98.2 /100 | #99 | Exceptional 21.0% |
| Comanche | 98.2 /100 | #100 | Exceptional 21.0% |
| Blackfeet | 97.9 /100 | #101 | Exceptional 20.9% |
| Seminole | 97.8 /100 | #102 | Exceptional 20.9% |
| Dutch West Indians | 97.8 /100 | #103 | Exceptional 20.9% |
| Luxembourgers | 97.7 /100 | #104 | Exceptional 20.9% |
| Austrians | 97.5 /100 | #105 | Exceptional 20.9% |
| Bolivians | 97.4 /100 | #106 | Exceptional 20.8% |
| Immigrants | Germany | 97.4 /100 | #107 | Exceptional 20.8% |