Immigrants from Switzerland vs Immigrants from Central America 3 or more Vehicles in Household

COMPARE

Immigrants from Switzerland
Race
Ancestry
AfghanAfricanAlaska NativeAlaskan AthabascanAlbanianAleutAlsatianAmericanApacheArabArapahoArgentineanArmenianAssyrian/Chaldean/SyriacAustralianAustrianBahamianBangladeshiBarbadianBasqueBelgianBelizeanBermudanBhutaneseBlackfeetBolivianBrazilianBritishBritish West IndianBulgarianBurmeseCajunCambodianCanadianCape VerdeanCarpatho RusynCelticCentral AmericanCentral American IndianCherokeeCheyenneChickasawChileanChineseChippewaChoctawColombianColvilleComancheCosta RicanCreeCreekCroatianCrowCubanCypriotCzechCzechoslovakianDanishDelawareDominicanDutchDutch West IndianEastern EuropeanEcuadorianEgyptianEnglishEstonianEthiopianEuropeanFijianFilipinoFinnishFrenchFrench American IndianFrench CanadianGermanGerman RussianGhanaianGreekGuamanian/ChamorroGuatemalanGuyaneseHaitianHmongHonduranHopiHoumaHungarianIcelanderIndian (Asian)IndonesianInupiatIranianIraqiIrishIroquoisIsraeliItalianJamaicanJapaneseJordanianKenyanKiowaKoreanLaotianLatvianLebaneseLiberianLithuanianLumbeeLuxembourgerMacedonianMalaysianMalteseMarshalleseMenomineeMexicanMexican American IndianMongolianMoroccanNative HawaiianNavajoNepaleseNew ZealanderNicaraguanNigerianNorthern EuropeanNorwegianOkinawanOsageOttawaPaiutePakistaniPalestinianPanamanianParaguayanPennsylvania GermanPeruvianPimaPolishPortuguesePotawatomiPuebloPuerto RicanPuget Sound SalishRomanianRussianSalvadoranSamoanScandinavianScotch-IrishScottishSeminoleSenegaleseSerbianShoshoneSierra LeoneanSiouxSlavicSlovakSloveneSomaliSouth AfricanSouth AmericanSouth American IndianSoviet UnionSpaniardSpanishSpanish AmericanSpanish American IndianSri LankanSubsaharan AfricanSudaneseSwedishSwissSyrianTaiwaneseThaiTlingit-HaidaTohono O'OdhamTonganTrinidadian and TobagonianTsimshianTurkishU.S. Virgin IslanderUgandanUkrainianUruguayanUteVenezuelanVietnameseWelshWest IndianYakamaYaquiYugoslavianYumanYup'ikZimbabwean
Immigration
NonimmigrantsImmigrantsAfghanistanAfricaAlbaniaArgentinaArmeniaAsiaAustraliaAustriaBahamasBangladeshBarbadosBelarusBelgiumBelizeBoliviaBosnia and HerzegovinaBrazilBulgariaBurma/MyanmarCabo VerdeCambodiaCameroonCanadaCaribbeanChileChinaColombiaCongoCosta RicaCroatiaCubaCzechoslovakiaDenmarkDominicaDominican RepublicEastern AfricaEastern AsiaEastern EuropeEcuadorEgyptEl SalvadorEnglandEritreaEthiopiaEuropeFijiFranceGermanyGhanaGreeceGrenadaGuatemalaGuyanaHaitiHondurasHong KongHungaryIndiaIndonesiaIranIraqIrelandIsraelItalyJamaicaJapanJordanKazakhstanKenyaKoreaKuwaitLaosLatin AmericaLatviaLebanonLiberiaLithuaniaMalaysiaMexicoMicronesiaMiddle AfricaMoldovaMoroccoNepalNetherlandsNicaraguaNigeriaNorth AmericaNorth MacedoniaNorthern AfricaNorthern EuropeNorwayOceaniaPakistanPanamaPeruPhilippinesPolandPortugalRomaniaRussiaSaudi ArabiaScotlandSenegalSerbiaSierra LeoneSingaporeSomaliaSouth AfricaSouth AmericaSouth Central AsiaSouth Eastern AsiaSouthern EuropeSpainSri LankaSt. Vincent and the GrenadinesSudanSwedenSwitzerlandSyriaTaiwanThailandTrinidad and TobagoTurkeyUgandaUkraineUruguayUzbekistanVenezuelaVietnamWest IndiesWestern AfricaWestern AsiaWestern EuropeYemenZaireZimbabweAzores
Immigrants from Central America
Race
Ancestry
AfghanAfricanAlaska NativeAlaskan AthabascanAlbanianAleutAlsatianAmericanApacheArabArapahoArgentineanArmenianAssyrian/Chaldean/SyriacAustralianAustrianBahamianBangladeshiBarbadianBasqueBelgianBelizeanBermudanBhutaneseBlackfeetBolivianBrazilianBritishBritish West IndianBulgarianBurmeseCajunCambodianCanadianCape VerdeanCarpatho RusynCelticCentral AmericanCentral American IndianCherokeeCheyenneChickasawChileanChineseChippewaChoctawColombianColvilleComancheCosta RicanCreeCreekCroatianCrowCubanCypriotCzechCzechoslovakianDanishDelawareDominicanDutchDutch West IndianEastern EuropeanEcuadorianEgyptianEnglishEstonianEthiopianEuropeanFijianFilipinoFinnishFrenchFrench American IndianFrench CanadianGermanGerman RussianGhanaianGreekGuamanian/ChamorroGuatemalanGuyaneseHaitianHmongHonduranHopiHoumaHungarianIcelanderIndian (Asian)IndonesianInupiatIranianIraqiIrishIroquoisIsraeliItalianJamaicanJapaneseJordanianKenyanKiowaKoreanLaotianLatvianLebaneseLiberianLithuanianLumbeeLuxembourgerMacedonianMalaysianMalteseMarshalleseMenomineeMexicanMexican American IndianMongolianMoroccanNative HawaiianNavajoNepaleseNew ZealanderNicaraguanNigerianNorthern EuropeanNorwegianOkinawanOsageOttawaPaiutePakistaniPalestinianPanamanianParaguayanPennsylvania GermanPeruvianPimaPolishPortuguesePotawatomiPuebloPuerto RicanPuget Sound SalishRomanianRussianSalvadoranSamoanScandinavianScotch-IrishScottishSeminoleSenegaleseSerbianShoshoneSierra LeoneanSiouxSlavicSlovakSloveneSomaliSouth AfricanSouth AmericanSouth American IndianSoviet UnionSpaniardSpanishSpanish AmericanSpanish American IndianSri LankanSubsaharan AfricanSudaneseSwedishSwissSyrianTaiwaneseThaiTlingit-HaidaTohono O'OdhamTonganTrinidadian and TobagonianTsimshianTurkishU.S. Virgin IslanderUgandanUkrainianUruguayanUteVenezuelanVietnameseWelshWest IndianYakamaYaquiYugoslavianYumanYup'ikZimbabwean
Immigration
NonimmigrantsImmigrantsAfghanistanAfricaAlbaniaArgentinaArmeniaAsiaAustraliaAustriaBahamasBangladeshBarbadosBelarusBelgiumBelizeBoliviaBosnia and HerzegovinaBrazilBulgariaBurma/MyanmarCabo VerdeCambodiaCameroonCanadaCaribbeanCentral AmericaChileChinaColombiaCongoCosta RicaCroatiaCubaCzechoslovakiaDenmarkDominicaDominican RepublicEastern AfricaEastern AsiaEastern EuropeEcuadorEgyptEl SalvadorEnglandEritreaEthiopiaEuropeFijiFranceGermanyGhanaGreeceGrenadaGuatemalaGuyanaHaitiHondurasHong KongHungaryIndiaIndonesiaIranIraqIrelandIsraelItalyJamaicaJapanJordanKazakhstanKenyaKoreaKuwaitLaosLatin AmericaLatviaLebanonLiberiaLithuaniaMalaysiaMexicoMicronesiaMiddle AfricaMoldovaMoroccoNepalNetherlandsNicaraguaNigeriaNorth AmericaNorth MacedoniaNorthern AfricaNorthern EuropeNorwayOceaniaPakistanPanamaPeruPhilippinesPolandPortugalRomaniaRussiaSaudi ArabiaScotlandSenegalSerbiaSierra LeoneSingaporeSomaliaSouth AfricaSouth AmericaSouth Central AsiaSouth Eastern AsiaSouthern EuropeSpainSri LankaSt. Vincent and the GrenadinesSudanSwedenSyriaTaiwanThailandTrinidad and TobagoTurkeyUgandaUkraineUruguayUzbekistanVenezuelaVietnamWest IndiesWestern AfricaWestern AsiaWestern EuropeYemenZaireZimbabweAzores
3 or more Vehicles in Household
Income
Poverty
Unemployment
Labor Participation
Family Structure
Vehicle Availability
Education Level
Disability

3 or more Vehicles in Household Comparison

Immigrants from Switzerland

Immigrants from Central America

Tragic
Exceptional
18.4%
3 OR MORE VEHICLES IN HOUSEHOLD
5.0/ 100
METRIC RATING
229th/ 347
METRIC RANK
23.4%
3 OR MORE VEHICLES IN HOUSEHOLD
100.0/ 100
METRIC RATING
25th/ 347
METRIC RANK

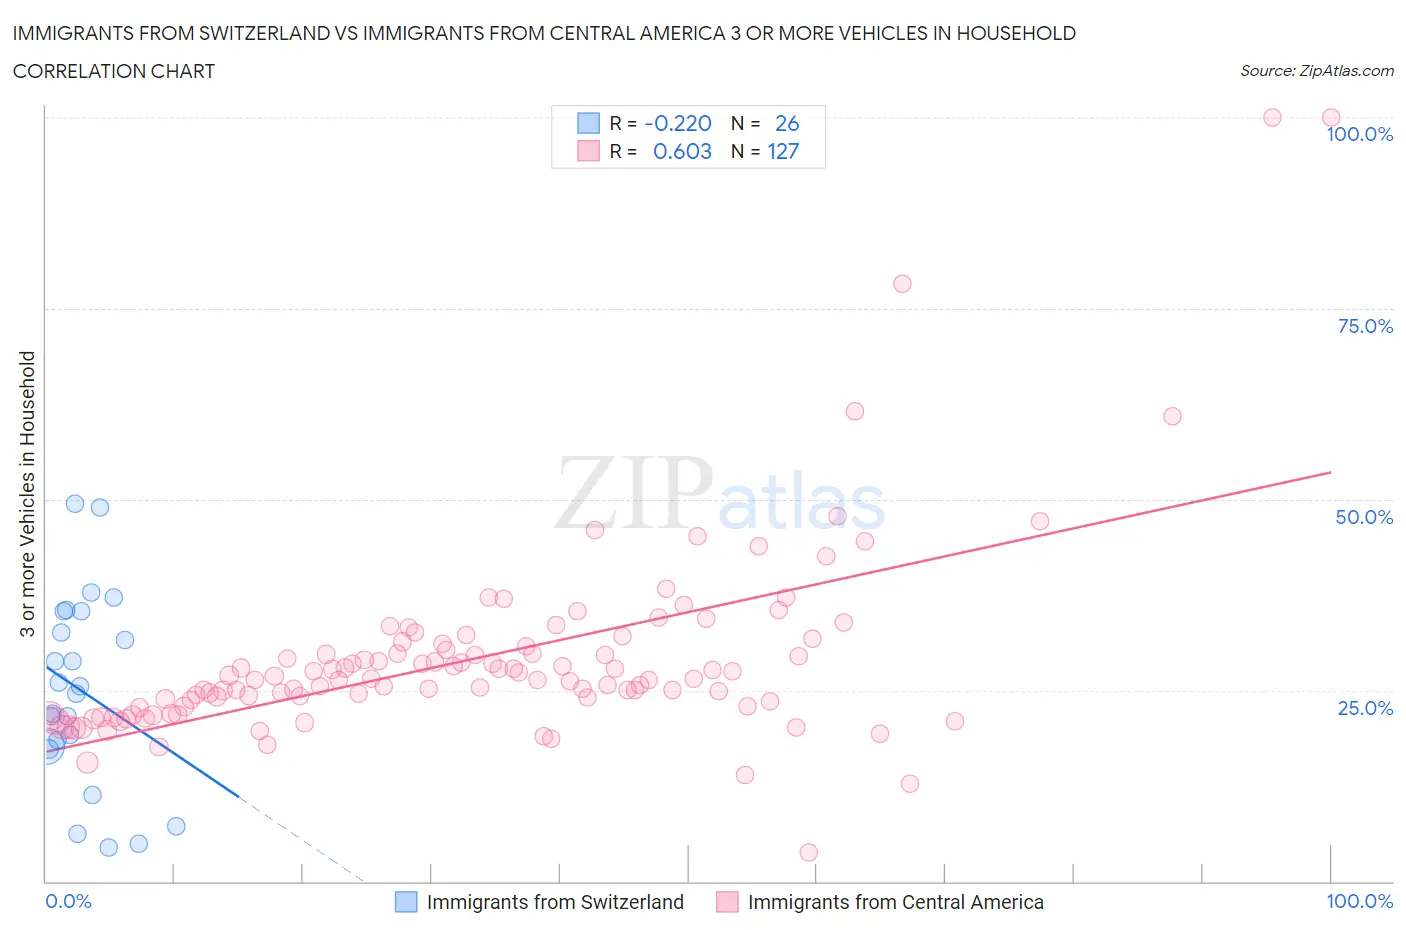
Immigrants from Switzerland vs Immigrants from Central America 3 or more Vehicles in Household Correlation Chart

The statistical analysis conducted on geographies consisting of 148,020,738 people shows a weak negative correlation between the proportion of Immigrants from Switzerland and percentage of households with 3 or more vehicles available in the United States with a correlation coefficient (R) of -0.220 and weighted average of 18.4%. Similarly, the statistical analysis conducted on geographies consisting of 535,876,372 people shows a significant positive correlation between the proportion of Immigrants from Central America and percentage of households with 3 or more vehicles available in the United States with a correlation coefficient (R) of 0.603 and weighted average of 23.4%, a difference of 27.3%.
Immigrants from Switzerland vs Immigrants from Central America 3 or more Vehicles in Household

3 or more Vehicles in Household Correlation Summary

MeasurementImmigrants from SwitzerlandImmigrants from Central America
Minimum4.4%3.8%
Maximum49.4%100.0%
Range45.1%96.2%
Mean25.0%29.1%
Median25.0%26.4%
Interquartile 25% (IQ1)17.6%22.9%
Interquartile 75% (IQ3)35.3%30.8%
Interquartile Range (IQR)17.7%7.9%
Standard Deviation (Sample)12.4%12.9%
Standard Deviation (Population)12.2%12.9%

Similar Demographics by 3 or more Vehicles in Household

Demographics Similar to Immigrants from Switzerland by 3 or more Vehicles in Household

In terms of 3 or more vehicles in household, the demographic groups most similar to Immigrants from Switzerland are Immigrants from Western Asia (18.4%, a difference of 0.060%), Immigrants from Belgium (18.4%, a difference of 0.080%), Immigrants from Uganda (18.4%, a difference of 0.14%), Honduran (18.4%, a difference of 0.16%), and Turkish (18.4%, a difference of 0.17%).
DemographicsRating | Rank3 or more Vehicles in Household
Belizeans
7.3
/100
|
#222
Tragic
18.6%
Immigrants | Czechoslovakia
5.9
/100
|
#223
Tragic
18.5%
Immigrants | Argentina
5.6
/100
|
#224
Tragic
18.5%
Immigrants | Lithuania
5.6
/100
|
#225
Tragic
18.5%
Immigrants | Hungary
5.5
/100
|
#226
Tragic
18.5%
Immigrants | Singapore
5.4
/100
|
#227
Tragic
18.4%
Turks
5.4
/100
|
#228
Tragic
18.4%
Immigrants | Switzerland
5.0
/100
|
#229
Tragic
18.4%
Immigrants | Western Asia
4.8
/100
|
#230
Tragic
18.4%
Immigrants | Belgium
4.8
/100
|
#231
Tragic
18.4%
Immigrants | Uganda
4.6
/100
|
#232
Tragic
18.4%
Hondurans
4.6
/100
|
#233
Tragic
18.4%
Immigrants | North Macedonia
4.4
/100
|
#234
Tragic
18.4%
Sierra Leoneans
3.9
/100
|
#235
Tragic
18.3%
Immigrants | Malaysia
3.6
/100
|
#236
Tragic
18.3%

Demographics Similar to Immigrants from Central America by 3 or more Vehicles in Household

In terms of 3 or more vehicles in household, the demographic groups most similar to Immigrants from Central America are Sri Lankan (23.6%, a difference of 0.51%), Scandinavian (23.6%, a difference of 0.77%), Mexican American Indian (23.3%, a difference of 0.77%), Guamanian/Chamorro (23.2%, a difference of 0.91%), and Lumbee (23.1%, a difference of 1.2%).
DemographicsRating | Rank3 or more Vehicles in Household
Norwegians
100.0
/100
|
#18
Exceptional
23.9%
Chinese
100.0
/100
|
#19
Exceptional
23.9%
Paiute
100.0
/100
|
#20
Exceptional
23.8%
Immigrants | Vietnam
100.0
/100
|
#21
Exceptional
23.8%
Immigrants | Philippines
100.0
/100
|
#22
Exceptional
23.8%
Scandinavians
100.0
/100
|
#23
Exceptional
23.6%
Sri Lankans
100.0
/100
|
#24
Exceptional
23.6%
Immigrants | Central America
100.0
/100
|
#25
Exceptional
23.4%
Mexican American Indians
100.0
/100
|
#26
Exceptional
23.3%
Guamanians/Chamorros
100.0
/100
|
#27
Exceptional
23.2%
Lumbee
100.0
/100
|
#28
Exceptional
23.1%
Spanish
100.0
/100
|
#29
Exceptional
23.1%
Immigrants | South Eastern Asia
100.0
/100
|
#30
Exceptional
23.1%
English
100.0
/100
|
#31
Exceptional
23.1%
Pueblo
100.0
/100
|
#32
Exceptional
23.0%