Immigrants from Switzerland vs Immigrants from Croatia 3 or more Vehicles in Household
COMPARE
Immigrants from Switzerland
Immigrants from Croatia
3 or more Vehicles in Household
3 or more Vehicles in Household Comparison
Immigrants from Switzerland
Immigrants from Croatia
18.4%
3 OR MORE VEHICLES IN HOUSEHOLD
5.0/ 100
METRIC RATING
229th/ 347
METRIC RANK
17.2%
3 OR MORE VEHICLES IN HOUSEHOLD
0.2/ 100
METRIC RATING
285th/ 347
METRIC RANK
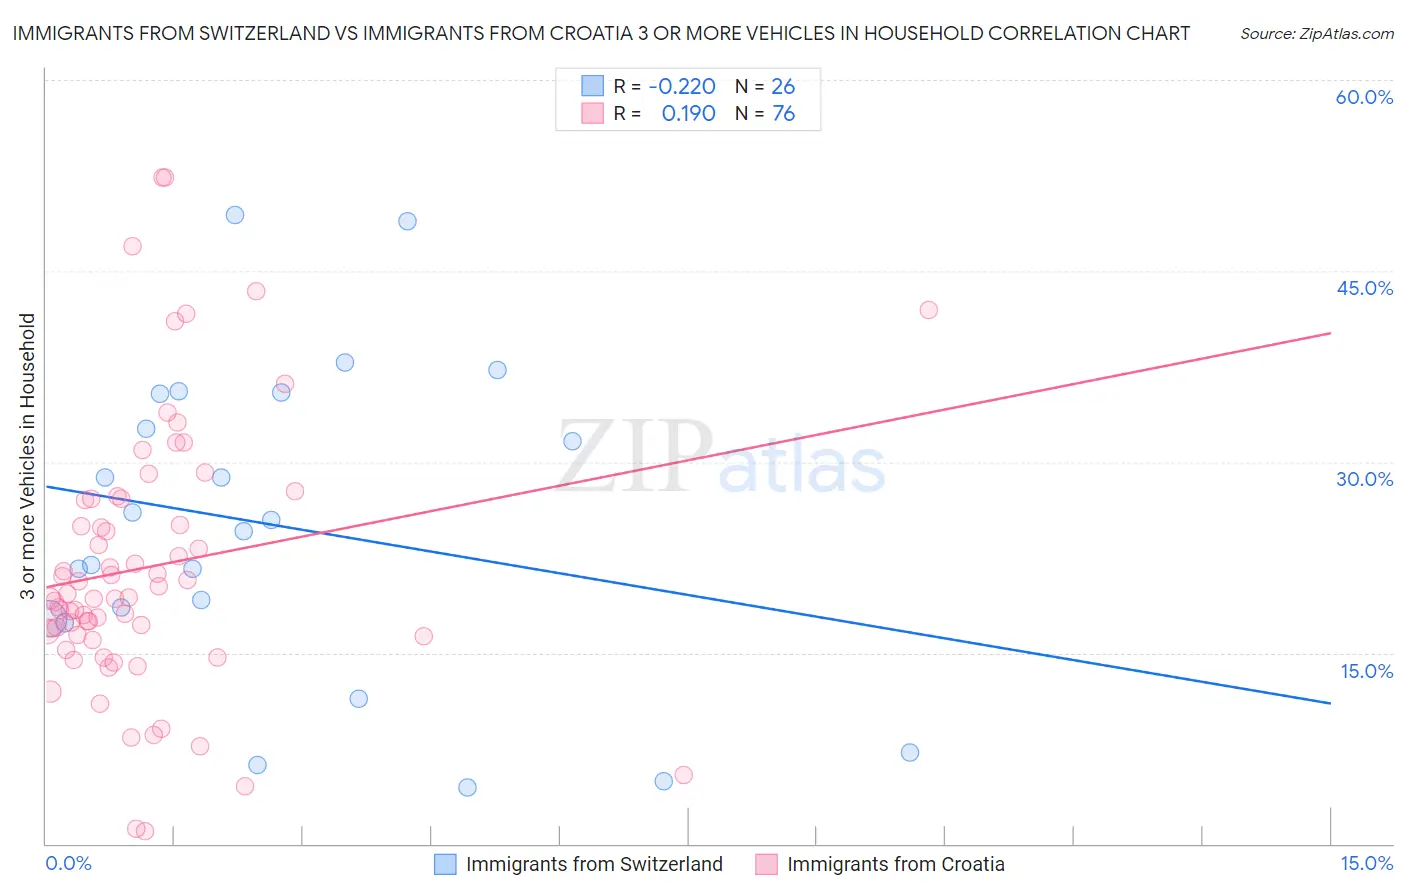
Immigrants from Switzerland vs Immigrants from Croatia 3 or more Vehicles in Household Correlation Chart
The statistical analysis conducted on geographies consisting of 148,020,738 people shows a weak negative correlation between the proportion of Immigrants from Switzerland and percentage of households with 3 or more vehicles available in the United States with a correlation coefficient (R) of -0.220 and weighted average of 18.4%. Similarly, the statistical analysis conducted on geographies consisting of 132,550,126 people shows a poor positive correlation between the proportion of Immigrants from Croatia and percentage of households with 3 or more vehicles available in the United States with a correlation coefficient (R) of 0.190 and weighted average of 17.2%, a difference of 7.1%.
3 or more Vehicles in Household Correlation Summary
| Measurement | Immigrants from Switzerland | Immigrants from Croatia |
| Minimum | 4.4% | 0.97% |
| Maximum | 49.4% | 52.4% |
| Range | 45.1% | 51.4% |
| Mean | 25.0% | 21.7% |
| Median | 25.0% | 19.3% |
| Interquartile 25% (IQ1) | 17.6% | 16.4% |
| Interquartile 75% (IQ3) | 35.3% | 27.1% |
| Interquartile Range (IQR) | 17.7% | 10.7% |
| Standard Deviation (Sample) | 12.4% | 10.5% |
| Standard Deviation (Population) | 12.2% | 10.5% |
Similar Demographics by 3 or more Vehicles in Household
Demographics Similar to Immigrants from Switzerland by 3 or more Vehicles in Household
In terms of 3 or more vehicles in household, the demographic groups most similar to Immigrants from Switzerland are Immigrants from Western Asia (18.4%, a difference of 0.060%), Immigrants from Belgium (18.4%, a difference of 0.080%), Immigrants from Uganda (18.4%, a difference of 0.14%), Honduran (18.4%, a difference of 0.16%), and Turkish (18.4%, a difference of 0.17%).
| Demographics | Rating | Rank | 3 or more Vehicles in Household |
| Belizeans | 7.3 /100 | #222 | Tragic 18.6% |
| Immigrants | Czechoslovakia | 5.9 /100 | #223 | Tragic 18.5% |
| Immigrants | Argentina | 5.6 /100 | #224 | Tragic 18.5% |
| Immigrants | Lithuania | 5.6 /100 | #225 | Tragic 18.5% |
| Immigrants | Hungary | 5.5 /100 | #226 | Tragic 18.5% |
| Immigrants | Singapore | 5.4 /100 | #227 | Tragic 18.4% |
| Turks | 5.4 /100 | #228 | Tragic 18.4% |
| Immigrants | Switzerland | 5.0 /100 | #229 | Tragic 18.4% |
| Immigrants | Western Asia | 4.8 /100 | #230 | Tragic 18.4% |
| Immigrants | Belgium | 4.8 /100 | #231 | Tragic 18.4% |
| Immigrants | Uganda | 4.6 /100 | #232 | Tragic 18.4% |
| Hondurans | 4.6 /100 | #233 | Tragic 18.4% |
| Immigrants | North Macedonia | 4.4 /100 | #234 | Tragic 18.4% |
| Sierra Leoneans | 3.9 /100 | #235 | Tragic 18.3% |
| Immigrants | Malaysia | 3.6 /100 | #236 | Tragic 18.3% |
Demographics Similar to Immigrants from Croatia by 3 or more Vehicles in Household
In terms of 3 or more vehicles in household, the demographic groups most similar to Immigrants from Croatia are Menominee (17.2%, a difference of 0.060%), Immigrants from Brazil (17.1%, a difference of 0.36%), Immigrants from Uruguay (17.1%, a difference of 0.45%), Immigrants from Liberia (17.1%, a difference of 0.52%), and Immigrants from Colombia (17.3%, a difference of 0.73%).
| Demographics | Rating | Rank | 3 or more Vehicles in Household |
| Immigrants | Bahamas | 0.3 /100 | #278 | Tragic 17.4% |
| Immigrants | Kazakhstan | 0.3 /100 | #279 | Tragic 17.4% |
| Immigrants | Eastern Europe | 0.3 /100 | #280 | Tragic 17.4% |
| Immigrants | Latvia | 0.3 /100 | #281 | Tragic 17.4% |
| Immigrants | Ireland | 0.3 /100 | #282 | Tragic 17.3% |
| Blacks/African Americans | 0.3 /100 | #283 | Tragic 17.3% |
| Immigrants | Colombia | 0.3 /100 | #284 | Tragic 17.3% |
| Immigrants | Croatia | 0.2 /100 | #285 | Tragic 17.2% |
| Menominee | 0.2 /100 | #286 | Tragic 17.2% |
| Immigrants | Brazil | 0.2 /100 | #287 | Tragic 17.1% |
| Immigrants | Uruguay | 0.2 /100 | #288 | Tragic 17.1% |
| Immigrants | Liberia | 0.1 /100 | #289 | Tragic 17.1% |
| Liberians | 0.1 /100 | #290 | Tragic 17.0% |
| Immigrants | Congo | 0.1 /100 | #291 | Tragic 17.0% |
| Immigrants | Spain | 0.1 /100 | #292 | Tragic 17.0% |