Immigrants from Switzerland vs Eastern European 3 or more Vehicles in Household
COMPARE
Immigrants from Switzerland
Eastern European
3 or more Vehicles in Household
3 or more Vehicles in Household Comparison
Immigrants from Switzerland
Eastern Europeans
18.4%
3 OR MORE VEHICLES IN HOUSEHOLD
5.0/ 100
METRIC RATING
229th/ 347
METRIC RANK
18.7%
3 OR MORE VEHICLES IN HOUSEHOLD
10.6/ 100
METRIC RATING
215th/ 347
METRIC RANK
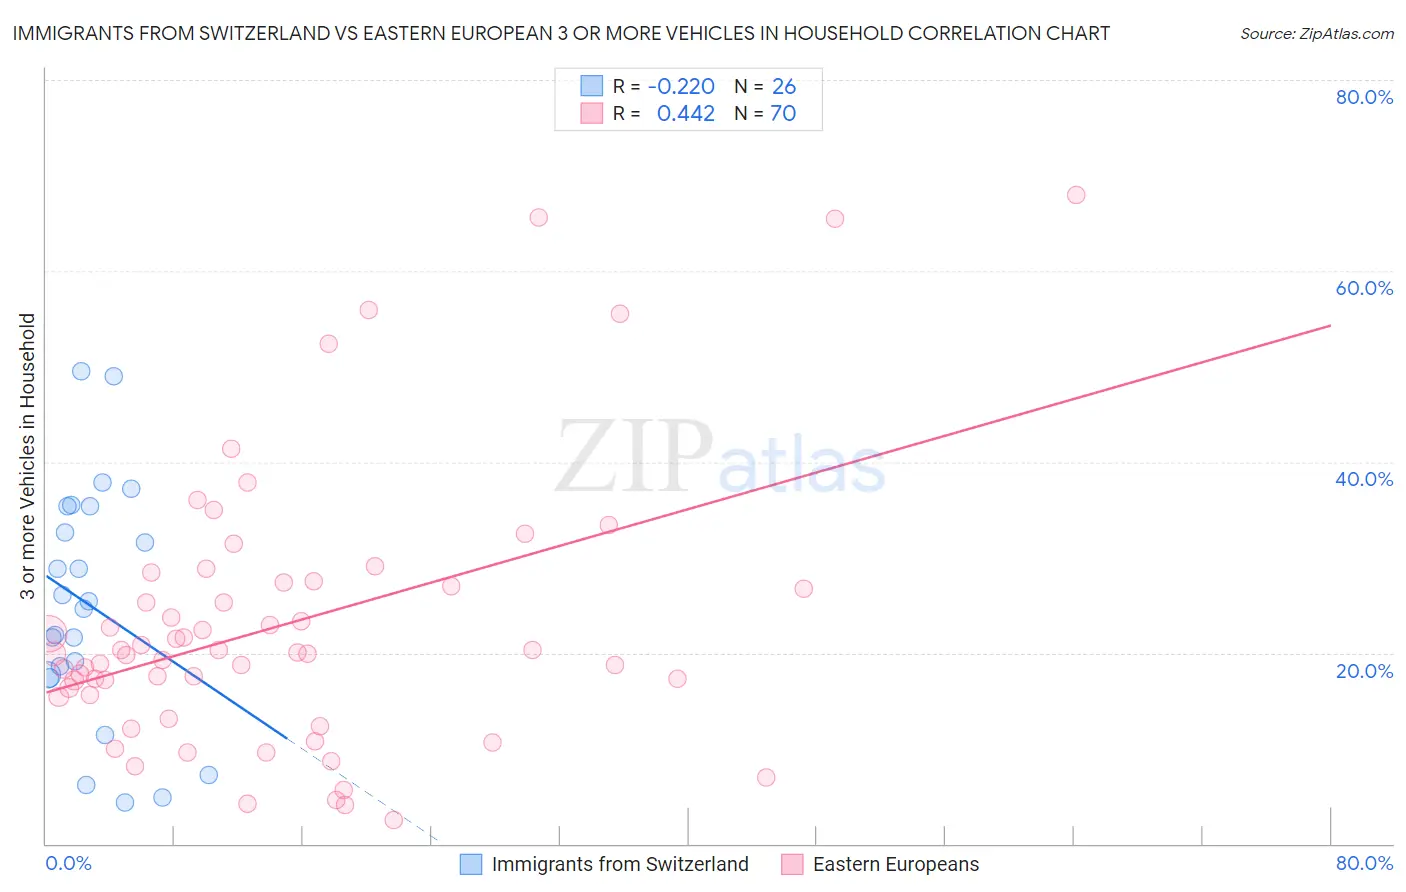
Immigrants from Switzerland vs Eastern European 3 or more Vehicles in Household Correlation Chart
The statistical analysis conducted on geographies consisting of 148,020,738 people shows a weak negative correlation between the proportion of Immigrants from Switzerland and percentage of households with 3 or more vehicles available in the United States with a correlation coefficient (R) of -0.220 and weighted average of 18.4%. Similarly, the statistical analysis conducted on geographies consisting of 460,782,690 people shows a moderate positive correlation between the proportion of Eastern Europeans and percentage of households with 3 or more vehicles available in the United States with a correlation coefficient (R) of 0.442 and weighted average of 18.7%, a difference of 1.6%.
3 or more Vehicles in Household Correlation Summary
| Measurement | Immigrants from Switzerland | Eastern European |
| Minimum | 4.4% | 2.5% |
| Maximum | 49.4% | 67.9% |
| Range | 45.1% | 65.5% |
| Mean | 25.0% | 23.0% |
| Median | 25.0% | 20.0% |
| Interquartile 25% (IQ1) | 17.6% | 15.6% |
| Interquartile 75% (IQ3) | 35.3% | 27.4% |
| Interquartile Range (IQR) | 17.7% | 11.8% |
| Standard Deviation (Sample) | 12.4% | 14.3% |
| Standard Deviation (Population) | 12.2% | 14.2% |
Demographics Similar to Immigrants from Switzerland and Eastern Europeans by 3 or more Vehicles in Household
In terms of 3 or more vehicles in household, the demographic groups most similar to Immigrants from Switzerland are Immigrants from Western Asia (18.4%, a difference of 0.060%), Immigrants from Belgium (18.4%, a difference of 0.080%), Immigrants from Uganda (18.4%, a difference of 0.14%), Turkish (18.4%, a difference of 0.17%), and Immigrants from Singapore (18.4%, a difference of 0.19%). Similarly, the demographic groups most similar to Eastern Europeans are Immigrants from Sierra Leone (18.7%, a difference of 0.050%), Immigrants from Nigeria (18.7%, a difference of 0.060%), Immigrants from Italy (18.7%, a difference of 0.080%), Immigrants from Cuba (18.8%, a difference of 0.20%), and Panamanian (18.8%, a difference of 0.21%).
| Demographics | Rating | Rank | 3 or more Vehicles in Household |
| Panamanians | 11.6 /100 | #212 | Poor 18.8% |
| Immigrants | Cuba | 11.6 /100 | #213 | Poor 18.8% |
| Immigrants | Sierra Leone | 10.8 /100 | #214 | Poor 18.7% |
| Eastern Europeans | 10.6 /100 | #215 | Poor 18.7% |
| Immigrants | Nigeria | 10.3 /100 | #216 | Poor 18.7% |
| Immigrants | Italy | 10.2 /100 | #217 | Poor 18.7% |
| Immigrants | Portugal | 8.9 /100 | #218 | Tragic 18.6% |
| Immigrants | Armenia | 8.6 /100 | #219 | Tragic 18.6% |
| Nigerians | 7.9 /100 | #220 | Tragic 18.6% |
| Immigrants | Poland | 7.5 /100 | #221 | Tragic 18.6% |
| Belizeans | 7.3 /100 | #222 | Tragic 18.6% |
| Immigrants | Czechoslovakia | 5.9 /100 | #223 | Tragic 18.5% |
| Immigrants | Argentina | 5.6 /100 | #224 | Tragic 18.5% |
| Immigrants | Lithuania | 5.6 /100 | #225 | Tragic 18.5% |
| Immigrants | Hungary | 5.5 /100 | #226 | Tragic 18.5% |
| Immigrants | Singapore | 5.4 /100 | #227 | Tragic 18.4% |
| Turks | 5.4 /100 | #228 | Tragic 18.4% |
| Immigrants | Switzerland | 5.0 /100 | #229 | Tragic 18.4% |
| Immigrants | Western Asia | 4.8 /100 | #230 | Tragic 18.4% |
| Immigrants | Belgium | 4.8 /100 | #231 | Tragic 18.4% |
| Immigrants | Uganda | 4.6 /100 | #232 | Tragic 18.4% |