Immigrants from Switzerland Disability Age Under 5
COMPARE
Immigrants from Switzerland
Select to Compare
Disability Age Under 5
Immigrants from Switzerland Disability Age Under 5
1.1%
DISABILITY | AGE UNDER 5
99.2/ 100
METRIC RATING
62nd/ 347
METRIC RANK
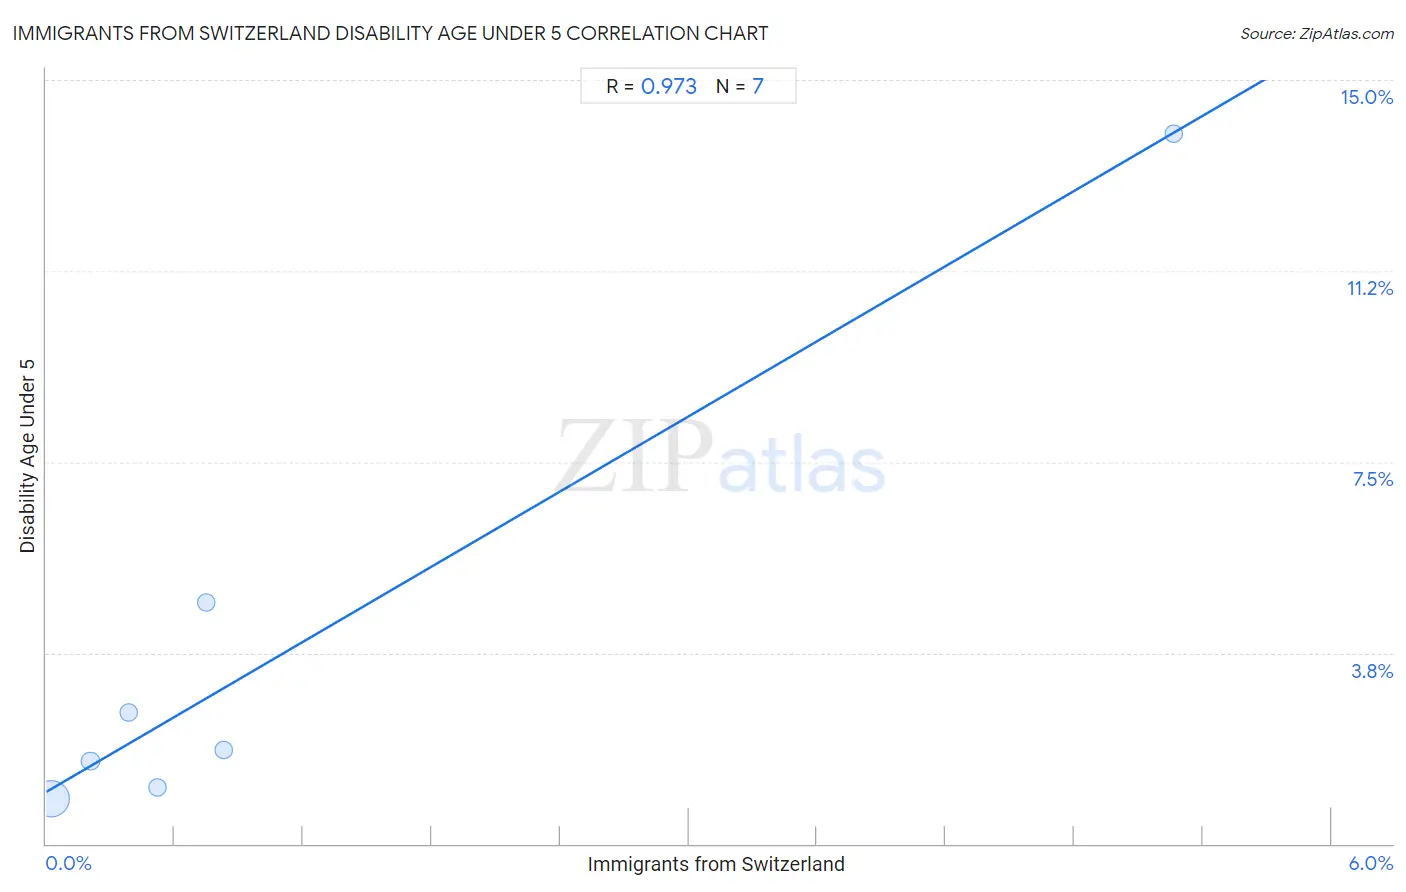
Immigrants from Switzerland Disability Age Under 5 Correlation Chart
The statistical analysis conducted on geographies consisting of 99,521,676 people shows a perfect positive correlation between the proportion of Immigrants from Switzerland and percentage of population with a disability under the age of 5 in the United States with a correlation coefficient (R) of 0.973 and weighted average of 1.1%. On average, for every 1% (one percent) increase in Immigrants from Switzerland within a typical geography, there is an increase of 2.5% in percentage of population with a disability under the age of 5.
It is essential to understand that the correlation between the percentage of Immigrants from Switzerland and percentage of population with a disability under the age of 5 does not imply a direct cause-and-effect relationship. It remains uncertain whether the presence of Immigrants from Switzerland influences an upward or downward trend in the level of percentage of population with a disability under the age of 5 within an area, or if Immigrants from Switzerland simply ended up residing in those areas with higher or lower levels of percentage of population with a disability under the age of 5 due to other factors.
Demographics Similar to Immigrants from Switzerland by Disability Age Under 5
In terms of disability age under 5, the demographic groups most similar to Immigrants from Switzerland are Immigrants from Ethiopia (1.1%, a difference of 0.010%), Immigrants from Western Asia (1.1%, a difference of 0.070%), Immigrants from Vietnam (1.1%, a difference of 0.11%), Egyptian (1.1%, a difference of 0.57%), and Immigrants from Malaysia (1.1%, a difference of 0.83%).
| Demographics | Rating | Rank | Disability Age Under 5 |
| Salvadorans | 99.5 /100 | #55 | Exceptional 1.1% |
| Ecuadorians | 99.5 /100 | #56 | Exceptional 1.1% |
| Assyrians/Chaldeans/Syriacs | 99.5 /100 | #57 | Exceptional 1.1% |
| Immigrants from Egypt | 99.4 /100 | #58 | Exceptional 1.1% |
| Immigrants from Malaysia | 99.4 /100 | #59 | Exceptional 1.1% |
| Immigrants from Western Asia | 99.2 /100 | #60 | Exceptional 1.1% |
| Immigrants from Ethiopia | 99.2 /100 | #61 | Exceptional 1.1% |
| Immigrants from Switzerland | 99.2 /100 | #62 | Exceptional 1.1% |
| Immigrants from Vietnam | 99.1 /100 | #63 | Exceptional 1.1% |
| Egyptians | 98.9 /100 | #64 | Exceptional 1.1% |
| Immigrants from Korea | 98.8 /100 | #65 | Exceptional 1.1% |
| Immigrants from Indonesia | 98.7 /100 | #66 | Exceptional 1.1% |
| Immigrants from Belize | 98.7 /100 | #67 | Exceptional 1.1% |
| South Africans | 98.7 /100 | #68 | Exceptional 1.1% |
| Israelis | 98.7 /100 | #69 | Exceptional 1.1% |
Immigrants from Switzerland Disability Age Under 5 Correlation Summary
| Measurement | Immigrants from Switzerland Data | Disability Age Under 5 Data |
| Minimum | 0.026% | 0.89% |
| Maximum | 5.3% | 14.0% |
| Range | 5.2% | 13.1% |
| Mean | 1.1% | 3.8% |
| Median | 0.52% | 1.8% |
| Interquartile 25% (IQ1) | 0.21% | 1.1% |
| Interquartile 75% (IQ3) | 0.83% | 4.7% |
| Interquartile Range (IQR) | 0.62% | 3.6% |
| Standard Deviation (Sample) | 1.8% | 4.6% |
| Standard Deviation (Population) | 1.7% | 4.3% |
Correlation Details
| Immigrants from Switzerland Percentile | Sample Size | Disability Age Under 5 |
[ 0.0% - 0.5% ] 0.026% | 97,584,853 | 0.89% |
[ 0.0% - 0.5% ] 0.21% | 1,490,620 | 1.6% |
[ 0.0% - 0.5% ] 0.39% | 288,730 | 2.6% |
[ 0.5% - 1.0% ] 0.52% | 109,175 | 1.1% |
[ 0.5% - 1.0% ] 0.75% | 14,330 | 4.7% |
[ 0.5% - 1.0% ] 0.83% | 31,593 | 1.8% |
[ 5.0% - 5.5% ] 5.26% | 2,375 | 14.0% |