Immigrants from Switzerland vs Immigrants from Greece 3 or more Vehicles in Household
COMPARE
Immigrants from Switzerland
Immigrants from Greece
3 or more Vehicles in Household
3 or more Vehicles in Household Comparison
Immigrants from Switzerland
Immigrants from Greece
18.4%
3 OR MORE VEHICLES IN HOUSEHOLD
5.0/ 100
METRIC RATING
229th/ 347
METRIC RANK
16.5%
3 OR MORE VEHICLES IN HOUSEHOLD
0.0/ 100
METRIC RATING
302nd/ 347
METRIC RANK
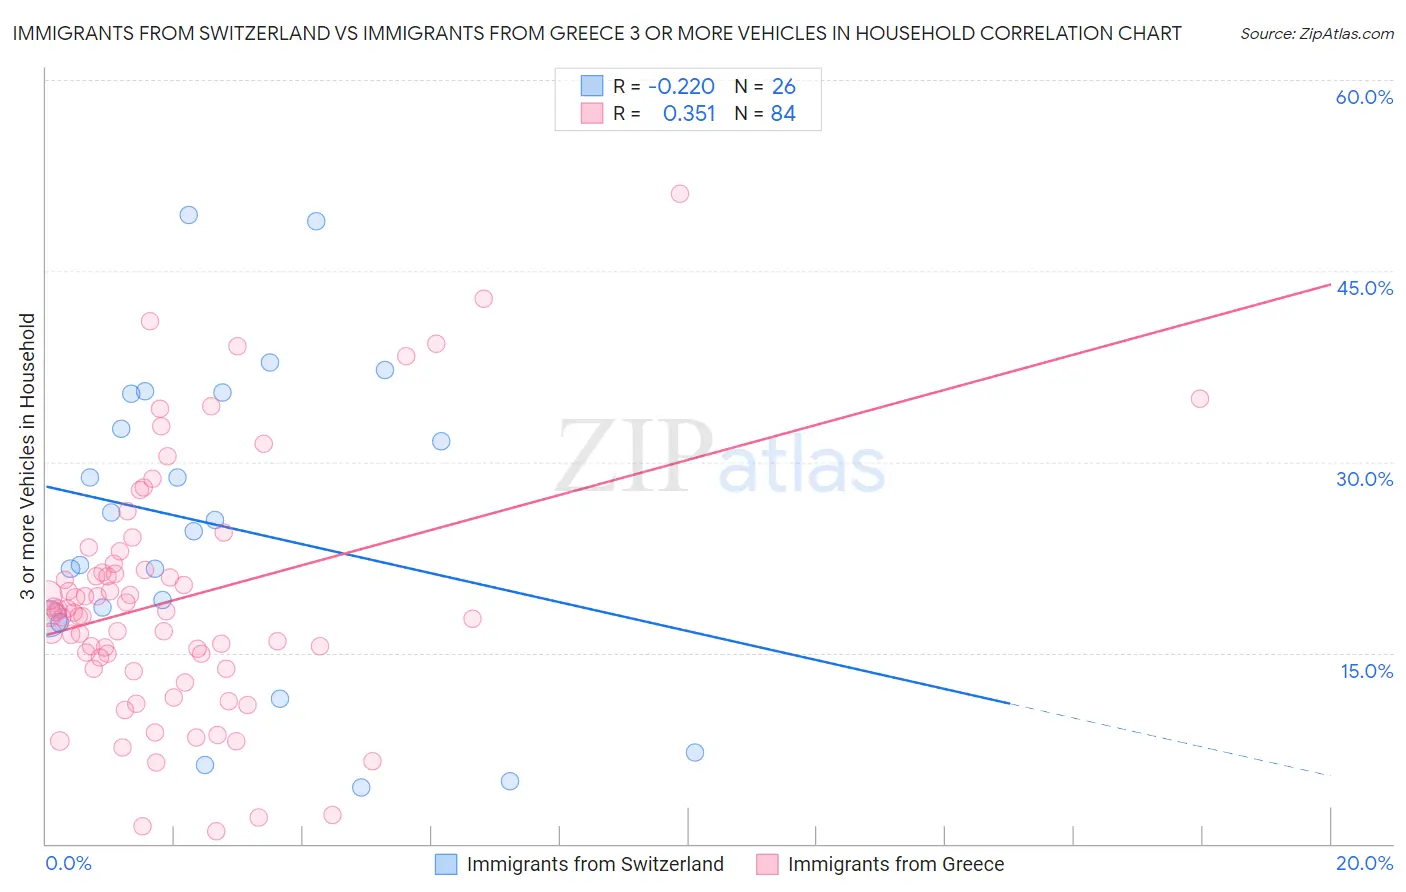
Immigrants from Switzerland vs Immigrants from Greece 3 or more Vehicles in Household Correlation Chart
The statistical analysis conducted on geographies consisting of 148,020,738 people shows a weak negative correlation between the proportion of Immigrants from Switzerland and percentage of households with 3 or more vehicles available in the United States with a correlation coefficient (R) of -0.220 and weighted average of 18.4%. Similarly, the statistical analysis conducted on geographies consisting of 216,821,688 people shows a mild positive correlation between the proportion of Immigrants from Greece and percentage of households with 3 or more vehicles available in the United States with a correlation coefficient (R) of 0.351 and weighted average of 16.5%, a difference of 11.7%.
3 or more Vehicles in Household Correlation Summary
| Measurement | Immigrants from Switzerland | Immigrants from Greece |
| Minimum | 4.4% | 1.0% |
| Maximum | 49.4% | 51.1% |
| Range | 45.1% | 50.1% |
| Mean | 25.0% | 19.2% |
| Median | 25.0% | 18.2% |
| Interquartile 25% (IQ1) | 17.6% | 14.2% |
| Interquartile 75% (IQ3) | 35.3% | 21.8% |
| Interquartile Range (IQR) | 17.7% | 7.6% |
| Standard Deviation (Sample) | 12.4% | 9.7% |
| Standard Deviation (Population) | 12.2% | 9.6% |
Similar Demographics by 3 or more Vehicles in Household
Demographics Similar to Immigrants from Switzerland by 3 or more Vehicles in Household
In terms of 3 or more vehicles in household, the demographic groups most similar to Immigrants from Switzerland are Immigrants from Western Asia (18.4%, a difference of 0.060%), Immigrants from Belgium (18.4%, a difference of 0.080%), Immigrants from Uganda (18.4%, a difference of 0.14%), Honduran (18.4%, a difference of 0.16%), and Turkish (18.4%, a difference of 0.17%).
| Demographics | Rating | Rank | 3 or more Vehicles in Household |
| Belizeans | 7.3 /100 | #222 | Tragic 18.6% |
| Immigrants | Czechoslovakia | 5.9 /100 | #223 | Tragic 18.5% |
| Immigrants | Argentina | 5.6 /100 | #224 | Tragic 18.5% |
| Immigrants | Lithuania | 5.6 /100 | #225 | Tragic 18.5% |
| Immigrants | Hungary | 5.5 /100 | #226 | Tragic 18.5% |
| Immigrants | Singapore | 5.4 /100 | #227 | Tragic 18.4% |
| Turks | 5.4 /100 | #228 | Tragic 18.4% |
| Immigrants | Switzerland | 5.0 /100 | #229 | Tragic 18.4% |
| Immigrants | Western Asia | 4.8 /100 | #230 | Tragic 18.4% |
| Immigrants | Belgium | 4.8 /100 | #231 | Tragic 18.4% |
| Immigrants | Uganda | 4.6 /100 | #232 | Tragic 18.4% |
| Hondurans | 4.6 /100 | #233 | Tragic 18.4% |
| Immigrants | North Macedonia | 4.4 /100 | #234 | Tragic 18.4% |
| Sierra Leoneans | 3.9 /100 | #235 | Tragic 18.3% |
| Immigrants | Malaysia | 3.6 /100 | #236 | Tragic 18.3% |
Demographics Similar to Immigrants from Greece by 3 or more Vehicles in Household
In terms of 3 or more vehicles in household, the demographic groups most similar to Immigrants from Greece are Immigrants from Serbia (16.4%, a difference of 0.31%), Paraguayan (16.6%, a difference of 0.43%), Ghanaian (16.4%, a difference of 0.78%), Cypriot (16.6%, a difference of 0.83%), and Immigrants from Morocco (16.3%, a difference of 1.0%).
| Demographics | Rating | Rank | 3 or more Vehicles in Household |
| Immigrants | Russia | 0.1 /100 | #295 | Tragic 16.9% |
| Inupiat | 0.1 /100 | #296 | Tragic 16.9% |
| Israelis | 0.1 /100 | #297 | Tragic 16.8% |
| Immigrants | Zaire | 0.1 /100 | #298 | Tragic 16.7% |
| Immigrants | South America | 0.1 /100 | #299 | Tragic 16.7% |
| Cypriots | 0.0 /100 | #300 | Tragic 16.6% |
| Paraguayans | 0.0 /100 | #301 | Tragic 16.6% |
| Immigrants | Greece | 0.0 /100 | #302 | Tragic 16.5% |
| Immigrants | Serbia | 0.0 /100 | #303 | Tragic 16.4% |
| Ghanaians | 0.0 /100 | #304 | Tragic 16.4% |
| Immigrants | Morocco | 0.0 /100 | #305 | Tragic 16.3% |
| Somalis | 0.0 /100 | #306 | Tragic 16.2% |
| Immigrants | Ghana | 0.0 /100 | #307 | Tragic 16.2% |
| Houma | 0.0 /100 | #308 | Tragic 16.1% |
| Immigrants | Somalia | 0.0 /100 | #309 | Tragic 15.9% |