Immigrants from Switzerland Married-couple Households
COMPARE
Immigrants from Switzerland
Select to Compare
Married-couple Households
Immigrants from Switzerland Married-couple Households
46.2%
MARRIED-COUPLE HOUSEHOLDS
36.9/ 100
METRIC RATING
184th/ 347
METRIC RANK
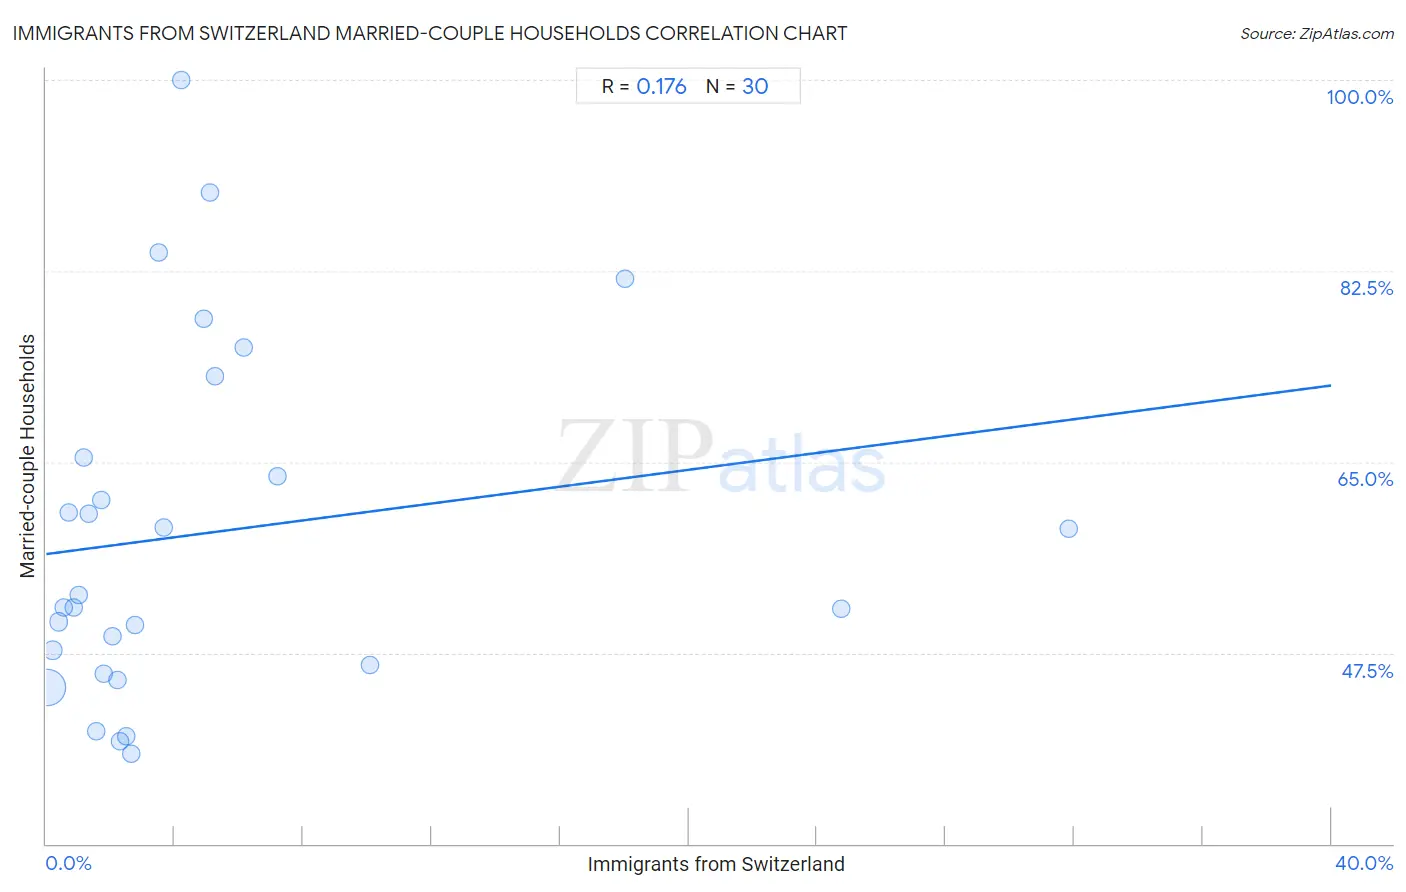
Immigrants from Switzerland Married-couple Households Correlation Chart
The statistical analysis conducted on geographies consisting of 148,072,536 people shows a poor positive correlation between the proportion of Immigrants from Switzerland and percentage of married-couple family households in the United States with a correlation coefficient (R) of 0.176 and weighted average of 46.2%. On average, for every 1% (one percent) increase in Immigrants from Switzerland within a typical geography, there is an increase of 0.39% in percentage of married-couple family households.
It is essential to understand that the correlation between the percentage of Immigrants from Switzerland and percentage of married-couple family households does not imply a direct cause-and-effect relationship. It remains uncertain whether the presence of Immigrants from Switzerland influences an upward or downward trend in the level of percentage of married-couple family households within an area, or if Immigrants from Switzerland simply ended up residing in those areas with higher or lower levels of percentage of married-couple family households due to other factors.
Demographics Similar to Immigrants from Switzerland by Married-couple Households
In terms of married-couple households, the demographic groups most similar to Immigrants from Switzerland are Brazilian (46.2%, a difference of 0.040%), Immigrants from Brazil (46.2%, a difference of 0.060%), Yugoslavian (46.2%, a difference of 0.080%), Mongolian (46.3%, a difference of 0.20%), and Malaysian (46.3%, a difference of 0.20%).
| Demographics | Rating | Rank | Married-couple Households |
| Immigrants | 43.8 /100 | #177 | Average 46.3% |
| Immigrants from Costa Rica | 43.4 /100 | #178 | Average 46.3% |
| Immigrants from Zimbabwe | 43.0 /100 | #179 | Average 46.3% |
| Mongolians | 42.0 /100 | #180 | Average 46.3% |
| Malaysians | 41.8 /100 | #181 | Average 46.3% |
| Yugoslavians | 38.9 /100 | #182 | Fair 46.2% |
| Immigrants from Brazil | 38.3 /100 | #183 | Fair 46.2% |
| Immigrants from Switzerland | 36.9 /100 | #184 | Fair 46.2% |
| Brazilians | 35.9 /100 | #185 | Fair 46.2% |
| Albanians | 31.1 /100 | #186 | Fair 46.1% |
| Fijians | 29.2 /100 | #187 | Fair 46.1% |
| South American Indians | 28.4 /100 | #188 | Fair 46.0% |
| Immigrants from Latvia | 26.9 /100 | #189 | Fair 46.0% |
| Immigrants from Kuwait | 25.6 /100 | #190 | Fair 46.0% |
| Choctaw | 24.9 /100 | #191 | Fair 46.0% |
Immigrants from Switzerland Married-couple Households Correlation Summary
| Measurement | Immigrants from Switzerland Data | Married-couple Households Data |
| Minimum | 0.033% | 38.3% |
| Maximum | 31.8% | 100.0% |
| Range | 31.8% | 61.7% |
| Mean | 5.0% | 58.5% |
| Median | 2.4% | 52.2% |
| Interquartile 25% (IQ1) | 1.2% | 46.4% |
| Interquartile 75% (IQ3) | 5.1% | 65.4% |
| Interquartile Range (IQR) | 3.9% | 19.0% |
| Standard Deviation (Sample) | 7.3% | 16.1% |
| Standard Deviation (Population) | 7.2% | 15.8% |
Correlation Details
| Immigrants from Switzerland Percentile | Sample Size | Married-couple Households |
[ 0.0% - 0.5% ] 0.033% | 140,568,200 | 44.3% |
[ 0.0% - 0.5% ] 0.21% | 5,758,523 | 47.7% |
[ 0.0% - 0.5% ] 0.38% | 921,488 | 50.3% |
[ 0.5% - 1.0% ] 0.53% | 374,580 | 51.6% |
[ 0.5% - 1.0% ] 0.68% | 181,920 | 60.4% |
[ 0.5% - 1.0% ] 0.87% | 133,785 | 51.6% |
[ 1.0% - 1.5% ] 1.01% | 46,657 | 52.8% |
[ 1.0% - 1.5% ] 1.17% | 31,802 | 65.4% |
[ 1.0% - 1.5% ] 1.33% | 21,535 | 60.3% |
[ 1.5% - 2.0% ] 1.55% | 10,271 | 40.3% |
[ 1.5% - 2.0% ] 1.70% | 2,235 | 61.5% |
[ 1.5% - 2.0% ] 1.81% | 2,598 | 45.6% |
[ 2.0% - 2.5% ] 2.05% | 342 | 49.0% |
[ 2.0% - 2.5% ] 2.21% | 1,132 | 45.0% |
[ 2.0% - 2.5% ] 2.31% | 4,295 | 39.3% |
[ 2.0% - 2.5% ] 2.47% | 5,743 | 39.9% |
[ 2.5% - 3.0% ] 2.63% | 1,559 | 38.3% |
[ 2.5% - 3.0% ] 2.75% | 255 | 50.0% |
[ 3.0% - 3.5% ] 3.49% | 716 | 84.2% |
[ 3.5% - 4.0% ] 3.65% | 521 | 59.0% |
[ 4.0% - 4.5% ] 4.21% | 95 | 100.0% |
[ 4.5% - 5.0% ] 4.91% | 224 | 78.1% |
[ 5.0% - 5.5% ] 5.11% | 372 | 89.7% |
[ 5.0% - 5.5% ] 5.26% | 2,375 | 72.9% |
[ 6.0% - 6.5% ] 6.14% | 114 | 75.4% |
[ 7.0% - 7.5% ] 7.21% | 319 | 63.6% |
[ 10.0% - 10.5% ] 10.09% | 228 | 46.4% |
[ 18.0% - 18.5% ] 18.00% | 511 | 81.7% |
[ 24.5% - 25.0% ] 24.74% | 97 | 51.5% |
[ 31.5% - 32.0% ] 31.82% | 44 | 58.8% |