Immigrants from Southern Europe vs Tongan 3 or more Vehicles in Household
COMPARE
Immigrants from Southern Europe
Tongan
3 or more Vehicles in Household
3 or more Vehicles in Household Comparison
Immigrants from Southern Europe
Tongans
17.9%
3 OR MORE VEHICLES IN HOUSEHOLD
1.4/ 100
METRIC RATING
252nd/ 347
METRIC RANK
26.5%
3 OR MORE VEHICLES IN HOUSEHOLD
100.0/ 100
METRIC RATING
3rd/ 347
METRIC RANK
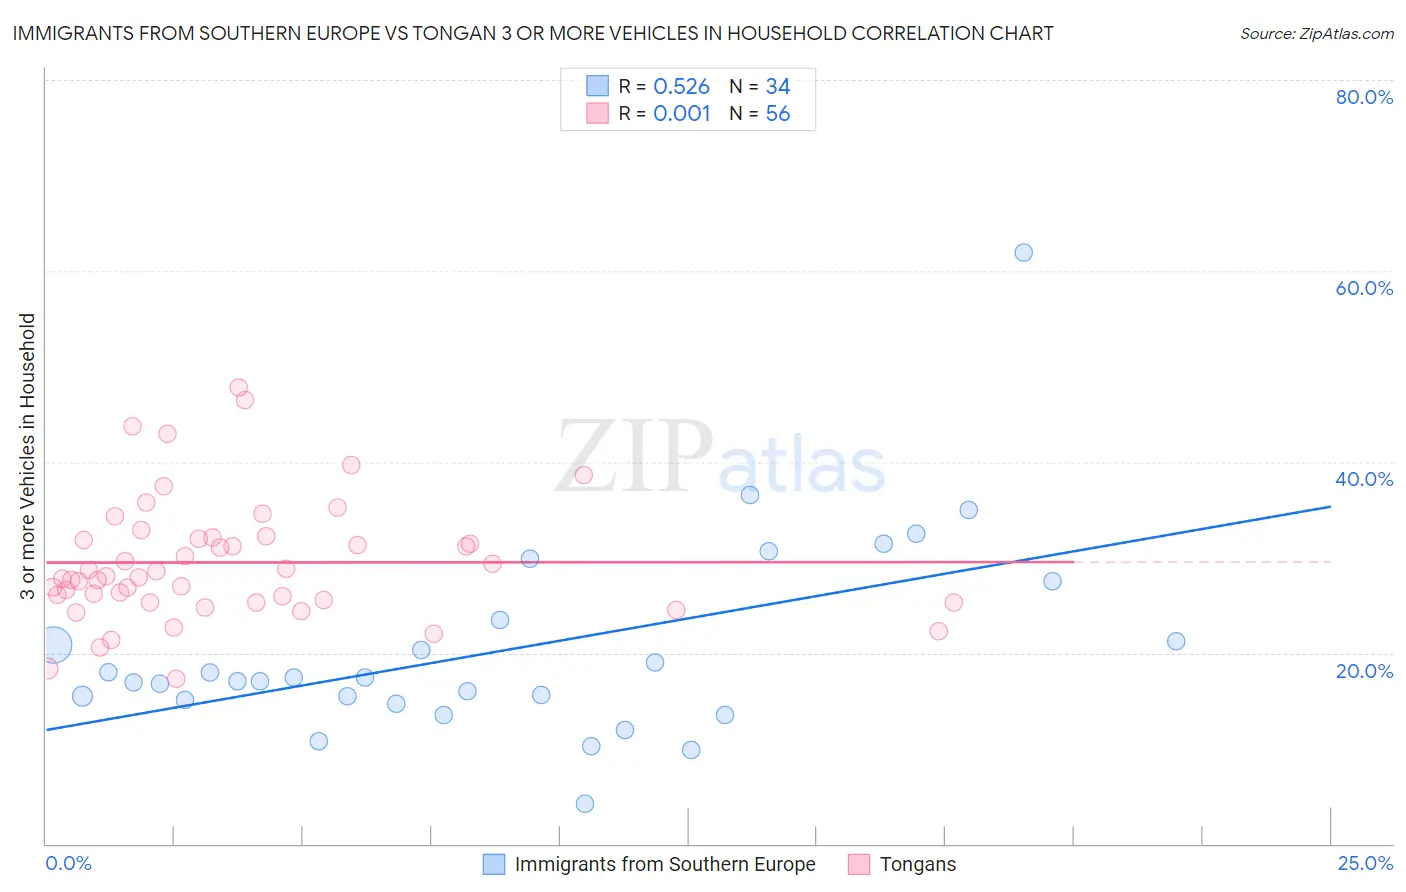
Immigrants from Southern Europe vs Tongan 3 or more Vehicles in Household Correlation Chart
The statistical analysis conducted on geographies consisting of 402,485,312 people shows a substantial positive correlation between the proportion of Immigrants from Southern Europe and percentage of households with 3 or more vehicles available in the United States with a correlation coefficient (R) of 0.526 and weighted average of 17.9%. Similarly, the statistical analysis conducted on geographies consisting of 102,870,832 people shows no correlation between the proportion of Tongans and percentage of households with 3 or more vehicles available in the United States with a correlation coefficient (R) of 0.001 and weighted average of 26.5%, a difference of 48.0%.
3 or more Vehicles in Household Correlation Summary
| Measurement | Immigrants from Southern Europe | Tongan |
| Minimum | 4.2% | 17.2% |
| Maximum | 61.9% | 47.8% |
| Range | 57.7% | 30.6% |
| Mean | 20.4% | 29.5% |
| Median | 17.2% | 28.0% |
| Interquartile 25% (IQ1) | 15.0% | 25.4% |
| Interquartile 75% (IQ3) | 23.4% | 32.0% |
| Interquartile Range (IQR) | 8.4% | 6.6% |
| Standard Deviation (Sample) | 10.6% | 6.4% |
| Standard Deviation (Population) | 10.4% | 6.4% |
Similar Demographics by 3 or more Vehicles in Household
Demographics Similar to Immigrants from Southern Europe by 3 or more Vehicles in Household
In terms of 3 or more vehicles in household, the demographic groups most similar to Immigrants from Southern Europe are Immigrants from Ethiopia (17.9%, a difference of 0.21%), Ethiopian (17.9%, a difference of 0.22%), Alsatian (18.0%, a difference of 0.23%), Immigrants from Turkey (17.9%, a difference of 0.25%), and Subsaharan African (17.9%, a difference of 0.40%).
| Demographics | Rating | Rank | 3 or more Vehicles in Household |
| Immigrants | Belize | 2.1 /100 | #245 | Tragic 18.1% |
| Immigrants | Australia | 2.0 /100 | #246 | Tragic 18.1% |
| Carpatho Rusyns | 1.9 /100 | #247 | Tragic 18.0% |
| Immigrants | Eastern Africa | 1.8 /100 | #248 | Tragic 18.0% |
| Immigrants | Saudi Arabia | 1.7 /100 | #249 | Tragic 18.0% |
| Venezuelans | 1.7 /100 | #250 | Tragic 18.0% |
| Alsatians | 1.5 /100 | #251 | Tragic 18.0% |
| Immigrants | Southern Europe | 1.4 /100 | #252 | Tragic 17.9% |
| Immigrants | Ethiopia | 1.3 /100 | #253 | Tragic 17.9% |
| Ethiopians | 1.2 /100 | #254 | Tragic 17.9% |
| Immigrants | Turkey | 1.2 /100 | #255 | Tragic 17.9% |
| Sub-Saharan Africans | 1.1 /100 | #256 | Tragic 17.9% |
| Immigrants | Eritrea | 1.1 /100 | #257 | Tragic 17.8% |
| Sudanese | 1.1 /100 | #258 | Tragic 17.8% |
| Uruguayans | 1.0 /100 | #259 | Tragic 17.8% |
Demographics Similar to Tongans by 3 or more Vehicles in Household
In terms of 3 or more vehicles in household, the demographic groups most similar to Tongans are Arapaho (26.4%, a difference of 0.33%), Puget Sound Salish (26.4%, a difference of 0.67%), Spanish American Indian (26.9%, a difference of 1.5%), Immigrants from Fiji (26.1%, a difference of 1.8%), and Colville (25.8%, a difference of 3.0%).
| Demographics | Rating | Rank | 3 or more Vehicles in Household |
| Yakama | 100.0 /100 | #1 | Exceptional 31.0% |
| Spanish American Indians | 100.0 /100 | #2 | Exceptional 26.9% |
| Tongans | 100.0 /100 | #3 | Exceptional 26.5% |
| Arapaho | 100.0 /100 | #4 | Exceptional 26.4% |
| Puget Sound Salish | 100.0 /100 | #5 | Exceptional 26.4% |
| Immigrants | Fiji | 100.0 /100 | #6 | Exceptional 26.1% |
| Colville | 100.0 /100 | #7 | Exceptional 25.8% |
| Samoans | 100.0 /100 | #8 | Exceptional 25.0% |
| Native Hawaiians | 100.0 /100 | #9 | Exceptional 24.9% |
| Nepalese | 100.0 /100 | #10 | Exceptional 24.9% |
| Shoshone | 100.0 /100 | #11 | Exceptional 24.9% |
| Danes | 100.0 /100 | #12 | Exceptional 24.7% |
| Mexicans | 100.0 /100 | #13 | Exceptional 24.7% |
| Immigrants | Mexico | 100.0 /100 | #14 | Exceptional 24.6% |
| Hawaiians | 100.0 /100 | #15 | Exceptional 24.3% |