Immigrants from Romania vs Ottawa 3 or more Vehicles in Household
COMPARE
Immigrants from Romania
Ottawa
3 or more Vehicles in Household
3 or more Vehicles in Household Comparison
Immigrants from Romania
Ottawa
18.9%
3 OR MORE VEHICLES IN HOUSEHOLD
14.6/ 100
METRIC RATING
204th/ 347
METRIC RANK
20.1%
3 OR MORE VEHICLES IN HOUSEHOLD
84.9/ 100
METRIC RATING
141st/ 347
METRIC RANK
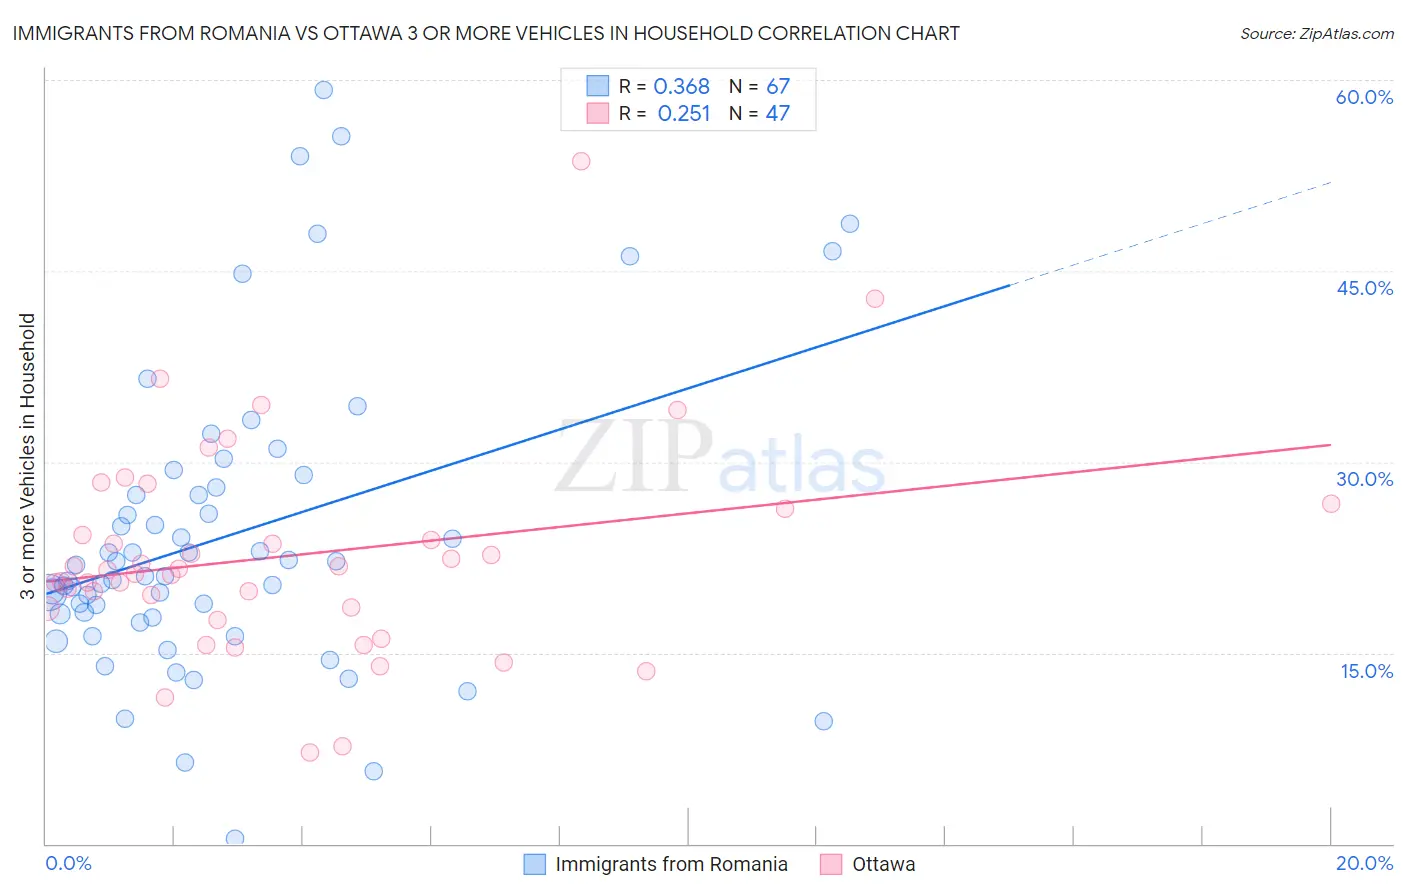
Immigrants from Romania vs Ottawa 3 or more Vehicles in Household Correlation Chart
The statistical analysis conducted on geographies consisting of 256,899,833 people shows a mild positive correlation between the proportion of Immigrants from Romania and percentage of households with 3 or more vehicles available in the United States with a correlation coefficient (R) of 0.368 and weighted average of 18.9%. Similarly, the statistical analysis conducted on geographies consisting of 49,939,188 people shows a weak positive correlation between the proportion of Ottawa and percentage of households with 3 or more vehicles available in the United States with a correlation coefficient (R) of 0.251 and weighted average of 20.1%, a difference of 6.8%.
3 or more Vehicles in Household Correlation Summary
| Measurement | Immigrants from Romania | Ottawa |
| Minimum | 0.43% | 7.1% |
| Maximum | 59.2% | 53.7% |
| Range | 58.8% | 46.5% |
| Mean | 24.2% | 22.6% |
| Median | 21.0% | 21.5% |
| Interquartile 25% (IQ1) | 17.8% | 18.5% |
| Interquartile 75% (IQ3) | 28.0% | 26.3% |
| Interquartile Range (IQR) | 10.2% | 7.8% |
| Standard Deviation (Sample) | 11.9% | 8.4% |
| Standard Deviation (Population) | 11.8% | 8.3% |
Similar Demographics by 3 or more Vehicles in Household
Demographics Similar to Immigrants from Romania by 3 or more Vehicles in Household
In terms of 3 or more vehicles in household, the demographic groups most similar to Immigrants from Romania are Tohono O'odham (18.9%, a difference of 0.030%), Russian (18.8%, a difference of 0.070%), Immigrants from Eastern Asia (18.8%, a difference of 0.080%), Immigrants from Austria (18.9%, a difference of 0.12%), and Immigrants from Chile (18.8%, a difference of 0.16%).
| Demographics | Rating | Rank | 3 or more Vehicles in Household |
| Immigrants | Japan | 22.0 /100 | #197 | Fair 19.0% |
| Egyptians | 19.5 /100 | #198 | Poor 19.0% |
| Immigrants | Norway | 19.0 /100 | #199 | Poor 19.0% |
| Argentineans | 18.2 /100 | #200 | Poor 18.9% |
| Arabs | 17.7 /100 | #201 | Poor 18.9% |
| Immigrants | Austria | 15.4 /100 | #202 | Poor 18.9% |
| Tohono O'odham | 14.8 /100 | #203 | Poor 18.9% |
| Immigrants | Romania | 14.6 /100 | #204 | Poor 18.9% |
| Russians | 14.2 /100 | #205 | Poor 18.8% |
| Immigrants | Eastern Asia | 14.1 /100 | #206 | Poor 18.8% |
| Immigrants | Chile | 13.6 /100 | #207 | Poor 18.8% |
| Immigrants | Burma/Myanmar | 13.6 /100 | #208 | Poor 18.8% |
| Immigrants | Egypt | 13.5 /100 | #209 | Poor 18.8% |
| Bulgarians | 13.1 /100 | #210 | Poor 18.8% |
| Immigrants | Kenya | 12.4 /100 | #211 | Poor 18.8% |
Demographics Similar to Ottawa by 3 or more Vehicles in Household
In terms of 3 or more vehicles in household, the demographic groups most similar to Ottawa are French American Indian (20.1%, a difference of 0.060%), Jordanian (20.1%, a difference of 0.060%), Lithuanian (20.1%, a difference of 0.070%), Slovene (20.2%, a difference of 0.090%), and Iranian (20.1%, a difference of 0.12%).
| Demographics | Rating | Rank | 3 or more Vehicles in Household |
| Poles | 87.3 /100 | #134 | Excellent 20.2% |
| Immigrants | India | 87.2 /100 | #135 | Excellent 20.2% |
| Immigrants | Nicaragua | 87.1 /100 | #136 | Excellent 20.2% |
| Immigrants | Iraq | 87.1 /100 | #137 | Excellent 20.2% |
| Aleuts | 86.3 /100 | #138 | Excellent 20.2% |
| Slovenes | 85.5 /100 | #139 | Excellent 20.2% |
| French American Indians | 85.3 /100 | #140 | Excellent 20.1% |
| Ottawa | 84.9 /100 | #141 | Excellent 20.1% |
| Jordanians | 84.4 /100 | #142 | Excellent 20.1% |
| Lithuanians | 84.4 /100 | #143 | Excellent 20.1% |
| Iranians | 84.0 /100 | #144 | Excellent 20.1% |
| Palestinians | 83.9 /100 | #145 | Excellent 20.1% |
| Australians | 83.6 /100 | #146 | Excellent 20.1% |
| Slovaks | 83.0 /100 | #147 | Excellent 20.1% |
| Guatemalans | 82.6 /100 | #148 | Excellent 20.1% |