Immigrants from Oceania vs Ethiopian 3 or more Vehicles in Household
COMPARE
Immigrants from Oceania
Ethiopian
3 or more Vehicles in Household
3 or more Vehicles in Household Comparison
Immigrants from Oceania
Ethiopians
21.8%
3 OR MORE VEHICLES IN HOUSEHOLD
99.8/ 100
METRIC RATING
74th/ 347
METRIC RANK
17.9%
3 OR MORE VEHICLES IN HOUSEHOLD
1.2/ 100
METRIC RATING
254th/ 347
METRIC RANK
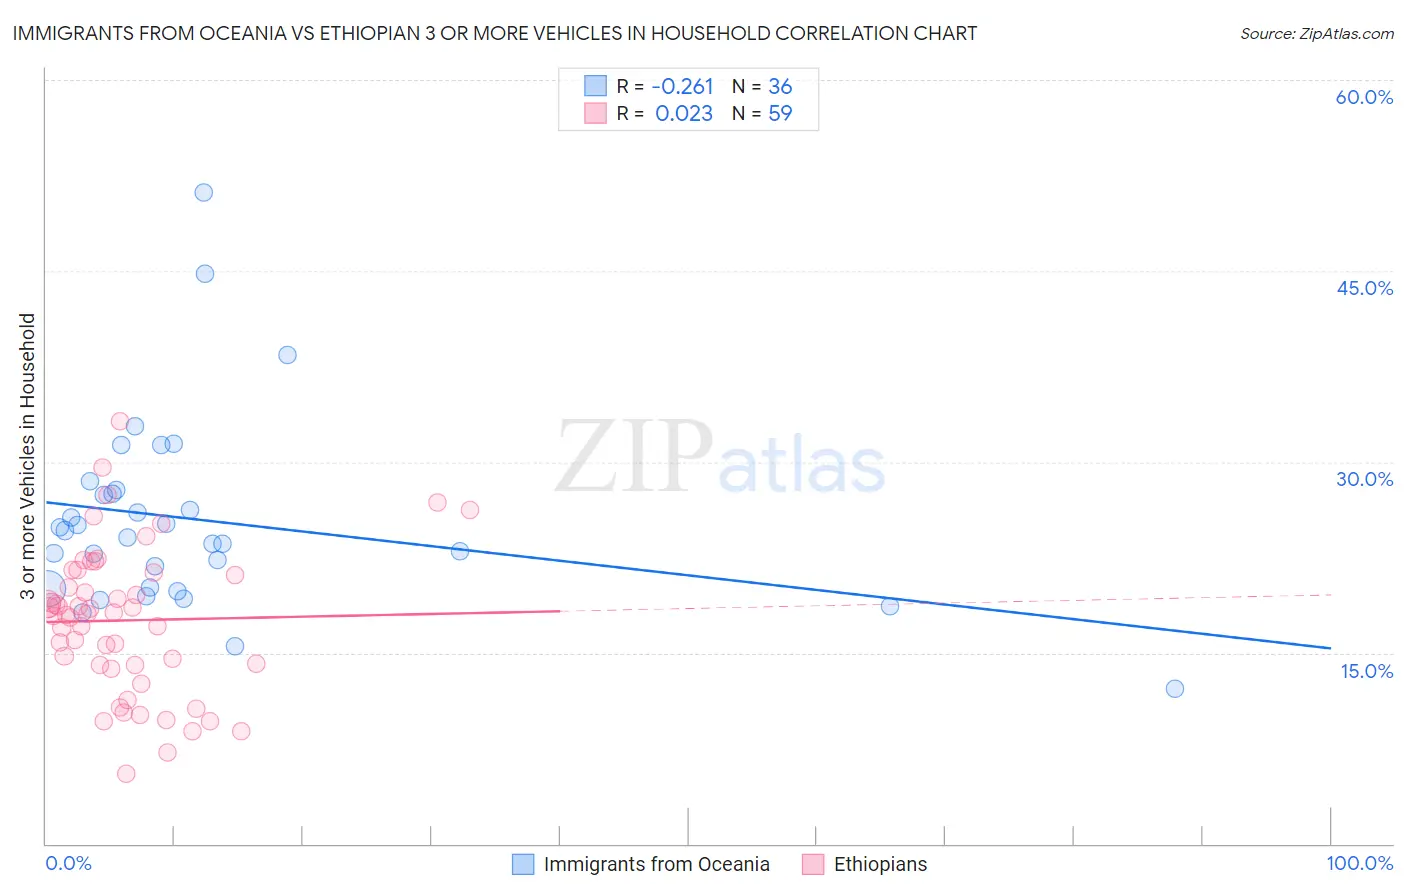
Immigrants from Oceania vs Ethiopian 3 or more Vehicles in Household Correlation Chart
The statistical analysis conducted on geographies consisting of 305,272,843 people shows a weak negative correlation between the proportion of Immigrants from Oceania and percentage of households with 3 or more vehicles available in the United States with a correlation coefficient (R) of -0.261 and weighted average of 21.8%. Similarly, the statistical analysis conducted on geographies consisting of 223,058,389 people shows no correlation between the proportion of Ethiopians and percentage of households with 3 or more vehicles available in the United States with a correlation coefficient (R) of 0.023 and weighted average of 17.9%, a difference of 21.9%.
3 or more Vehicles in Household Correlation Summary
| Measurement | Immigrants from Oceania | Ethiopian |
| Minimum | 12.2% | 5.5% |
| Maximum | 51.2% | 33.2% |
| Range | 39.0% | 27.8% |
| Mean | 25.4% | 17.5% |
| Median | 24.3% | 18.0% |
| Interquartile 25% (IQ1) | 20.1% | 14.0% |
| Interquartile 75% (IQ3) | 27.6% | 21.3% |
| Interquartile Range (IQR) | 7.6% | 7.3% |
| Standard Deviation (Sample) | 7.6% | 5.8% |
| Standard Deviation (Population) | 7.5% | 5.7% |
Similar Demographics by 3 or more Vehicles in Household
Demographics Similar to Immigrants from Oceania by 3 or more Vehicles in Household
In terms of 3 or more vehicles in household, the demographic groups most similar to Immigrants from Oceania are Salvadoran (21.8%, a difference of 0.020%), Japanese (21.8%, a difference of 0.10%), Portuguese (21.8%, a difference of 0.11%), Nonimmigrants (21.8%, a difference of 0.15%), and Irish (21.8%, a difference of 0.22%).
| Demographics | Rating | Rank | 3 or more Vehicles in Household |
| Alaskan Athabascans | 99.9 /100 | #67 | Exceptional 21.9% |
| British | 99.9 /100 | #68 | Exceptional 21.9% |
| Creek | 99.9 /100 | #69 | Exceptional 21.9% |
| Bangladeshis | 99.8 /100 | #70 | Exceptional 21.9% |
| Potawatomi | 99.8 /100 | #71 | Exceptional 21.9% |
| Portuguese | 99.8 /100 | #72 | Exceptional 21.8% |
| Salvadorans | 99.8 /100 | #73 | Exceptional 21.8% |
| Immigrants | Oceania | 99.8 /100 | #74 | Exceptional 21.8% |
| Japanese | 99.8 /100 | #75 | Exceptional 21.8% |
| Immigrants | Nonimmigrants | 99.8 /100 | #76 | Exceptional 21.8% |
| Irish | 99.8 /100 | #77 | Exceptional 21.8% |
| Czechoslovakians | 99.8 /100 | #78 | Exceptional 21.7% |
| Assyrians/Chaldeans/Syriacs | 99.8 /100 | #79 | Exceptional 21.7% |
| Afghans | 99.7 /100 | #80 | Exceptional 21.7% |
| Celtics | 99.7 /100 | #81 | Exceptional 21.7% |
Demographics Similar to Ethiopians by 3 or more Vehicles in Household
In terms of 3 or more vehicles in household, the demographic groups most similar to Ethiopians are Immigrants from Ethiopia (17.9%, a difference of 0.0%), Immigrants from Turkey (17.9%, a difference of 0.030%), Subsaharan African (17.9%, a difference of 0.18%), Immigrants from Southern Europe (17.9%, a difference of 0.22%), and Immigrants from Eritrea (17.8%, a difference of 0.23%).
| Demographics | Rating | Rank | 3 or more Vehicles in Household |
| Carpatho Rusyns | 1.9 /100 | #247 | Tragic 18.0% |
| Immigrants | Eastern Africa | 1.8 /100 | #248 | Tragic 18.0% |
| Immigrants | Saudi Arabia | 1.7 /100 | #249 | Tragic 18.0% |
| Venezuelans | 1.7 /100 | #250 | Tragic 18.0% |
| Alsatians | 1.5 /100 | #251 | Tragic 18.0% |
| Immigrants | Southern Europe | 1.4 /100 | #252 | Tragic 17.9% |
| Immigrants | Ethiopia | 1.3 /100 | #253 | Tragic 17.9% |
| Ethiopians | 1.2 /100 | #254 | Tragic 17.9% |
| Immigrants | Turkey | 1.2 /100 | #255 | Tragic 17.9% |
| Sub-Saharan Africans | 1.1 /100 | #256 | Tragic 17.9% |
| Immigrants | Eritrea | 1.1 /100 | #257 | Tragic 17.8% |
| Sudanese | 1.1 /100 | #258 | Tragic 17.8% |
| Uruguayans | 1.0 /100 | #259 | Tragic 17.8% |
| Ugandans | 0.9 /100 | #260 | Tragic 17.8% |
| Immigrants | Northern Africa | 0.9 /100 | #261 | Tragic 17.8% |