Immigrants from Oceania vs Bolivian 3 or more Vehicles in Household
COMPARE
Immigrants from Oceania
Bolivian
3 or more Vehicles in Household
3 or more Vehicles in Household Comparison
Immigrants from Oceania
Bolivians
21.8%
3 OR MORE VEHICLES IN HOUSEHOLD
99.8/ 100
METRIC RATING
74th/ 347
METRIC RANK
20.8%
3 OR MORE VEHICLES IN HOUSEHOLD
97.4/ 100
METRIC RATING
106th/ 347
METRIC RANK
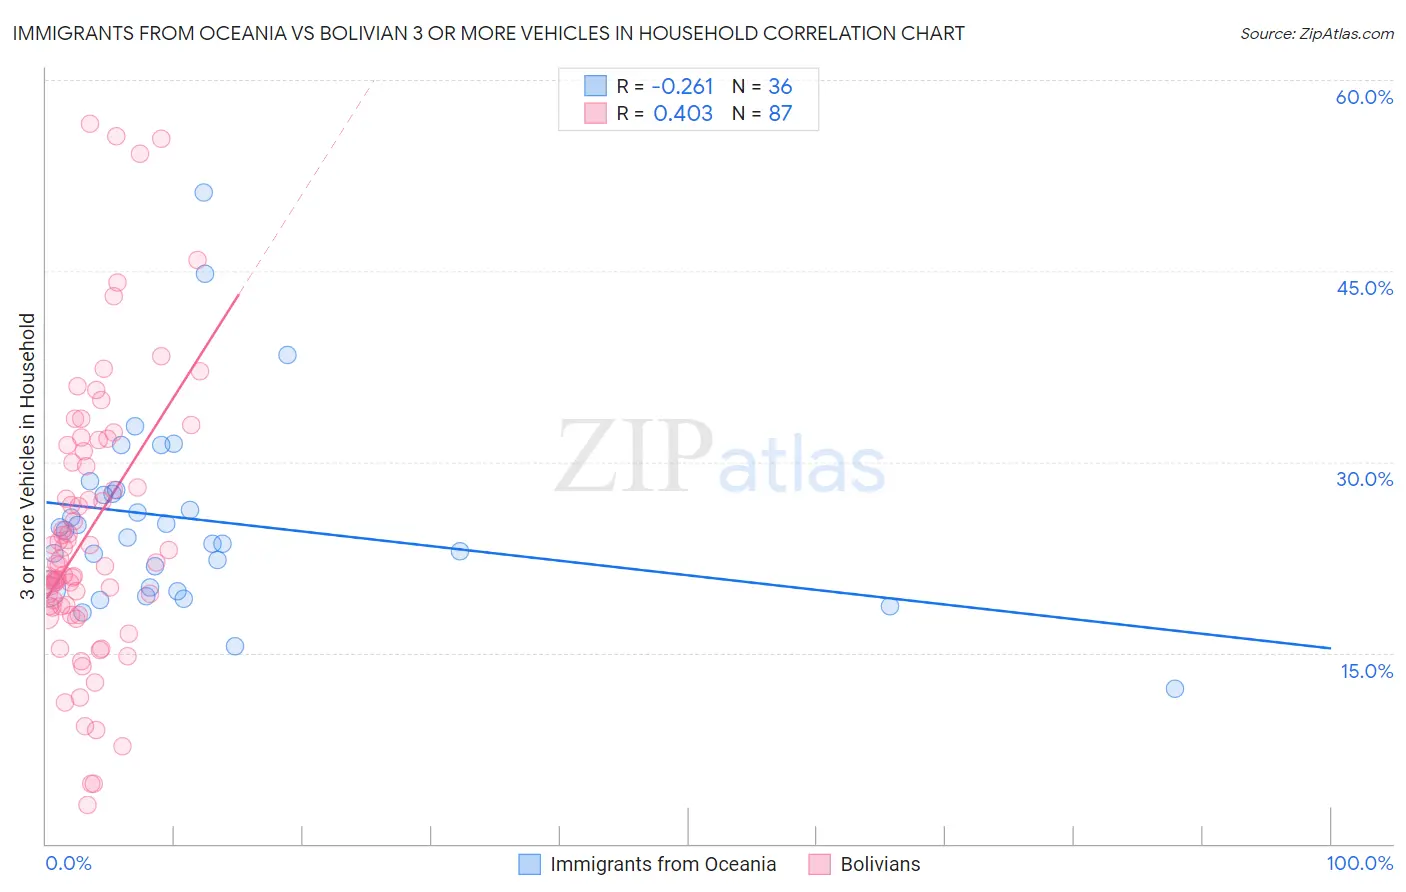
Immigrants from Oceania vs Bolivian 3 or more Vehicles in Household Correlation Chart
The statistical analysis conducted on geographies consisting of 305,272,843 people shows a weak negative correlation between the proportion of Immigrants from Oceania and percentage of households with 3 or more vehicles available in the United States with a correlation coefficient (R) of -0.261 and weighted average of 21.8%. Similarly, the statistical analysis conducted on geographies consisting of 184,604,965 people shows a moderate positive correlation between the proportion of Bolivians and percentage of households with 3 or more vehicles available in the United States with a correlation coefficient (R) of 0.403 and weighted average of 20.8%, a difference of 4.6%.
3 or more Vehicles in Household Correlation Summary
| Measurement | Immigrants from Oceania | Bolivian |
| Minimum | 12.2% | 3.1% |
| Maximum | 51.2% | 56.5% |
| Range | 39.0% | 53.5% |
| Mean | 25.4% | 24.5% |
| Median | 24.3% | 22.0% |
| Interquartile 25% (IQ1) | 20.1% | 18.6% |
| Interquartile 75% (IQ3) | 27.6% | 30.8% |
| Interquartile Range (IQR) | 7.6% | 12.2% |
| Standard Deviation (Sample) | 7.6% | 10.9% |
| Standard Deviation (Population) | 7.5% | 10.9% |
Similar Demographics by 3 or more Vehicles in Household
Demographics Similar to Immigrants from Oceania by 3 or more Vehicles in Household
In terms of 3 or more vehicles in household, the demographic groups most similar to Immigrants from Oceania are Salvadoran (21.8%, a difference of 0.020%), Japanese (21.8%, a difference of 0.10%), Portuguese (21.8%, a difference of 0.11%), Nonimmigrants (21.8%, a difference of 0.15%), and Irish (21.8%, a difference of 0.22%).
| Demographics | Rating | Rank | 3 or more Vehicles in Household |
| Alaskan Athabascans | 99.9 /100 | #67 | Exceptional 21.9% |
| British | 99.9 /100 | #68 | Exceptional 21.9% |
| Creek | 99.9 /100 | #69 | Exceptional 21.9% |
| Bangladeshis | 99.8 /100 | #70 | Exceptional 21.9% |
| Potawatomi | 99.8 /100 | #71 | Exceptional 21.9% |
| Portuguese | 99.8 /100 | #72 | Exceptional 21.8% |
| Salvadorans | 99.8 /100 | #73 | Exceptional 21.8% |
| Immigrants | Oceania | 99.8 /100 | #74 | Exceptional 21.8% |
| Japanese | 99.8 /100 | #75 | Exceptional 21.8% |
| Immigrants | Nonimmigrants | 99.8 /100 | #76 | Exceptional 21.8% |
| Irish | 99.8 /100 | #77 | Exceptional 21.8% |
| Czechoslovakians | 99.8 /100 | #78 | Exceptional 21.7% |
| Assyrians/Chaldeans/Syriacs | 99.8 /100 | #79 | Exceptional 21.7% |
| Afghans | 99.7 /100 | #80 | Exceptional 21.7% |
| Celtics | 99.7 /100 | #81 | Exceptional 21.7% |
Demographics Similar to Bolivians by 3 or more Vehicles in Household
In terms of 3 or more vehicles in household, the demographic groups most similar to Bolivians are Immigrants from Germany (20.8%, a difference of 0.040%), Austrian (20.9%, a difference of 0.090%), Immigrants from Scotland (20.8%, a difference of 0.19%), Luxembourger (20.9%, a difference of 0.20%), and Filipino (20.8%, a difference of 0.25%).
| Demographics | Rating | Rank | 3 or more Vehicles in Household |
| Alaska Natives | 98.2 /100 | #99 | Exceptional 21.0% |
| Comanche | 98.2 /100 | #100 | Exceptional 21.0% |
| Blackfeet | 97.9 /100 | #101 | Exceptional 20.9% |
| Seminole | 97.8 /100 | #102 | Exceptional 20.9% |
| Dutch West Indians | 97.8 /100 | #103 | Exceptional 20.9% |
| Luxembourgers | 97.7 /100 | #104 | Exceptional 20.9% |
| Austrians | 97.5 /100 | #105 | Exceptional 20.9% |
| Bolivians | 97.4 /100 | #106 | Exceptional 20.8% |
| Immigrants | Germany | 97.4 /100 | #107 | Exceptional 20.8% |
| Immigrants | Scotland | 97.1 /100 | #108 | Exceptional 20.8% |
| Filipinos | 97.0 /100 | #109 | Exceptional 20.8% |
| Asians | 96.8 /100 | #110 | Exceptional 20.8% |
| Immigrants | Micronesia | 96.7 /100 | #111 | Exceptional 20.7% |
| Nicaraguans | 96.2 /100 | #112 | Exceptional 20.7% |
| Immigrants | England | 96.2 /100 | #113 | Exceptional 20.7% |