Immigrants from Oceania vs Okinawan 3 or more Vehicles in Household
COMPARE
Immigrants from Oceania
Okinawan
3 or more Vehicles in Household
3 or more Vehicles in Household Comparison
Immigrants from Oceania
Okinawans
21.8%
3 OR MORE VEHICLES IN HOUSEHOLD
99.8/ 100
METRIC RATING
74th/ 347
METRIC RANK
17.4%
3 OR MORE VEHICLES IN HOUSEHOLD
0.4/ 100
METRIC RATING
276th/ 347
METRIC RANK
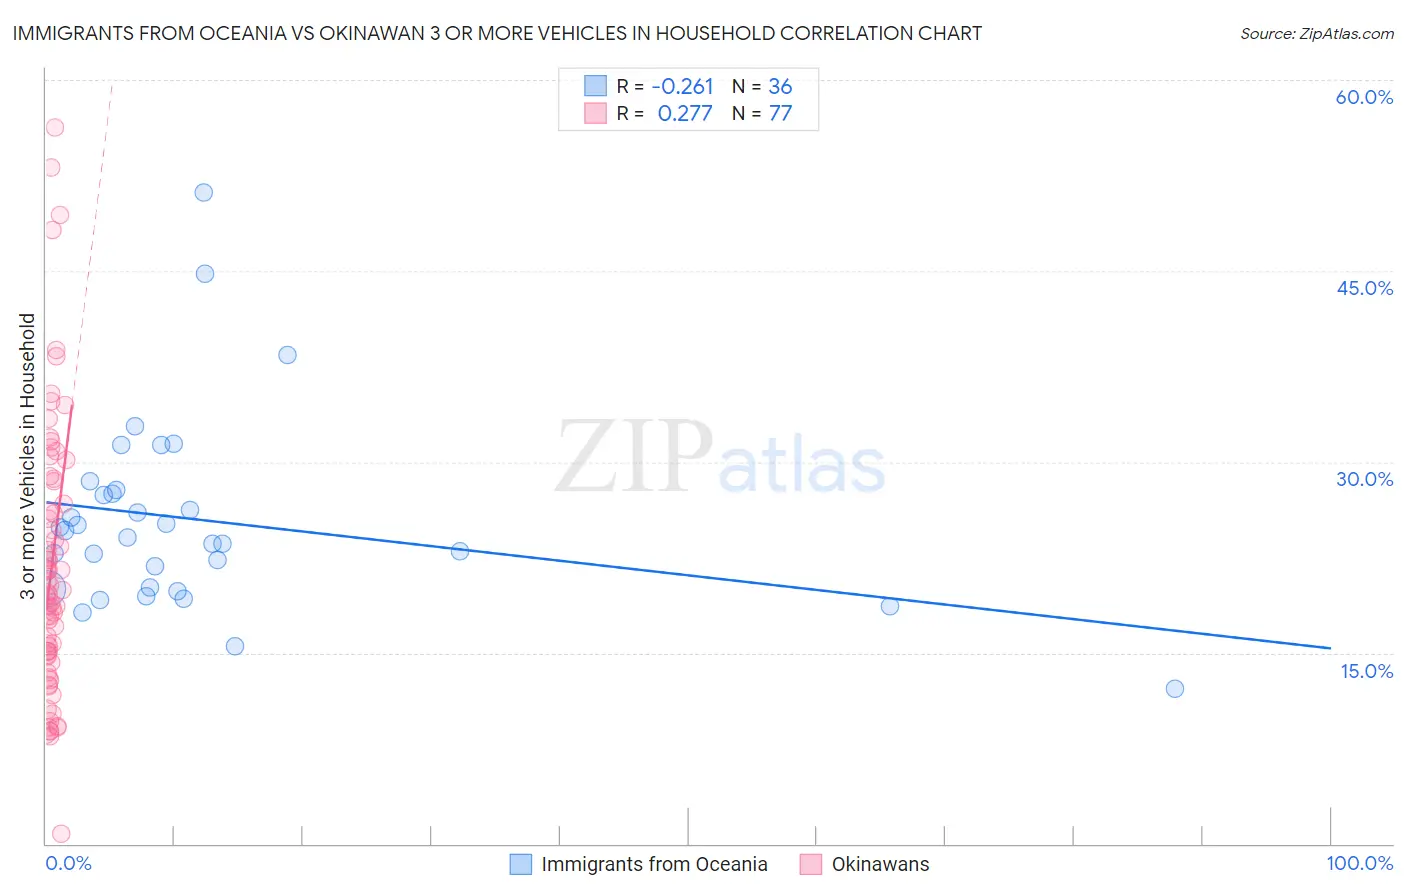
Immigrants from Oceania vs Okinawan 3 or more Vehicles in Household Correlation Chart
The statistical analysis conducted on geographies consisting of 305,272,843 people shows a weak negative correlation between the proportion of Immigrants from Oceania and percentage of households with 3 or more vehicles available in the United States with a correlation coefficient (R) of -0.261 and weighted average of 21.8%. Similarly, the statistical analysis conducted on geographies consisting of 73,703,163 people shows a weak positive correlation between the proportion of Okinawans and percentage of households with 3 or more vehicles available in the United States with a correlation coefficient (R) of 0.277 and weighted average of 17.4%, a difference of 25.0%.
3 or more Vehicles in Household Correlation Summary
| Measurement | Immigrants from Oceania | Okinawan |
| Minimum | 12.2% | 0.75% |
| Maximum | 51.2% | 56.2% |
| Range | 39.0% | 55.5% |
| Mean | 25.4% | 21.7% |
| Median | 24.3% | 19.5% |
| Interquartile 25% (IQ1) | 20.1% | 14.8% |
| Interquartile 75% (IQ3) | 27.6% | 27.6% |
| Interquartile Range (IQR) | 7.6% | 12.8% |
| Standard Deviation (Sample) | 7.6% | 10.7% |
| Standard Deviation (Population) | 7.5% | 10.6% |
Similar Demographics by 3 or more Vehicles in Household
Demographics Similar to Immigrants from Oceania by 3 or more Vehicles in Household
In terms of 3 or more vehicles in household, the demographic groups most similar to Immigrants from Oceania are Salvadoran (21.8%, a difference of 0.020%), Japanese (21.8%, a difference of 0.10%), Portuguese (21.8%, a difference of 0.11%), Nonimmigrants (21.8%, a difference of 0.15%), and Irish (21.8%, a difference of 0.22%).
| Demographics | Rating | Rank | 3 or more Vehicles in Household |
| Alaskan Athabascans | 99.9 /100 | #67 | Exceptional 21.9% |
| British | 99.9 /100 | #68 | Exceptional 21.9% |
| Creek | 99.9 /100 | #69 | Exceptional 21.9% |
| Bangladeshis | 99.8 /100 | #70 | Exceptional 21.9% |
| Potawatomi | 99.8 /100 | #71 | Exceptional 21.9% |
| Portuguese | 99.8 /100 | #72 | Exceptional 21.8% |
| Salvadorans | 99.8 /100 | #73 | Exceptional 21.8% |
| Immigrants | Oceania | 99.8 /100 | #74 | Exceptional 21.8% |
| Japanese | 99.8 /100 | #75 | Exceptional 21.8% |
| Immigrants | Nonimmigrants | 99.8 /100 | #76 | Exceptional 21.8% |
| Irish | 99.8 /100 | #77 | Exceptional 21.8% |
| Czechoslovakians | 99.8 /100 | #78 | Exceptional 21.7% |
| Assyrians/Chaldeans/Syriacs | 99.8 /100 | #79 | Exceptional 21.7% |
| Afghans | 99.7 /100 | #80 | Exceptional 21.7% |
| Celtics | 99.7 /100 | #81 | Exceptional 21.7% |
Demographics Similar to Okinawans by 3 or more Vehicles in Household
In terms of 3 or more vehicles in household, the demographic groups most similar to Okinawans are Brazilian (17.4%, a difference of 0.14%), Immigrants from Ukraine (17.5%, a difference of 0.16%), Immigrants from Bahamas (17.4%, a difference of 0.23%), Immigrants from Kazakhstan (17.4%, a difference of 0.25%), and Immigrants from Eastern Europe (17.4%, a difference of 0.29%).
| Demographics | Rating | Rank | 3 or more Vehicles in Household |
| Immigrants | France | 0.6 /100 | #269 | Tragic 17.6% |
| Immigrants | Nepal | 0.6 /100 | #270 | Tragic 17.6% |
| South Americans | 0.6 /100 | #271 | Tragic 17.6% |
| Immigrants | Africa | 0.5 /100 | #272 | Tragic 17.6% |
| Immigrants | Sudan | 0.5 /100 | #273 | Tragic 17.6% |
| Immigrants | Bosnia and Herzegovina | 0.5 /100 | #274 | Tragic 17.5% |
| Immigrants | Ukraine | 0.4 /100 | #275 | Tragic 17.5% |
| Okinawans | 0.4 /100 | #276 | Tragic 17.4% |
| Brazilians | 0.4 /100 | #277 | Tragic 17.4% |
| Immigrants | Bahamas | 0.3 /100 | #278 | Tragic 17.4% |
| Immigrants | Kazakhstan | 0.3 /100 | #279 | Tragic 17.4% |
| Immigrants | Eastern Europe | 0.3 /100 | #280 | Tragic 17.4% |
| Immigrants | Latvia | 0.3 /100 | #281 | Tragic 17.4% |
| Immigrants | Ireland | 0.3 /100 | #282 | Tragic 17.3% |
| Blacks/African Americans | 0.3 /100 | #283 | Tragic 17.3% |