Immigrants from Australia vs Immigrants from Cameroon 3 or more Vehicles in Household
COMPARE
Immigrants from Australia
Immigrants from Cameroon
3 or more Vehicles in Household
3 or more Vehicles in Household Comparison
Immigrants from Australia
Immigrants from Cameroon
18.1%
3 OR MORE VEHICLES IN HOUSEHOLD
2.0/ 100
METRIC RATING
246th/ 347
METRIC RANK
19.7%
3 OR MORE VEHICLES IN HOUSEHOLD
60.9/ 100
METRIC RATING
166th/ 347
METRIC RANK
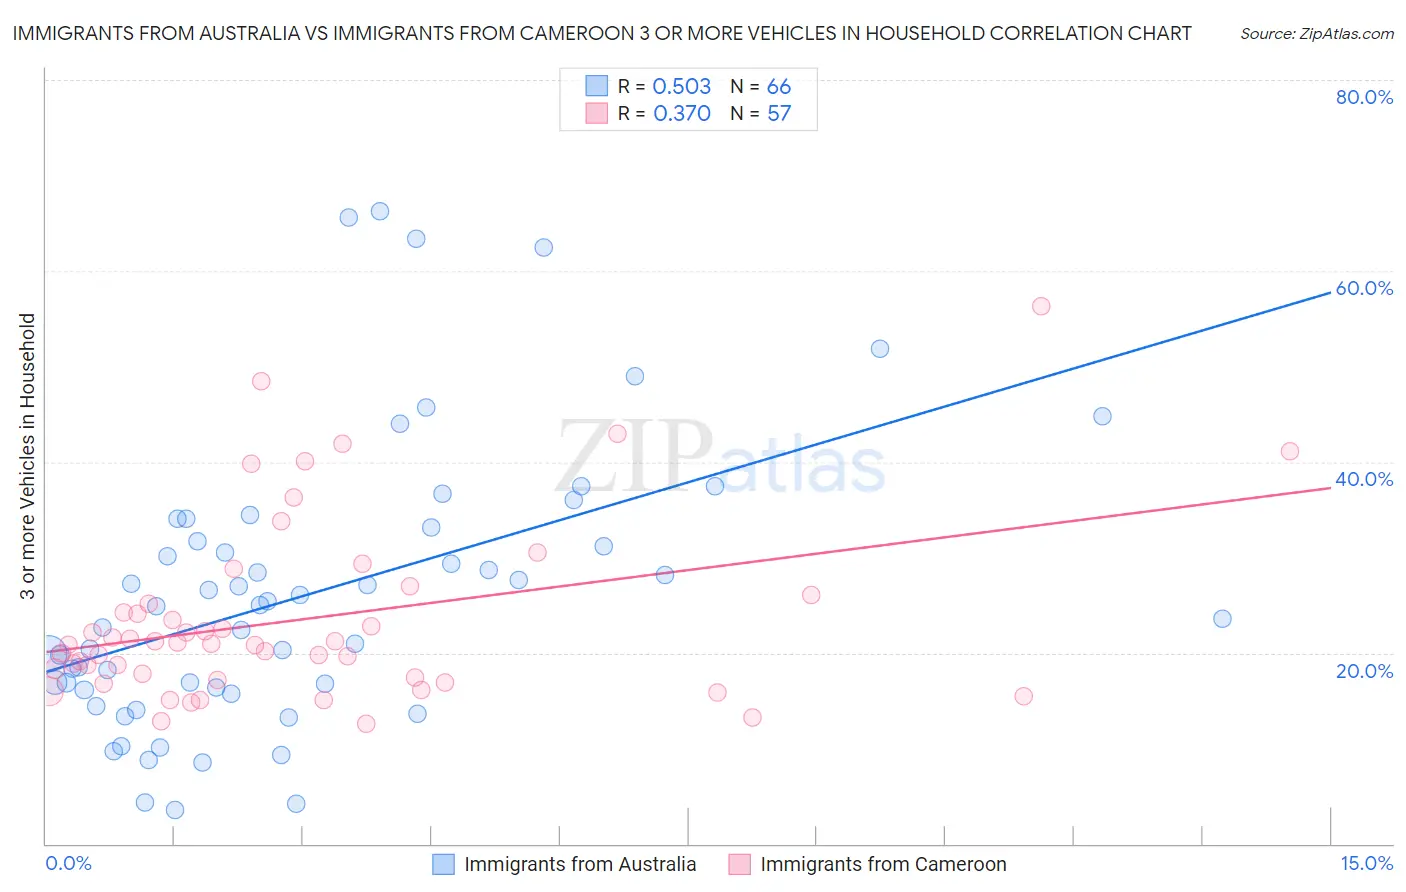
Immigrants from Australia vs Immigrants from Cameroon 3 or more Vehicles in Household Correlation Chart
The statistical analysis conducted on geographies consisting of 227,053,605 people shows a substantial positive correlation between the proportion of Immigrants from Australia and percentage of households with 3 or more vehicles available in the United States with a correlation coefficient (R) of 0.503 and weighted average of 18.1%. Similarly, the statistical analysis conducted on geographies consisting of 130,731,455 people shows a mild positive correlation between the proportion of Immigrants from Cameroon and percentage of households with 3 or more vehicles available in the United States with a correlation coefficient (R) of 0.370 and weighted average of 19.7%, a difference of 8.8%.
3 or more Vehicles in Household Correlation Summary
| Measurement | Immigrants from Australia | Immigrants from Cameroon |
| Minimum | 3.6% | 12.6% |
| Maximum | 66.2% | 56.3% |
| Range | 62.7% | 43.7% |
| Mean | 26.2% | 23.5% |
| Median | 24.9% | 20.9% |
| Interquartile 25% (IQ1) | 16.4% | 17.3% |
| Interquartile 75% (IQ3) | 33.1% | 25.6% |
| Interquartile Range (IQR) | 16.7% | 8.3% |
| Standard Deviation (Sample) | 14.6% | 9.4% |
| Standard Deviation (Population) | 14.5% | 9.3% |
Similar Demographics by 3 or more Vehicles in Household
Demographics Similar to Immigrants from Australia by 3 or more Vehicles in Household
In terms of 3 or more vehicles in household, the demographic groups most similar to Immigrants from Australia are Immigrants from Belize (18.1%, a difference of 0.070%), Carpatho Rusyn (18.0%, a difference of 0.16%), Mongolian (18.1%, a difference of 0.23%), Immigrants from Eastern Africa (18.0%, a difference of 0.29%), and Immigrants from Europe (18.1%, a difference of 0.35%).
| Demographics | Rating | Rank | 3 or more Vehicles in Household |
| Immigrants | Middle Africa | 3.1 /100 | #239 | Tragic 18.2% |
| Immigrants | China | 2.9 /100 | #240 | Tragic 18.2% |
| Africans | 2.7 /100 | #241 | Tragic 18.2% |
| Hopi | 2.5 /100 | #242 | Tragic 18.2% |
| Immigrants | Europe | 2.4 /100 | #243 | Tragic 18.1% |
| Mongolians | 2.3 /100 | #244 | Tragic 18.1% |
| Immigrants | Belize | 2.1 /100 | #245 | Tragic 18.1% |
| Immigrants | Australia | 2.0 /100 | #246 | Tragic 18.1% |
| Carpatho Rusyns | 1.9 /100 | #247 | Tragic 18.0% |
| Immigrants | Eastern Africa | 1.8 /100 | #248 | Tragic 18.0% |
| Immigrants | Saudi Arabia | 1.7 /100 | #249 | Tragic 18.0% |
| Venezuelans | 1.7 /100 | #250 | Tragic 18.0% |
| Alsatians | 1.5 /100 | #251 | Tragic 18.0% |
| Immigrants | Southern Europe | 1.4 /100 | #252 | Tragic 17.9% |
| Immigrants | Ethiopia | 1.3 /100 | #253 | Tragic 17.9% |
Demographics Similar to Immigrants from Cameroon by 3 or more Vehicles in Household
In terms of 3 or more vehicles in household, the demographic groups most similar to Immigrants from Cameroon are Immigrants from Costa Rica (19.7%, a difference of 0.080%), Yugoslavian (19.7%, a difference of 0.16%), Ukrainian (19.6%, a difference of 0.16%), Chilean (19.7%, a difference of 0.17%), and Peruvian (19.6%, a difference of 0.17%).
| Demographics | Rating | Rank | 3 or more Vehicles in Household |
| Immigrants | Pakistan | 68.2 /100 | #159 | Good 19.8% |
| Immigrants | Lebanon | 67.6 /100 | #160 | Good 19.8% |
| Immigrants | Guatemala | 65.6 /100 | #161 | Good 19.7% |
| Estonians | 63.2 /100 | #162 | Good 19.7% |
| Chileans | 63.0 /100 | #163 | Good 19.7% |
| Yugoslavians | 62.9 /100 | #164 | Good 19.7% |
| Immigrants | Costa Rica | 61.9 /100 | #165 | Good 19.7% |
| Immigrants | Cameroon | 60.9 /100 | #166 | Good 19.7% |
| Ukrainians | 58.9 /100 | #167 | Average 19.6% |
| Peruvians | 58.8 /100 | #168 | Average 19.6% |
| Immigrants | Denmark | 57.6 /100 | #169 | Average 19.6% |
| Iraqis | 56.0 /100 | #170 | Average 19.6% |
| Immigrants | Western Europe | 53.2 /100 | #171 | Average 19.5% |
| Kiowa | 50.9 /100 | #172 | Average 19.5% |
| Immigrants | Northern Europe | 50.2 /100 | #173 | Average 19.5% |