Immigrants from Australia vs Immigrants from Bulgaria 3 or more Vehicles in Household
COMPARE
Immigrants from Australia
Immigrants from Bulgaria
3 or more Vehicles in Household
3 or more Vehicles in Household Comparison
Immigrants from Australia
Immigrants from Bulgaria
18.1%
3 OR MORE VEHICLES IN HOUSEHOLD
2.0/ 100
METRIC RATING
246th/ 347
METRIC RANK
17.7%
3 OR MORE VEHICLES IN HOUSEHOLD
0.8/ 100
METRIC RATING
268th/ 347
METRIC RANK
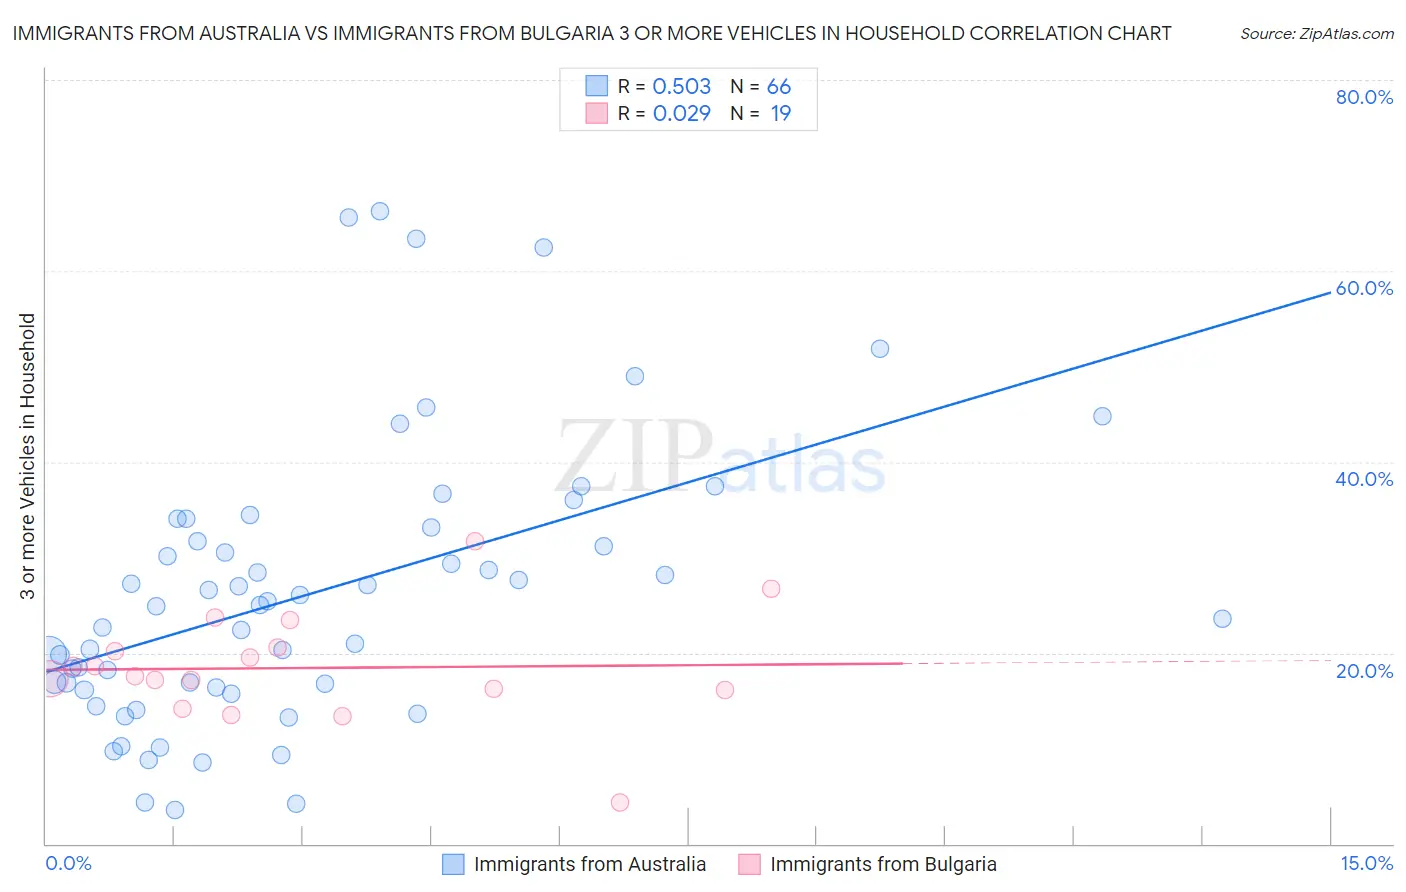
Immigrants from Australia vs Immigrants from Bulgaria 3 or more Vehicles in Household Correlation Chart
The statistical analysis conducted on geographies consisting of 227,053,605 people shows a substantial positive correlation between the proportion of Immigrants from Australia and percentage of households with 3 or more vehicles available in the United States with a correlation coefficient (R) of 0.503 and weighted average of 18.1%. Similarly, the statistical analysis conducted on geographies consisting of 172,519,366 people shows no correlation between the proportion of Immigrants from Bulgaria and percentage of households with 3 or more vehicles available in the United States with a correlation coefficient (R) of 0.029 and weighted average of 17.7%, a difference of 2.0%.
3 or more Vehicles in Household Correlation Summary
| Measurement | Immigrants from Australia | Immigrants from Bulgaria |
| Minimum | 3.6% | 4.4% |
| Maximum | 66.2% | 31.6% |
| Range | 62.7% | 27.3% |
| Mean | 26.2% | 18.4% |
| Median | 24.9% | 17.6% |
| Interquartile 25% (IQ1) | 16.4% | 16.1% |
| Interquartile 75% (IQ3) | 33.1% | 20.5% |
| Interquartile Range (IQR) | 16.7% | 4.4% |
| Standard Deviation (Sample) | 14.6% | 5.7% |
| Standard Deviation (Population) | 14.5% | 5.5% |
Similar Demographics by 3 or more Vehicles in Household
Demographics Similar to Immigrants from Australia by 3 or more Vehicles in Household
In terms of 3 or more vehicles in household, the demographic groups most similar to Immigrants from Australia are Immigrants from Belize (18.1%, a difference of 0.070%), Carpatho Rusyn (18.0%, a difference of 0.16%), Mongolian (18.1%, a difference of 0.23%), Immigrants from Eastern Africa (18.0%, a difference of 0.29%), and Immigrants from Europe (18.1%, a difference of 0.35%).
| Demographics | Rating | Rank | 3 or more Vehicles in Household |
| Immigrants | Middle Africa | 3.1 /100 | #239 | Tragic 18.2% |
| Immigrants | China | 2.9 /100 | #240 | Tragic 18.2% |
| Africans | 2.7 /100 | #241 | Tragic 18.2% |
| Hopi | 2.5 /100 | #242 | Tragic 18.2% |
| Immigrants | Europe | 2.4 /100 | #243 | Tragic 18.1% |
| Mongolians | 2.3 /100 | #244 | Tragic 18.1% |
| Immigrants | Belize | 2.1 /100 | #245 | Tragic 18.1% |
| Immigrants | Australia | 2.0 /100 | #246 | Tragic 18.1% |
| Carpatho Rusyns | 1.9 /100 | #247 | Tragic 18.0% |
| Immigrants | Eastern Africa | 1.8 /100 | #248 | Tragic 18.0% |
| Immigrants | Saudi Arabia | 1.7 /100 | #249 | Tragic 18.0% |
| Venezuelans | 1.7 /100 | #250 | Tragic 18.0% |
| Alsatians | 1.5 /100 | #251 | Tragic 18.0% |
| Immigrants | Southern Europe | 1.4 /100 | #252 | Tragic 17.9% |
| Immigrants | Ethiopia | 1.3 /100 | #253 | Tragic 17.9% |
Demographics Similar to Immigrants from Bulgaria by 3 or more Vehicles in Household
In terms of 3 or more vehicles in household, the demographic groups most similar to Immigrants from Bulgaria are Immigrants from Venezuela (17.7%, a difference of 0.010%), Macedonian (17.7%, a difference of 0.070%), Immigrants from Panama (17.7%, a difference of 0.090%), Cambodian (17.8%, a difference of 0.23%), and Bermudan (17.8%, a difference of 0.26%).
| Demographics | Rating | Rank | 3 or more Vehicles in Household |
| Immigrants | Northern Africa | 0.9 /100 | #261 | Tragic 17.8% |
| Colombians | 0.9 /100 | #262 | Tragic 17.8% |
| Bermudans | 0.9 /100 | #263 | Tragic 17.8% |
| Cambodians | 0.9 /100 | #264 | Tragic 17.8% |
| Immigrants | Panama | 0.8 /100 | #265 | Tragic 17.7% |
| Macedonians | 0.8 /100 | #266 | Tragic 17.7% |
| Immigrants | Venezuela | 0.8 /100 | #267 | Tragic 17.7% |
| Immigrants | Bulgaria | 0.8 /100 | #268 | Tragic 17.7% |
| Immigrants | France | 0.6 /100 | #269 | Tragic 17.6% |
| Immigrants | Nepal | 0.6 /100 | #270 | Tragic 17.6% |
| South Americans | 0.6 /100 | #271 | Tragic 17.6% |
| Immigrants | Africa | 0.5 /100 | #272 | Tragic 17.6% |
| Immigrants | Sudan | 0.5 /100 | #273 | Tragic 17.6% |
| Immigrants | Bosnia and Herzegovina | 0.5 /100 | #274 | Tragic 17.5% |
| Immigrants | Ukraine | 0.4 /100 | #275 | Tragic 17.5% |