Immigrants from Australia vs French 3 or more Vehicles in Household
COMPARE
Immigrants from Australia
French
3 or more Vehicles in Household
3 or more Vehicles in Household Comparison
Immigrants from Australia
French
18.1%
3 OR MORE VEHICLES IN HOUSEHOLD
2.0/ 100
METRIC RATING
246th/ 347
METRIC RANK
21.4%
3 OR MORE VEHICLES IN HOUSEHOLD
99.4/ 100
METRIC RATING
88th/ 347
METRIC RANK
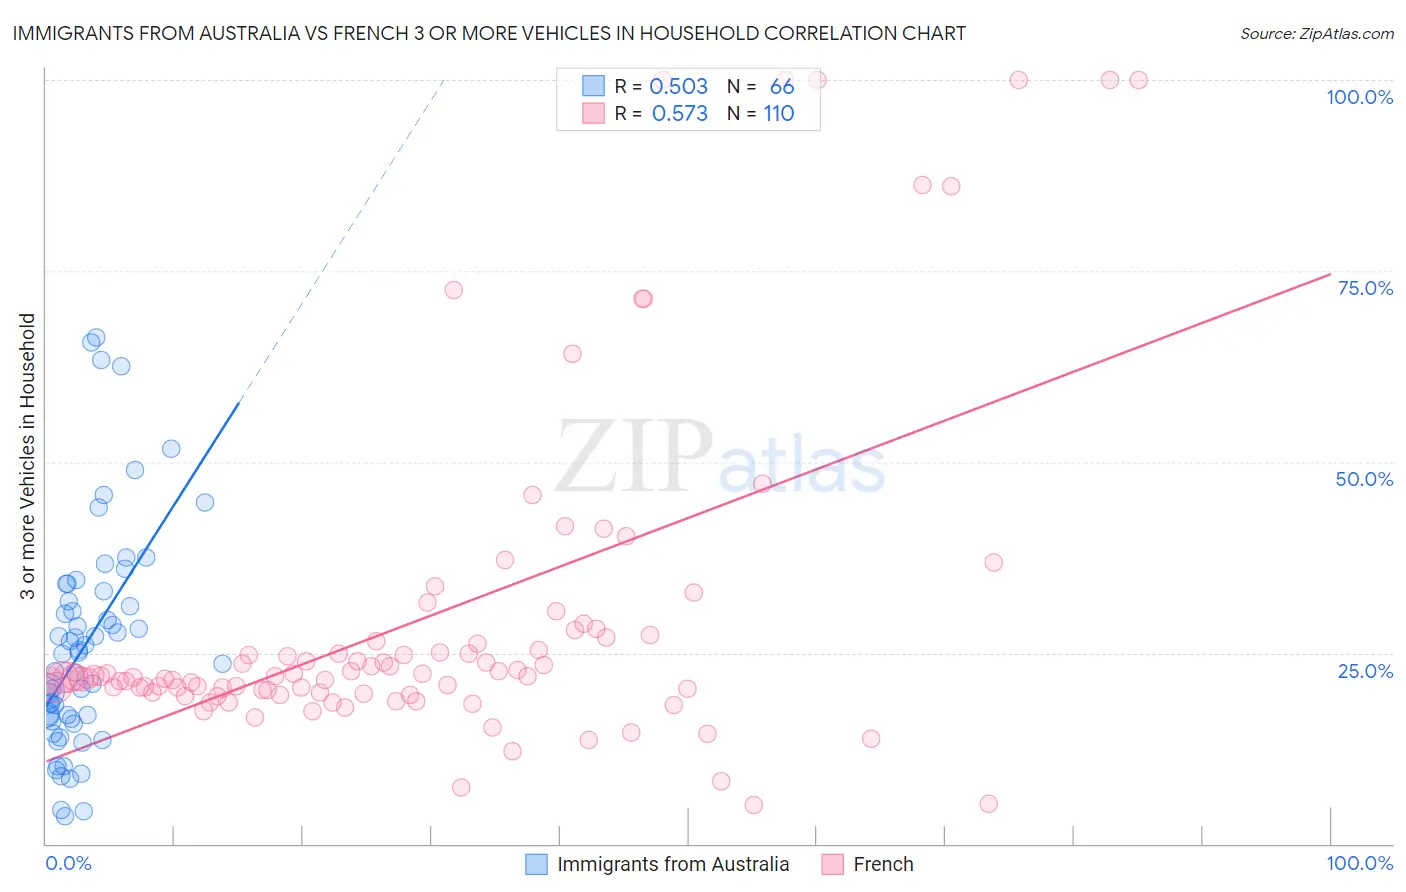
Immigrants from Australia vs French 3 or more Vehicles in Household Correlation Chart
The statistical analysis conducted on geographies consisting of 227,053,605 people shows a substantial positive correlation between the proportion of Immigrants from Australia and percentage of households with 3 or more vehicles available in the United States with a correlation coefficient (R) of 0.503 and weighted average of 18.1%. Similarly, the statistical analysis conducted on geographies consisting of 571,506,399 people shows a substantial positive correlation between the proportion of French and percentage of households with 3 or more vehicles available in the United States with a correlation coefficient (R) of 0.573 and weighted average of 21.4%, a difference of 18.5%.
3 or more Vehicles in Household Correlation Summary
| Measurement | Immigrants from Australia | French |
| Minimum | 3.6% | 5.1% |
| Maximum | 66.2% | 100.0% |
| Range | 62.7% | 94.9% |
| Mean | 26.2% | 29.6% |
| Median | 24.9% | 21.9% |
| Interquartile 25% (IQ1) | 16.4% | 19.8% |
| Interquartile 75% (IQ3) | 33.1% | 27.1% |
| Interquartile Range (IQR) | 16.7% | 7.3% |
| Standard Deviation (Sample) | 14.6% | 22.0% |
| Standard Deviation (Population) | 14.5% | 21.9% |
Similar Demographics by 3 or more Vehicles in Household
Demographics Similar to Immigrants from Australia by 3 or more Vehicles in Household
In terms of 3 or more vehicles in household, the demographic groups most similar to Immigrants from Australia are Immigrants from Belize (18.1%, a difference of 0.070%), Carpatho Rusyn (18.0%, a difference of 0.16%), Mongolian (18.1%, a difference of 0.23%), Immigrants from Eastern Africa (18.0%, a difference of 0.29%), and Immigrants from Europe (18.1%, a difference of 0.35%).
| Demographics | Rating | Rank | 3 or more Vehicles in Household |
| Immigrants | Middle Africa | 3.1 /100 | #239 | Tragic 18.2% |
| Immigrants | China | 2.9 /100 | #240 | Tragic 18.2% |
| Africans | 2.7 /100 | #241 | Tragic 18.2% |
| Hopi | 2.5 /100 | #242 | Tragic 18.2% |
| Immigrants | Europe | 2.4 /100 | #243 | Tragic 18.1% |
| Mongolians | 2.3 /100 | #244 | Tragic 18.1% |
| Immigrants | Belize | 2.1 /100 | #245 | Tragic 18.1% |
| Immigrants | Australia | 2.0 /100 | #246 | Tragic 18.1% |
| Carpatho Rusyns | 1.9 /100 | #247 | Tragic 18.0% |
| Immigrants | Eastern Africa | 1.8 /100 | #248 | Tragic 18.0% |
| Immigrants | Saudi Arabia | 1.7 /100 | #249 | Tragic 18.0% |
| Venezuelans | 1.7 /100 | #250 | Tragic 18.0% |
| Alsatians | 1.5 /100 | #251 | Tragic 18.0% |
| Immigrants | Southern Europe | 1.4 /100 | #252 | Tragic 17.9% |
| Immigrants | Ethiopia | 1.3 /100 | #253 | Tragic 17.9% |
Demographics Similar to French by 3 or more Vehicles in Household
In terms of 3 or more vehicles in household, the demographic groups most similar to French are Immigrants from the Azores (21.5%, a difference of 0.26%), Delaware (21.5%, a difference of 0.38%), Laotian (21.5%, a difference of 0.46%), Icelander (21.5%, a difference of 0.47%), and Chippewa (21.5%, a difference of 0.53%).
| Demographics | Rating | Rank | 3 or more Vehicles in Household |
| Celtics | 99.7 /100 | #81 | Exceptional 21.7% |
| Immigrants | El Salvador | 99.6 /100 | #82 | Exceptional 21.5% |
| Chippewa | 99.6 /100 | #83 | Exceptional 21.5% |
| Icelanders | 99.6 /100 | #84 | Exceptional 21.5% |
| Laotians | 99.6 /100 | #85 | Exceptional 21.5% |
| Delaware | 99.6 /100 | #86 | Exceptional 21.5% |
| Immigrants | Azores | 99.5 /100 | #87 | Exceptional 21.5% |
| French | 99.4 /100 | #88 | Exceptional 21.4% |
| Marshallese | 99.2 /100 | #89 | Exceptional 21.3% |
| Immigrants | Afghanistan | 99.1 /100 | #90 | Exceptional 21.2% |
| Belgians | 98.9 /100 | #91 | Exceptional 21.2% |
| Apache | 98.9 /100 | #92 | Exceptional 21.2% |
| Immigrants | Indonesia | 98.8 /100 | #93 | Exceptional 21.1% |
| Immigrants | Cambodia | 98.6 /100 | #94 | Exceptional 21.1% |
| Pakistanis | 98.5 /100 | #95 | Exceptional 21.0% |