Immigrants from Australia vs Salvadoran 3 or more Vehicles in Household
COMPARE
Immigrants from Australia
Salvadoran
3 or more Vehicles in Household
3 or more Vehicles in Household Comparison
Immigrants from Australia
Salvadorans
18.1%
3 OR MORE VEHICLES IN HOUSEHOLD
2.0/ 100
METRIC RATING
246th/ 347
METRIC RANK
21.8%
3 OR MORE VEHICLES IN HOUSEHOLD
99.8/ 100
METRIC RATING
73rd/ 347
METRIC RANK
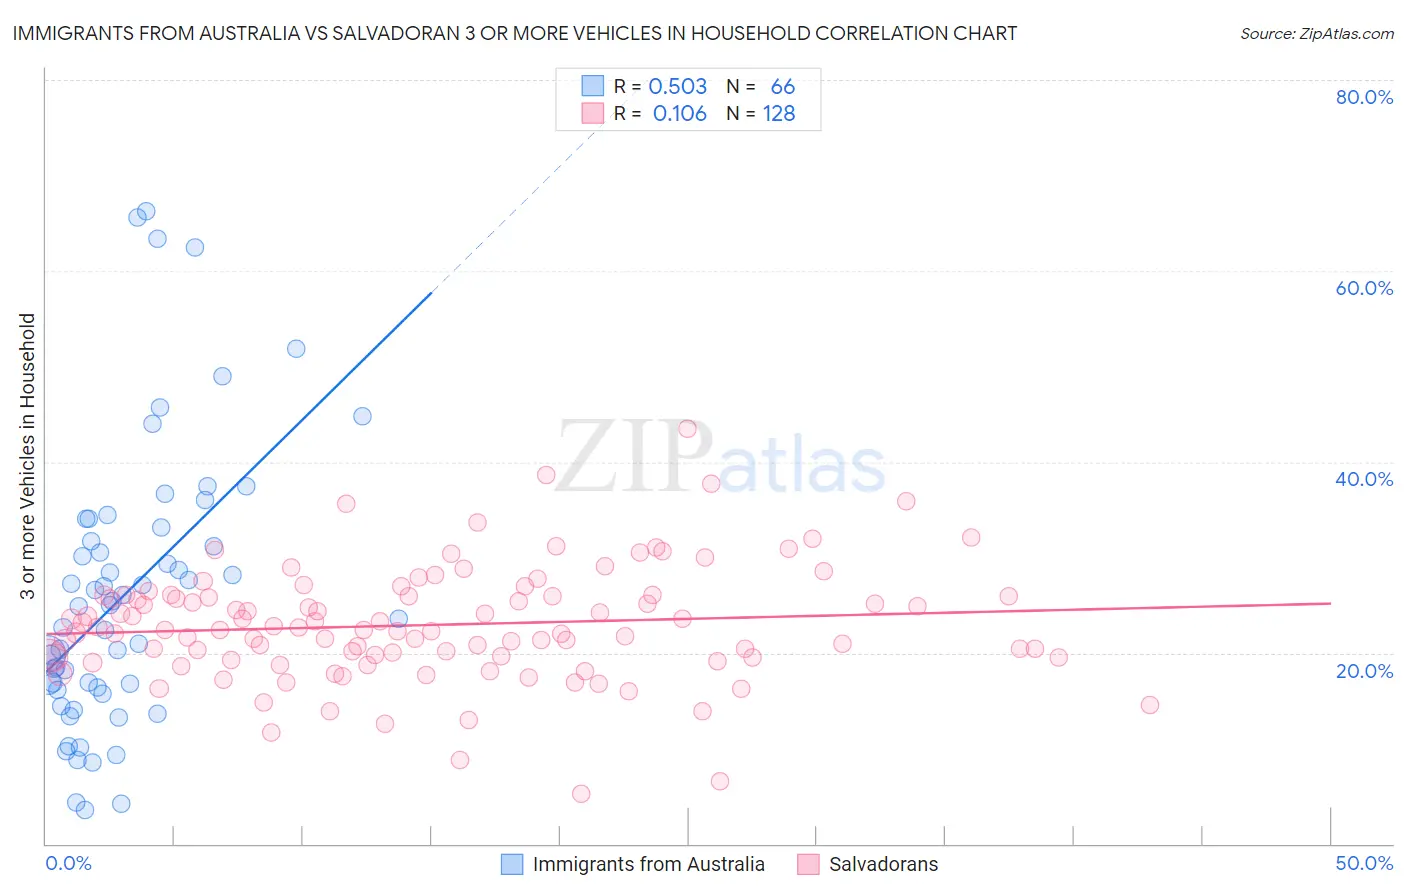
Immigrants from Australia vs Salvadoran 3 or more Vehicles in Household Correlation Chart
The statistical analysis conducted on geographies consisting of 227,053,605 people shows a substantial positive correlation between the proportion of Immigrants from Australia and percentage of households with 3 or more vehicles available in the United States with a correlation coefficient (R) of 0.503 and weighted average of 18.1%. Similarly, the statistical analysis conducted on geographies consisting of 398,656,904 people shows a poor positive correlation between the proportion of Salvadorans and percentage of households with 3 or more vehicles available in the United States with a correlation coefficient (R) of 0.106 and weighted average of 21.8%, a difference of 20.7%.
3 or more Vehicles in Household Correlation Summary
| Measurement | Immigrants from Australia | Salvadoran |
| Minimum | 3.6% | 5.3% |
| Maximum | 66.2% | 43.4% |
| Range | 62.7% | 38.2% |
| Mean | 26.2% | 22.9% |
| Median | 24.9% | 22.4% |
| Interquartile 25% (IQ1) | 16.4% | 19.6% |
| Interquartile 75% (IQ3) | 33.1% | 26.0% |
| Interquartile Range (IQR) | 16.7% | 6.4% |
| Standard Deviation (Sample) | 14.6% | 6.0% |
| Standard Deviation (Population) | 14.5% | 6.0% |
Similar Demographics by 3 or more Vehicles in Household
Demographics Similar to Immigrants from Australia by 3 or more Vehicles in Household
In terms of 3 or more vehicles in household, the demographic groups most similar to Immigrants from Australia are Immigrants from Belize (18.1%, a difference of 0.070%), Carpatho Rusyn (18.0%, a difference of 0.16%), Mongolian (18.1%, a difference of 0.23%), Immigrants from Eastern Africa (18.0%, a difference of 0.29%), and Immigrants from Europe (18.1%, a difference of 0.35%).
| Demographics | Rating | Rank | 3 or more Vehicles in Household |
| Immigrants | Middle Africa | 3.1 /100 | #239 | Tragic 18.2% |
| Immigrants | China | 2.9 /100 | #240 | Tragic 18.2% |
| Africans | 2.7 /100 | #241 | Tragic 18.2% |
| Hopi | 2.5 /100 | #242 | Tragic 18.2% |
| Immigrants | Europe | 2.4 /100 | #243 | Tragic 18.1% |
| Mongolians | 2.3 /100 | #244 | Tragic 18.1% |
| Immigrants | Belize | 2.1 /100 | #245 | Tragic 18.1% |
| Immigrants | Australia | 2.0 /100 | #246 | Tragic 18.1% |
| Carpatho Rusyns | 1.9 /100 | #247 | Tragic 18.0% |
| Immigrants | Eastern Africa | 1.8 /100 | #248 | Tragic 18.0% |
| Immigrants | Saudi Arabia | 1.7 /100 | #249 | Tragic 18.0% |
| Venezuelans | 1.7 /100 | #250 | Tragic 18.0% |
| Alsatians | 1.5 /100 | #251 | Tragic 18.0% |
| Immigrants | Southern Europe | 1.4 /100 | #252 | Tragic 17.9% |
| Immigrants | Ethiopia | 1.3 /100 | #253 | Tragic 17.9% |
Demographics Similar to Salvadorans by 3 or more Vehicles in Household
In terms of 3 or more vehicles in household, the demographic groups most similar to Salvadorans are Immigrants from Oceania (21.8%, a difference of 0.020%), Portuguese (21.8%, a difference of 0.090%), Japanese (21.8%, a difference of 0.12%), Nonimmigrants (21.8%, a difference of 0.16%), and Irish (21.8%, a difference of 0.24%).
| Demographics | Rating | Rank | 3 or more Vehicles in Household |
| Northern Europeans | 99.9 /100 | #66 | Exceptional 22.0% |
| Alaskan Athabascans | 99.9 /100 | #67 | Exceptional 21.9% |
| British | 99.9 /100 | #68 | Exceptional 21.9% |
| Creek | 99.9 /100 | #69 | Exceptional 21.9% |
| Bangladeshis | 99.8 /100 | #70 | Exceptional 21.9% |
| Potawatomi | 99.8 /100 | #71 | Exceptional 21.9% |
| Portuguese | 99.8 /100 | #72 | Exceptional 21.8% |
| Salvadorans | 99.8 /100 | #73 | Exceptional 21.8% |
| Immigrants | Oceania | 99.8 /100 | #74 | Exceptional 21.8% |
| Japanese | 99.8 /100 | #75 | Exceptional 21.8% |
| Immigrants | Nonimmigrants | 99.8 /100 | #76 | Exceptional 21.8% |
| Irish | 99.8 /100 | #77 | Exceptional 21.8% |
| Czechoslovakians | 99.8 /100 | #78 | Exceptional 21.7% |
| Assyrians/Chaldeans/Syriacs | 99.8 /100 | #79 | Exceptional 21.7% |
| Afghans | 99.7 /100 | #80 | Exceptional 21.7% |