Alaska Native vs Cherokee 3 or more Vehicles in Household
COMPARE
Alaska Native
Cherokee
3 or more Vehicles in Household
3 or more Vehicles in Household Comparison
Alaska Natives
Cherokee
21.0%
3 OR MORE VEHICLES IN HOUSEHOLD
98.2/ 100
METRIC RATING
99th/ 347
METRIC RANK
23.0%
3 OR MORE VEHICLES IN HOUSEHOLD
100.0/ 100
METRIC RATING
36th/ 347
METRIC RANK
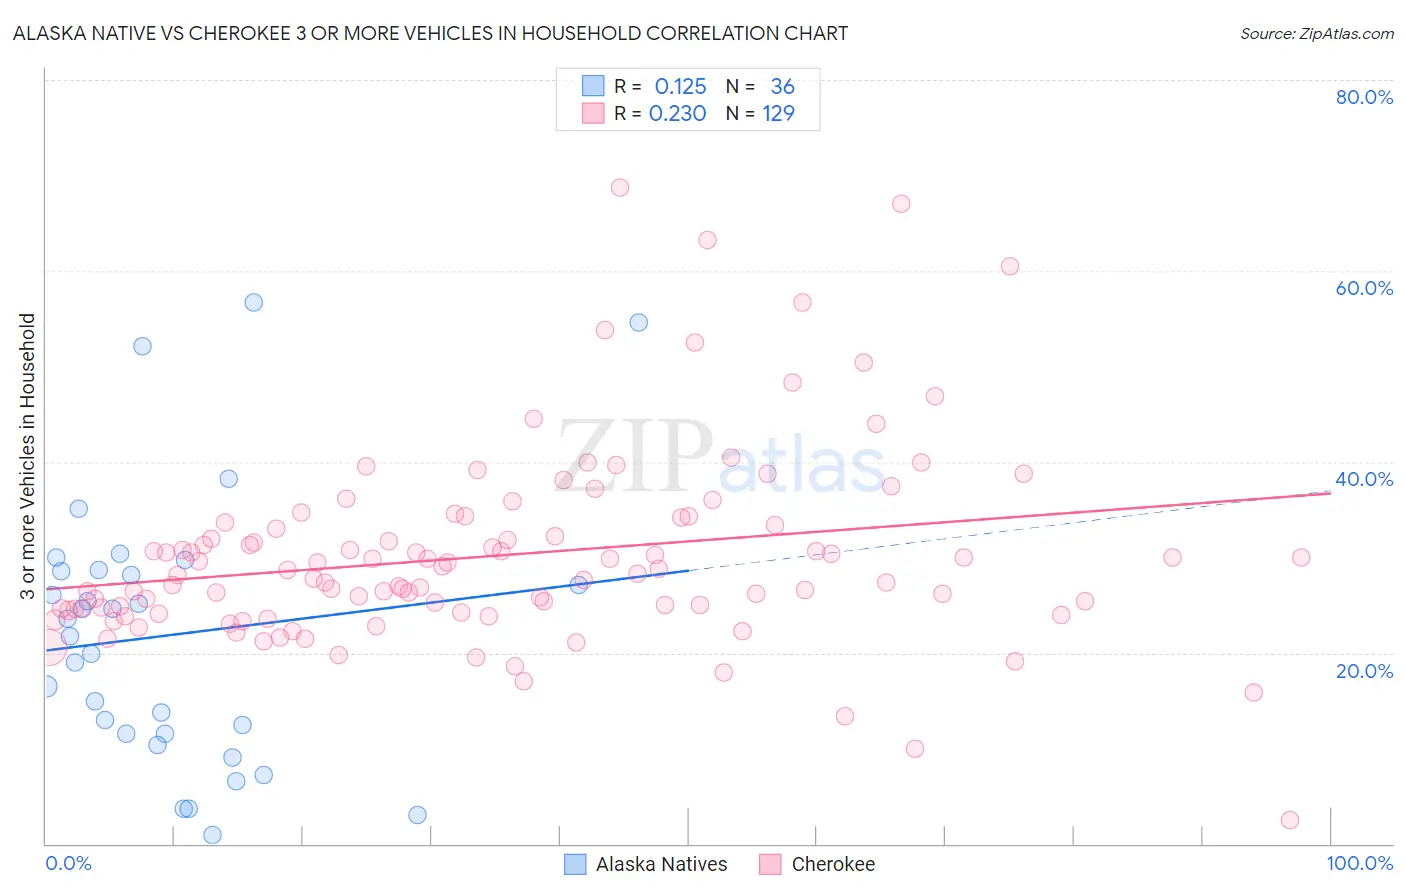
Alaska Native vs Cherokee 3 or more Vehicles in Household Correlation Chart
The statistical analysis conducted on geographies consisting of 76,712,110 people shows a poor positive correlation between the proportion of Alaska Natives and percentage of households with 3 or more vehicles available in the United States with a correlation coefficient (R) of 0.125 and weighted average of 21.0%. Similarly, the statistical analysis conducted on geographies consisting of 493,301,702 people shows a weak positive correlation between the proportion of Cherokee and percentage of households with 3 or more vehicles available in the United States with a correlation coefficient (R) of 0.230 and weighted average of 23.0%, a difference of 9.6%.
3 or more Vehicles in Household Correlation Summary
| Measurement | Alaska Native | Cherokee |
| Minimum | 0.90% | 2.4% |
| Maximum | 56.7% | 68.8% |
| Range | 55.8% | 66.3% |
| Mean | 21.9% | 30.2% |
| Median | 22.6% | 28.3% |
| Interquartile 25% (IQ1) | 11.5% | 24.5% |
| Interquartile 75% (IQ3) | 28.6% | 33.5% |
| Interquartile Range (IQR) | 17.1% | 9.0% |
| Standard Deviation (Sample) | 13.9% | 10.2% |
| Standard Deviation (Population) | 13.7% | 10.2% |
Similar Demographics by 3 or more Vehicles in Household
Demographics Similar to Alaska Natives by 3 or more Vehicles in Household
In terms of 3 or more vehicles in household, the demographic groups most similar to Alaska Natives are Hmong (21.0%, a difference of 0.0%), Comanche (21.0%, a difference of 0.040%), Canadian (21.0%, a difference of 0.060%), Cree (21.0%, a difference of 0.17%), and Pakistani (21.0%, a difference of 0.26%).
| Demographics | Rating | Rank | 3 or more Vehicles in Household |
| Apache | 98.9 /100 | #92 | Exceptional 21.2% |
| Immigrants | Indonesia | 98.8 /100 | #93 | Exceptional 21.1% |
| Immigrants | Cambodia | 98.6 /100 | #94 | Exceptional 21.1% |
| Pakistanis | 98.5 /100 | #95 | Exceptional 21.0% |
| Cree | 98.4 /100 | #96 | Exceptional 21.0% |
| Canadians | 98.3 /100 | #97 | Exceptional 21.0% |
| Hmong | 98.2 /100 | #98 | Exceptional 21.0% |
| Alaska Natives | 98.2 /100 | #99 | Exceptional 21.0% |
| Comanche | 98.2 /100 | #100 | Exceptional 21.0% |
| Blackfeet | 97.9 /100 | #101 | Exceptional 20.9% |
| Seminole | 97.8 /100 | #102 | Exceptional 20.9% |
| Dutch West Indians | 97.8 /100 | #103 | Exceptional 20.9% |
| Luxembourgers | 97.7 /100 | #104 | Exceptional 20.9% |
| Austrians | 97.5 /100 | #105 | Exceptional 20.9% |
| Bolivians | 97.4 /100 | #106 | Exceptional 20.8% |
Demographics Similar to Cherokee by 3 or more Vehicles in Household
In terms of 3 or more vehicles in household, the demographic groups most similar to Cherokee are Swedish (23.0%, a difference of 0.030%), Choctaw (23.0%, a difference of 0.040%), Swiss (23.0%, a difference of 0.060%), Spanish American (23.0%, a difference of 0.11%), and Pueblo (23.0%, a difference of 0.17%).
| Demographics | Rating | Rank | 3 or more Vehicles in Household |
| Spanish | 100.0 /100 | #29 | Exceptional 23.1% |
| Immigrants | South Eastern Asia | 100.0 /100 | #30 | Exceptional 23.1% |
| English | 100.0 /100 | #31 | Exceptional 23.1% |
| Pueblo | 100.0 /100 | #32 | Exceptional 23.0% |
| Spanish Americans | 100.0 /100 | #33 | Exceptional 23.0% |
| Swiss | 100.0 /100 | #34 | Exceptional 23.0% |
| Choctaw | 100.0 /100 | #35 | Exceptional 23.0% |
| Cherokee | 100.0 /100 | #36 | Exceptional 23.0% |
| Swedes | 100.0 /100 | #37 | Exceptional 23.0% |
| Dutch | 100.0 /100 | #38 | Exceptional 22.9% |
| Yaqui | 100.0 /100 | #39 | Exceptional 22.9% |
| Europeans | 100.0 /100 | #40 | Exceptional 22.9% |
| Germans | 100.0 /100 | #41 | Exceptional 22.7% |
| Natives/Alaskans | 100.0 /100 | #42 | Exceptional 22.7% |
| Osage | 100.0 /100 | #43 | Exceptional 22.7% |