Alaska Native vs Irish 3 or more Vehicles in Household
COMPARE
Alaska Native
Irish
3 or more Vehicles in Household
3 or more Vehicles in Household Comparison
Alaska Natives
Irish
21.0%
3 OR MORE VEHICLES IN HOUSEHOLD
98.2/ 100
METRIC RATING
99th/ 347
METRIC RANK
21.8%
3 OR MORE VEHICLES IN HOUSEHOLD
99.8/ 100
METRIC RATING
77th/ 347
METRIC RANK
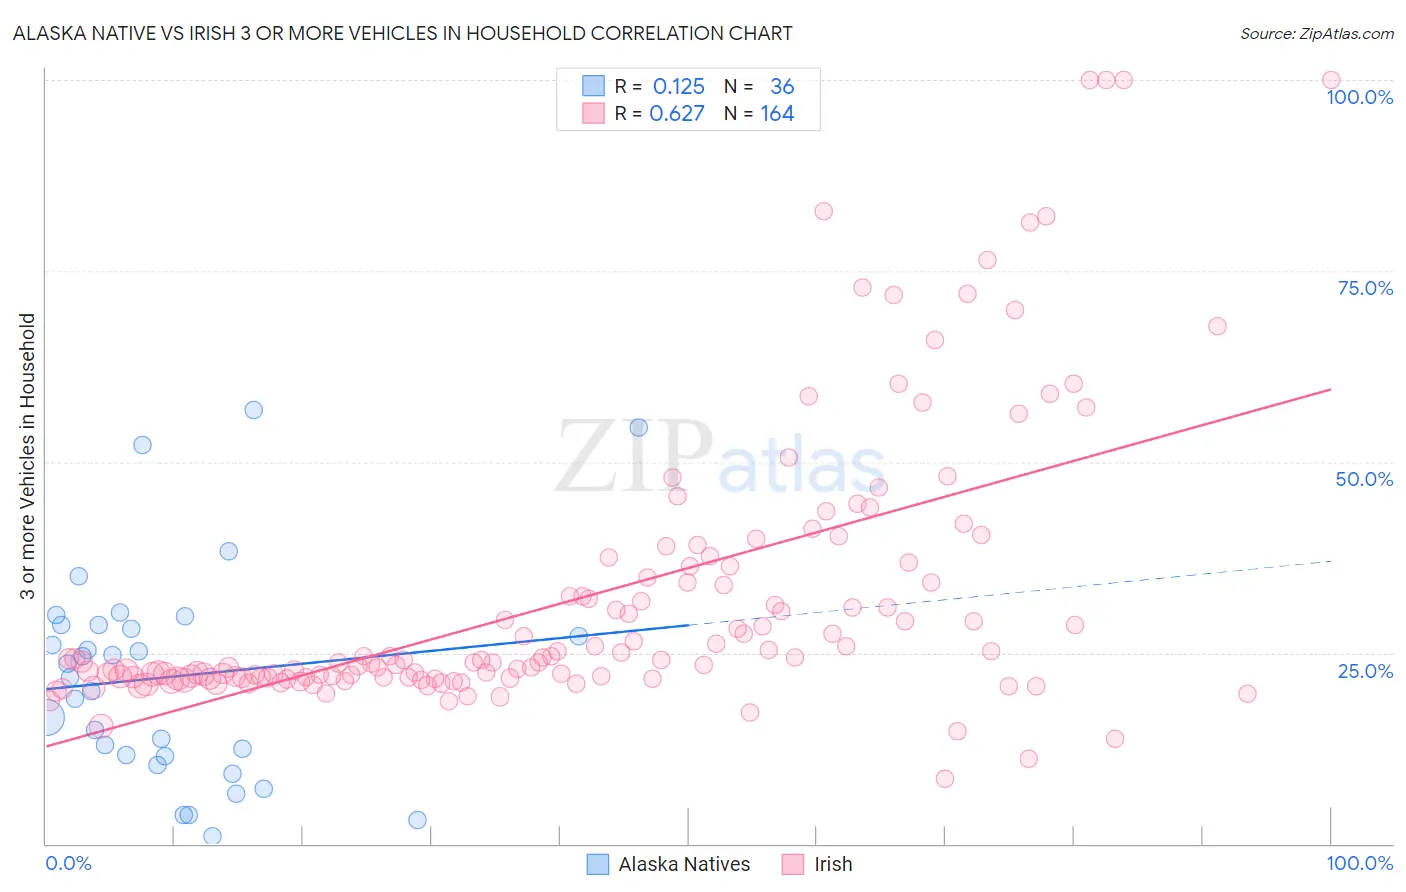
Alaska Native vs Irish 3 or more Vehicles in Household Correlation Chart
The statistical analysis conducted on geographies consisting of 76,712,110 people shows a poor positive correlation between the proportion of Alaska Natives and percentage of households with 3 or more vehicles available in the United States with a correlation coefficient (R) of 0.125 and weighted average of 21.0%. Similarly, the statistical analysis conducted on geographies consisting of 579,597,686 people shows a significant positive correlation between the proportion of Irish and percentage of households with 3 or more vehicles available in the United States with a correlation coefficient (R) of 0.627 and weighted average of 21.8%, a difference of 3.7%.
3 or more Vehicles in Household Correlation Summary
| Measurement | Alaska Native | Irish |
| Minimum | 0.90% | 8.5% |
| Maximum | 56.7% | 100.0% |
| Range | 55.8% | 91.5% |
| Mean | 21.9% | 32.2% |
| Median | 22.6% | 23.9% |
| Interquartile 25% (IQ1) | 11.5% | 21.8% |
| Interquartile 75% (IQ3) | 28.6% | 35.6% |
| Interquartile Range (IQR) | 17.1% | 13.8% |
| Standard Deviation (Sample) | 13.9% | 18.4% |
| Standard Deviation (Population) | 13.7% | 18.3% |
Similar Demographics by 3 or more Vehicles in Household
Demographics Similar to Alaska Natives by 3 or more Vehicles in Household
In terms of 3 or more vehicles in household, the demographic groups most similar to Alaska Natives are Hmong (21.0%, a difference of 0.0%), Comanche (21.0%, a difference of 0.040%), Canadian (21.0%, a difference of 0.060%), Cree (21.0%, a difference of 0.17%), and Pakistani (21.0%, a difference of 0.26%).
| Demographics | Rating | Rank | 3 or more Vehicles in Household |
| Apache | 98.9 /100 | #92 | Exceptional 21.2% |
| Immigrants | Indonesia | 98.8 /100 | #93 | Exceptional 21.1% |
| Immigrants | Cambodia | 98.6 /100 | #94 | Exceptional 21.1% |
| Pakistanis | 98.5 /100 | #95 | Exceptional 21.0% |
| Cree | 98.4 /100 | #96 | Exceptional 21.0% |
| Canadians | 98.3 /100 | #97 | Exceptional 21.0% |
| Hmong | 98.2 /100 | #98 | Exceptional 21.0% |
| Alaska Natives | 98.2 /100 | #99 | Exceptional 21.0% |
| Comanche | 98.2 /100 | #100 | Exceptional 21.0% |
| Blackfeet | 97.9 /100 | #101 | Exceptional 20.9% |
| Seminole | 97.8 /100 | #102 | Exceptional 20.9% |
| Dutch West Indians | 97.8 /100 | #103 | Exceptional 20.9% |
| Luxembourgers | 97.7 /100 | #104 | Exceptional 20.9% |
| Austrians | 97.5 /100 | #105 | Exceptional 20.9% |
| Bolivians | 97.4 /100 | #106 | Exceptional 20.8% |
Demographics Similar to Irish by 3 or more Vehicles in Household
In terms of 3 or more vehicles in household, the demographic groups most similar to Irish are Nonimmigrants (21.8%, a difference of 0.070%), Japanese (21.8%, a difference of 0.12%), Czechoslovakian (21.7%, a difference of 0.13%), Assyrian/Chaldean/Syriac (21.7%, a difference of 0.13%), and Immigrants from Oceania (21.8%, a difference of 0.22%).
| Demographics | Rating | Rank | 3 or more Vehicles in Household |
| Bangladeshis | 99.8 /100 | #70 | Exceptional 21.9% |
| Potawatomi | 99.8 /100 | #71 | Exceptional 21.9% |
| Portuguese | 99.8 /100 | #72 | Exceptional 21.8% |
| Salvadorans | 99.8 /100 | #73 | Exceptional 21.8% |
| Immigrants | Oceania | 99.8 /100 | #74 | Exceptional 21.8% |
| Japanese | 99.8 /100 | #75 | Exceptional 21.8% |
| Immigrants | Nonimmigrants | 99.8 /100 | #76 | Exceptional 21.8% |
| Irish | 99.8 /100 | #77 | Exceptional 21.8% |
| Czechoslovakians | 99.8 /100 | #78 | Exceptional 21.7% |
| Assyrians/Chaldeans/Syriacs | 99.8 /100 | #79 | Exceptional 21.7% |
| Afghans | 99.7 /100 | #80 | Exceptional 21.7% |
| Celtics | 99.7 /100 | #81 | Exceptional 21.7% |
| Immigrants | El Salvador | 99.6 /100 | #82 | Exceptional 21.5% |
| Chippewa | 99.6 /100 | #83 | Exceptional 21.5% |
| Icelanders | 99.6 /100 | #84 | Exceptional 21.5% |