Alaska Native vs Immigrants from Australia 3 or more Vehicles in Household
COMPARE
Alaska Native
Immigrants from Australia
3 or more Vehicles in Household
3 or more Vehicles in Household Comparison
Alaska Natives
Immigrants from Australia
21.0%
3 OR MORE VEHICLES IN HOUSEHOLD
98.2/ 100
METRIC RATING
99th/ 347
METRIC RANK
18.1%
3 OR MORE VEHICLES IN HOUSEHOLD
2.0/ 100
METRIC RATING
246th/ 347
METRIC RANK
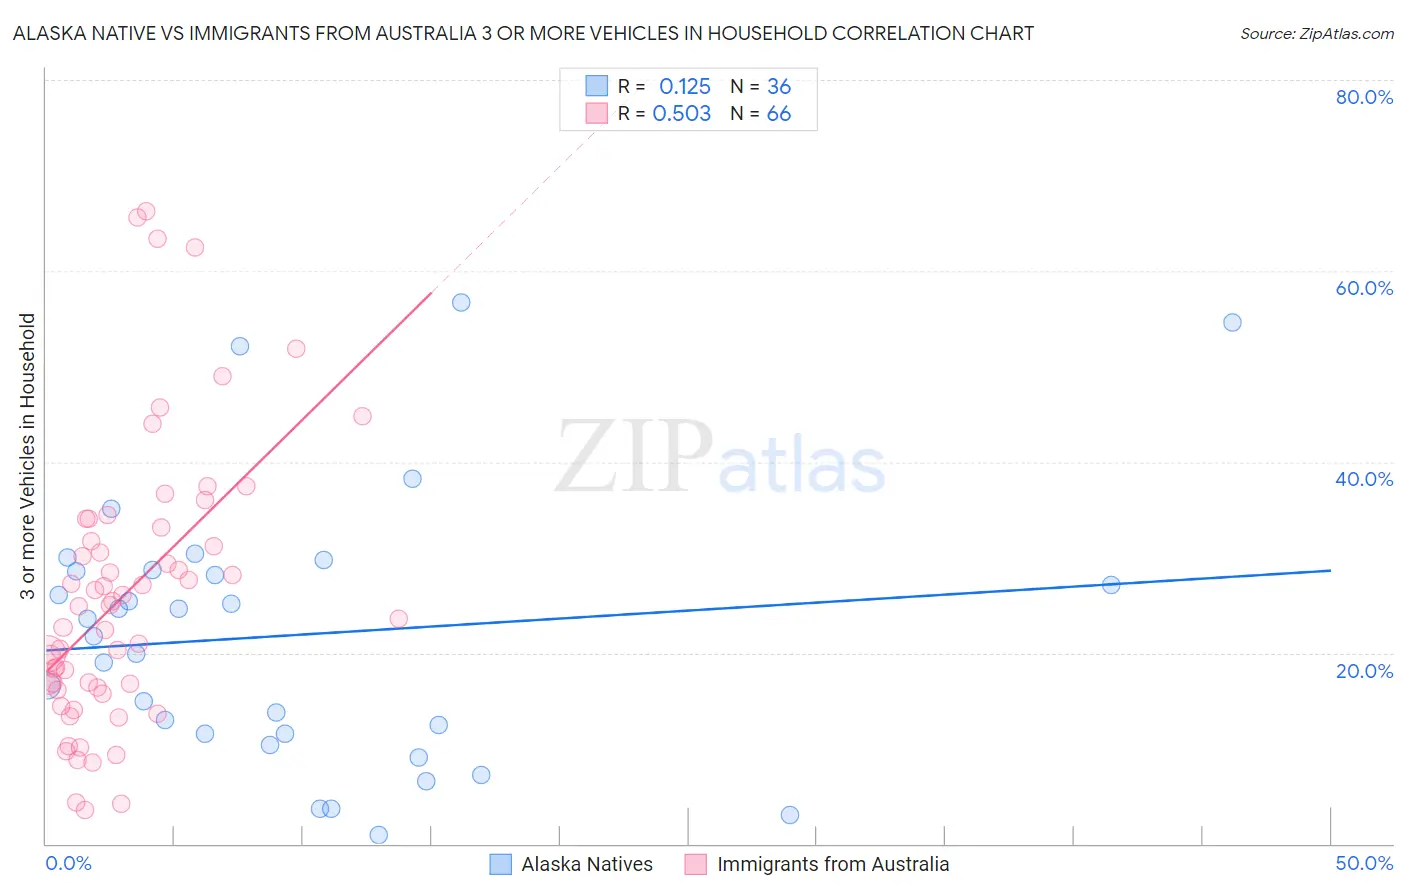
Alaska Native vs Immigrants from Australia 3 or more Vehicles in Household Correlation Chart
The statistical analysis conducted on geographies consisting of 76,712,110 people shows a poor positive correlation between the proportion of Alaska Natives and percentage of households with 3 or more vehicles available in the United States with a correlation coefficient (R) of 0.125 and weighted average of 21.0%. Similarly, the statistical analysis conducted on geographies consisting of 227,053,605 people shows a substantial positive correlation between the proportion of Immigrants from Australia and percentage of households with 3 or more vehicles available in the United States with a correlation coefficient (R) of 0.503 and weighted average of 18.1%, a difference of 16.1%.
3 or more Vehicles in Household Correlation Summary
| Measurement | Alaska Native | Immigrants from Australia |
| Minimum | 0.90% | 3.6% |
| Maximum | 56.7% | 66.2% |
| Range | 55.8% | 62.7% |
| Mean | 21.9% | 26.2% |
| Median | 22.6% | 24.9% |
| Interquartile 25% (IQ1) | 11.5% | 16.4% |
| Interquartile 75% (IQ3) | 28.6% | 33.1% |
| Interquartile Range (IQR) | 17.1% | 16.7% |
| Standard Deviation (Sample) | 13.9% | 14.6% |
| Standard Deviation (Population) | 13.7% | 14.5% |
Similar Demographics by 3 or more Vehicles in Household
Demographics Similar to Alaska Natives by 3 or more Vehicles in Household
In terms of 3 or more vehicles in household, the demographic groups most similar to Alaska Natives are Hmong (21.0%, a difference of 0.0%), Comanche (21.0%, a difference of 0.040%), Canadian (21.0%, a difference of 0.060%), Cree (21.0%, a difference of 0.17%), and Pakistani (21.0%, a difference of 0.26%).
| Demographics | Rating | Rank | 3 or more Vehicles in Household |
| Apache | 98.9 /100 | #92 | Exceptional 21.2% |
| Immigrants | Indonesia | 98.8 /100 | #93 | Exceptional 21.1% |
| Immigrants | Cambodia | 98.6 /100 | #94 | Exceptional 21.1% |
| Pakistanis | 98.5 /100 | #95 | Exceptional 21.0% |
| Cree | 98.4 /100 | #96 | Exceptional 21.0% |
| Canadians | 98.3 /100 | #97 | Exceptional 21.0% |
| Hmong | 98.2 /100 | #98 | Exceptional 21.0% |
| Alaska Natives | 98.2 /100 | #99 | Exceptional 21.0% |
| Comanche | 98.2 /100 | #100 | Exceptional 21.0% |
| Blackfeet | 97.9 /100 | #101 | Exceptional 20.9% |
| Seminole | 97.8 /100 | #102 | Exceptional 20.9% |
| Dutch West Indians | 97.8 /100 | #103 | Exceptional 20.9% |
| Luxembourgers | 97.7 /100 | #104 | Exceptional 20.9% |
| Austrians | 97.5 /100 | #105 | Exceptional 20.9% |
| Bolivians | 97.4 /100 | #106 | Exceptional 20.8% |
Demographics Similar to Immigrants from Australia by 3 or more Vehicles in Household
In terms of 3 or more vehicles in household, the demographic groups most similar to Immigrants from Australia are Immigrants from Belize (18.1%, a difference of 0.070%), Carpatho Rusyn (18.0%, a difference of 0.16%), Mongolian (18.1%, a difference of 0.23%), Immigrants from Eastern Africa (18.0%, a difference of 0.29%), and Immigrants from Europe (18.1%, a difference of 0.35%).
| Demographics | Rating | Rank | 3 or more Vehicles in Household |
| Immigrants | Middle Africa | 3.1 /100 | #239 | Tragic 18.2% |
| Immigrants | China | 2.9 /100 | #240 | Tragic 18.2% |
| Africans | 2.7 /100 | #241 | Tragic 18.2% |
| Hopi | 2.5 /100 | #242 | Tragic 18.2% |
| Immigrants | Europe | 2.4 /100 | #243 | Tragic 18.1% |
| Mongolians | 2.3 /100 | #244 | Tragic 18.1% |
| Immigrants | Belize | 2.1 /100 | #245 | Tragic 18.1% |
| Immigrants | Australia | 2.0 /100 | #246 | Tragic 18.1% |
| Carpatho Rusyns | 1.9 /100 | #247 | Tragic 18.0% |
| Immigrants | Eastern Africa | 1.8 /100 | #248 | Tragic 18.0% |
| Immigrants | Saudi Arabia | 1.7 /100 | #249 | Tragic 18.0% |
| Venezuelans | 1.7 /100 | #250 | Tragic 18.0% |
| Alsatians | 1.5 /100 | #251 | Tragic 18.0% |
| Immigrants | Southern Europe | 1.4 /100 | #252 | Tragic 17.9% |
| Immigrants | Ethiopia | 1.3 /100 | #253 | Tragic 17.9% |